J. Oberling, R. Crouch, T. Guidry
Update on FARO progress so far. Warning, incoming wall of text.
There have been issues accurately aligning to the LHO global coordinate system to the accuracy necessary for IAS work, specifically in getting good alignment to the global Z axis. This is somewhat of a repeat of the struggles when prepping the FARO for the FCT (Filter Cavity Tube) install work; while we were able to get an alignment good enough to be well within the FCT installation tolerances, the tolerances for optic alignment are more stringent (+/-1.0 mm positional tolerance) so we have to get a better alignment to our global coordinate system. To date we have worked in 2 areas: aligning to the global coordinate system, and accurately moving the FARO around the West Bay. For reference, monument name and coordinate information can be found on the DCC at D1100291.
Global Coordinate System Alignment
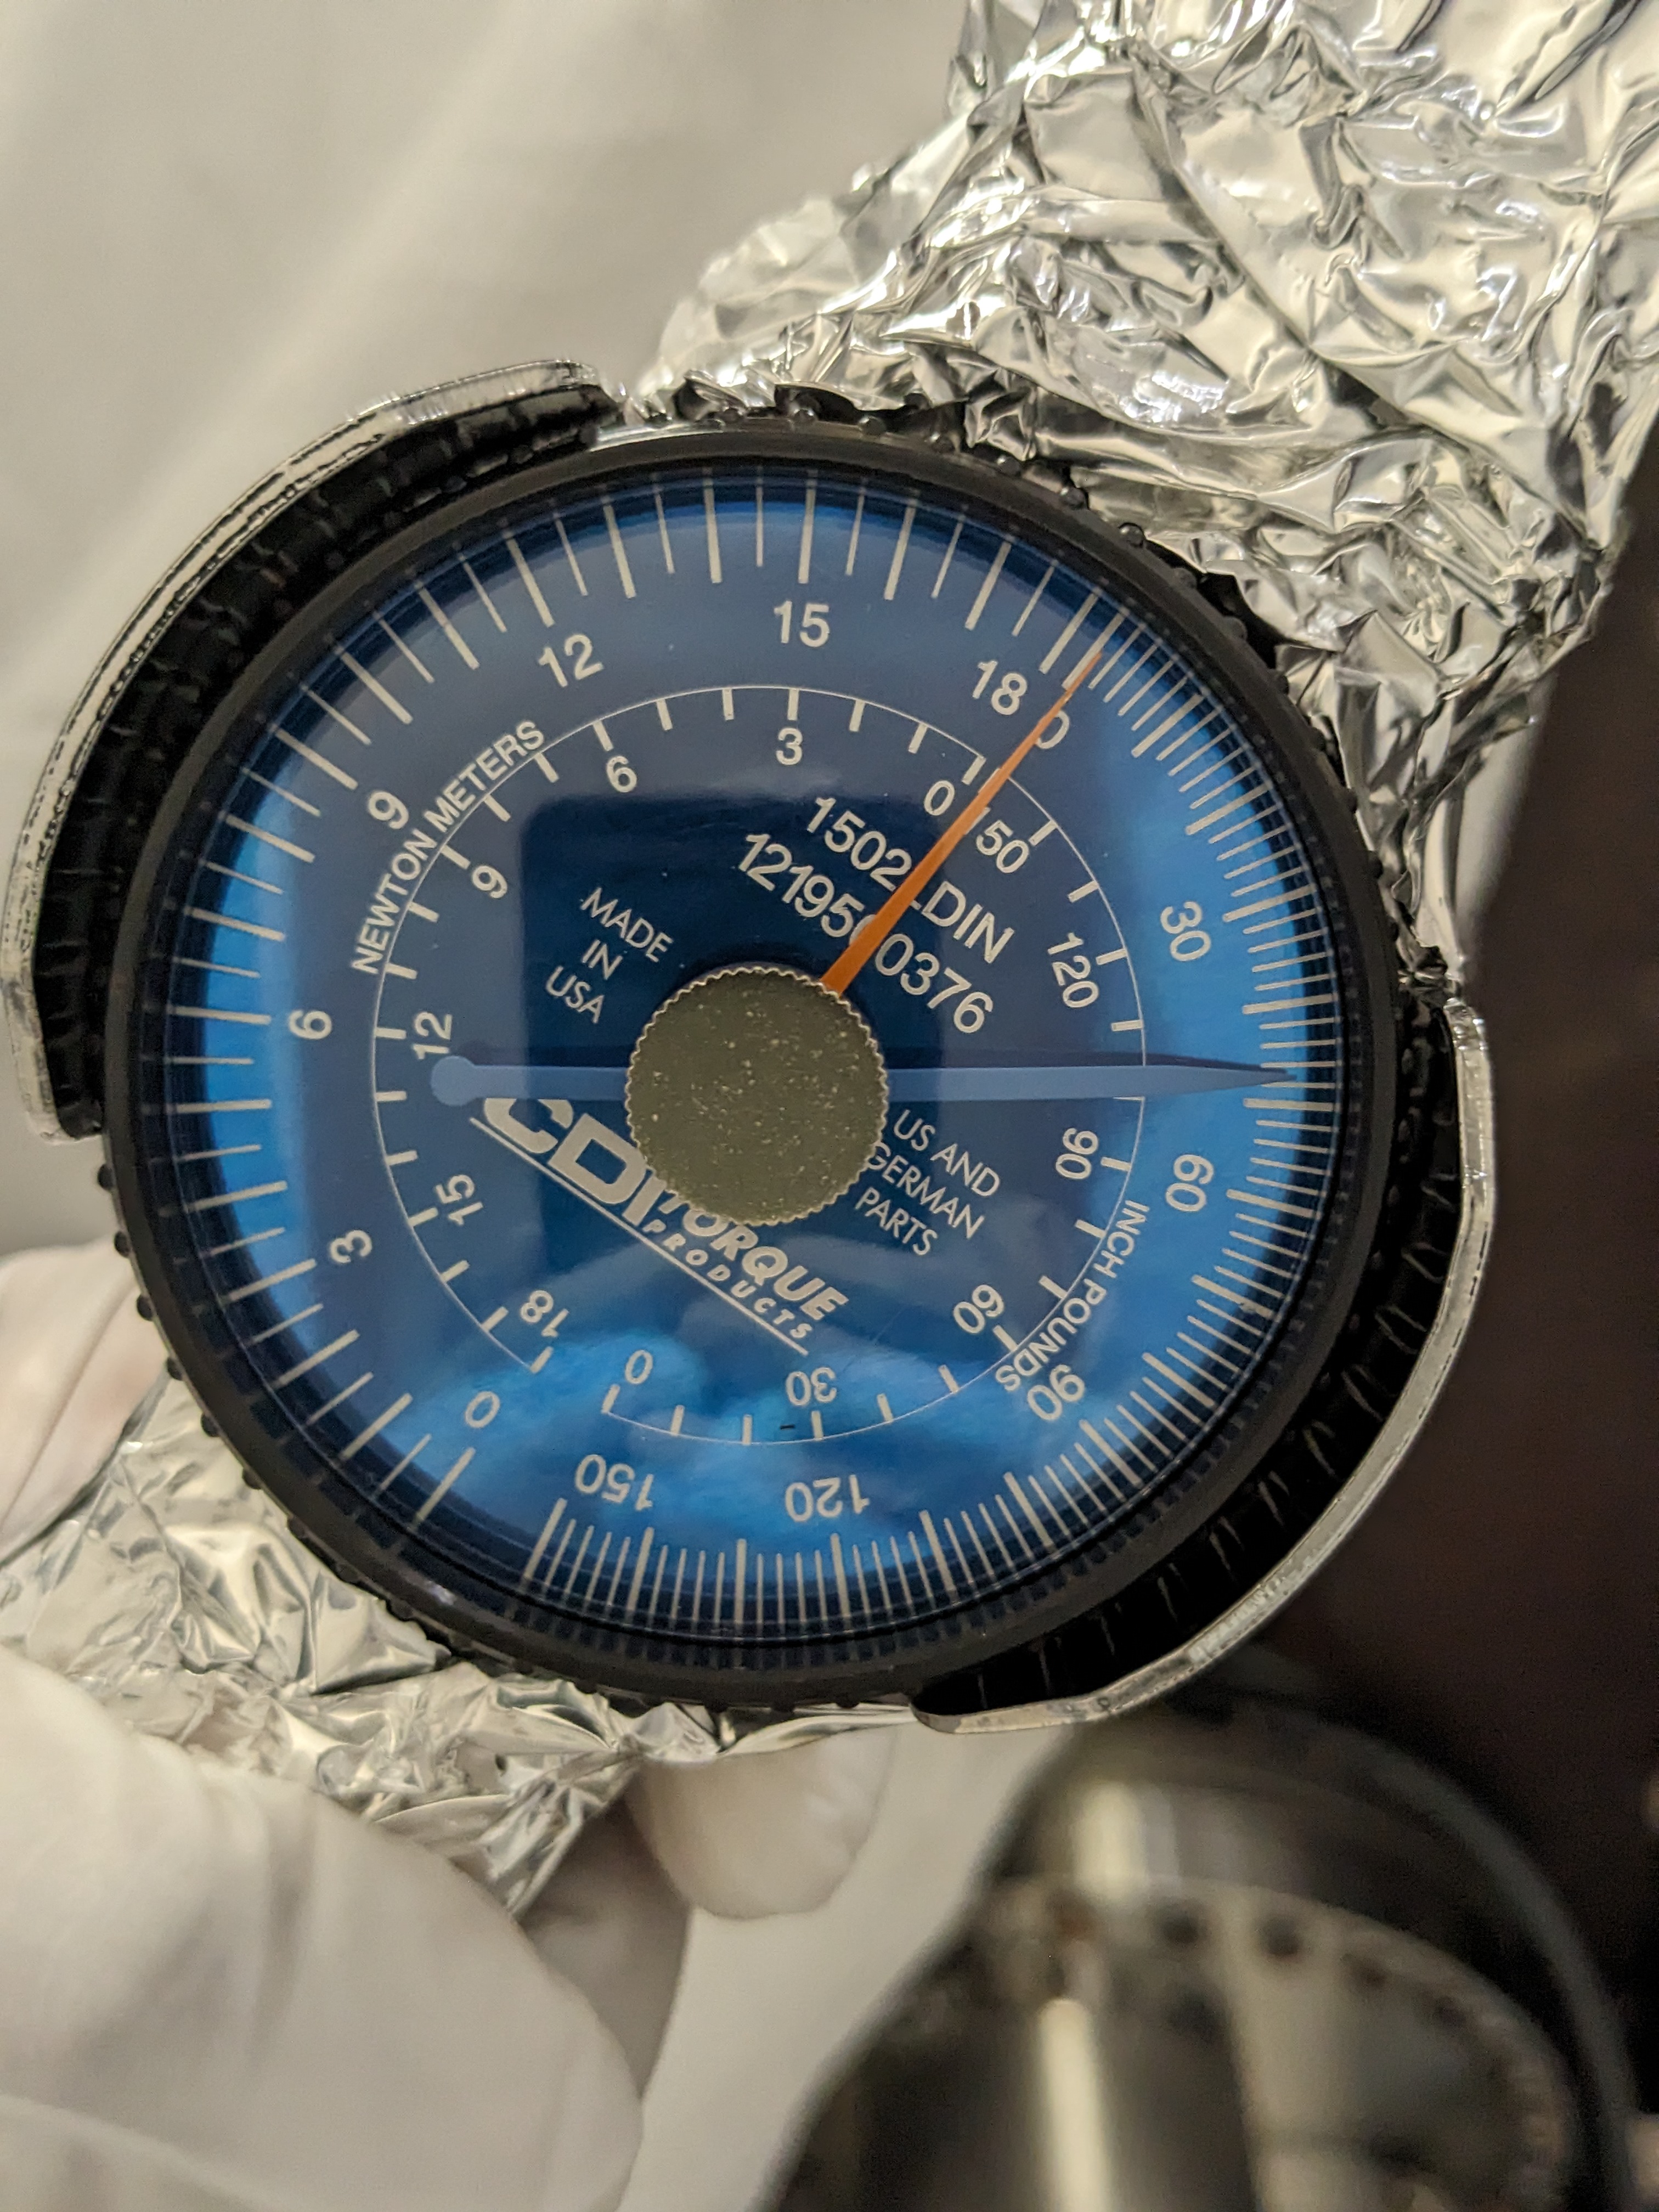
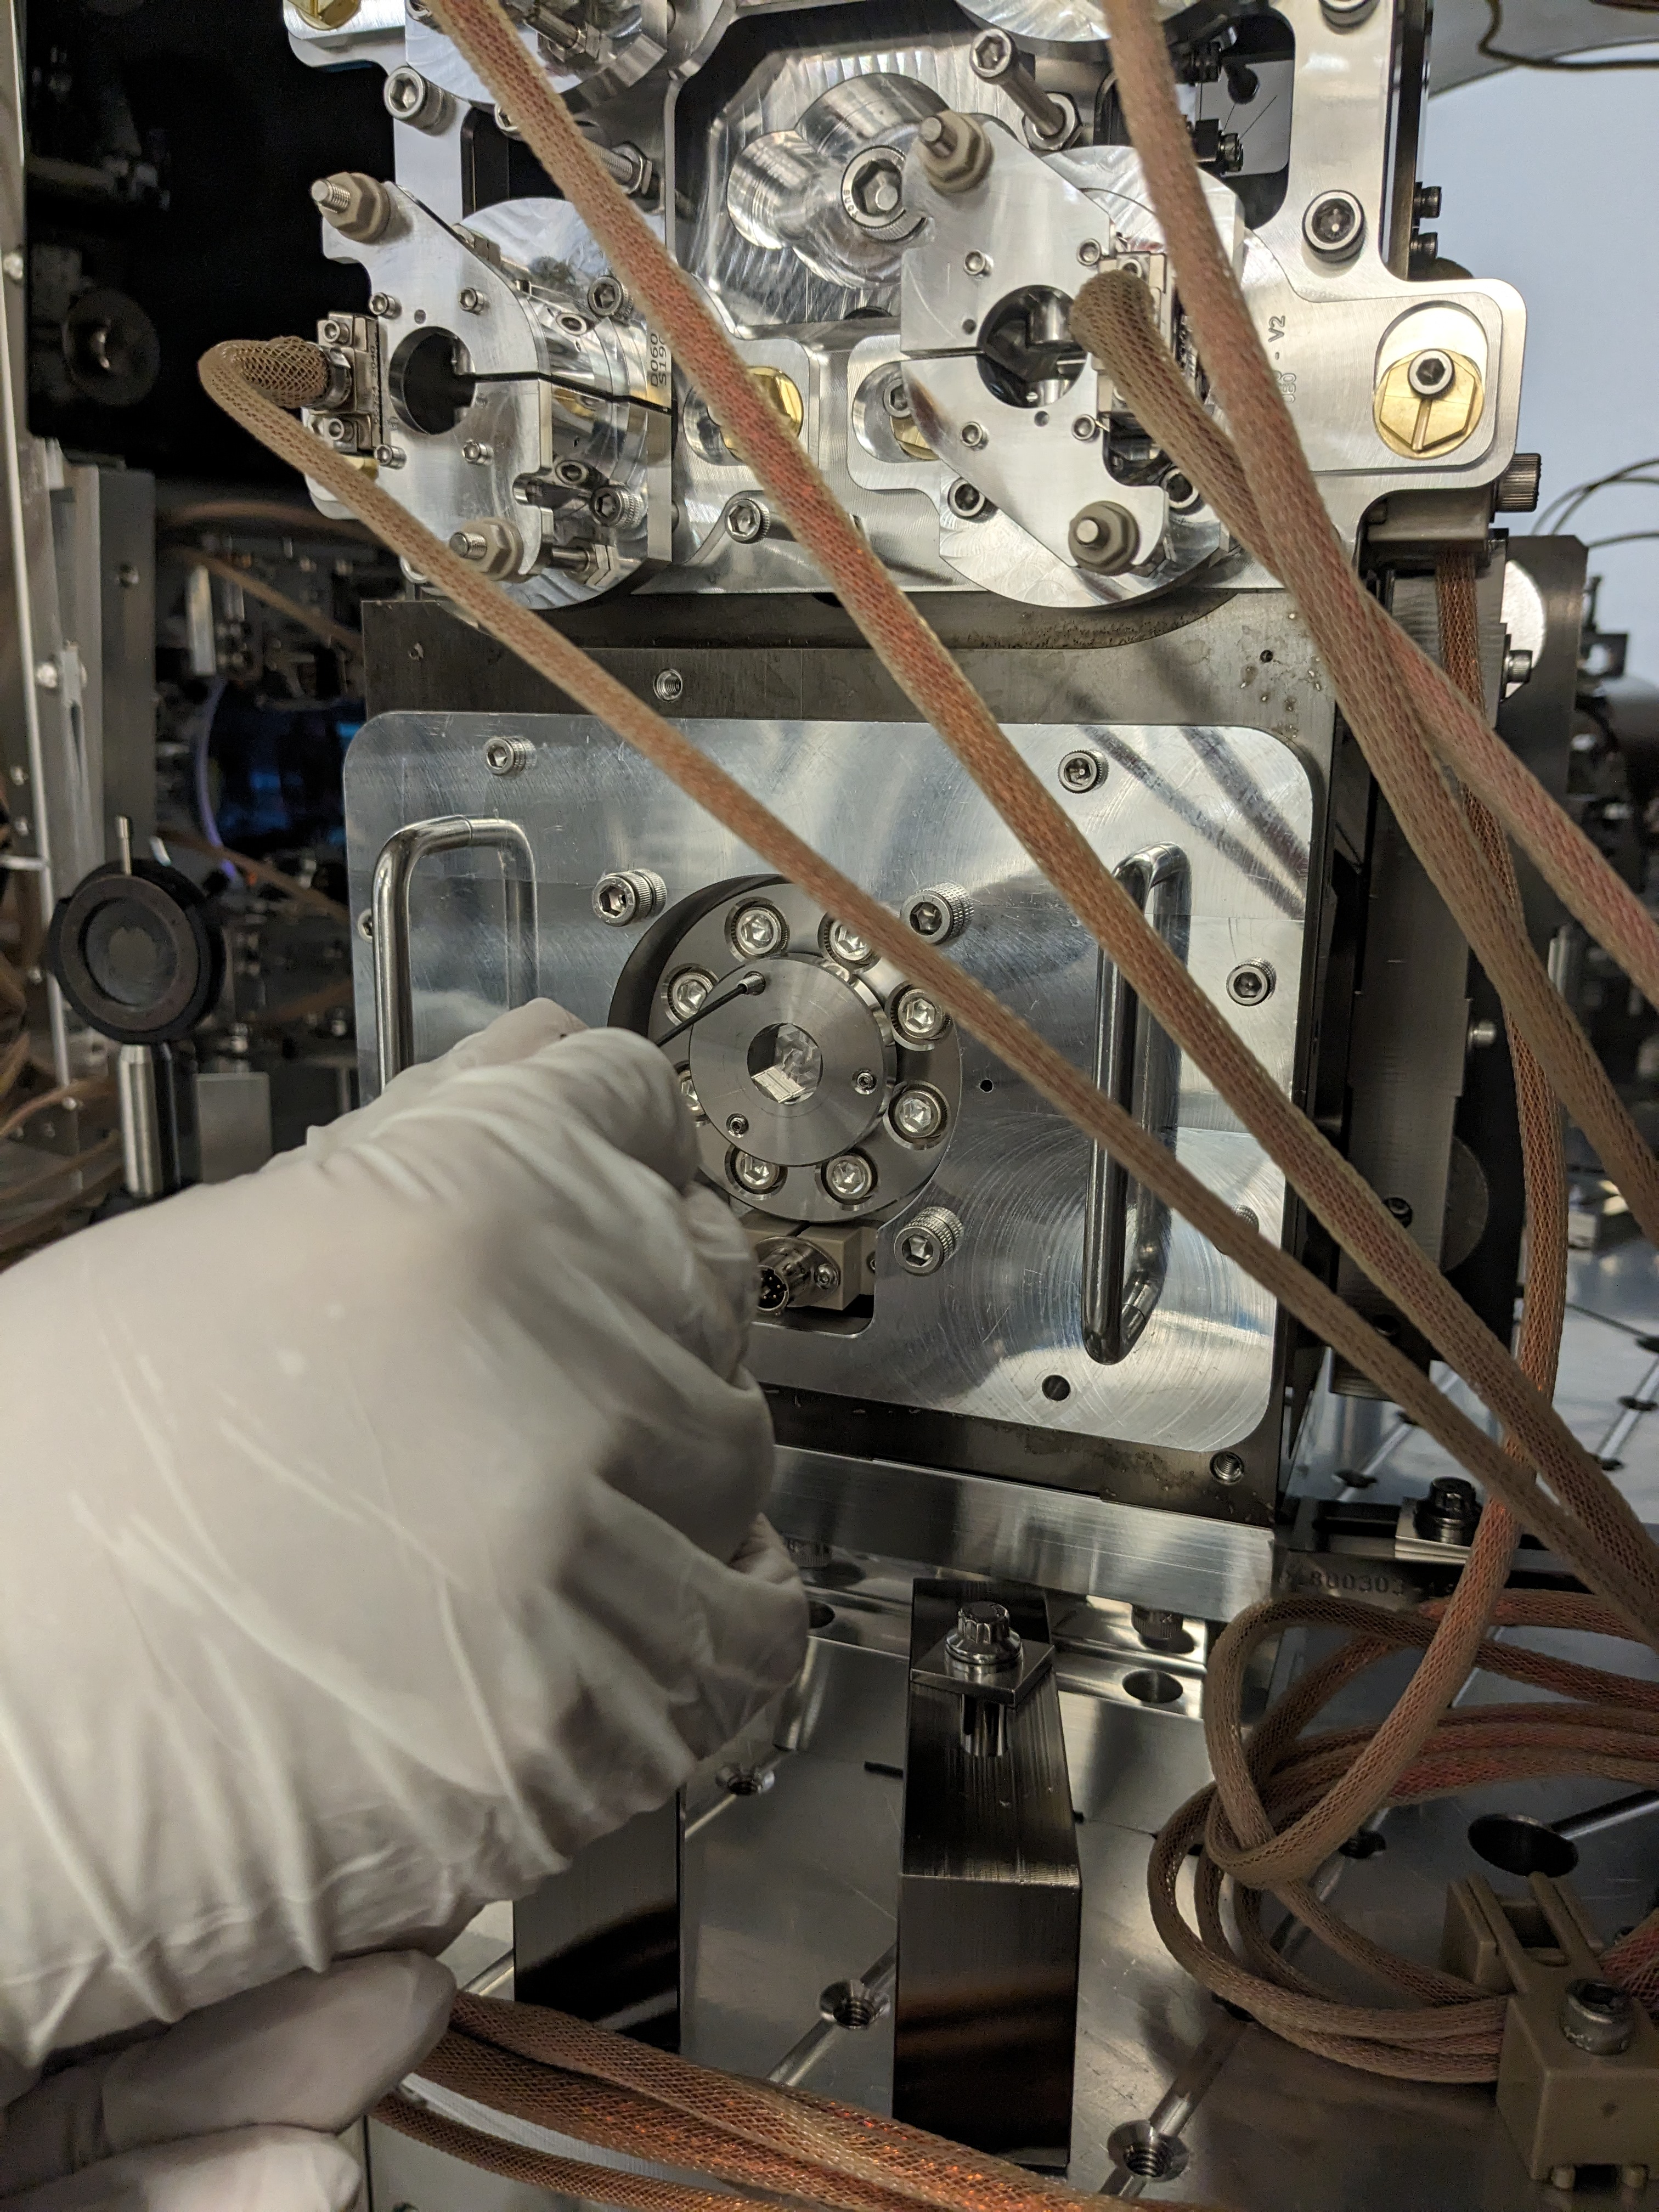
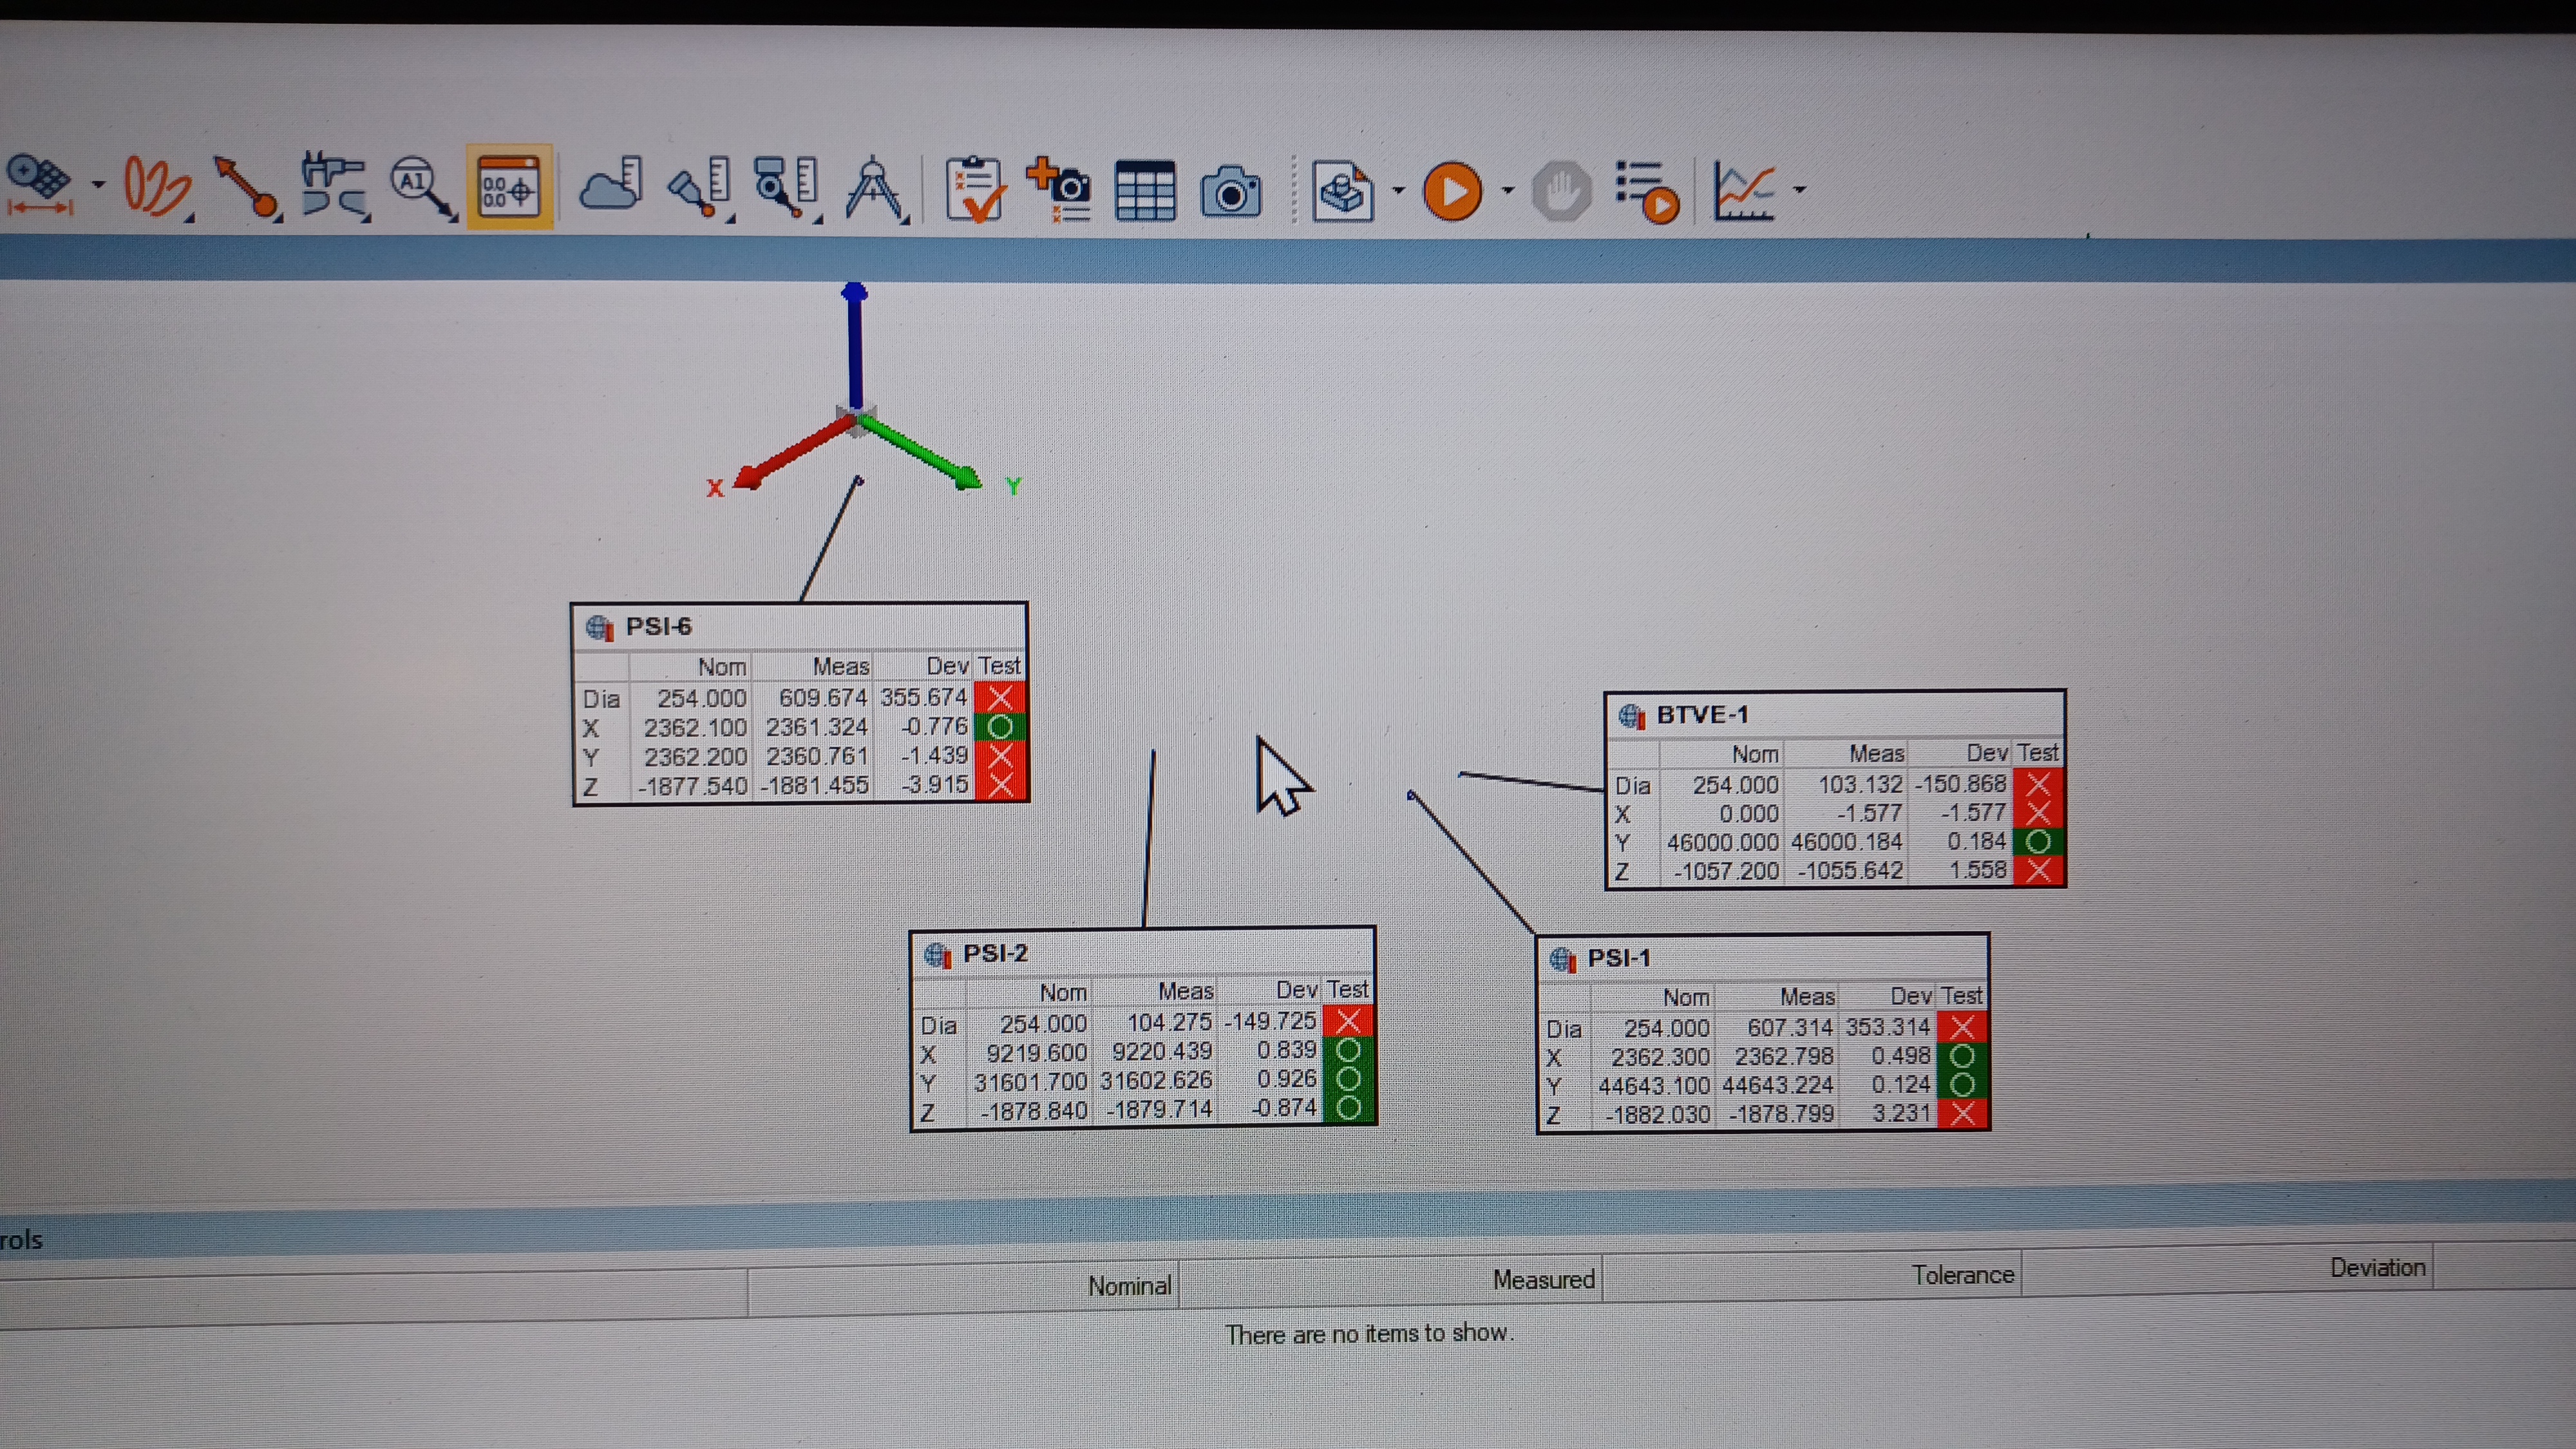
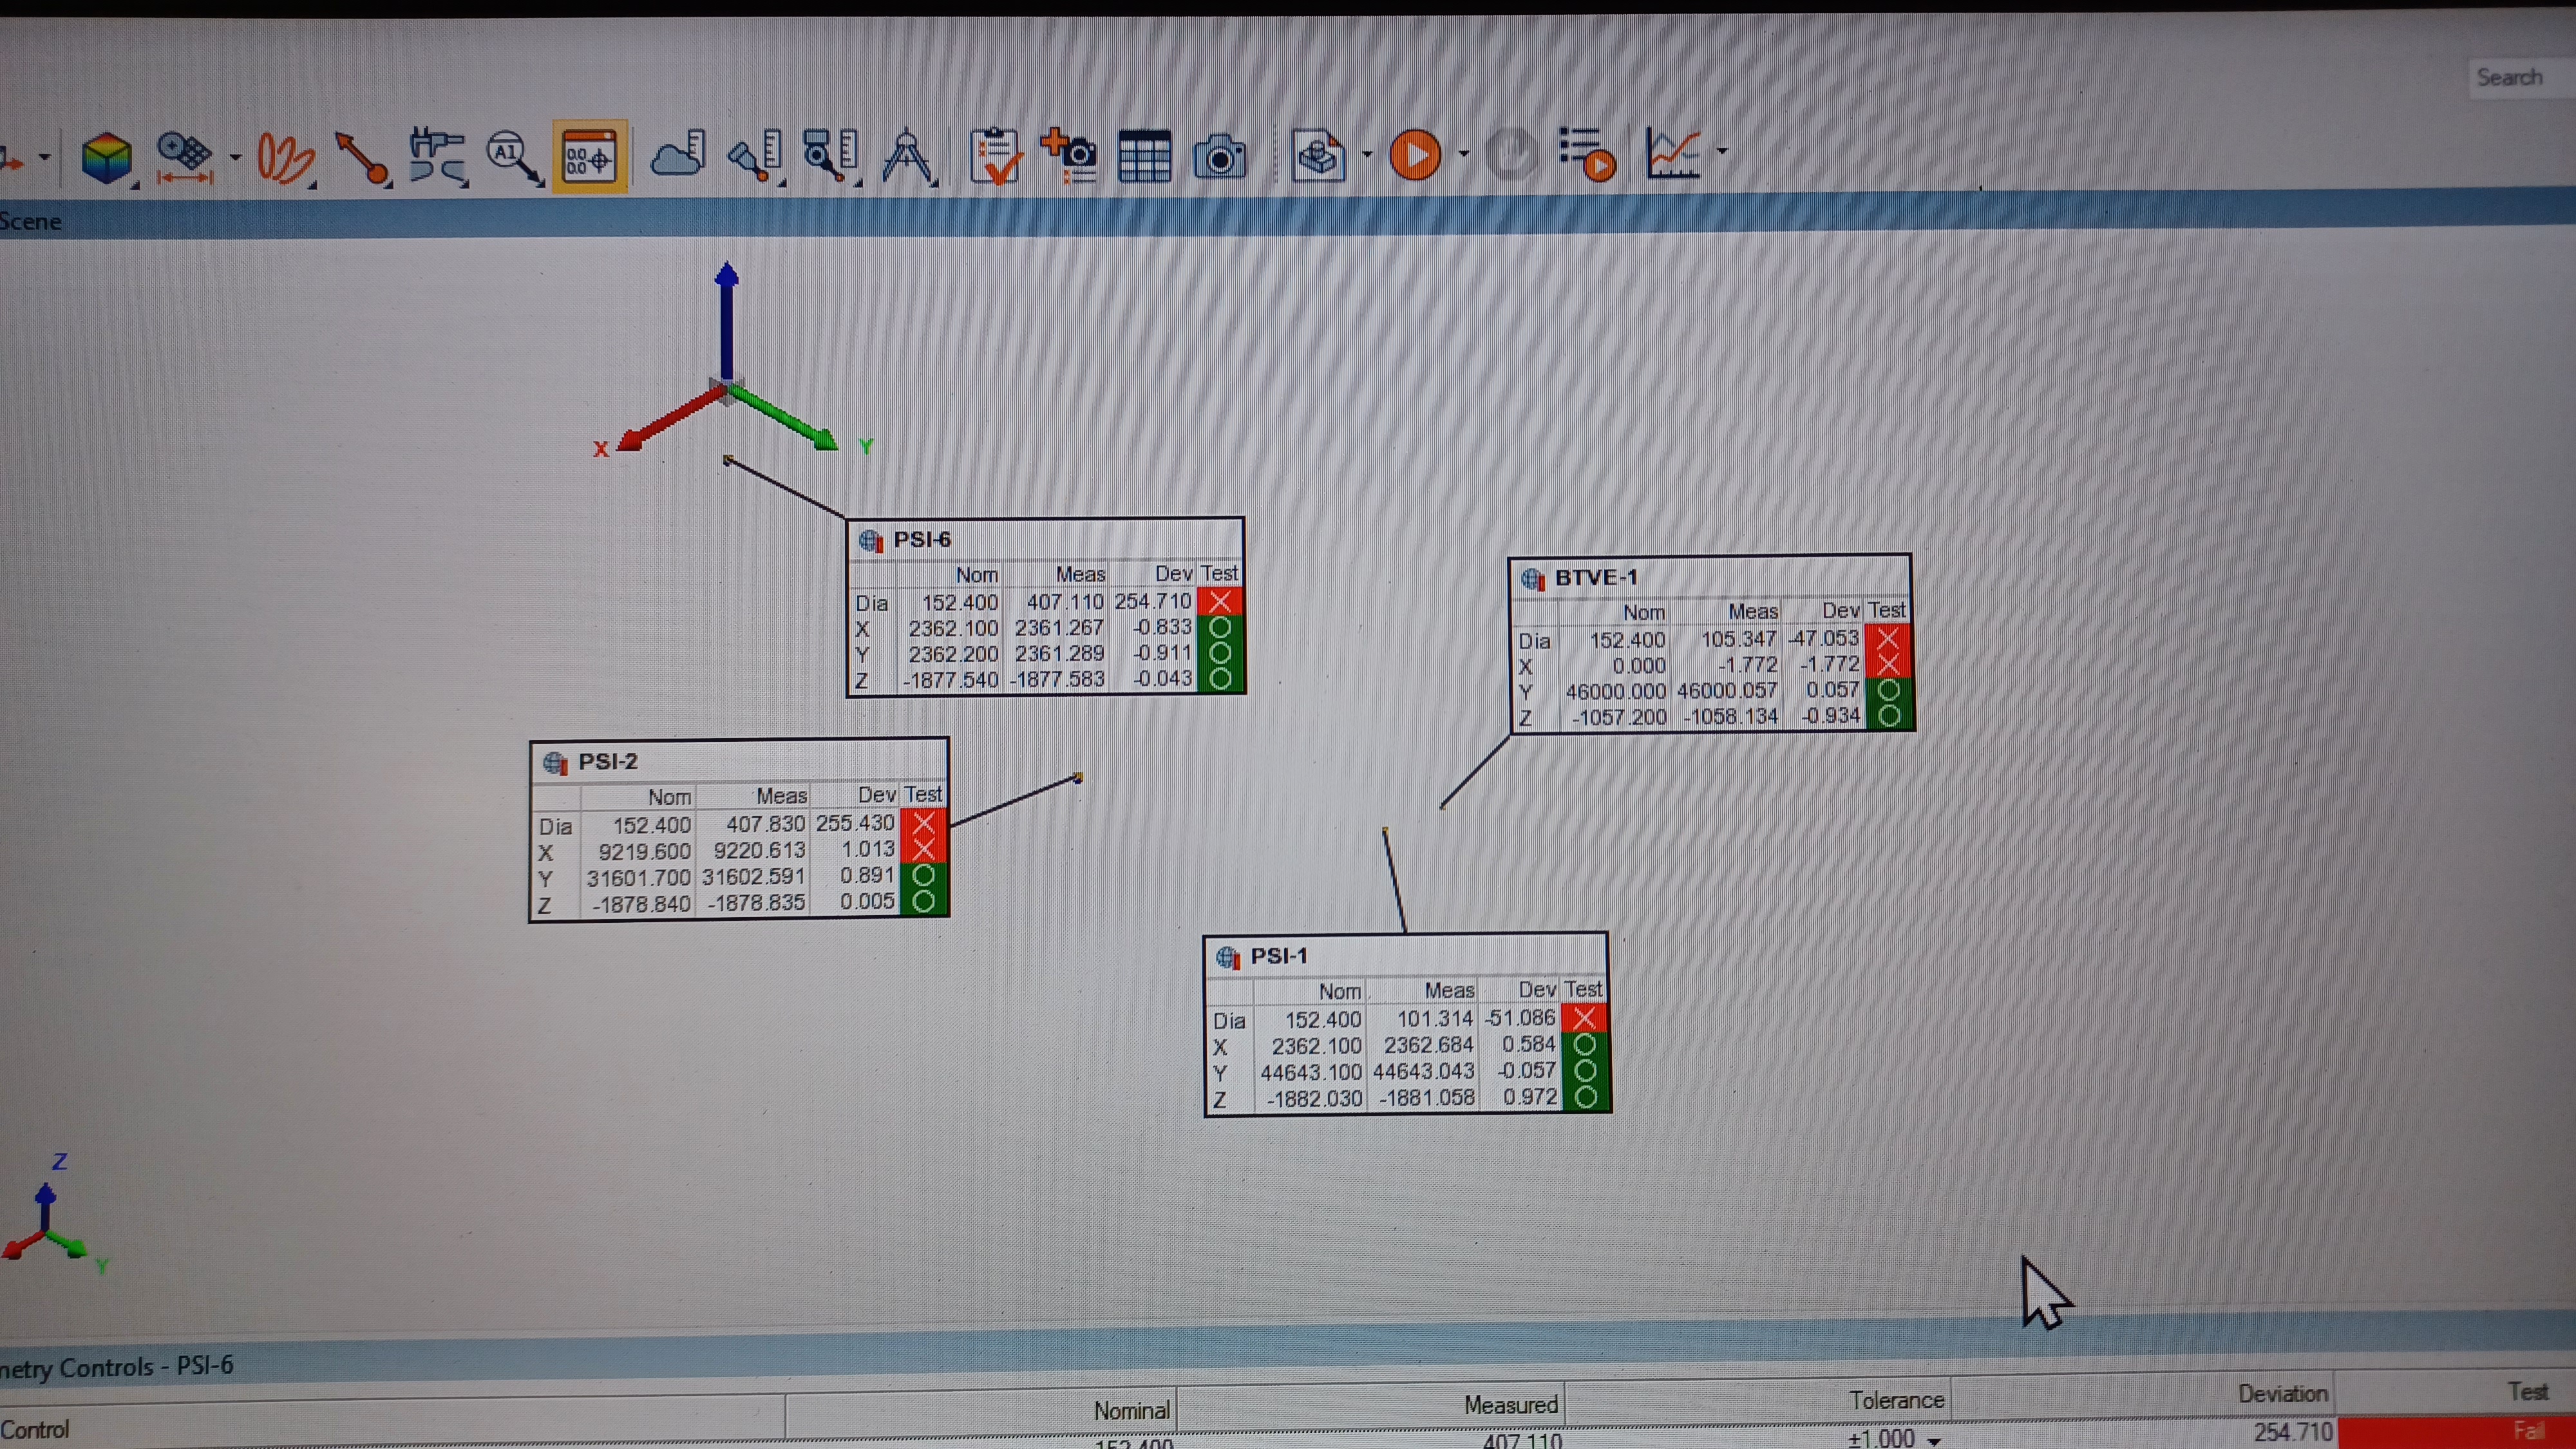
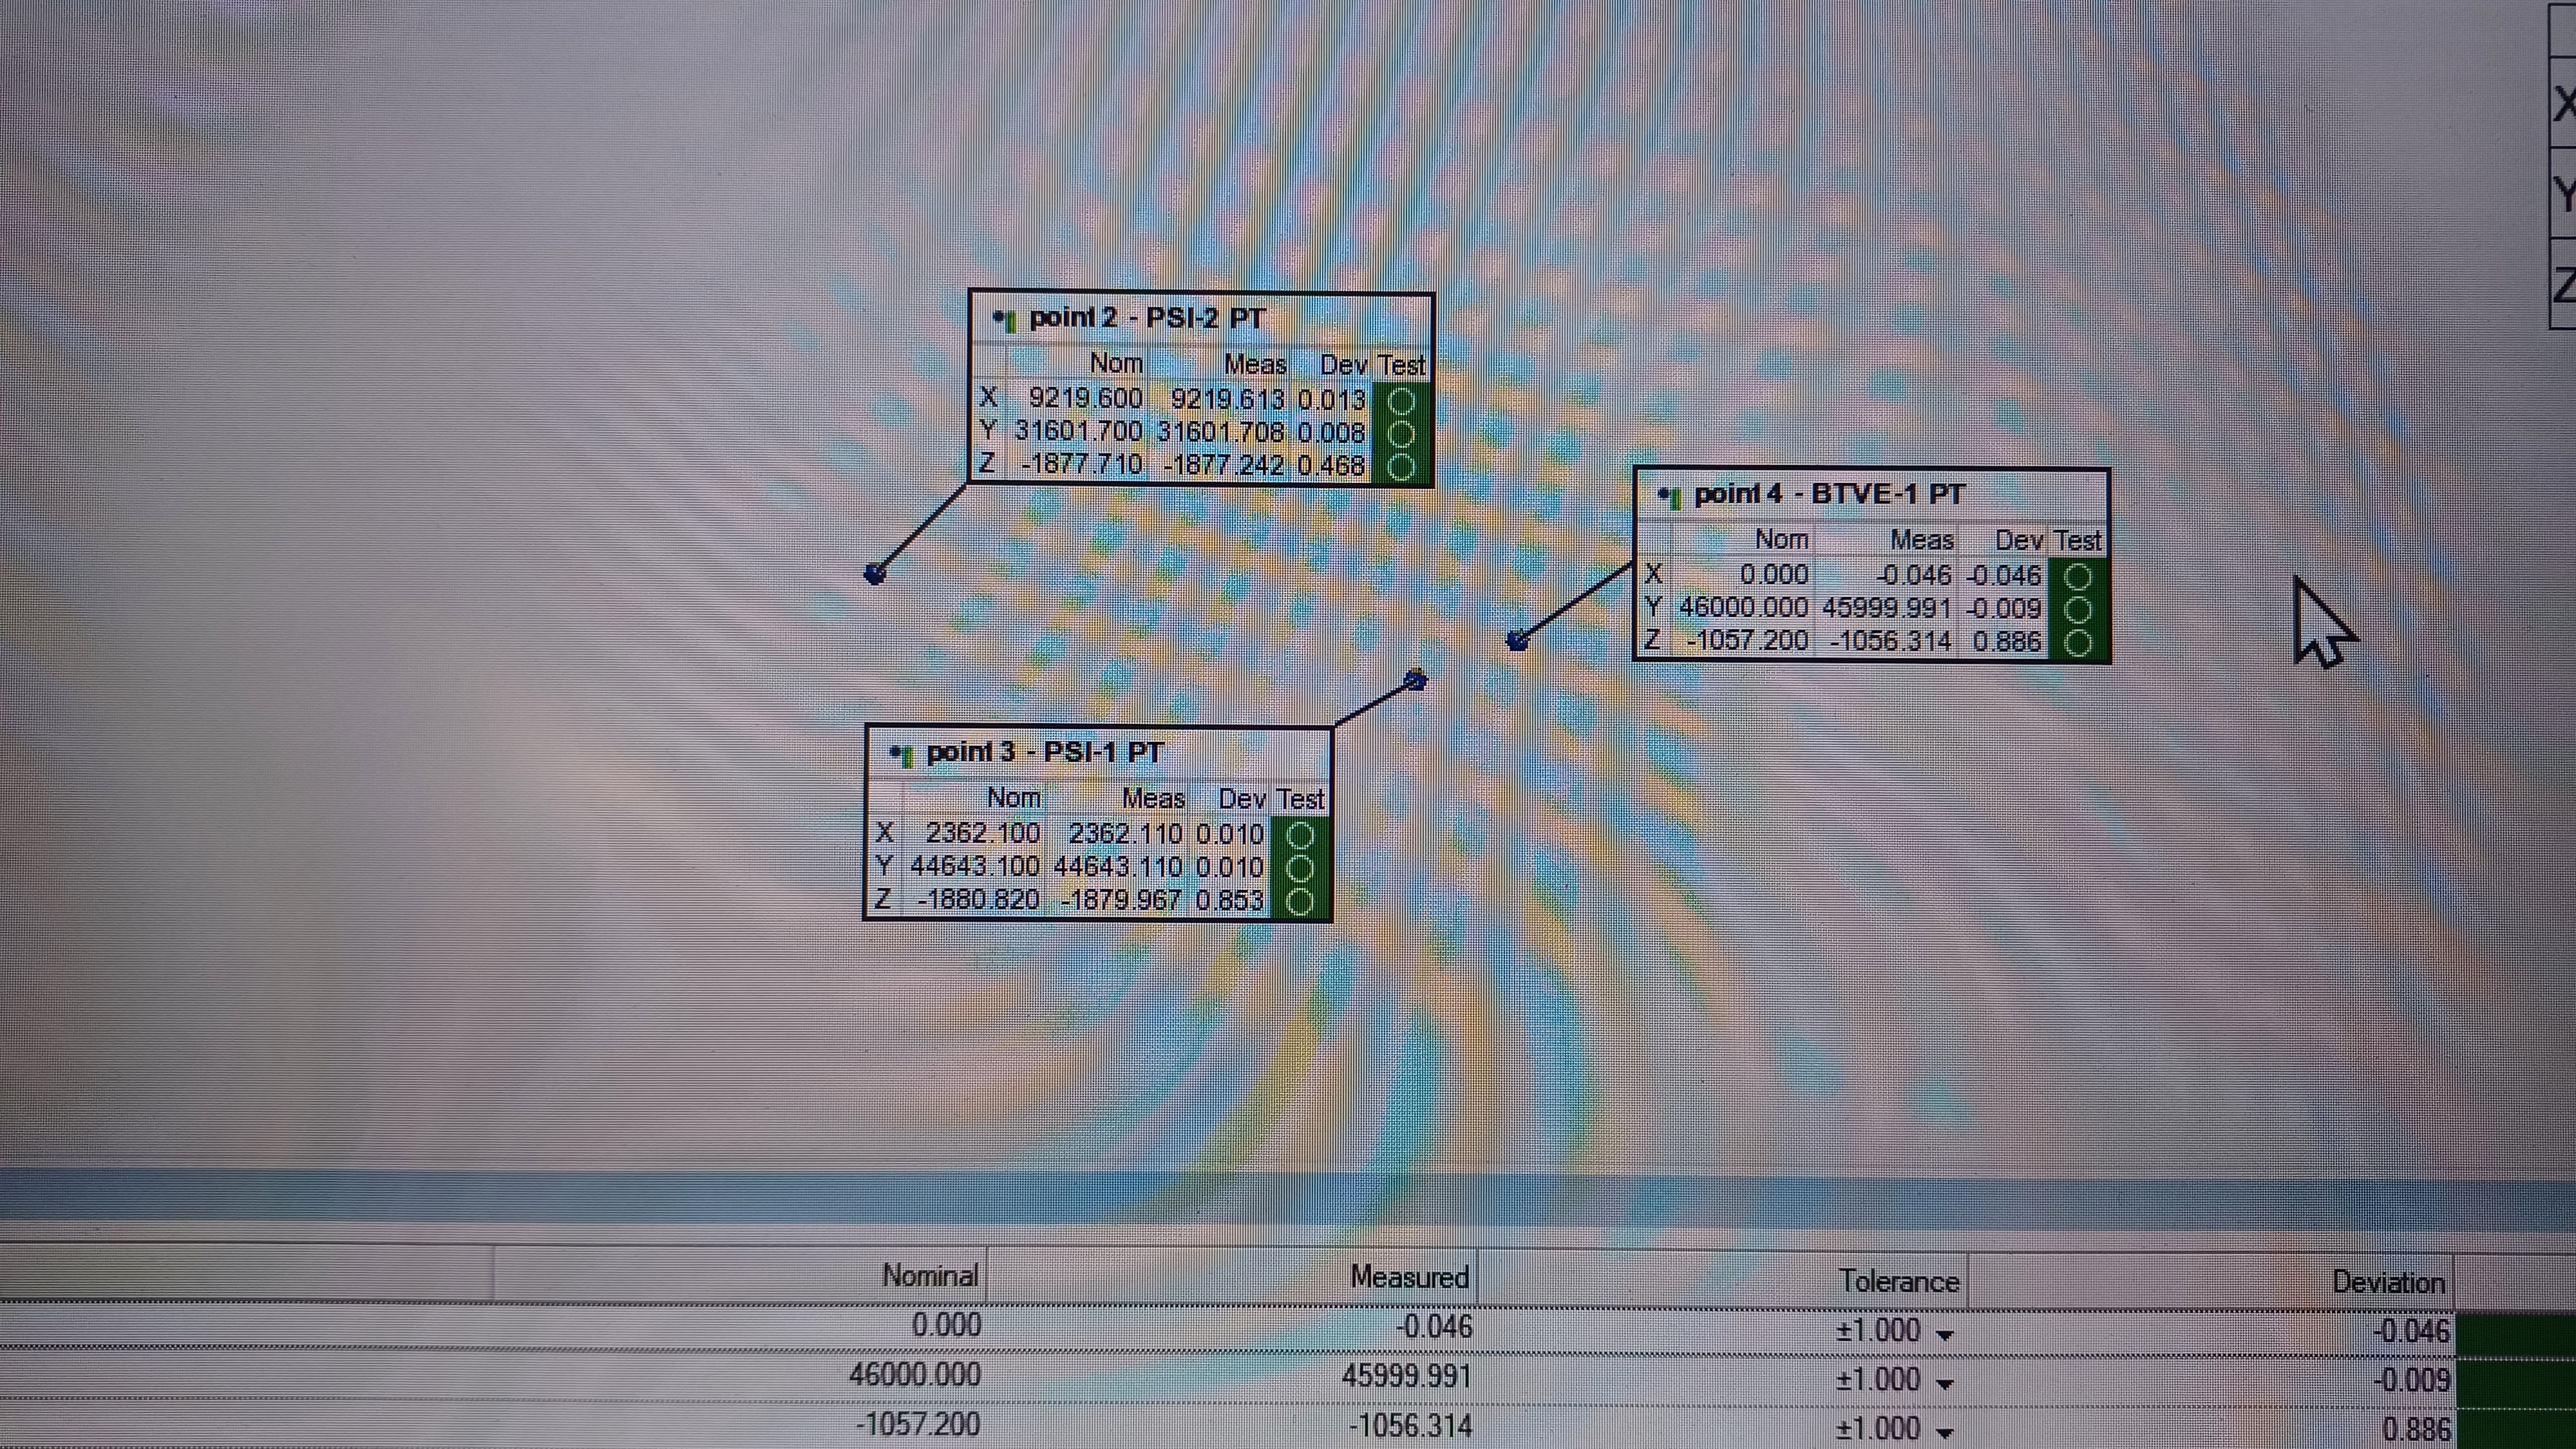
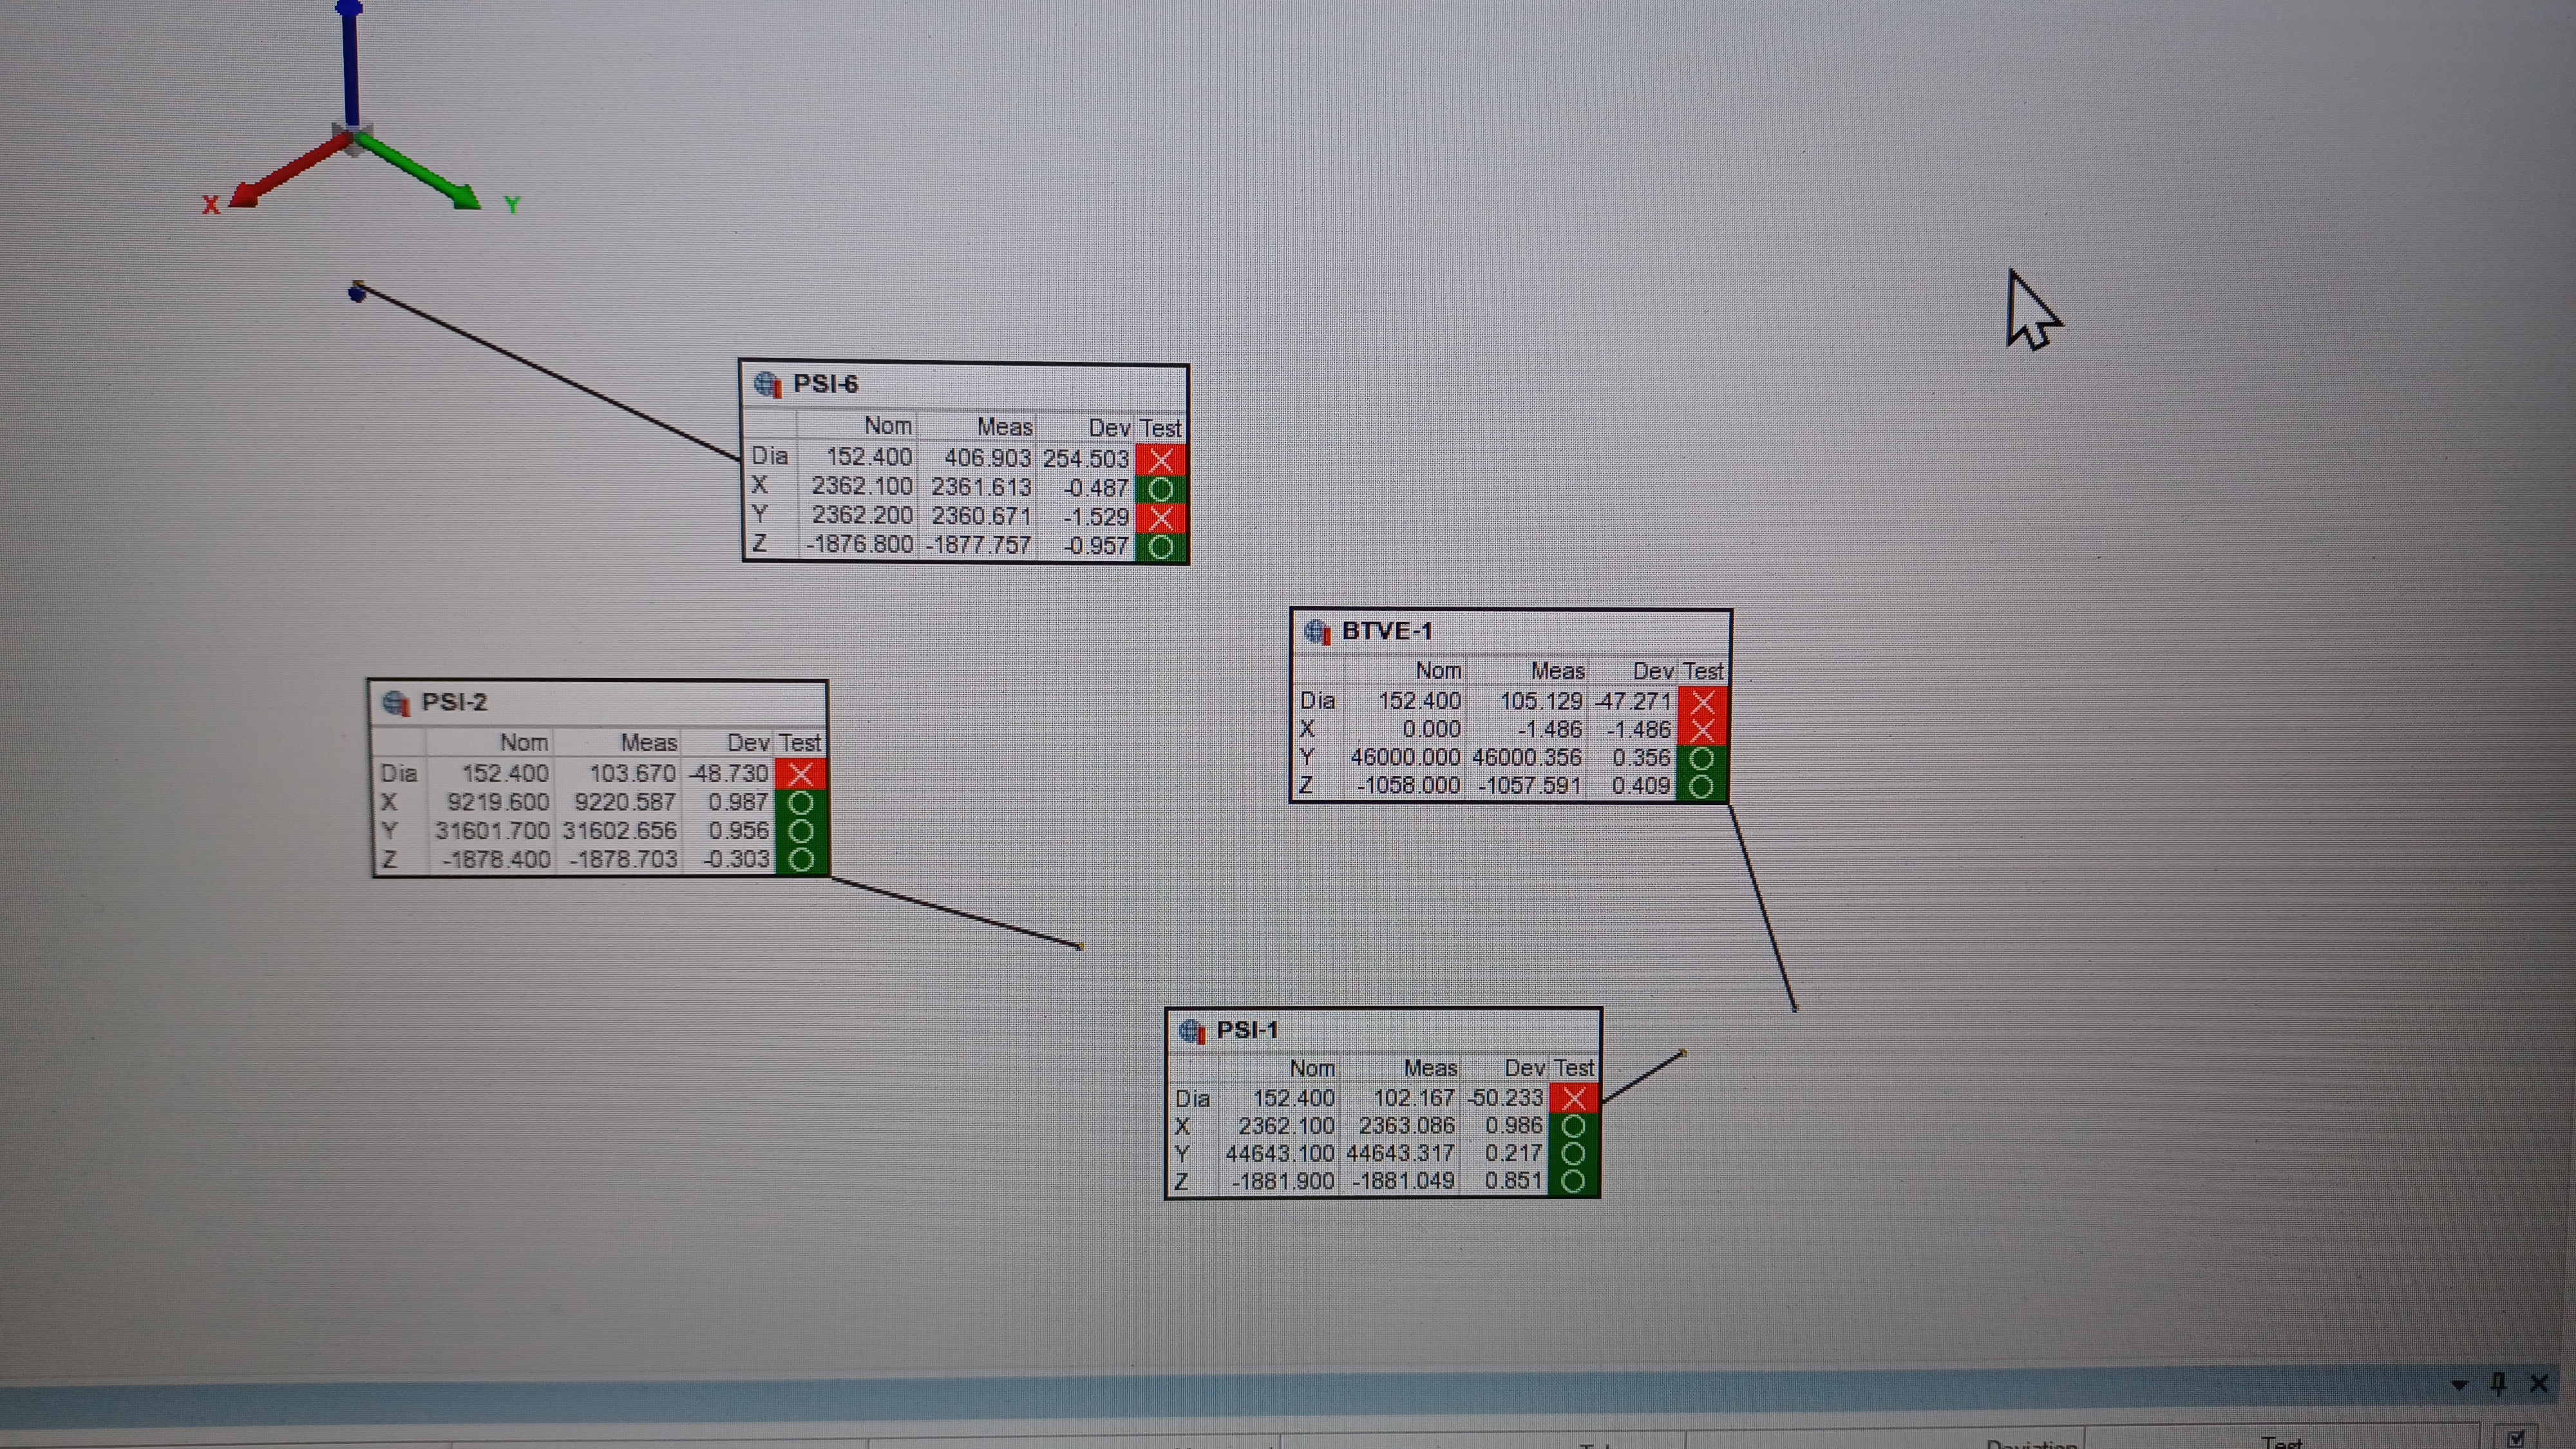
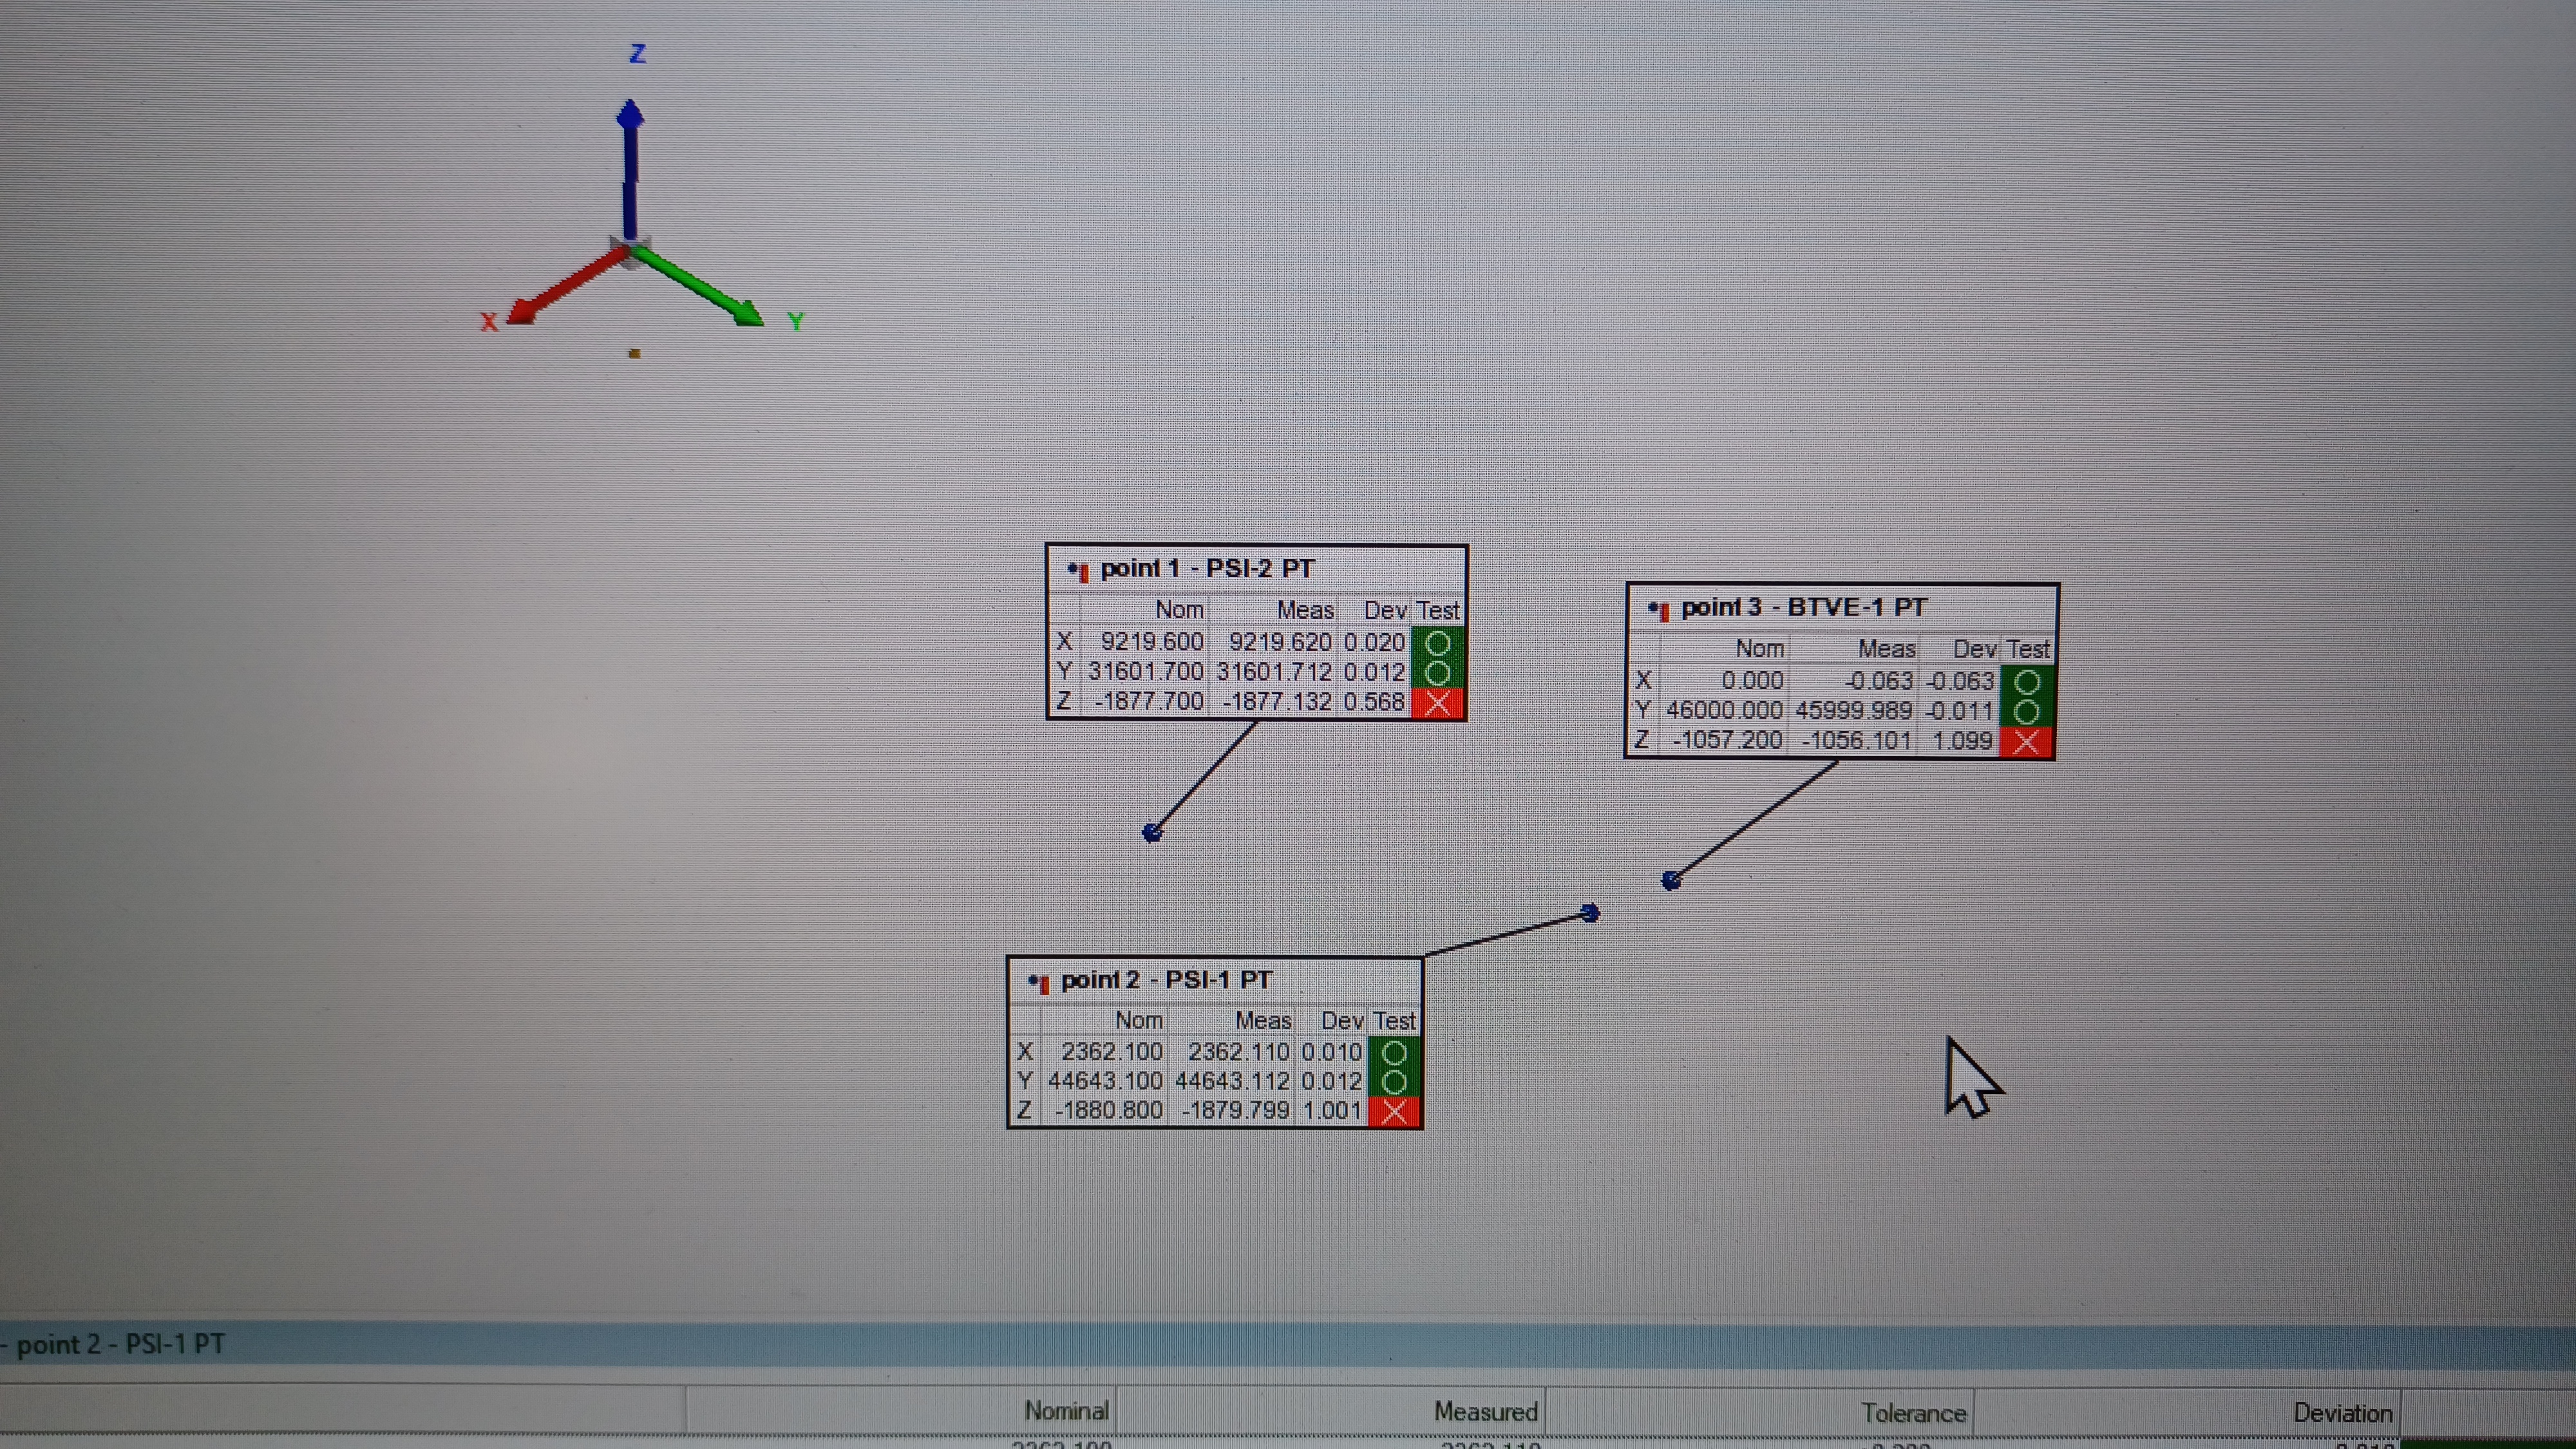
To start, we began by following our WIP procedure for global coordinate alignment. Part of this is to refine said procedure, since I quickly threw this document together (almost 2 years ago now) after a phone call with PolyWorks tech support; we now have a red lined copy that I will use to update the WIP procedure. Due to line of sight issues and monument shape (BTVE monuments are domes, not flat; direct line of sight to PSI-6 is blocked) we use a sphere fit rod to probe the monuments (place the point of the rod in the monument punch and trace out a sphere as best we can while keeping the rod point firmly in the punch (the monument punch limits how much of a sphere we can trace, and therefore the accuracy of Polyworks' sphere fit); the Polyworks software then fits the data to a sphere). In this way we can enter the coordinates of our alignment monuments as the center point of a sphere, then use the sphere fit rod to probe the monument (useful for ones that are out of direct line of sight, like PSI-6, or ones that are not flat, like BTVE-1). We have 2 sizes of sphere fit rod, a 3" and a 5". We first used the 5" rod, as it's the same we used for FCT install setup, and the results of that alignment are shown in the 1st picture. As can be seen, not very good (one can ignore the diameter measurement on this picture and all the ones that follow, the error there is a result of the limited sphere shape we can trace with the sphere fit rod; PolyWorks told us back in 2022 that the alignment algorithms do no consider this data, only X, Y, and Z). We then used the 3" rod and repeated the alignment procedure, results shown in the 2nd picture. This is seemingly a good bit better, but the issues arise when we then try to measure a known monument. Unfortunately, due to a lack of known monuments in the LVEA West Bay, we don't have any independent monuments we can measure against that have an associated Z axis coordinate, so we have to use the same monuments we use to perform the alignment (i.e. BTVE-1, PSI-1, PSI-2, and PSI-6). In addition, we can't use PSI-6 (located in the biergarten), because the SUS electronics rack closest to WBSC2 sits directly over it and blocks direct line of sight (we can see it when using a sphere fit rod, but not with a regular SMR nest). When looking at the 3 available monuments we have, the FARO reports their coordinates as ~1.5mm higher than our documentation says they are; this is consistent across all 3 monuments, indicating a systemic error somewhere (or maybe the documentation is wrong?). X and Y are accurate to <0.1 mm across all monuments measured.
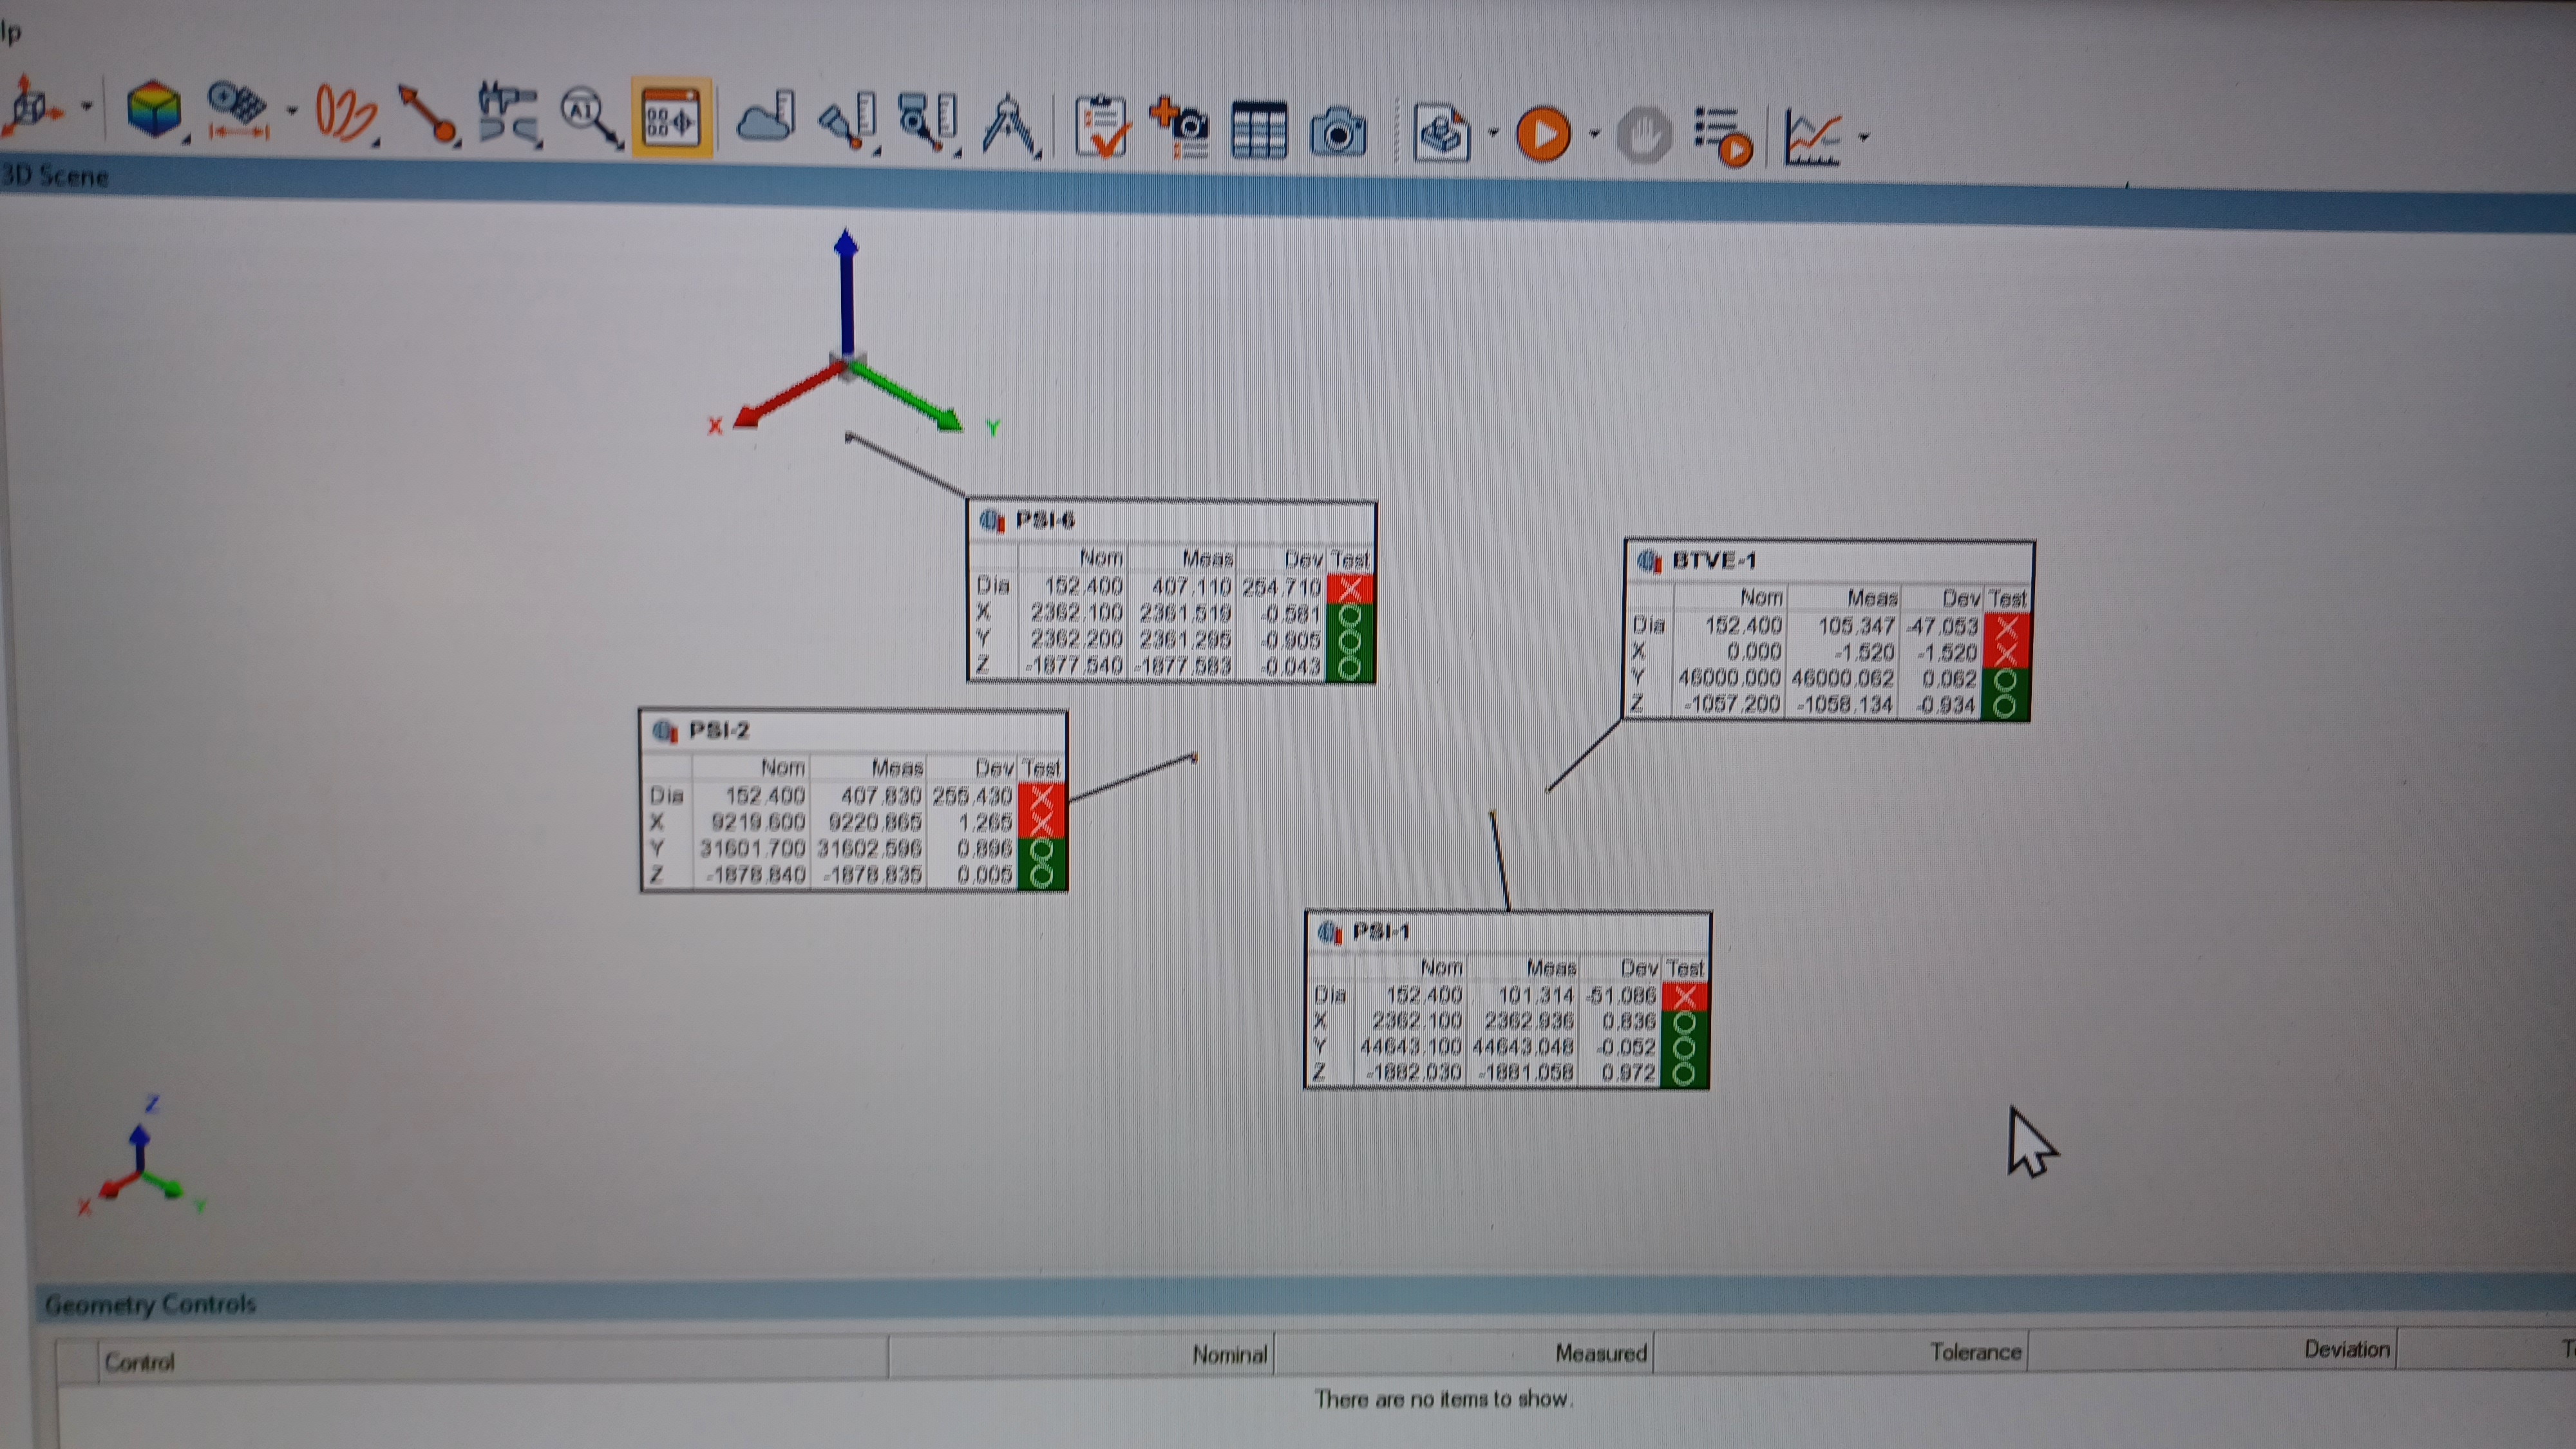
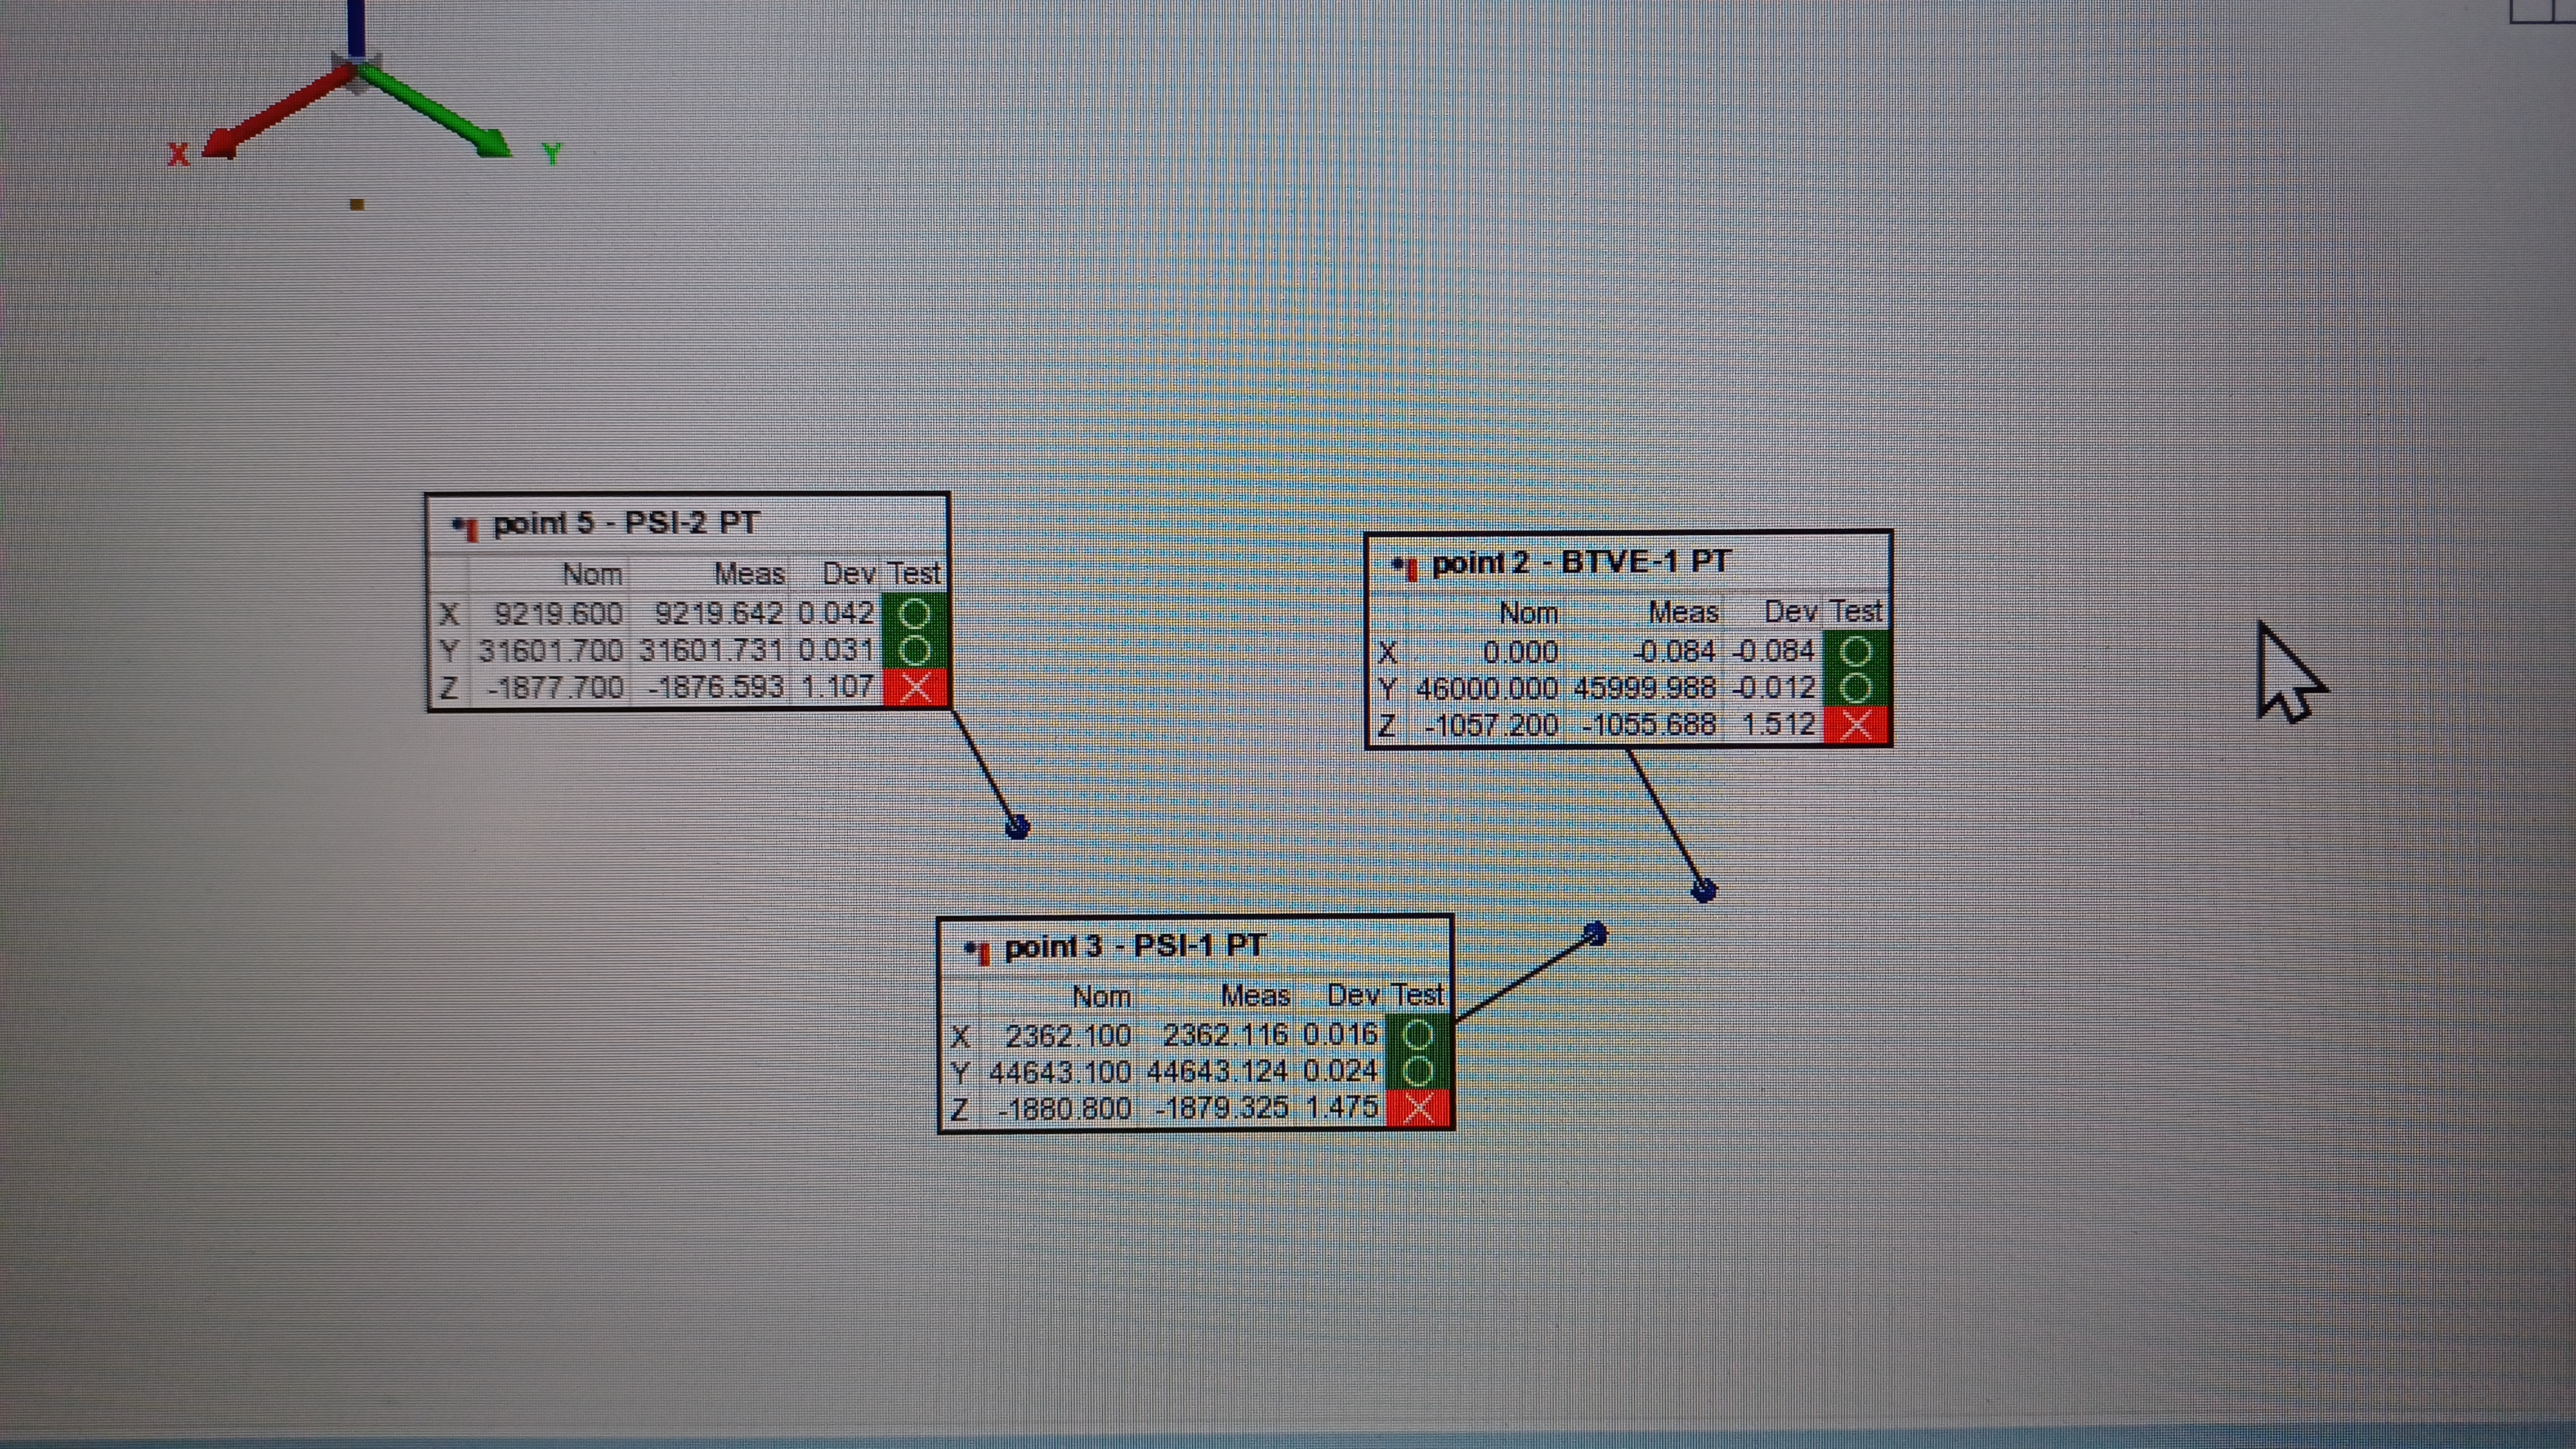
This launched us on trying to find this 1.5mm error. The first thing we tried is reading up on PolyWorks' alignment algorithms to see if there's something in the setup we're missing (PolyWorks' included reference guide is a wealth of information on the software). From this we learned that the alignment algorithms are updateable after the fact (including adding and removing alignment features/monuments), and the software will then apply that update across all alignments in the project. This includes adding and removing alignment targets on the fly, and changing how the routine considers the available data (weighting different monuments over others, which axes to use, etc.). Part of our alignment procedure is to first align to X, Y, and axis tilt, then perform another alignment routine to align to the Z axis. We noticed that the portion of the alignment routine that aligns to X, Y, and tilt was also considering Z, when it shouldn't be; the portion that aligned to Z was considering X and Y when it shouldn't be. We can make these corrections on the fly, without having to re-measure anything, so we did. The update changed the X and Y axis deviations, but caused no change in the Z axis deviations; the results of this correction are shown in the 3rd picture. The X deviation for PSI-2 got a little worse but improved for the other 3 monuments, Y is practically the same across all 4, and Z was unchanged as expected. But we still see the +1.5mm Z axis error when directly measuring these monuments (X and Y remain accurate to <0.1mm).
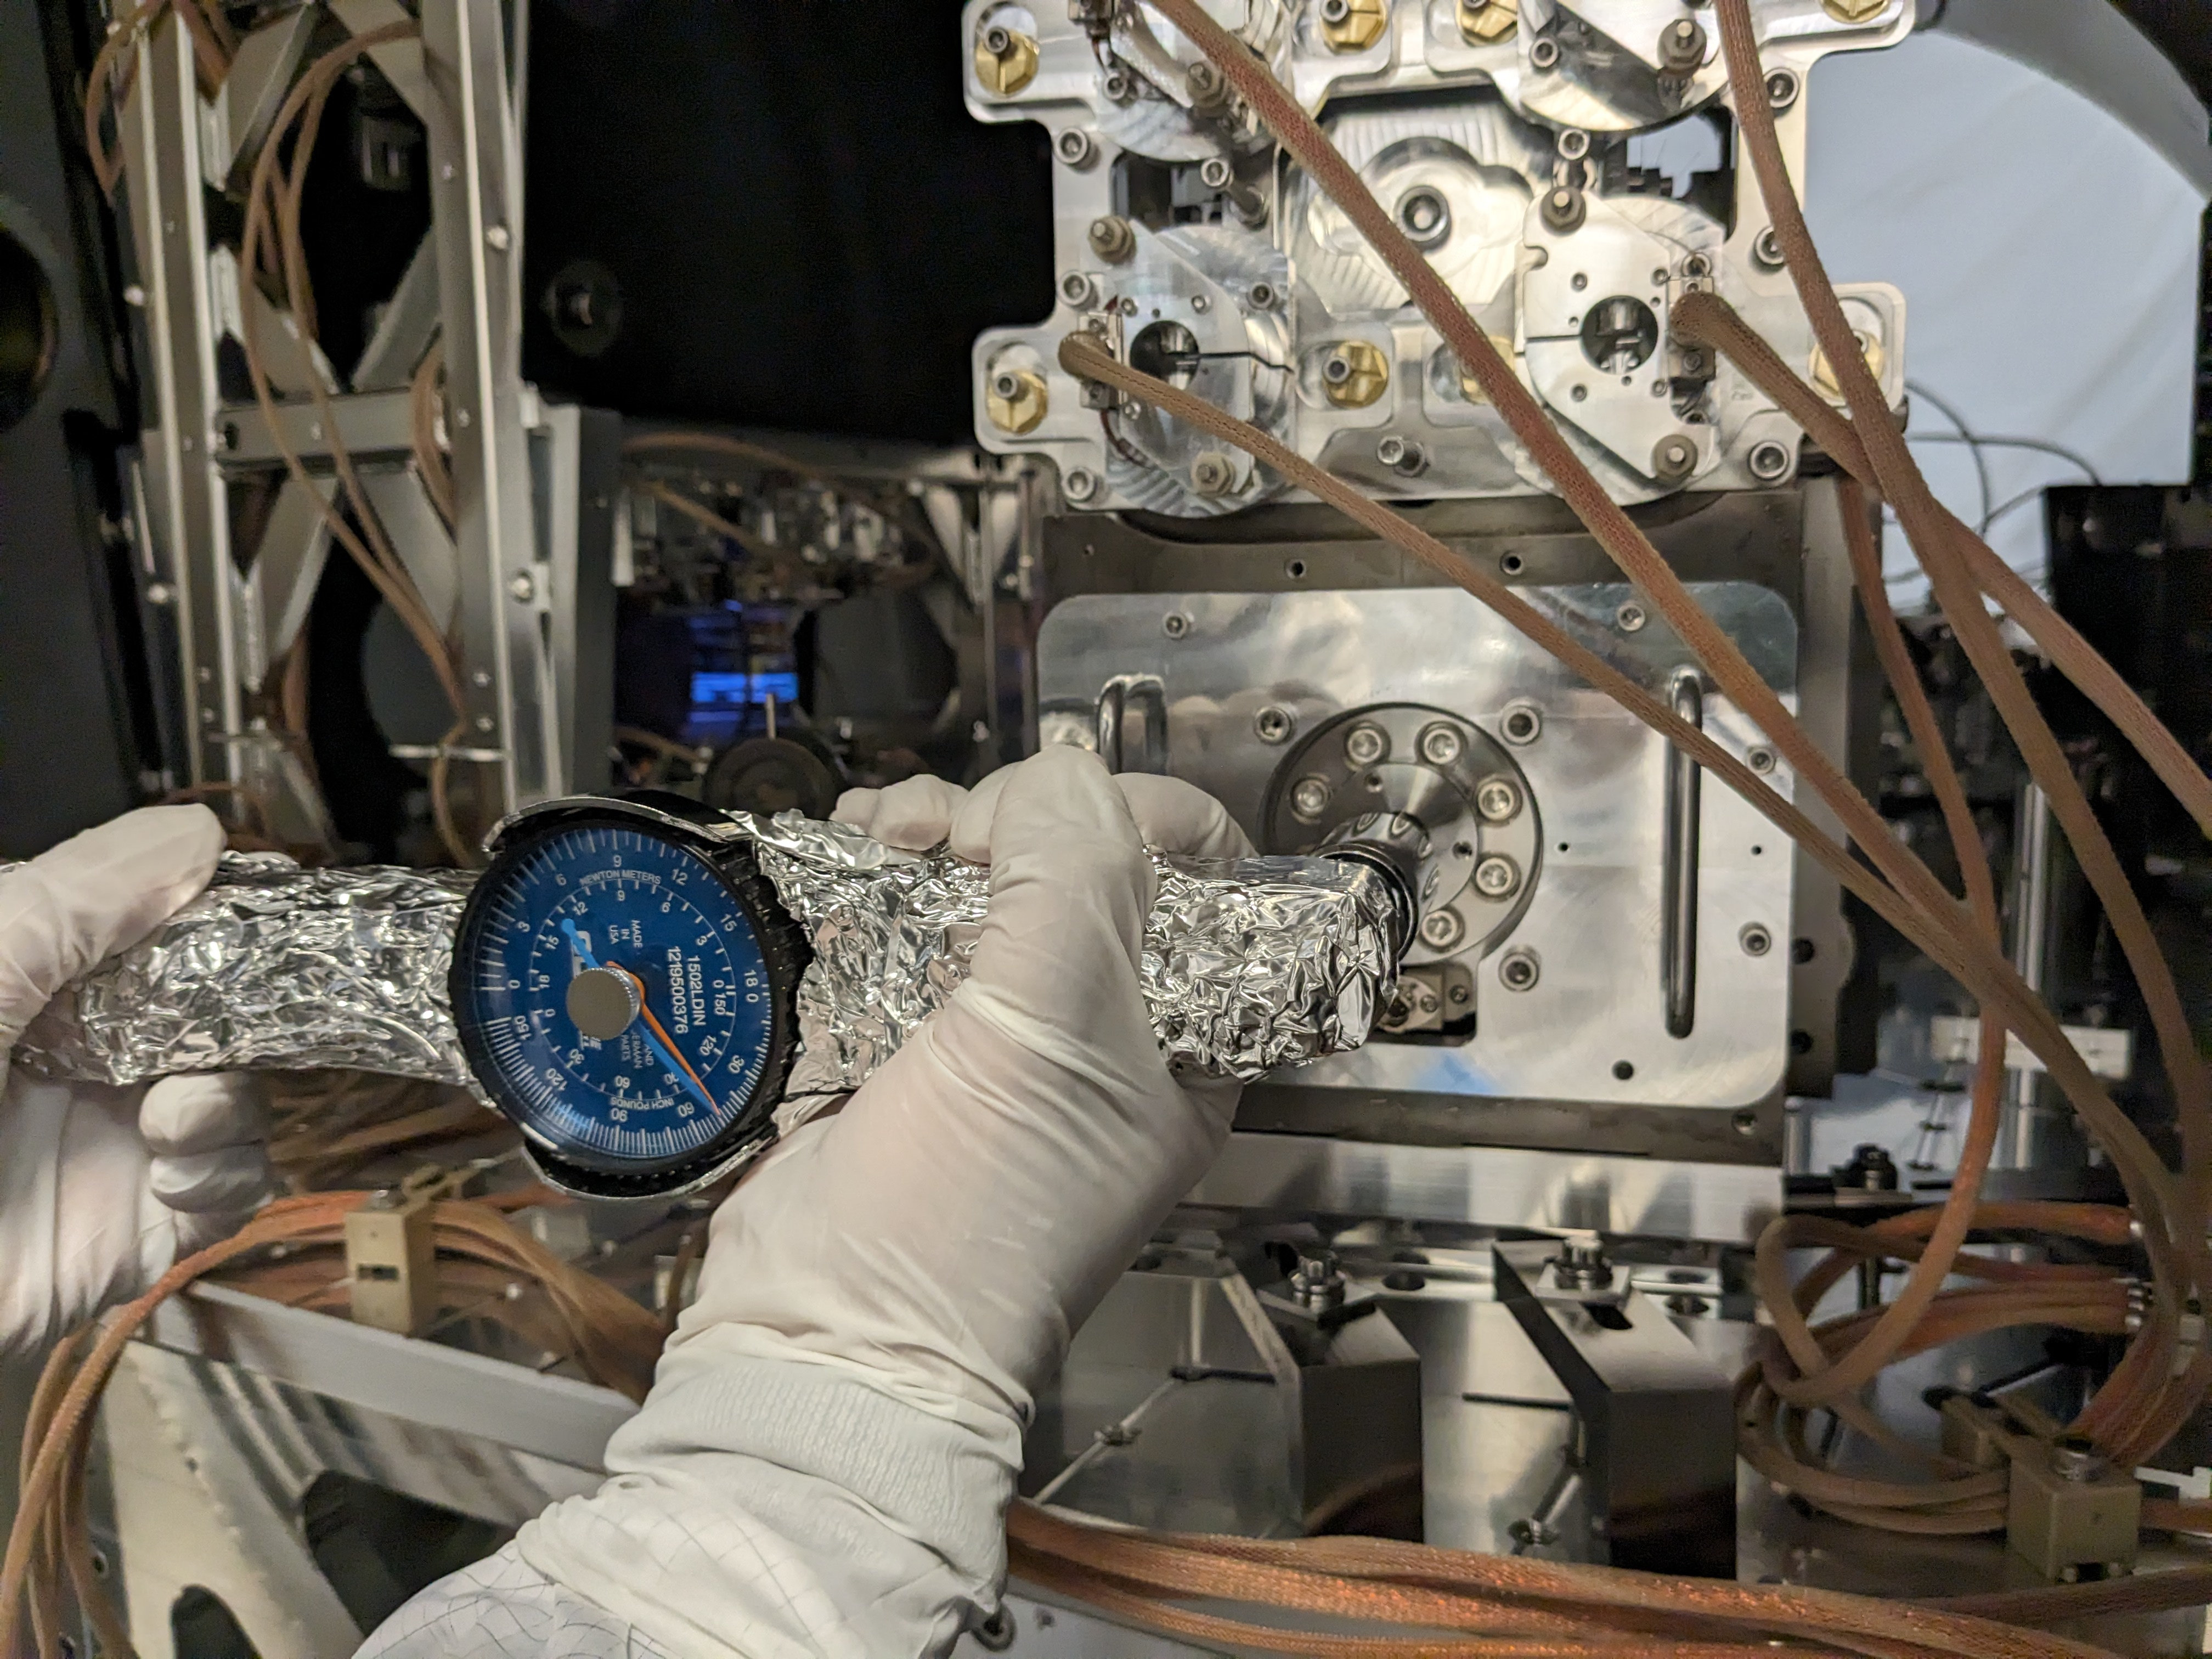
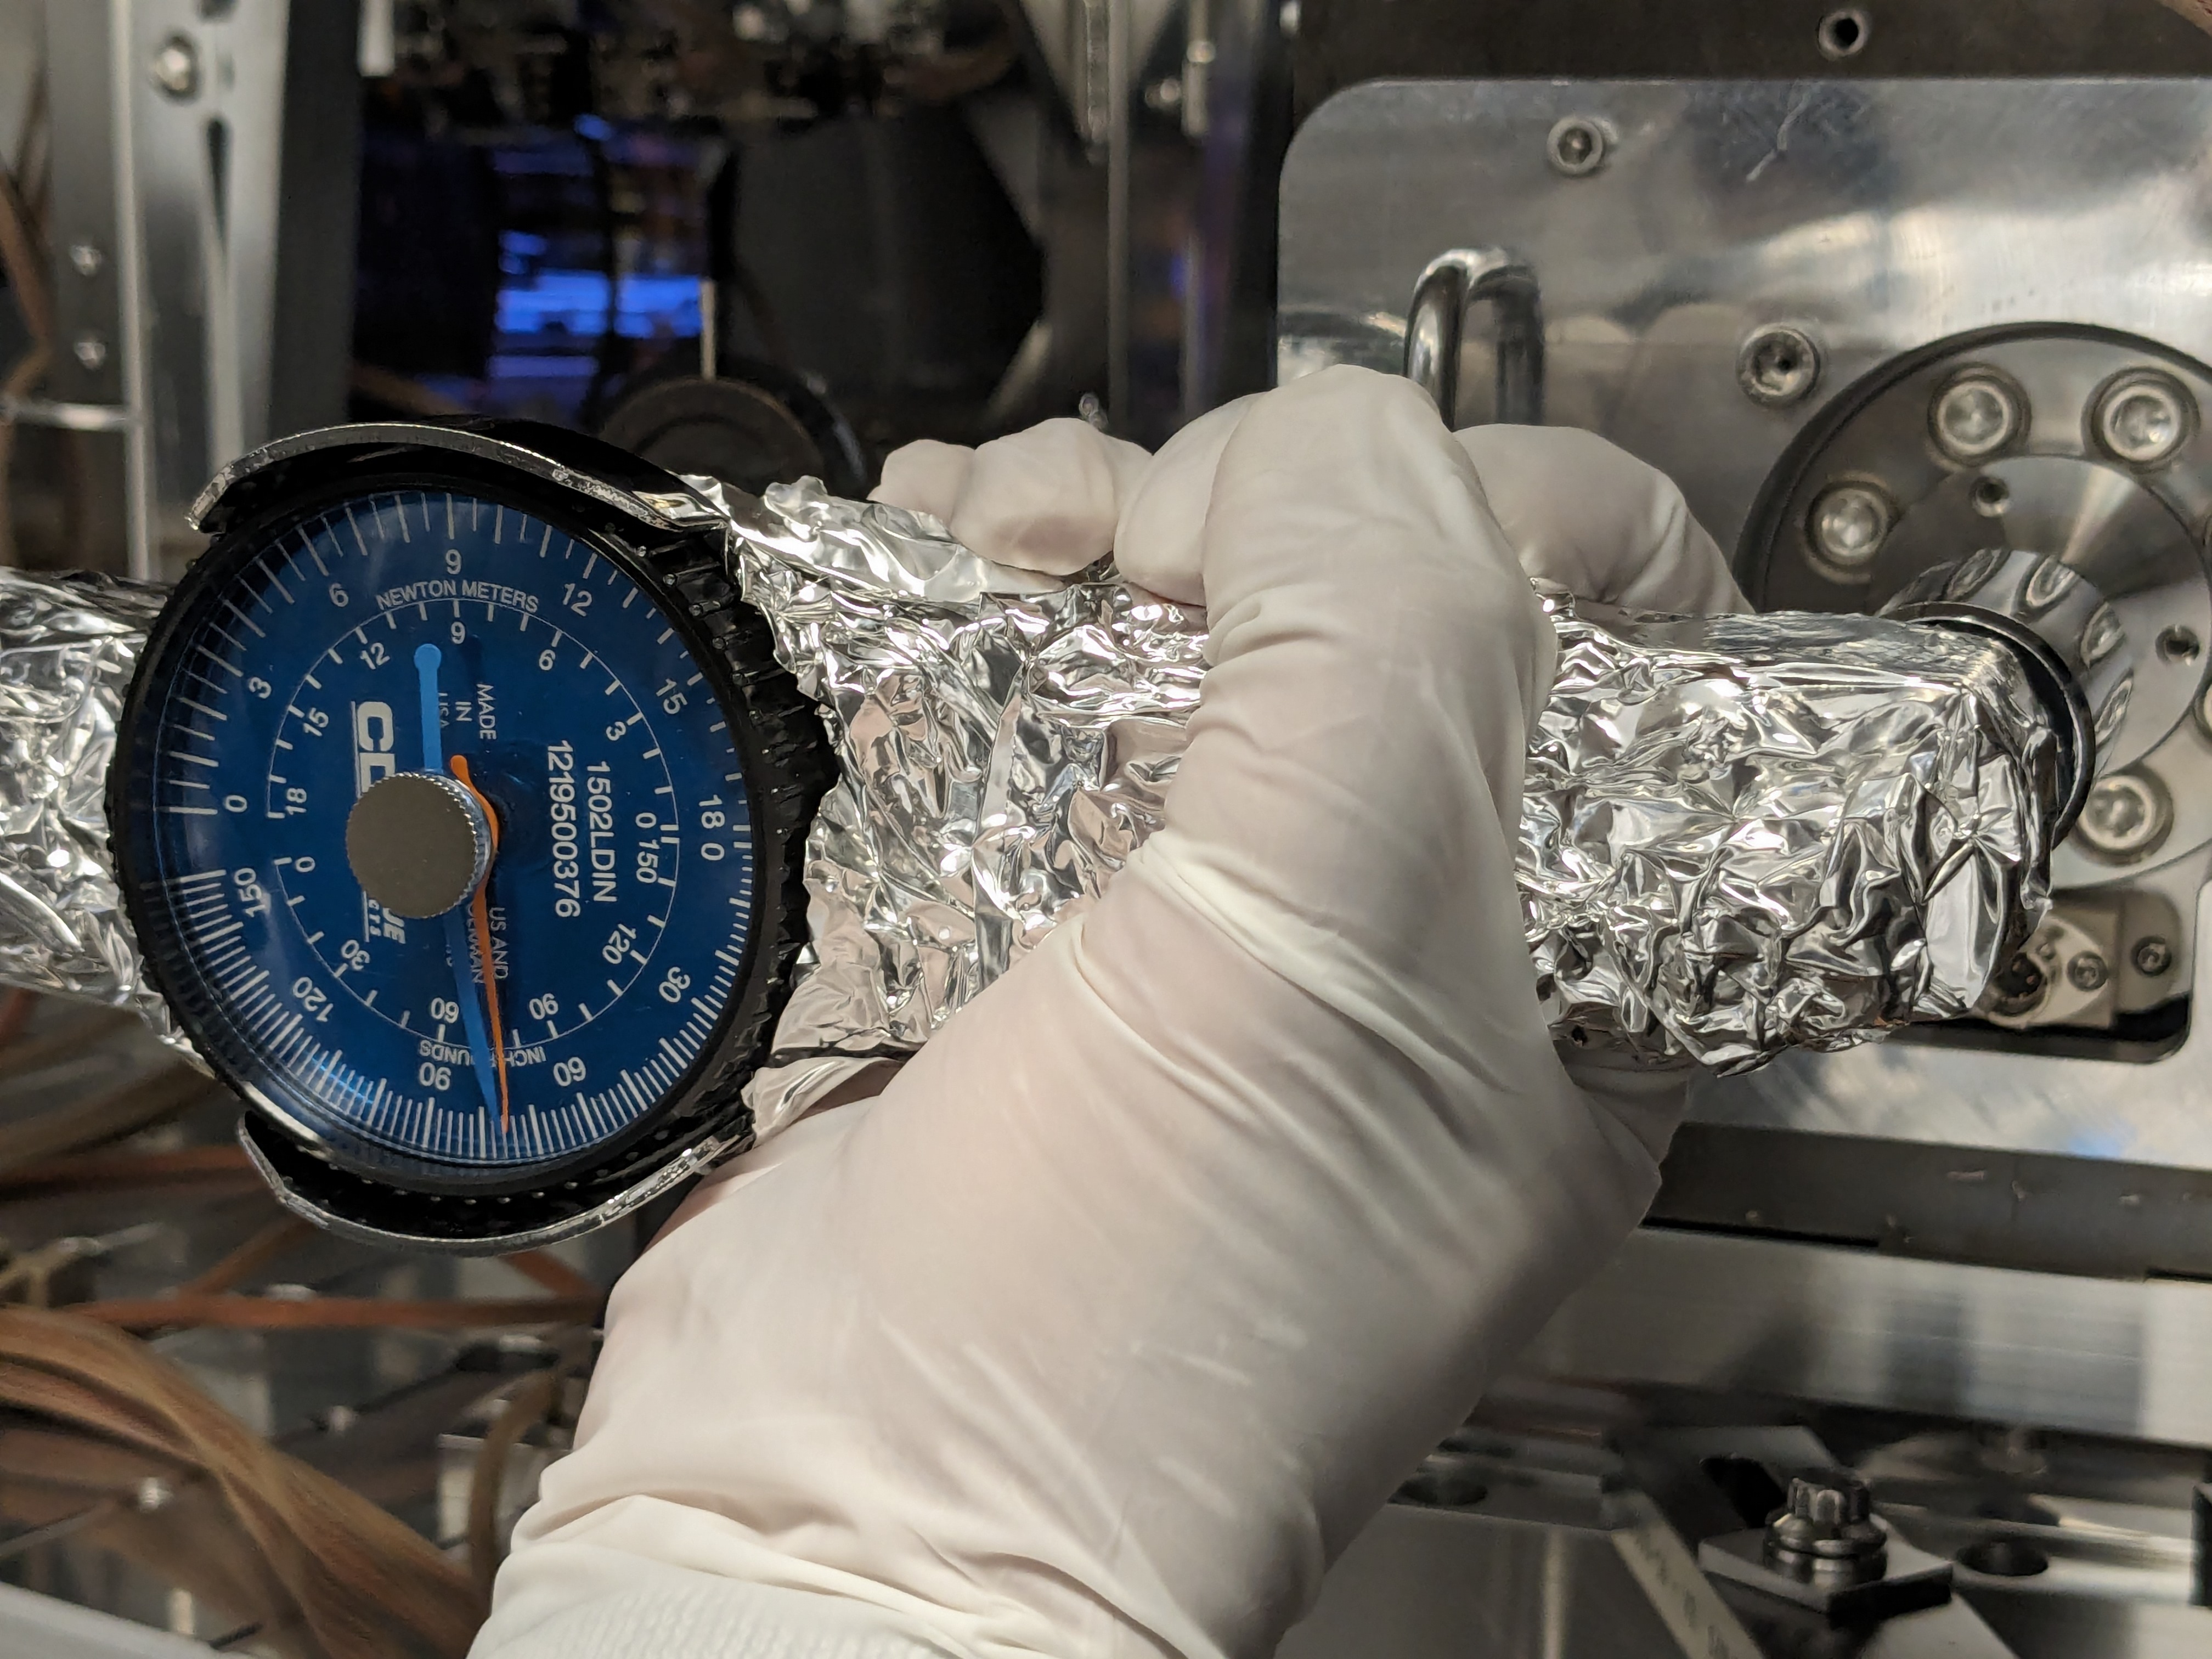
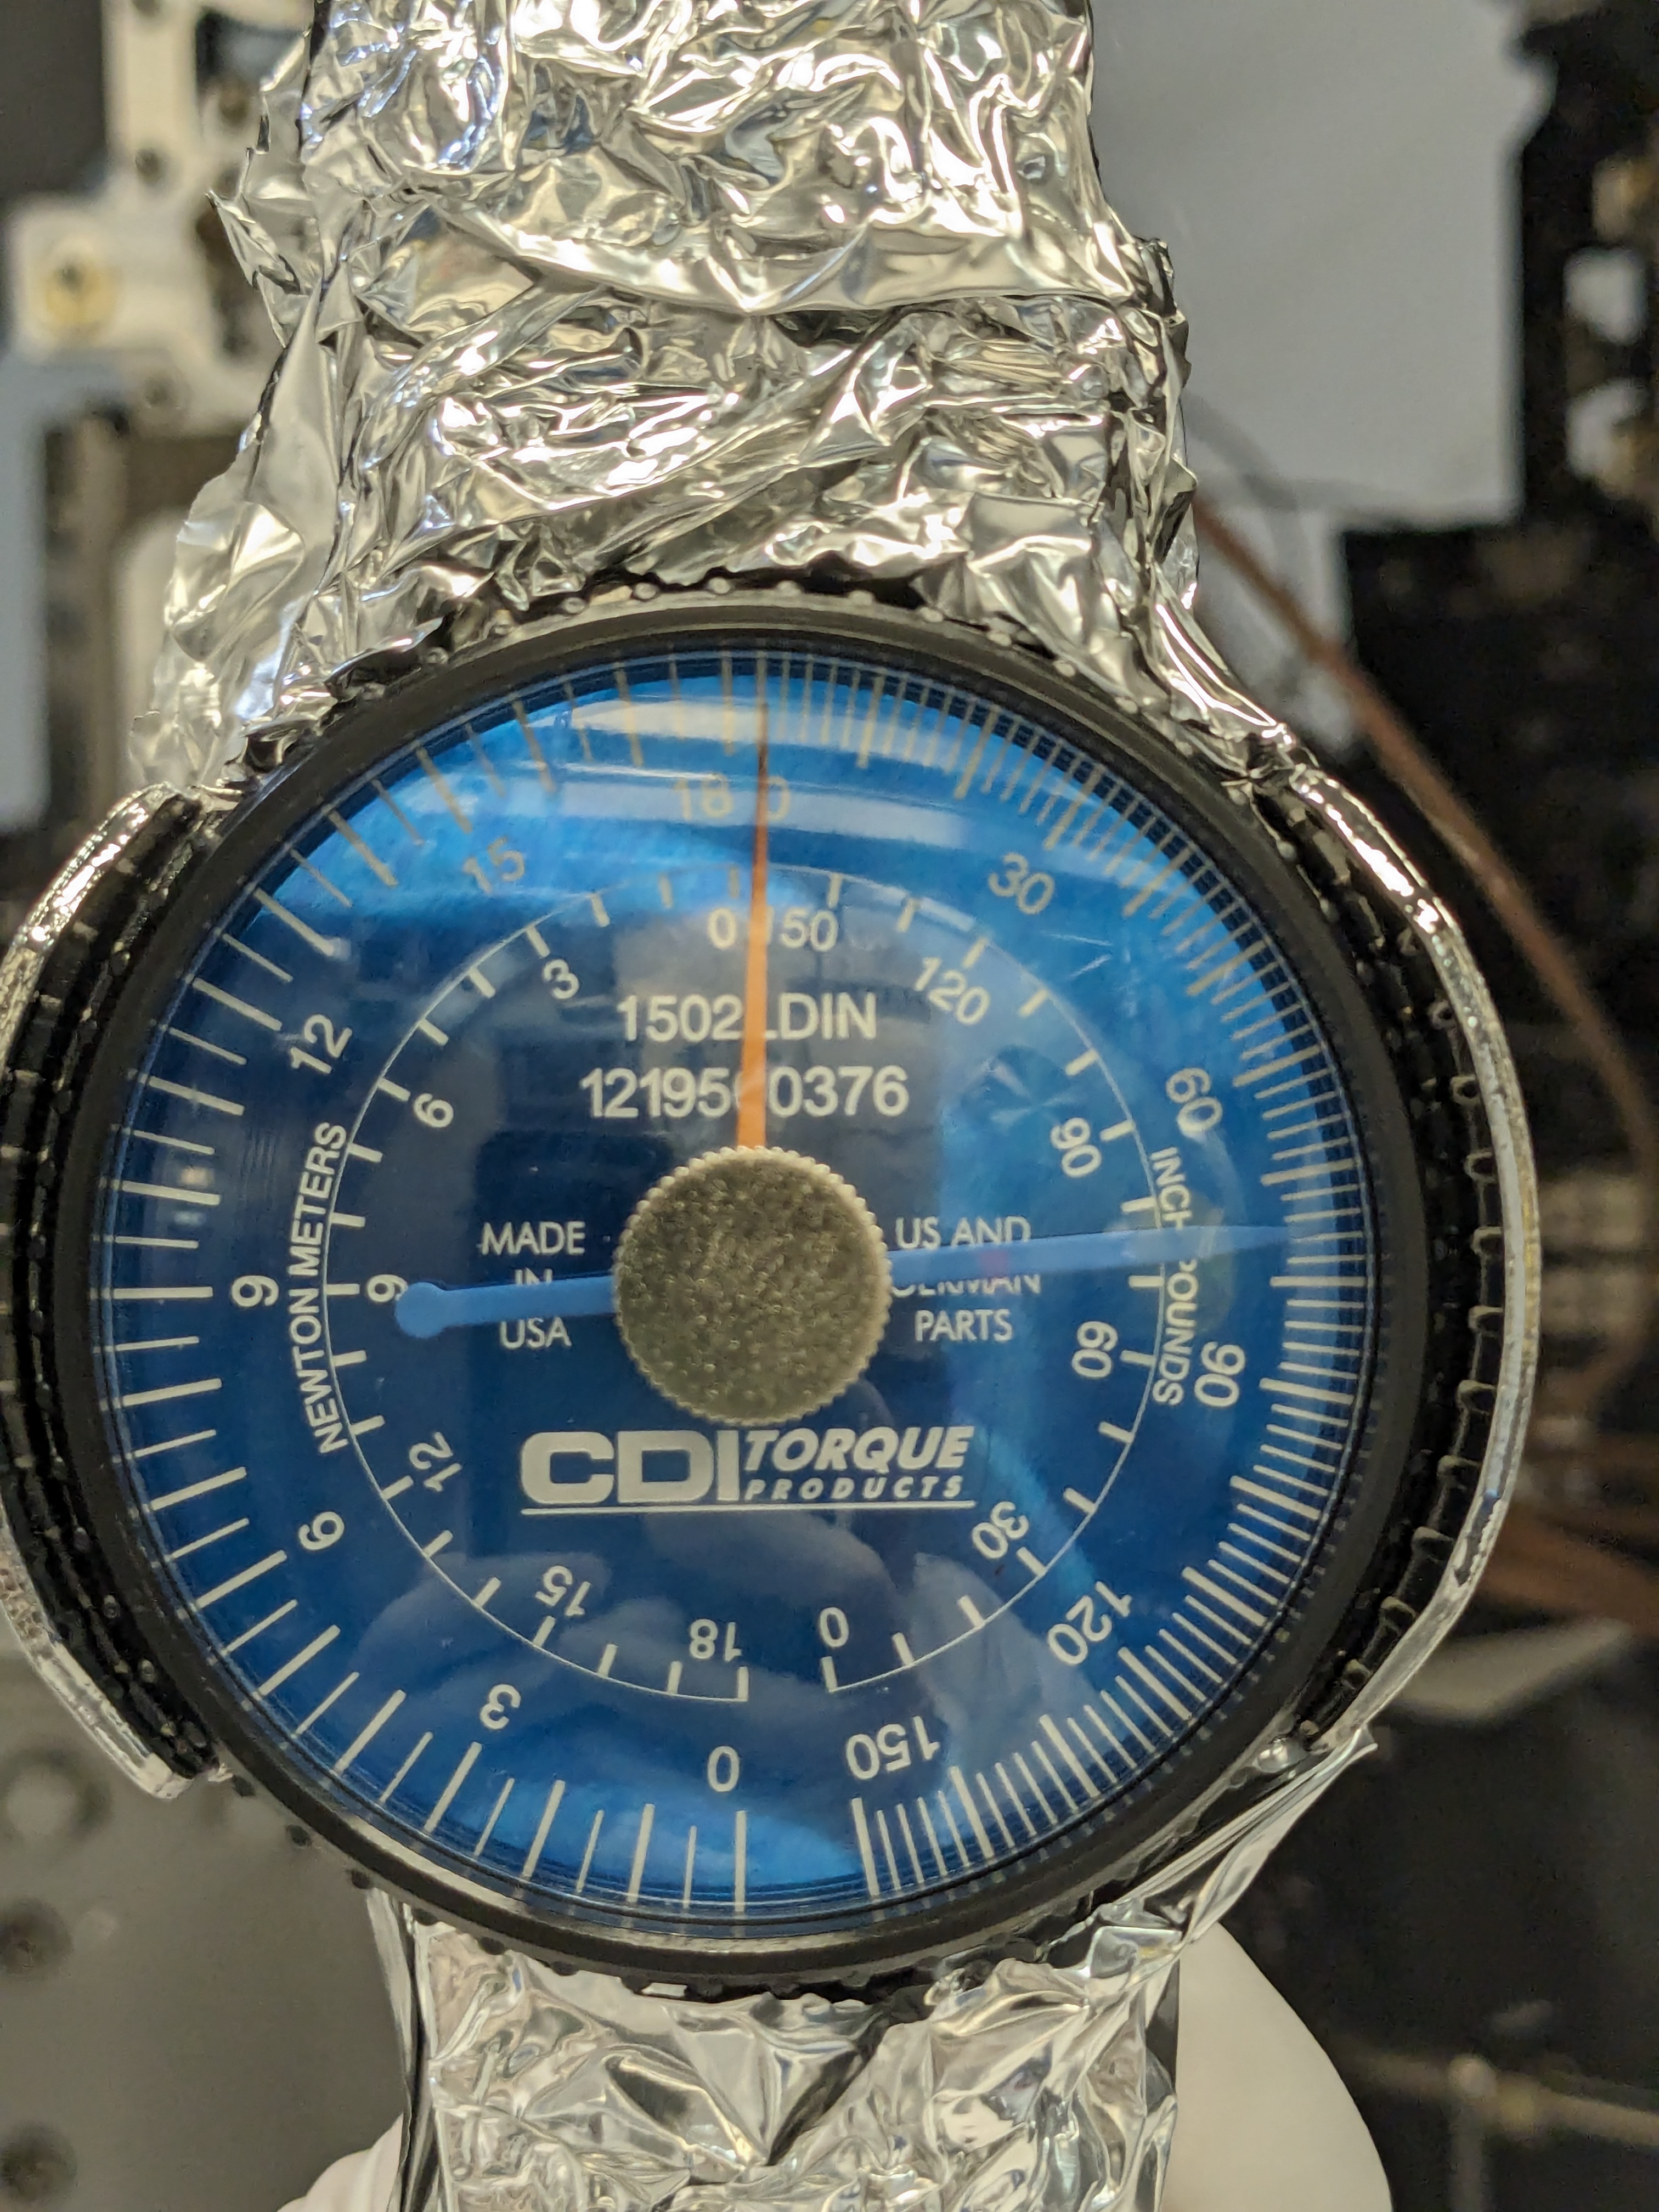
The next thing we considered is the difference between the monument surface and the monument punch. The sphere fit rod measures to the point of the rod, which sits at the bottom of the punch while we use it to probe the monument location. However, the Z axis coordinate for these monuments is registered to the surface of the monument, not the bottom of the punch. Therefore in this setup the FARO is actually measuring the bottom of the punch, which then adds error to the coordinate system alignment. Using our Center Punch Nest (an SMR nest with an included punch for marking monuments, abbreviated CPN from here on out) and a depth gauge we measured the difference between the monument surface and the bottom of the punch for each of our 4 alignment monuments (the punch portion of the nest only depresses as far as the punch can go, so we can measure the difference between the surface and the monument punch based on how far the nest punch can travel). The results, assuming the surface of the monument is 0:
- BTVE-1: -0.8 mm
- PSI-1: -1.1 mm
- PSI-2: -0.7 mm
- PSI-6: -0.6 mm
This means that when we use a sphere fit rod to probe these monuments we have to correct the global coordinate by the above amounts so we're measuring the correct point on the monument. For example, the global Z axis coordiante for BTVE-1 is -1057.2mm, but when using a sphere fit rod we need to enter the corrected coordinate of -1058.0mm (-1057.2 - 0.8) into PolyWorks.
Tyler suggested we also check the local difference in the Z axis between our alignment monuments, using BTVE-1 as the origin. We have a local coordinate survey from the late 90s for the PSI and BTVE monuments in the LVEA (the last time this was done); this data is available at D970210 in the file Rogers_LHO_PSIMonumentsAs-Built.pdf on page 2, and again in D1100291 in the file LHO_PSI_Monument_Z_Corr_MEZ220406a.xlsx, in Column C. We used the FARO to check this, using a blank project so the FARO was not aligned to our global coordinate system. Setup again in the West Bay in the same position we've been using to probe our alignment monuments, we oriented the FARO to local gravity (the FARO levels and then orients itself to the local gravity at its current location), then used an SMR with our CPN set over each monument punch to measure the difference in Z for each monument (deltaZPSI-X = ZBTVE - ZPSI-X); we're essentially using the FARO as an autolevel to perform a differential height survey. Since we don't have direct line of sight to PSI-6 we set the CPN roughly inline with PSI-6 in X but set against the SUS rack so the FARO can see it (roughly 300mm +Y from the monument); this put the SMR on the vinyl floor, which we measured to be ~2mm thick using a set of calipers. This could add some error, as we're not directly over PSI-6 and therefore cannot account for any height difference between our location and the monument (such as variations in the surface height of the concrete), but it's the best we have given our line of sight restrictions (the West Bay is crowded, but it's the only place where we have a collection of monuments with a registered Z axis coordinate). Results and deltaZ from the old Rogers survey, all units in mm:
- Heights as measured with FARO
- BTVE-1: -539.9mm
- PSI-1: -1365.0mm
- PSI-2: -1366.3mm
- PSI-2: -1360.9mm
| |
Rogers As-Built Survey, 1997 |
FARO, 2024 |
Difference between Rogers/FARO |
| deltaZPSI-1 |
-826.3 |
-825.1 |
+1.2 |
| deltaZPSI-2 |
-827.5 |
-826.4 |
+1.1 |
| deltaZPSI-6 |
-822.4 |
-821.0 |
+1.4 |
So the FARO indicates that the Rogers As-Built survey from 1997 was not correct, so we adjusted the global Z axis coordinates for our 3 PSI monuments using the above FARO data. We then further adjusted the Z axis coordinates using the difference between the punch depth and the monument surface. This gives us the following global Z axis coordinates for our alignment monuments, all units in mm:
| |
New global Z using FARO height |
Global Z for bottom of monument punch |
| BTVE-1 |
-1057.2 (unchanged) |
-1058.0 |
| PSI-1 |
-1880.8 |
-1881.9 |
| PSI-2 |
-1877.7 |
-1878.4 |
| PSI-6 |
-1876.2 |
-1876.8 |
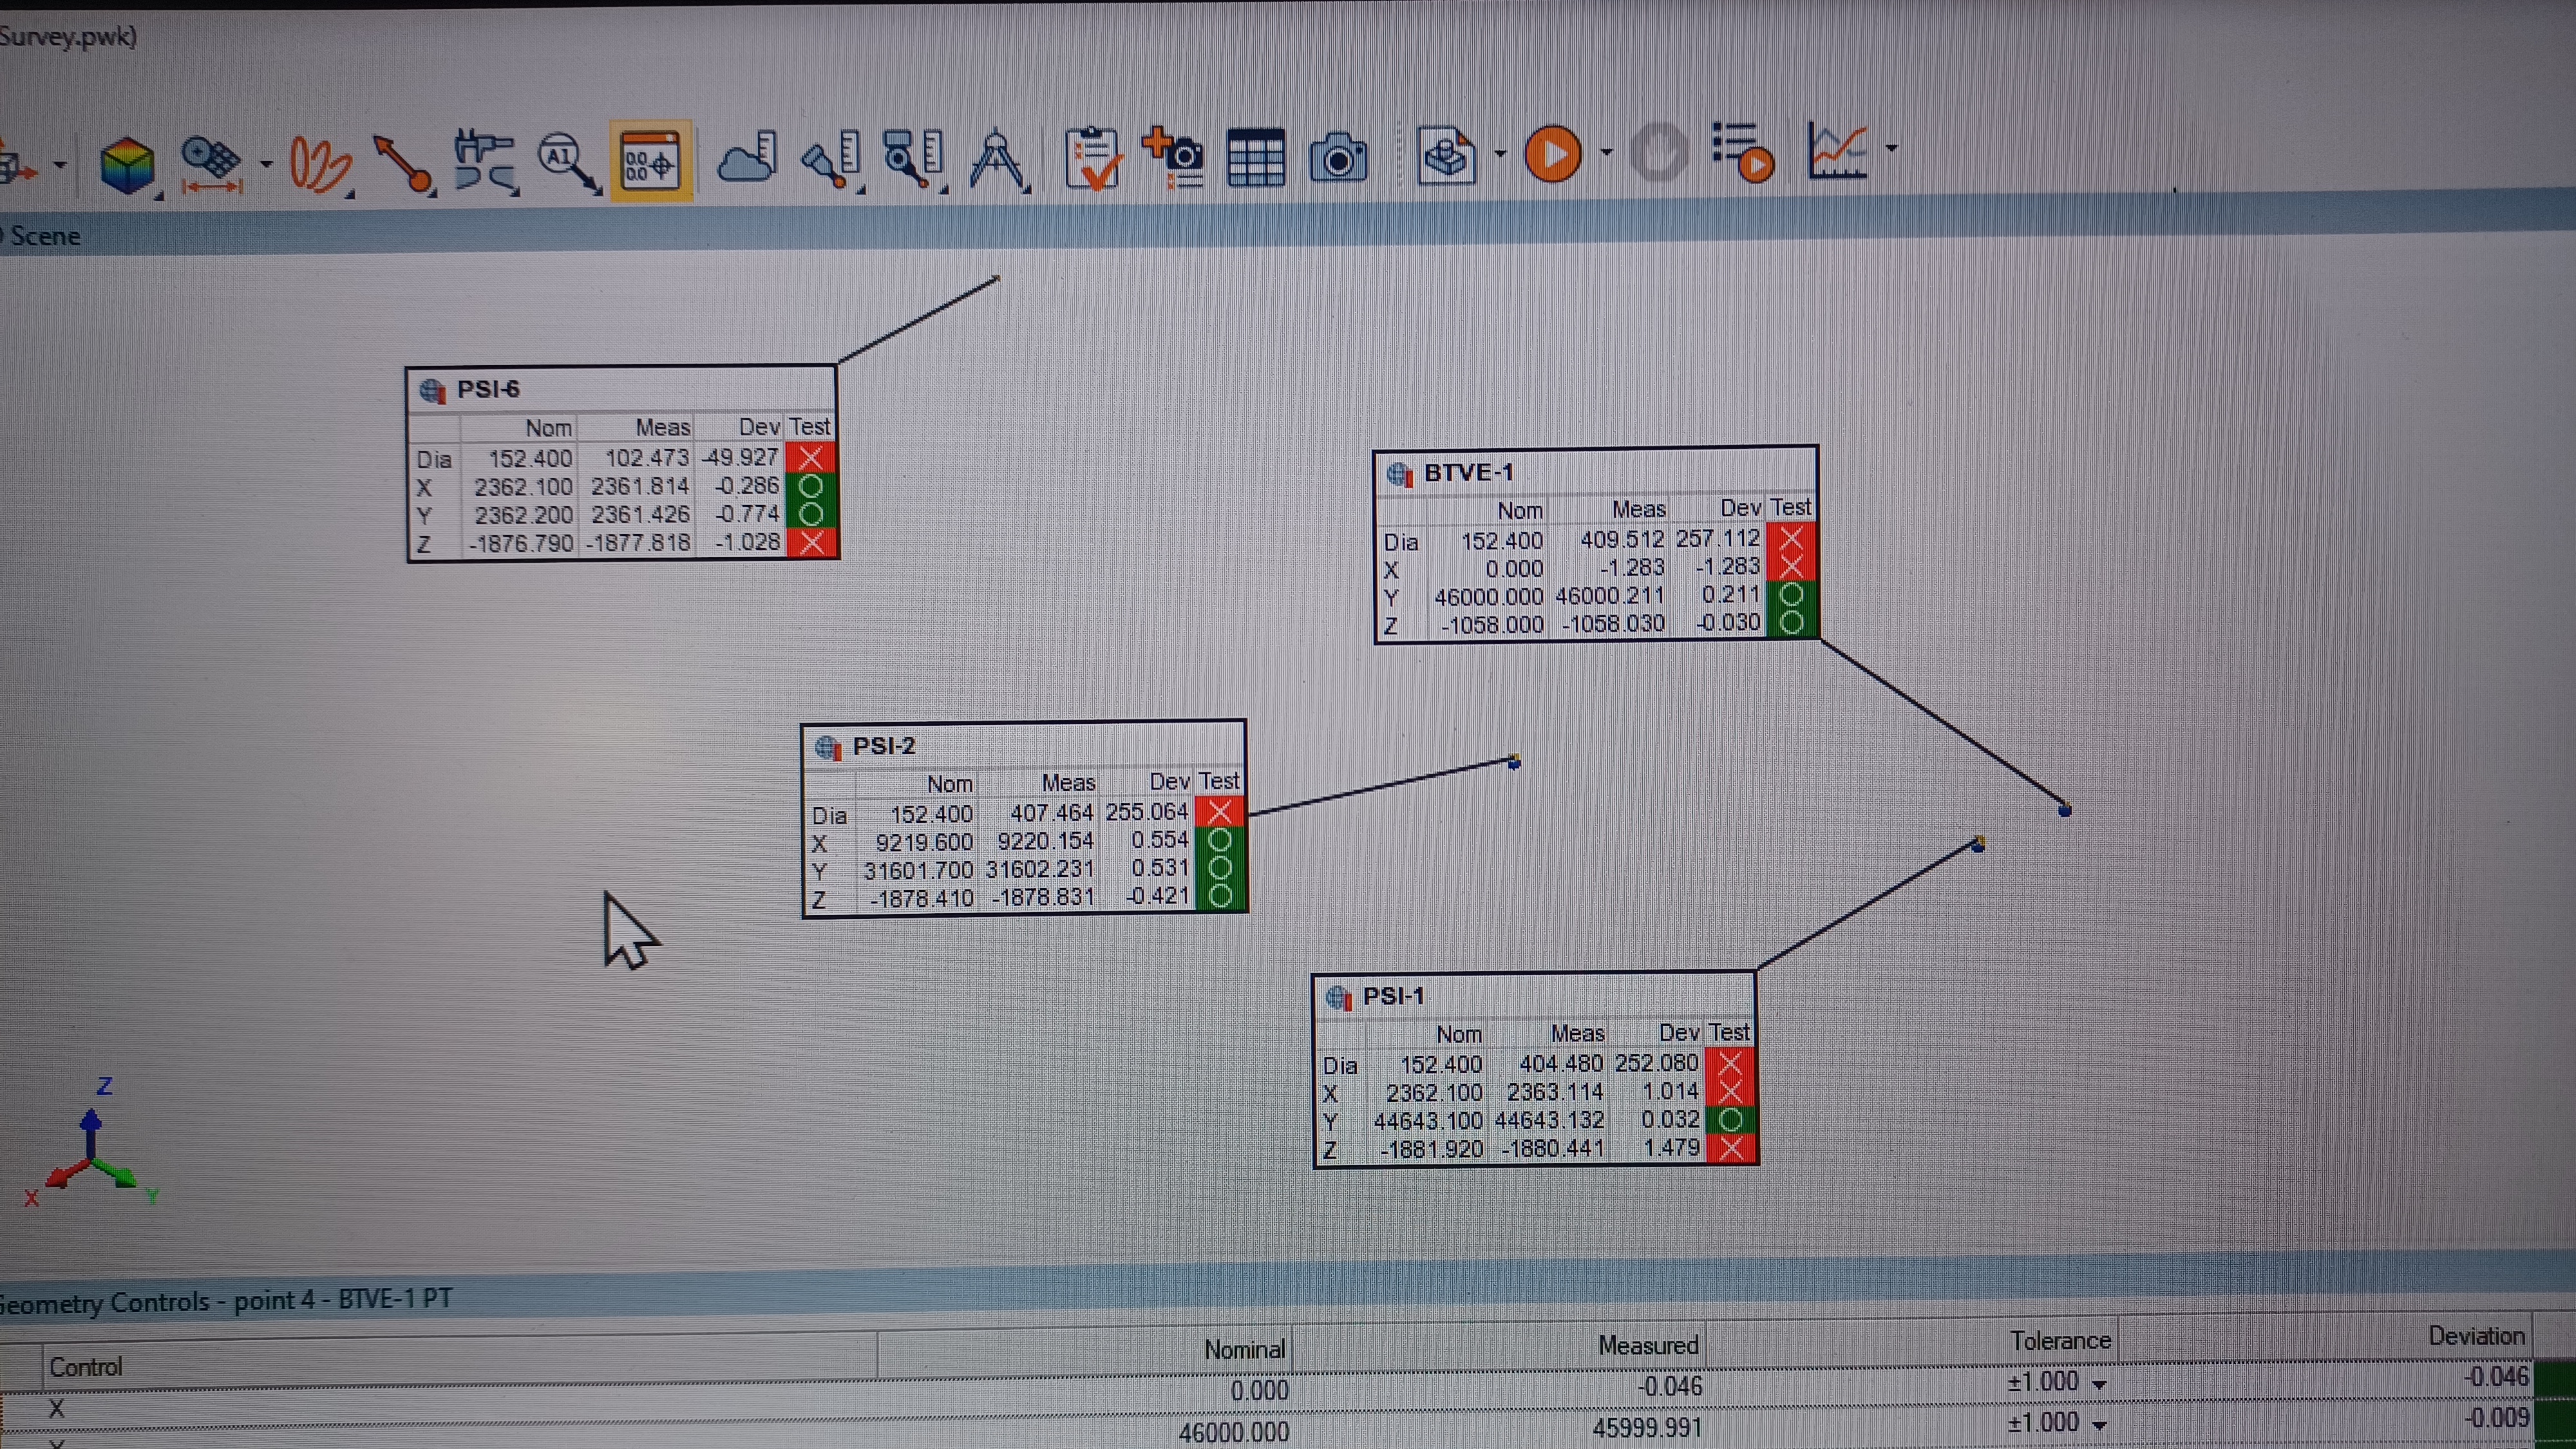
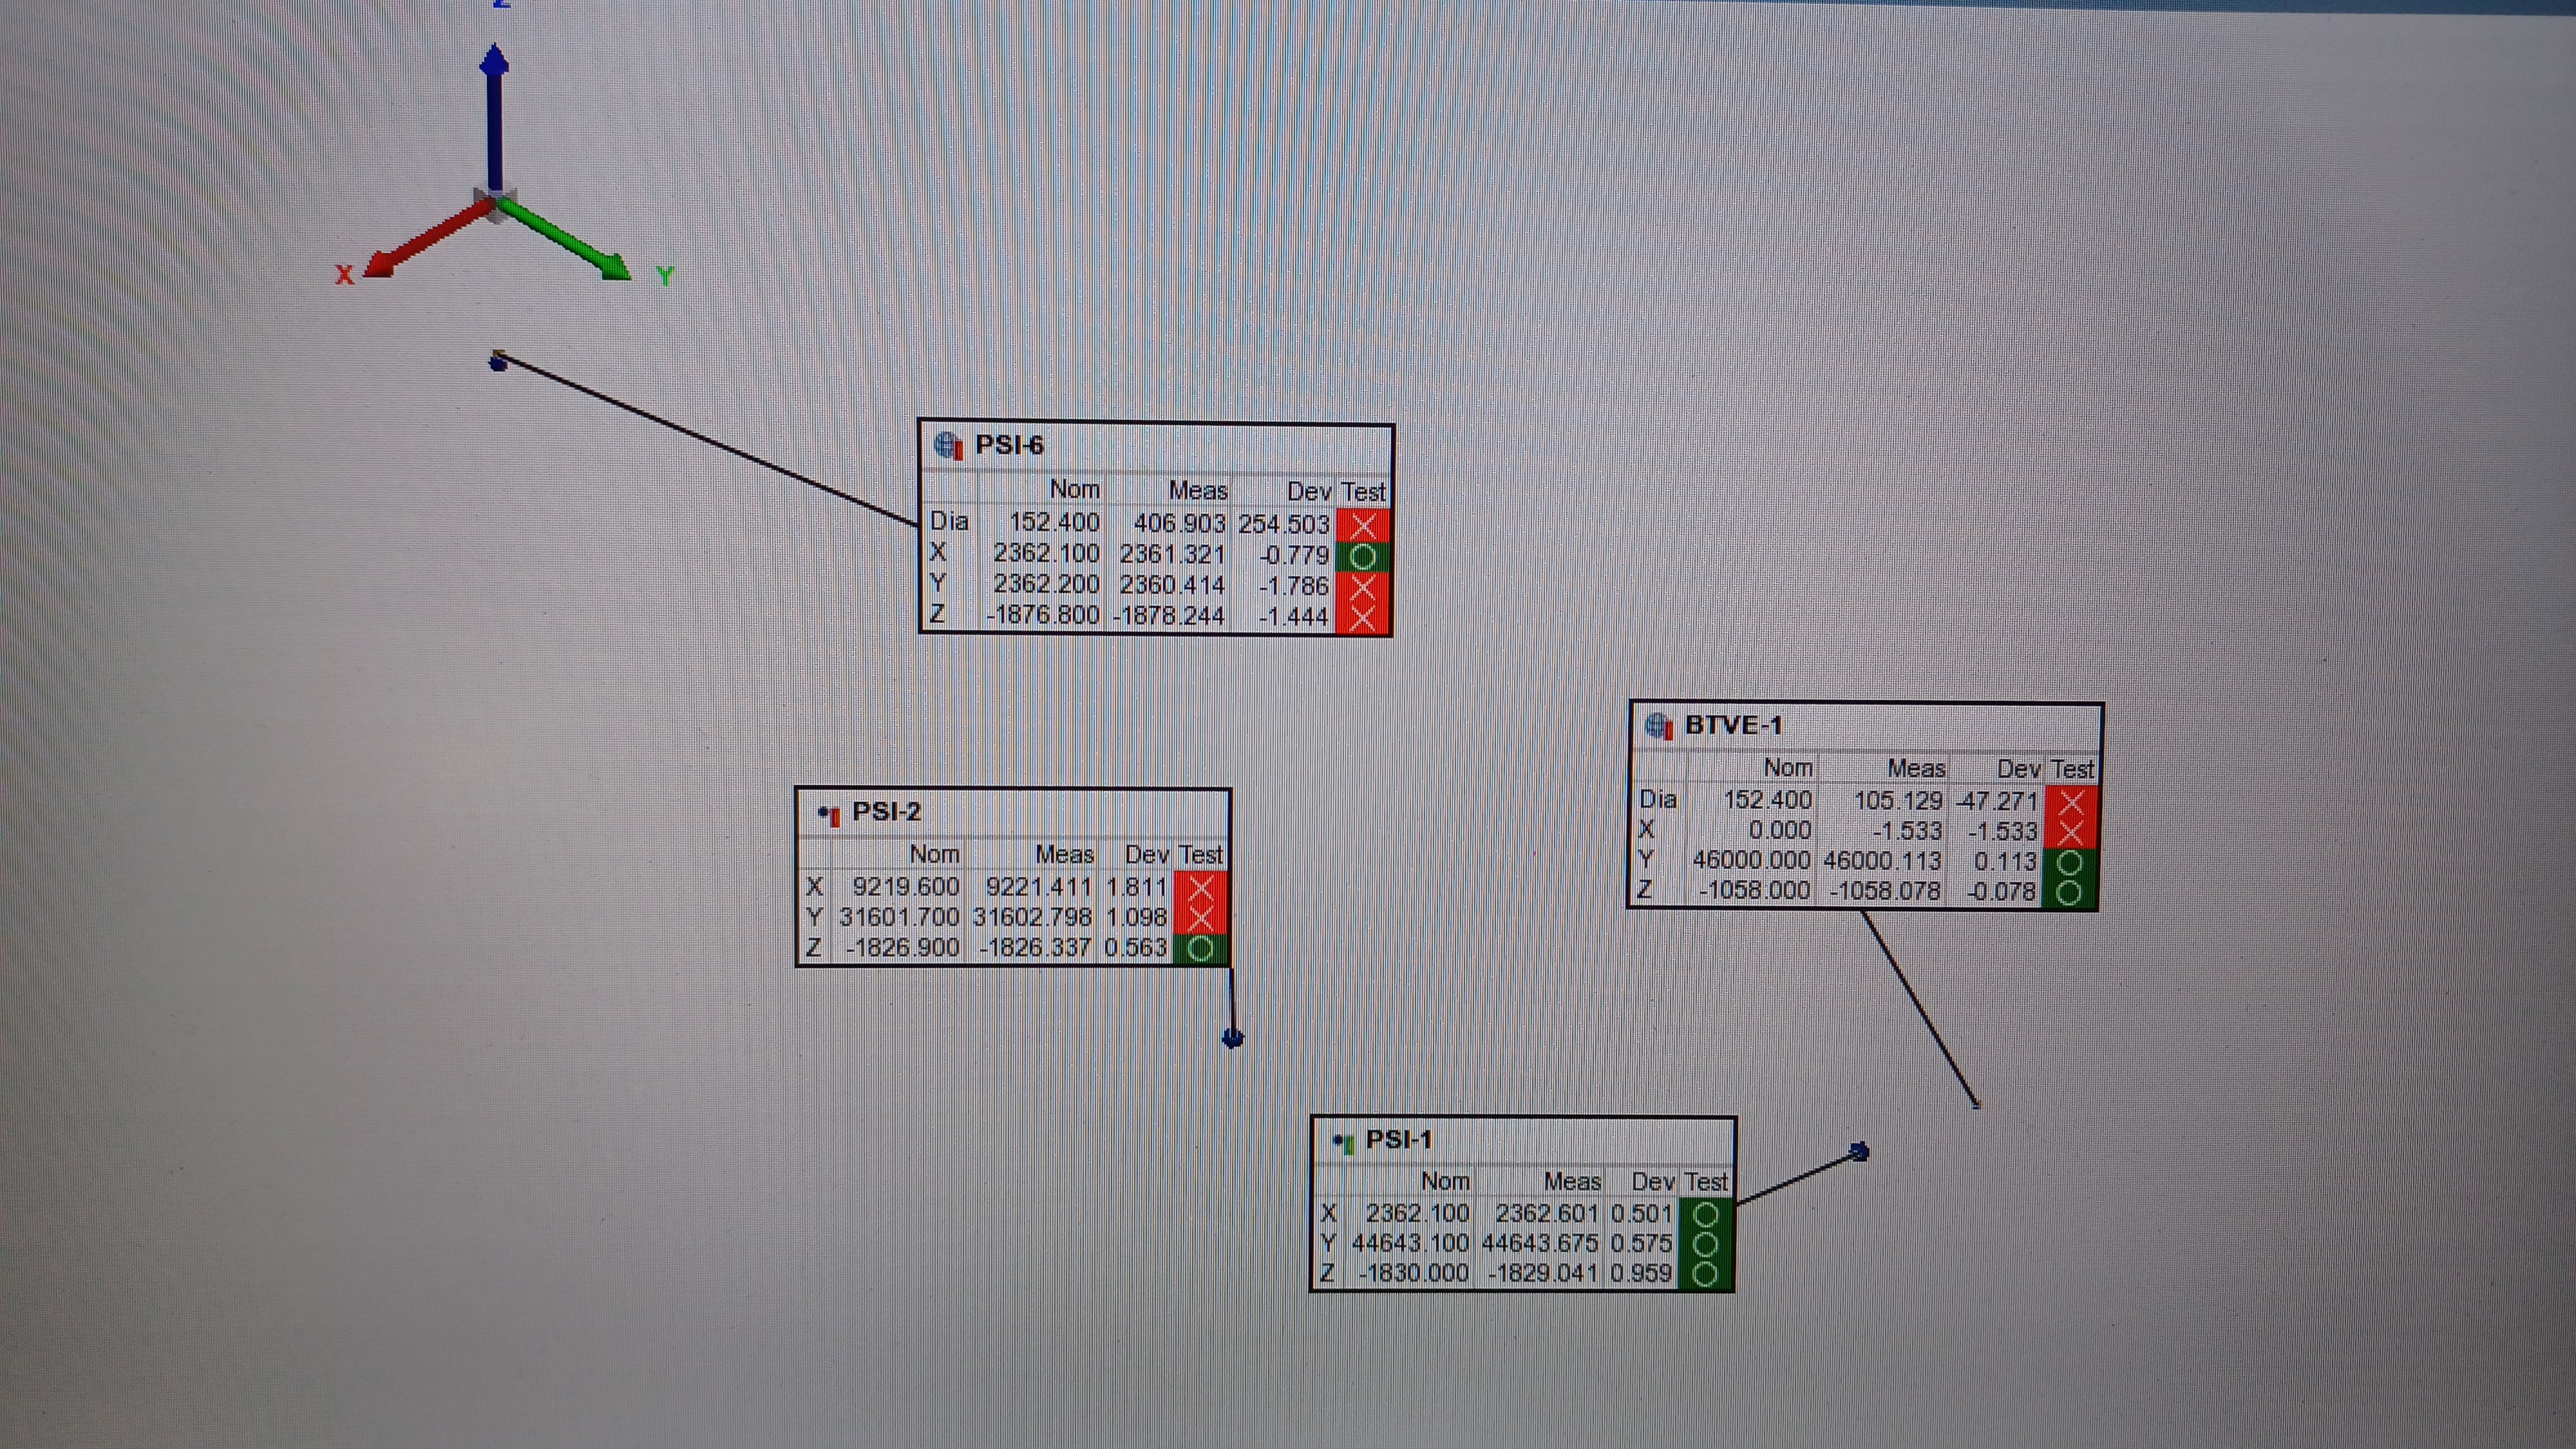
We then used these new global Z axis coordinates for the bottom of the monument punch to align the FARO to our global coordinate system, results shown in the 4th picture. We created points based on the global Z of the monuments themselves, and performed a Build/Inspect operation to get our deviations in X, Y, and Z (again using the CPN to place the SMR over the monument punch; the CPN registers to the monument surface); these results are shown in the final picture. As can be seen, the reported X and Y axis measurements are good to better than 0.05mm, but we still have some significant error in Z. It's much better than the ~1.5mm we were seeing previously, but nowhere near as good as X and Y.
We also noticed from the FARO's position that we could see height monument 903 (information in T1100187); this height mark is registered to the local LVEA coordinate system, and is on a metal post. Using a autolevel we placed a temporary magnetic SMR nest in line with the height mark. From this we could get X and Y coordinates for a spot very close, but not exactly on, the height mark (X is right on it, but Y is roughly 1" +Y). With these X and Y coordinates we can transform the registered local Z coordinate to a global one (see T0900340) and compare to what the FARO says (the ~1" offset in Y is not an issue, as the Y axis tilt is very small at 12.5µrad, which causes a 0.3µm error in the global Z (yes, that's micrometers)). We did this very quickly with a cell phone calculator, and did not get a screenshot or picture of the results (my fault), but the FARO thinks that height mark 903 is ~4.2mm higher than we would expect after converting its local Z to a global Z. We have no other height marks we can place a nest by to do this same measurement, so we currently have no way to know if this error is in the height mark itself or something with the FARO (or a combo of the 2). Will have to move the FARO around (which we can do accurately, see next section) to find something else to look at.
What's causing this error? At this point in time we are not sure. Some thoughts:
- It could be due to an issue with the alignment routine; as can be seen from the collection of 3" sphere fit rod alignment results, we aren't able to get much consistency. This could be due to differences in probing technique with the sphere fit rod, so we want to repeat this with someone else probing the monuments (Ryan probed the monuments while I ran the software, we want to swap and repeat).
- It could be due to the sphere fit rod itself. Since we're limited in how much of a sphere we can trace, it's possible the internal sphere fit that PolyWorks does is not able to accurately locate the center of the sphere as it relates to the position of the tip of the rod, thereby causing error in the alignment.
- The coordinates we have could be wrong. We're trusting 25 year old survey data, because we have nothing else. Any errors in those initial surveys would cause errors in our FARO alignment.
Moving FARO
We were able to move the FARO into the biergarten area using a collection of glued nests (set during FCT install) and magnetic nests. This was done independently of our gloabl coordinate alignment work. We were aligned to our global coordinate system (although we're still questioning the accuracy), but only looking at how accurately we could move the FARO (device target deviations between moves and device positional uncertainty at each location), which does not depend on being accurately aligned to any set coordinate system. When doing a move you want a minimum of 3 targets, but PolyWorks support has repeatedly told us that you really want at least 6. While the software will use 3, using 6 or more greatly increases the accuracy of the move. We were able to use roughly 8 targets to move into the biergarten area and back out near the Test Stand. In total we did 3 device moves for a total of 4 device positions: position 1 at our intial setup point, position 2 closer to the FCT to have better line of sight into the biergarten, position 3 in the biergarten area but outside of the cleanroom, and position 4 back in the West Bay near the test stand. The largest target deviation we saw between device positions was ~0.2mm. In addition, PolyWorks has a routine to calculate the positional uncertainty of the FARO. This routine reported a positional uncertainty of <0.05mm for each device position, indicating that we can accuratly move the FARO around. This was good to confirm, as we're going to have to move the FARO around the LVEA to find other monuments with known global Z axis coordinates to test our global coordinate system alignment.
Next Steps
- Have someone else probe the monuments, to check if probing technique has a measurable affect. Maybe we need to refine our technique here.
- Move the FARO around to find other monuments with known global Z axis cooordinates to test our alignment.
- Our main option here is other PSI monuments, but I question how useful this will be. The FARO indicates that the old local Z coordinate survey from 1997 was incorrect, which now brings into question the Z axis coordinate for every PSI monument in the LVEA. It would be great if we could perform the same differential height survey with other PSI monuments, but to do so we need line of sight to BTVE-1. There's too much stuff in the way, including existing unused H2 infrastructure, to make this practical. Need to think of something else.
- Assuming we're happy with the global coordinate system alignment, begin mapping existing LVEA monuments.
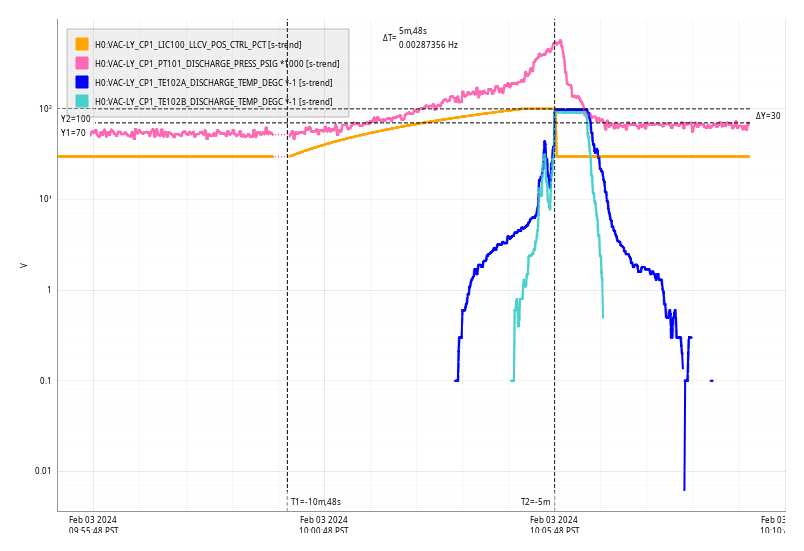

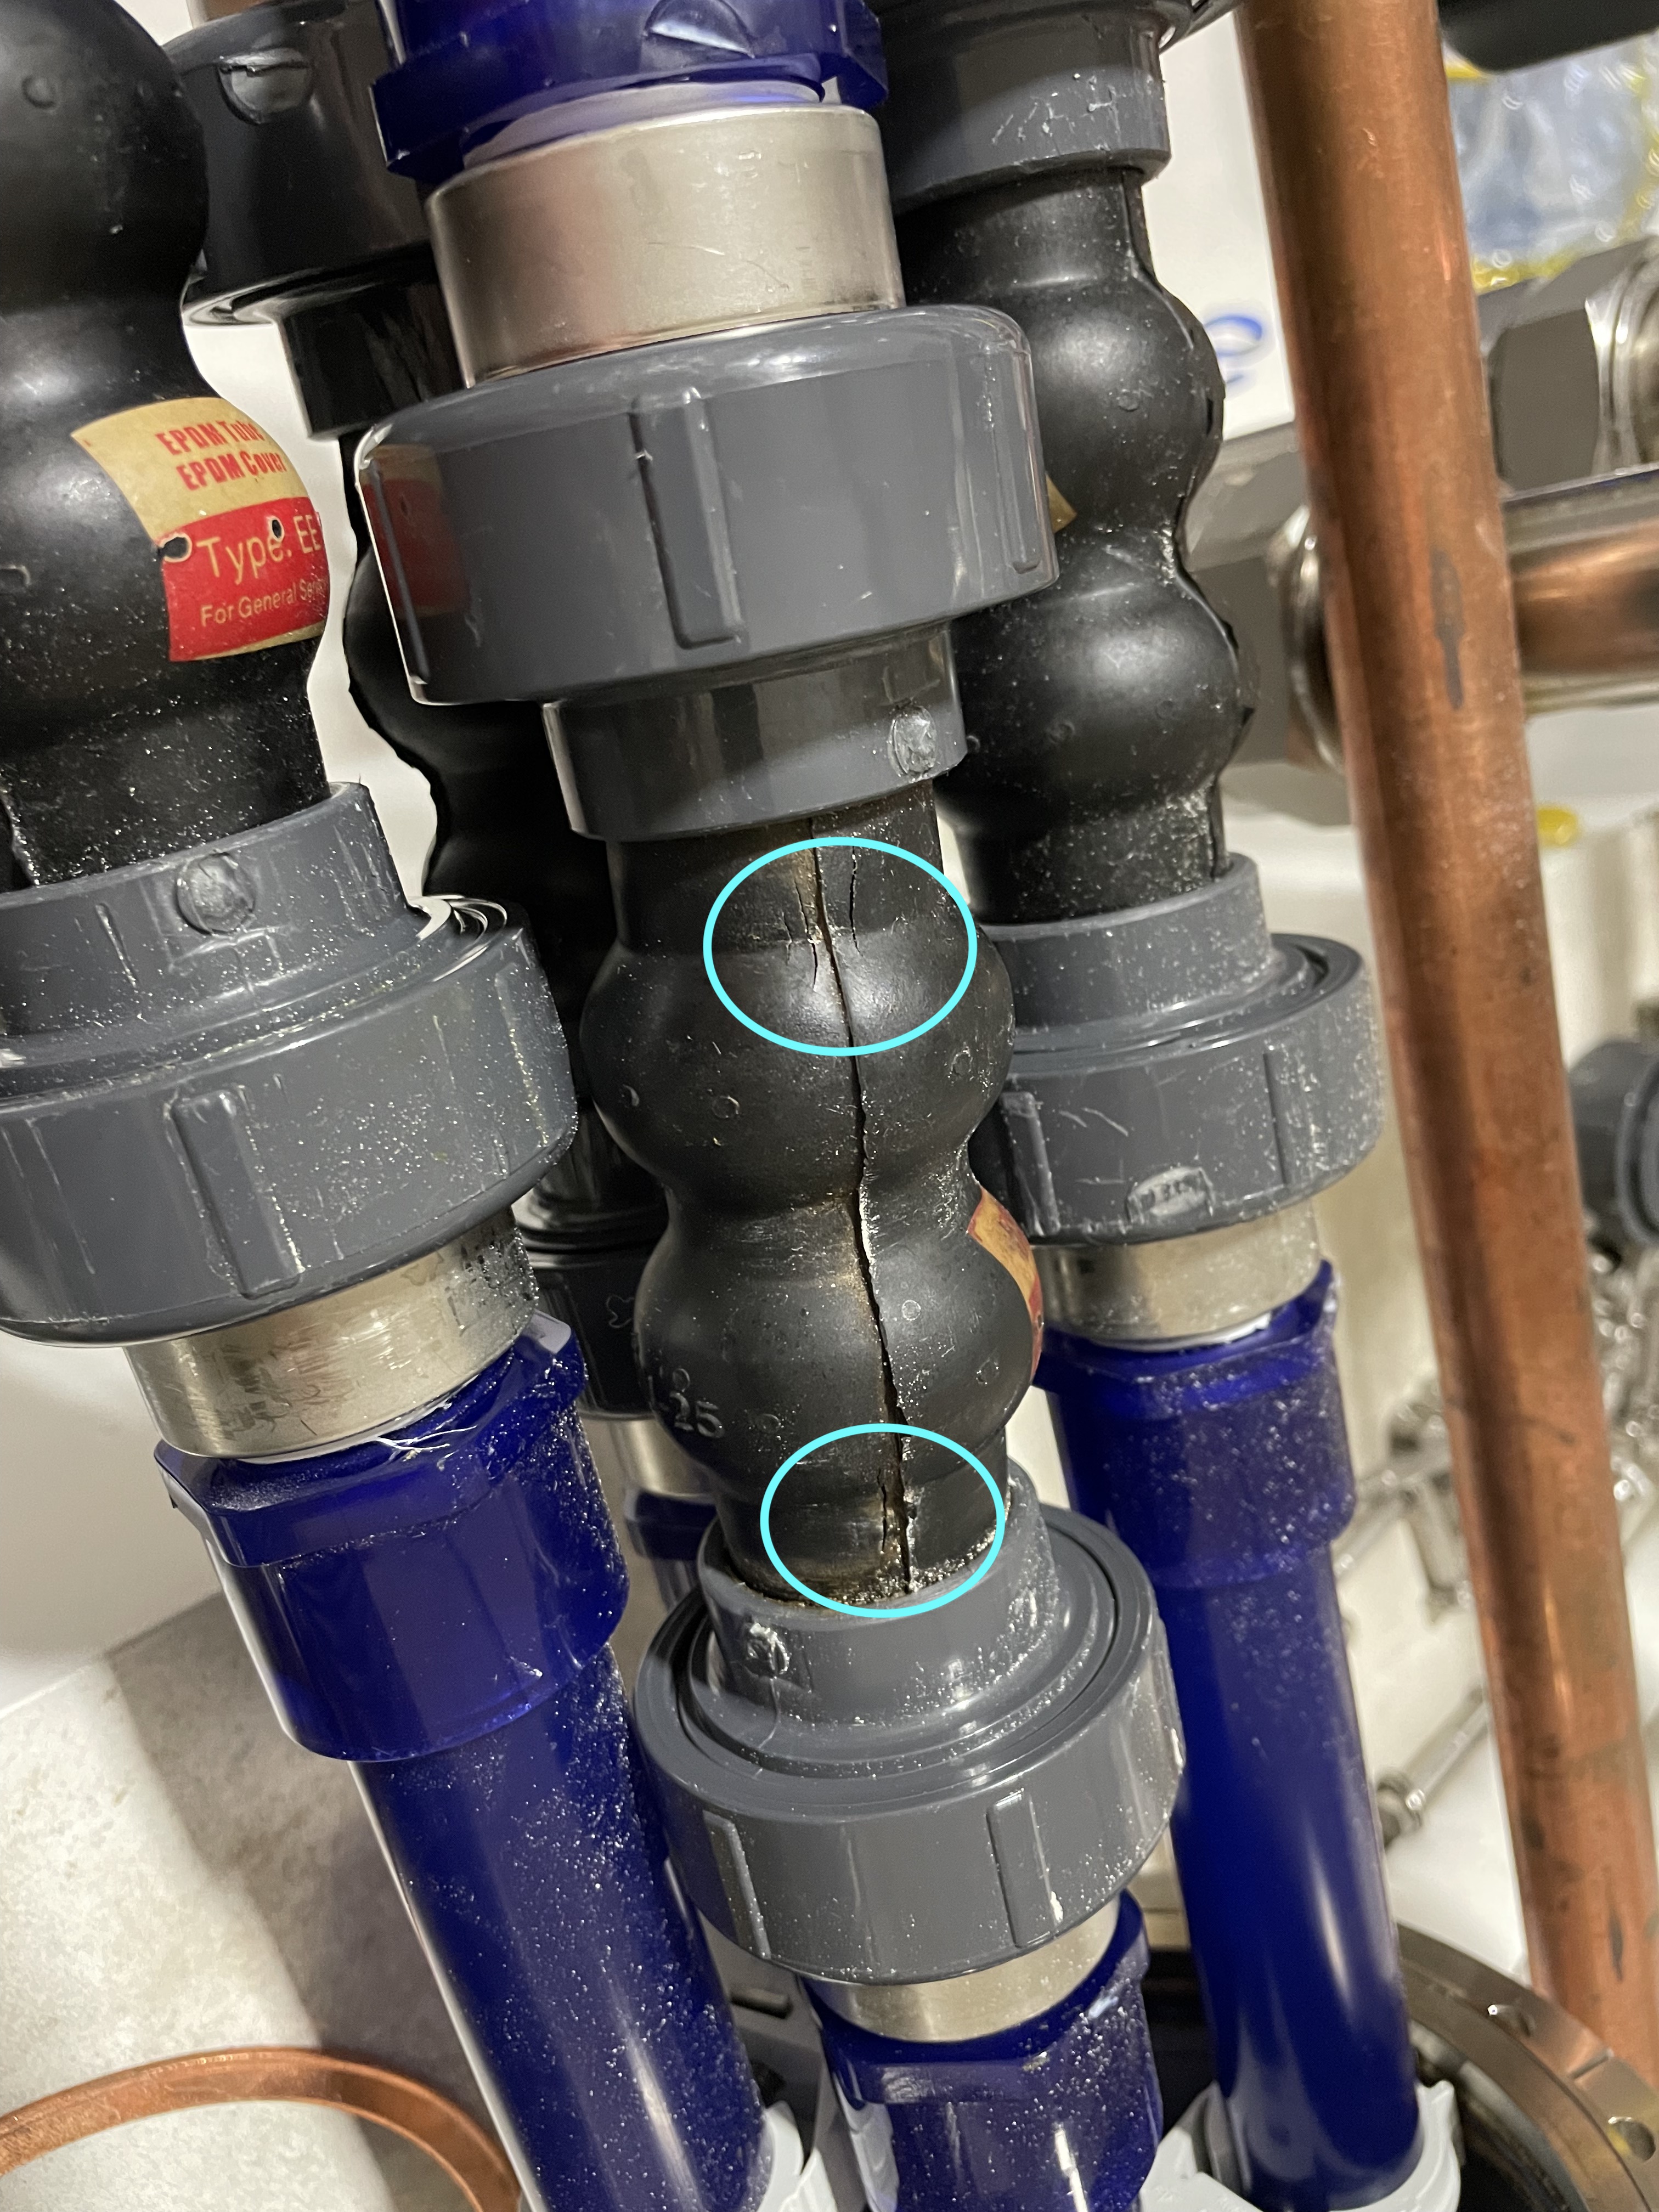

h1hwsey suffered a kernel crash. Photo of the console including stack trace is below. I rebooted the server and it came back up ok.