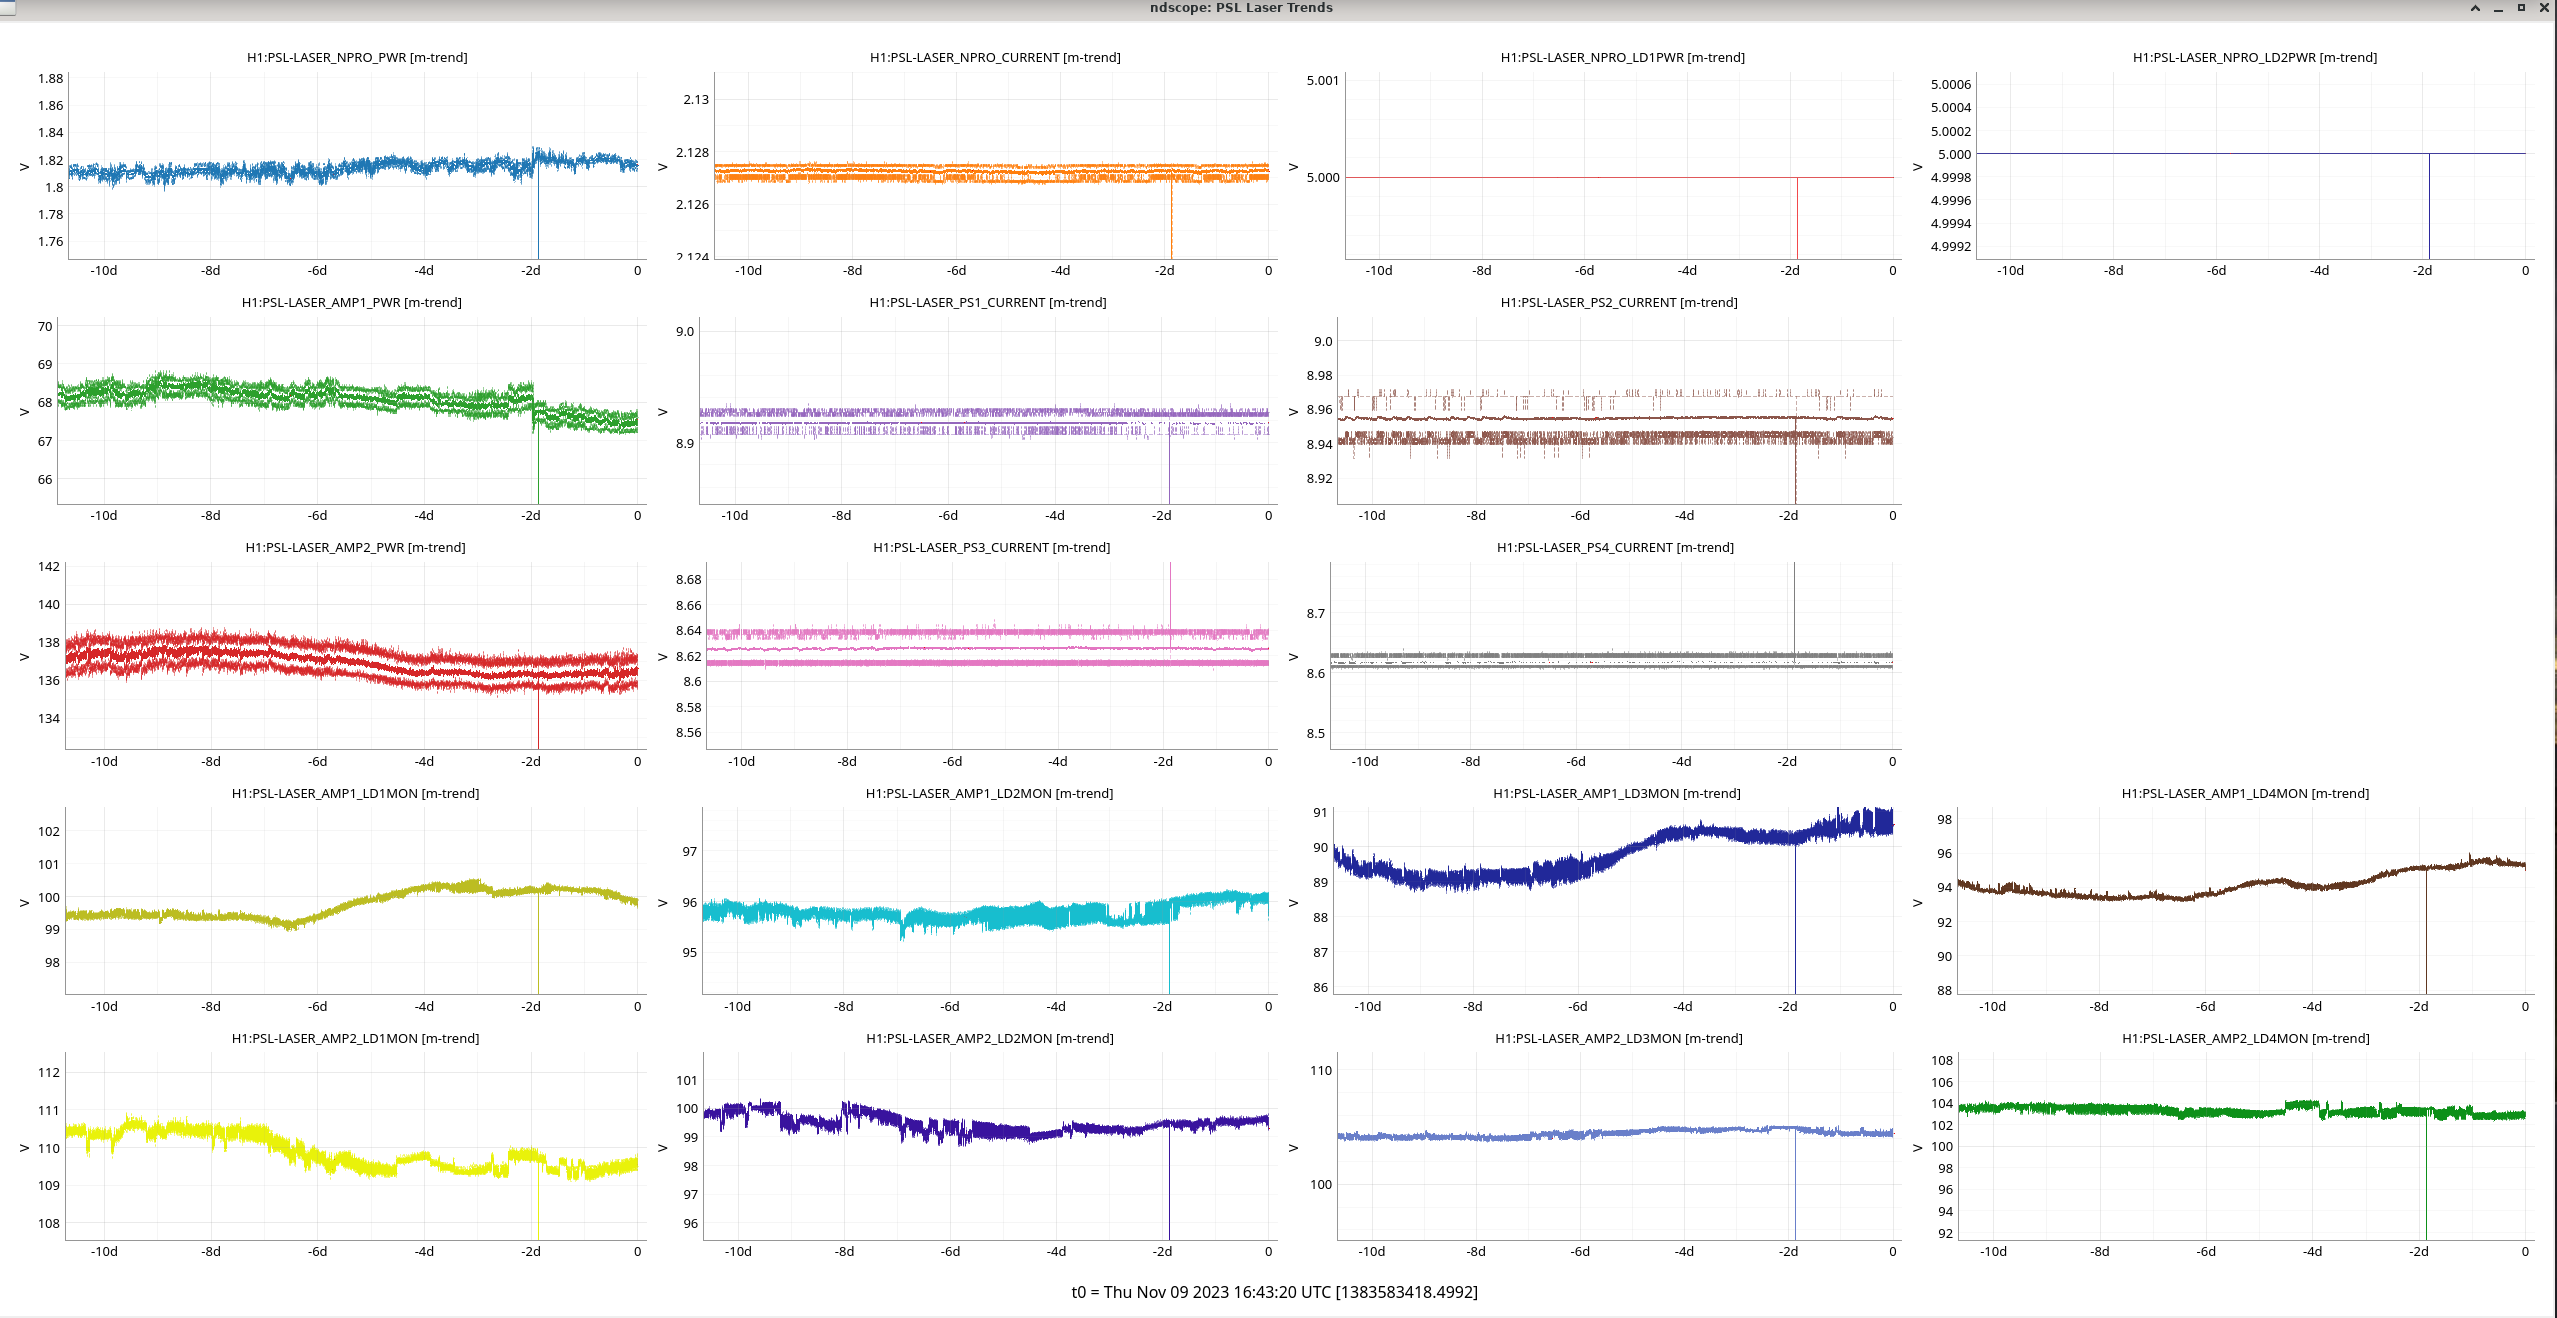
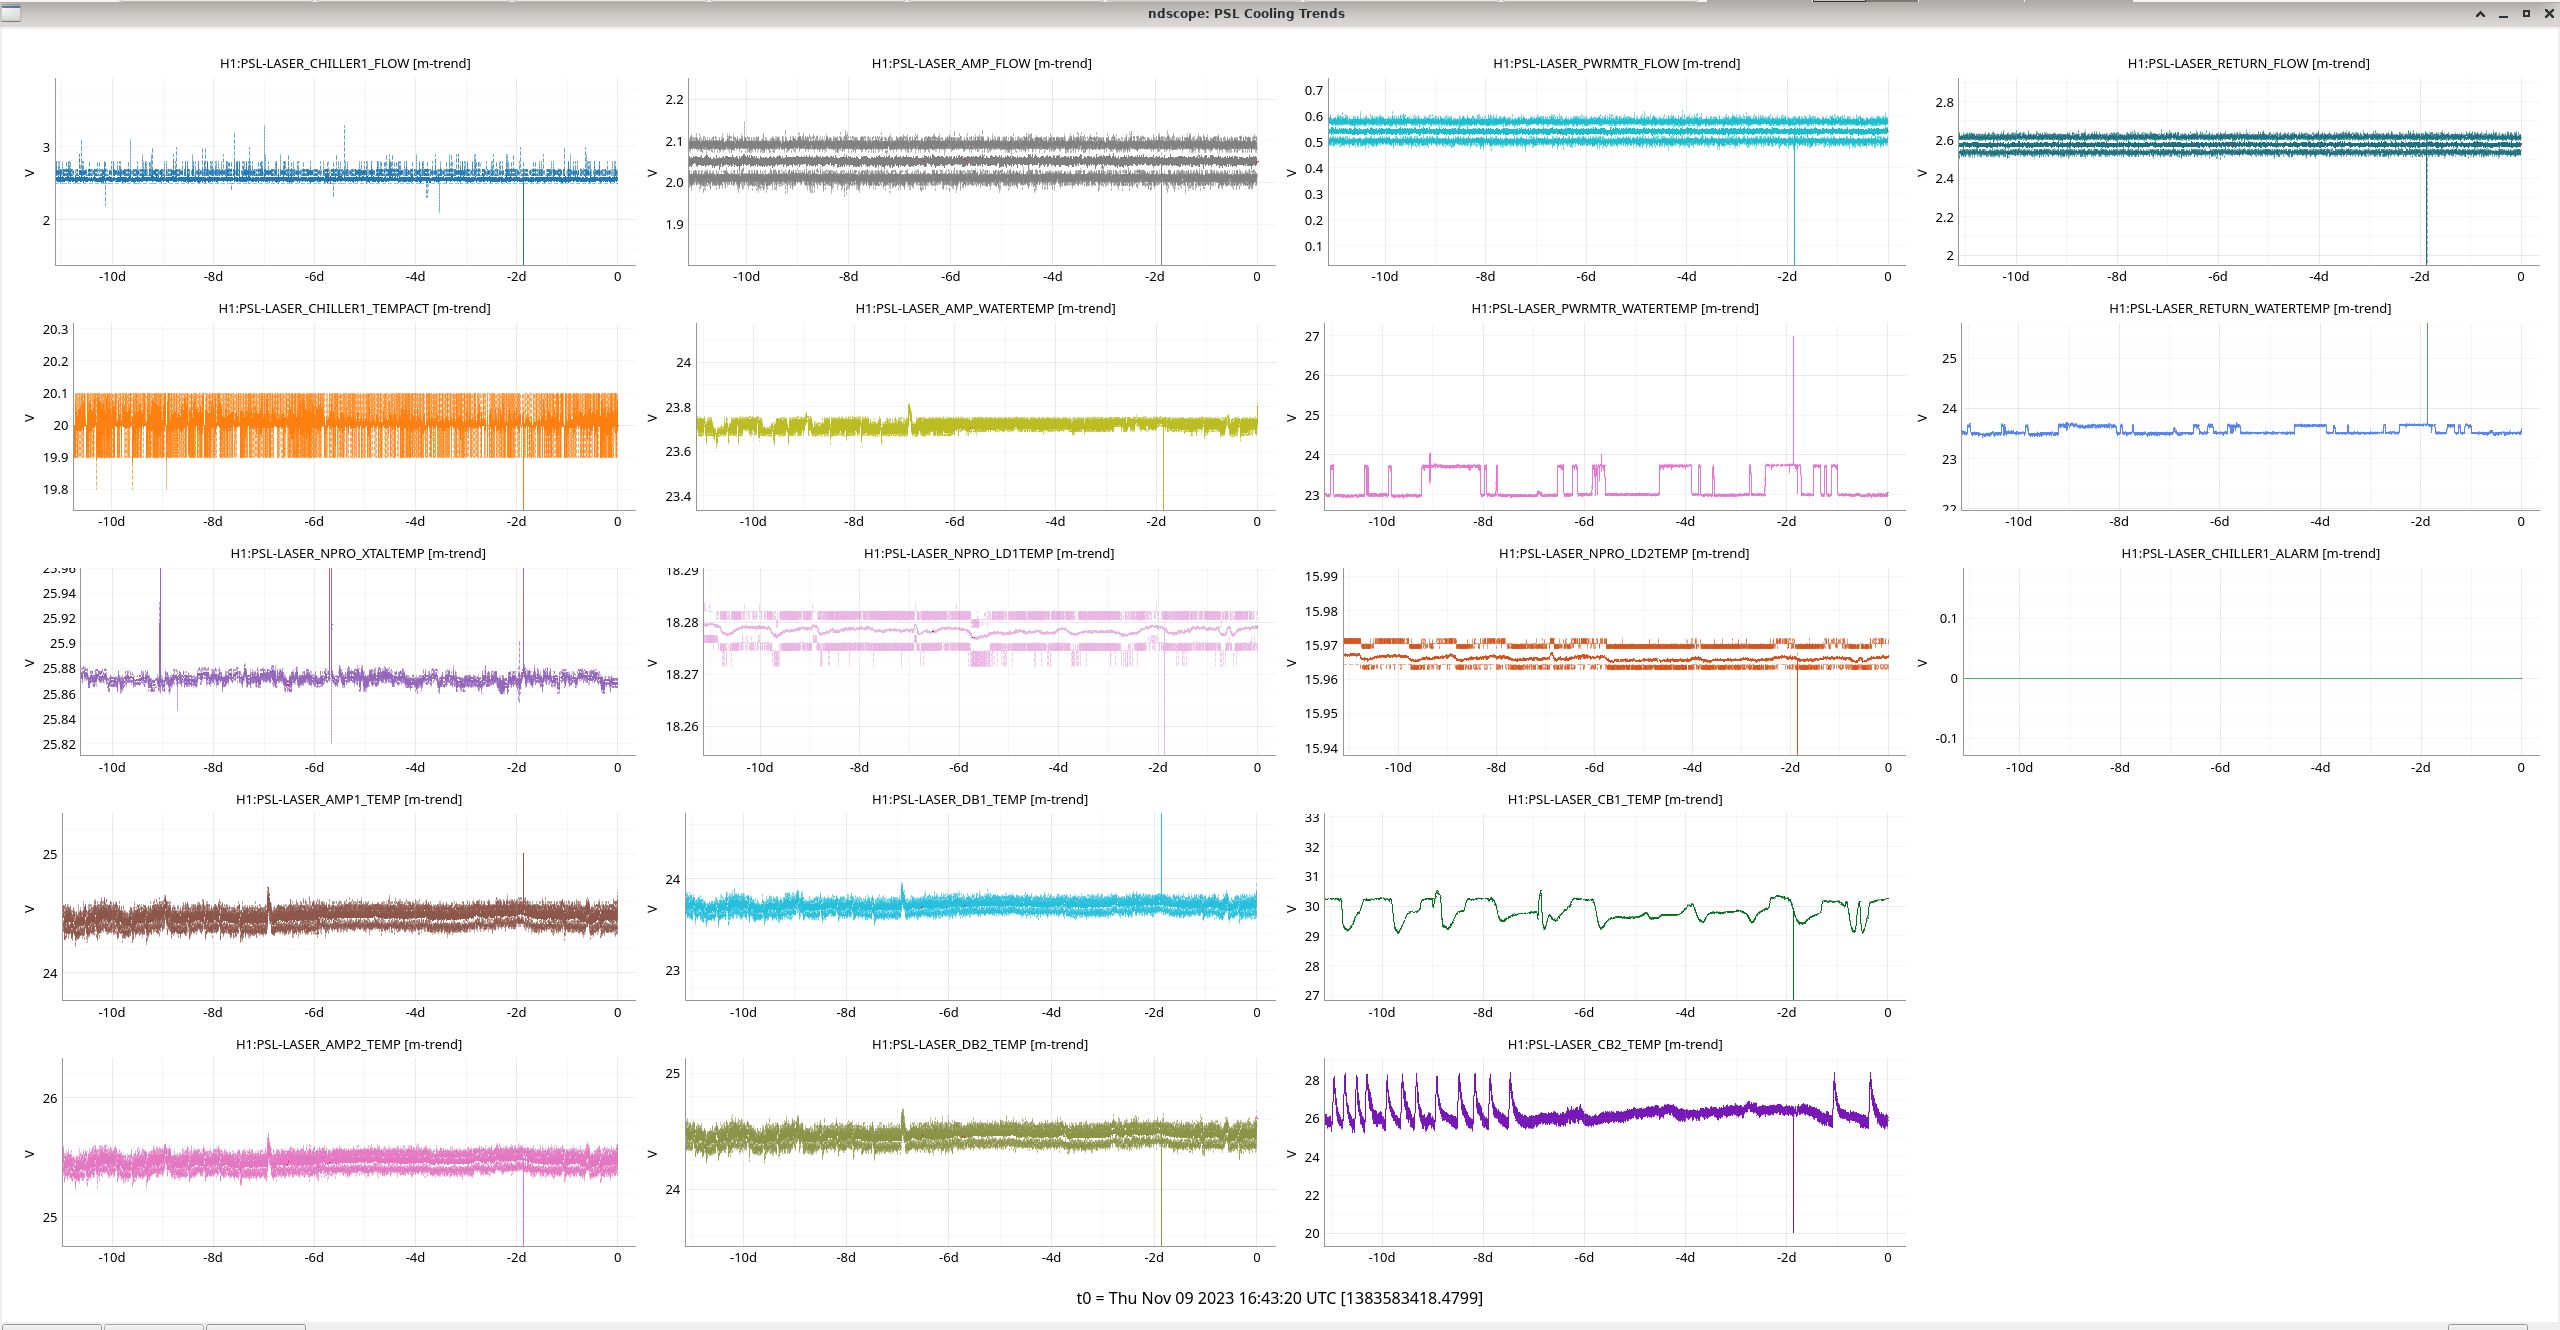
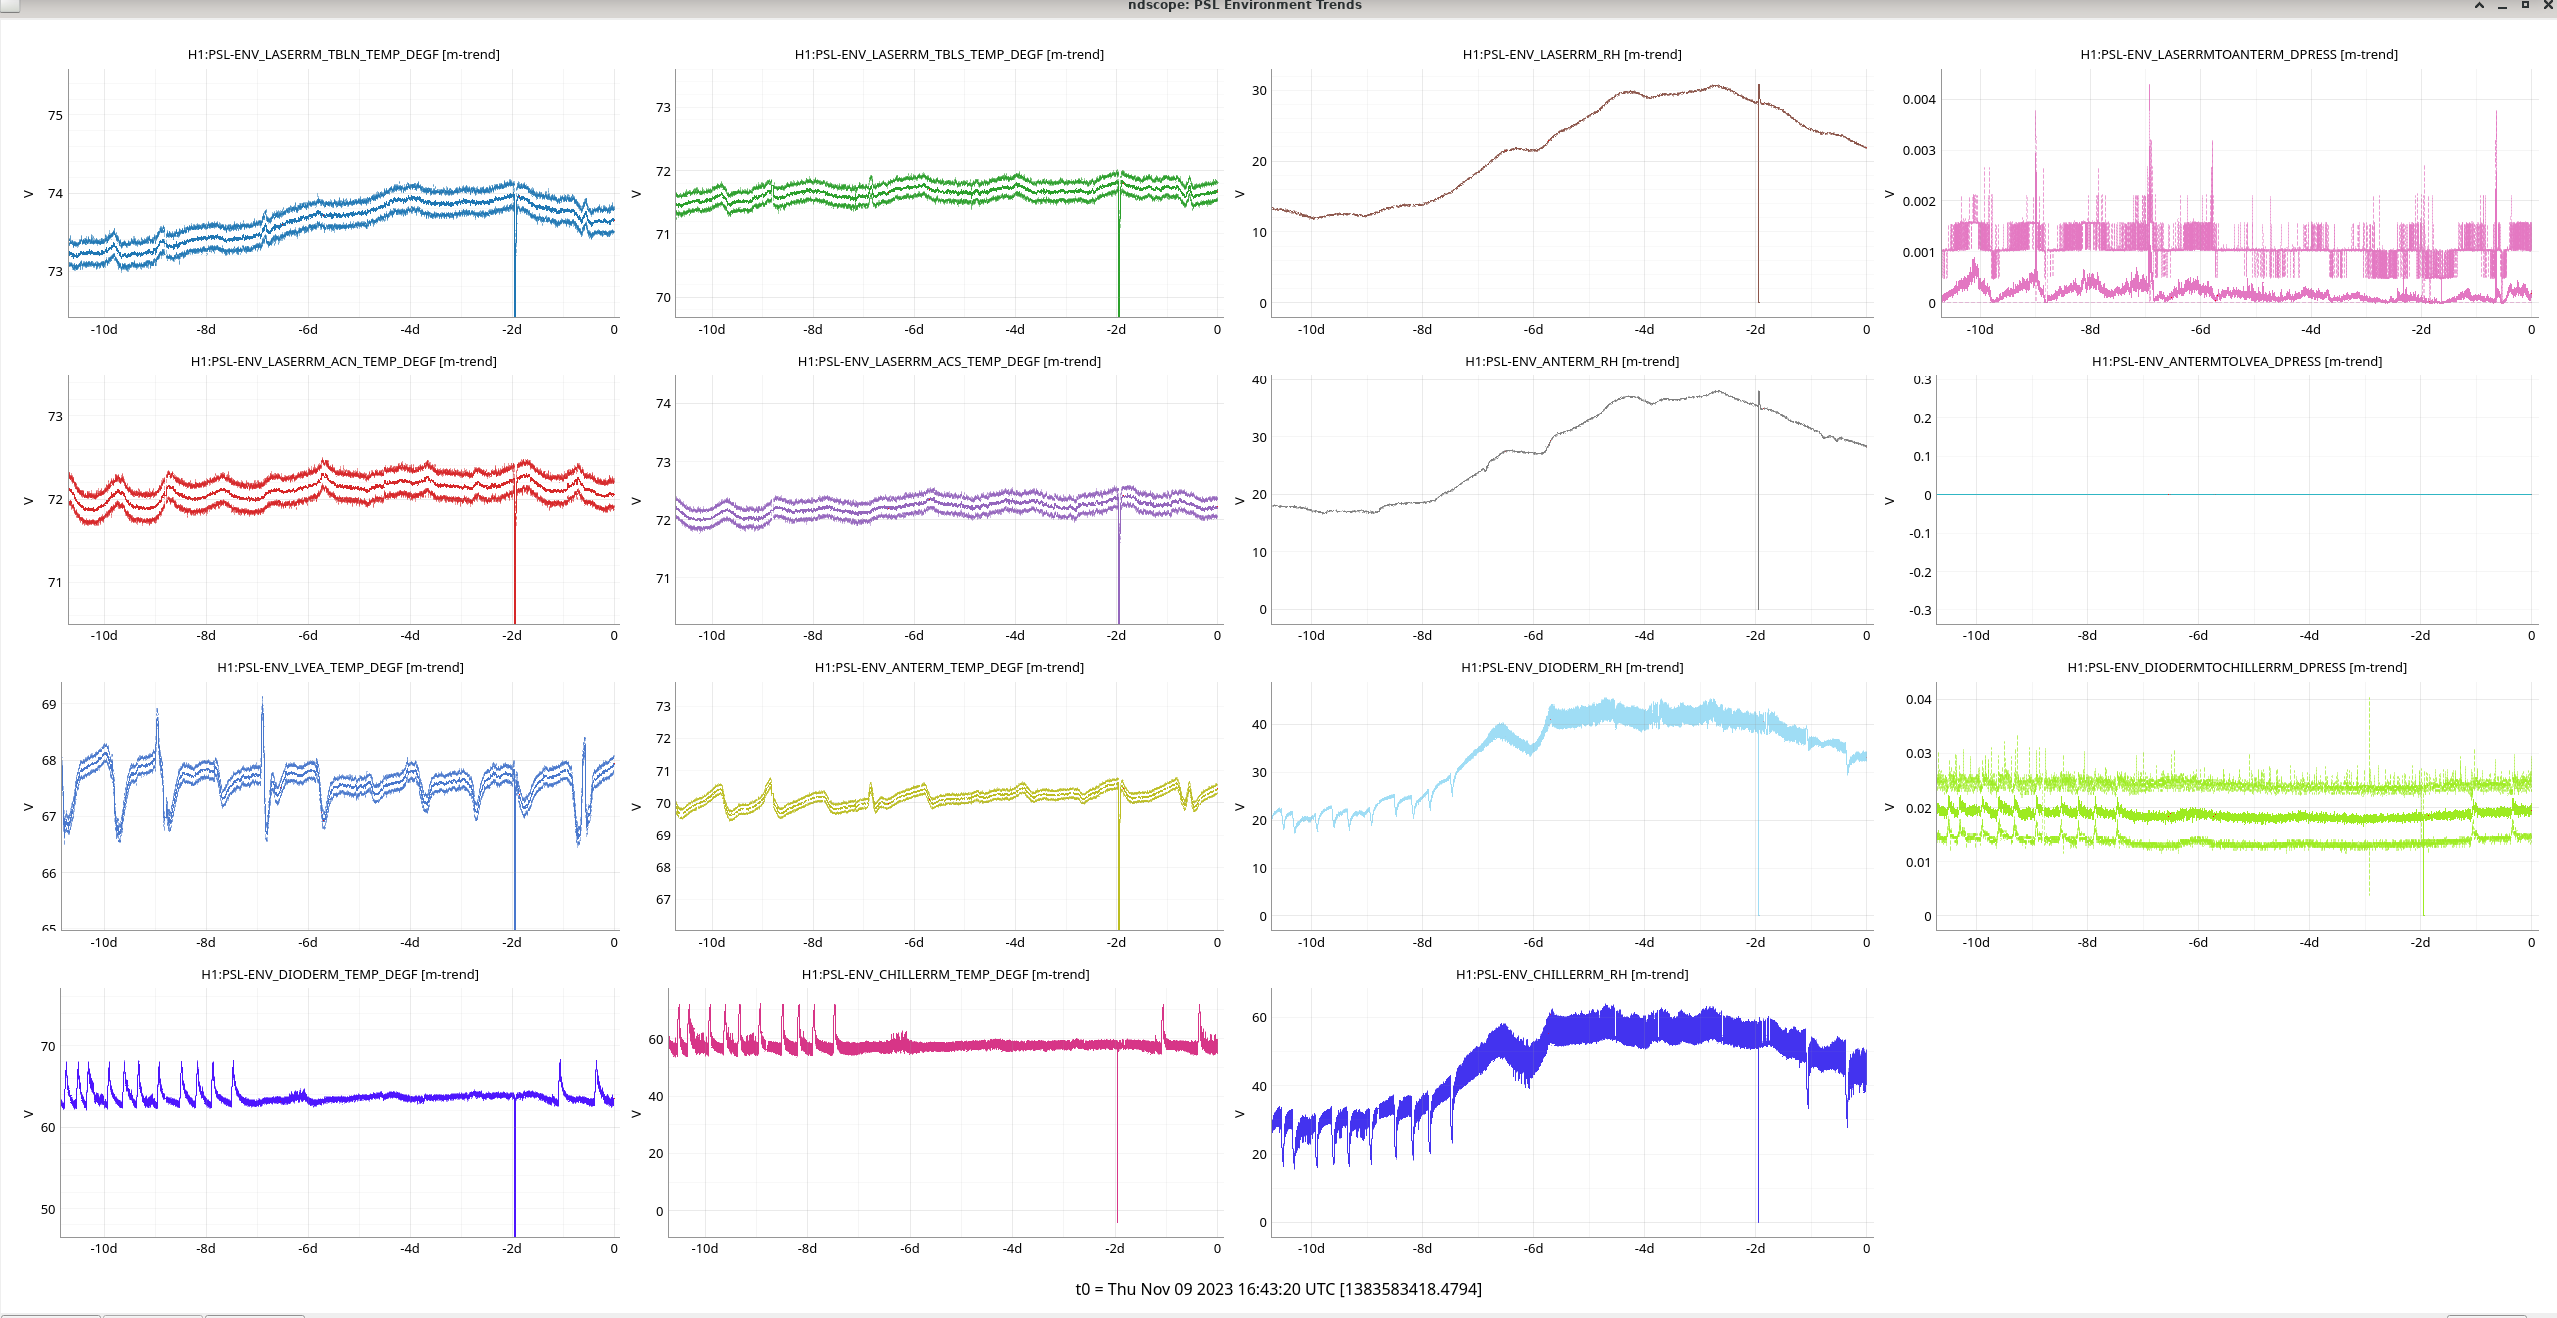
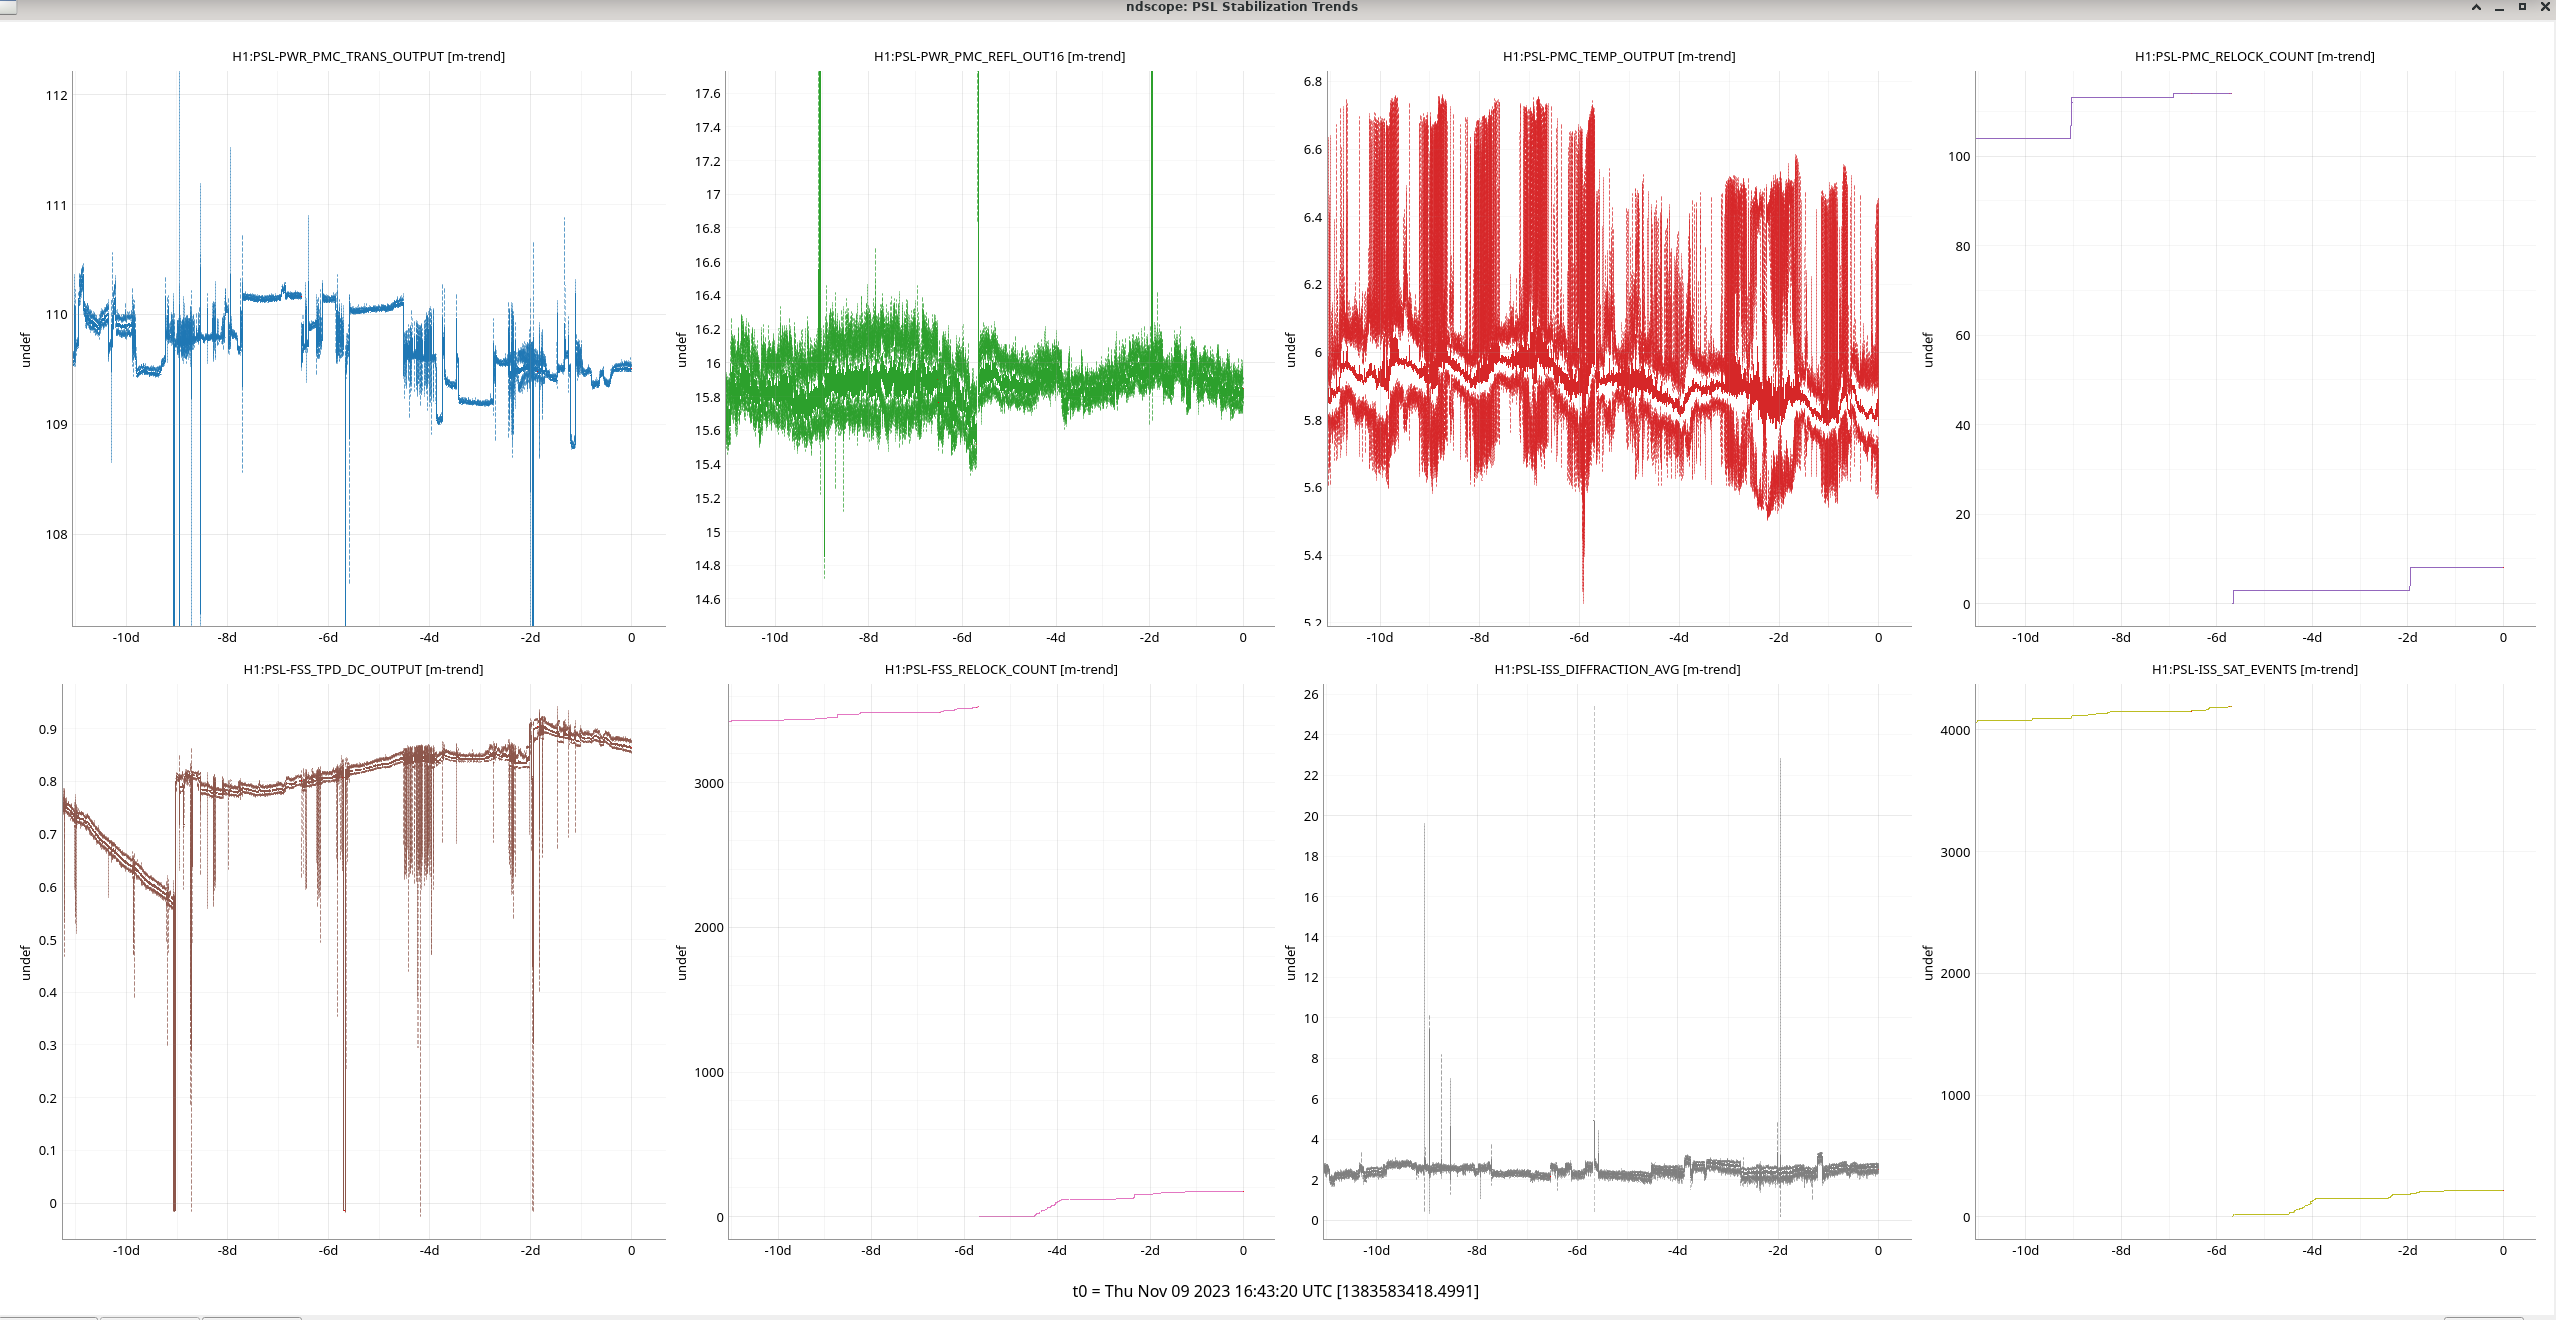
Closes FAMIS 20000
The only thing to note that I noticed is that the FSS, PMC relock count and ISS sat count was reset on 11/04.
TITLE: 11/09 Day Shift: 16:00-00:00 UTC (08:00-16:00 PST), all times posted in UTC
STATE of H1: Observing at 158Mpc
OUTGOING OPERATOR: Ibrahim
CURRENT ENVIRONMENT:
SEI_ENV state: CALM
Wind: 3mph Gusts, 1mph 5min avg
Primary useism: 0.03 μm/s
Secondary useism: 0.51 μm/s
QUICK SUMMARY:
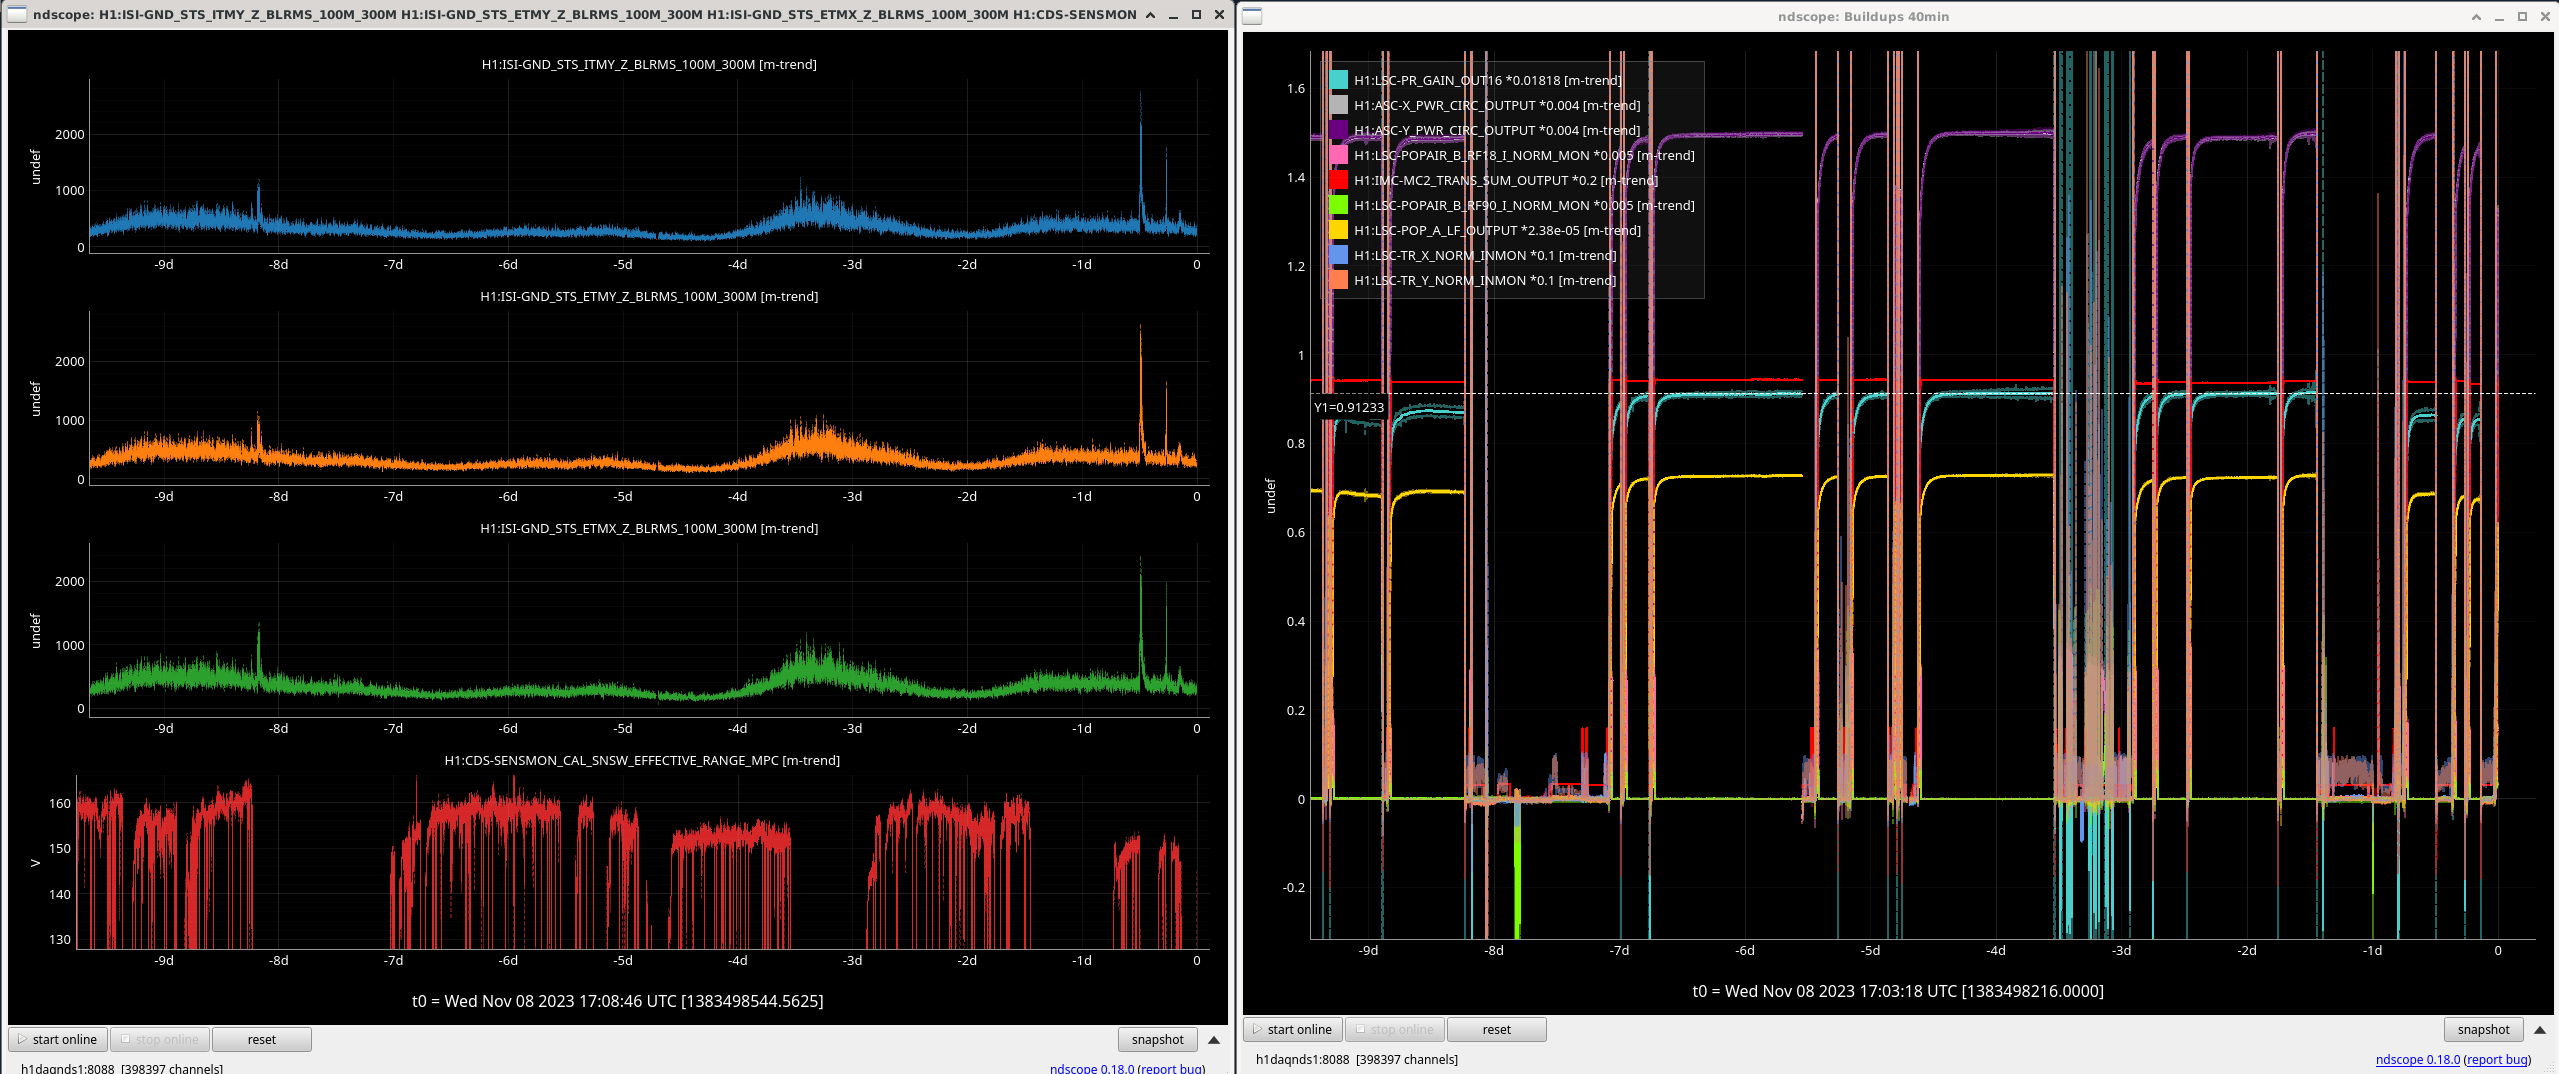
Observing and have been Locked for 17.5 hours. Secondary useism has been going up over the past 12 hours.
TITLE: 11/09 Eve Shift: 00:00-08:00 UTC (16:00-00:00 PST), all times posted in UTC
STATE of H1: Observing at 164Mpc
INCOMING OPERATOR: Ibrahim
SHIFT SUMMARY:
Busy start to the shift with commissioning finishing immediately followed by calibration measurements, going to observing and then Robert running some fan-OFF tests while in Observing. Then after that it was a fairly nice & quiet shift. The range is much better tonight than last night!
LOG:
H1's been locked the whole shift thus far (or ~11hrs).
Robert ran tests of turning off Corner Station fans. LVEA temperatures are oscillating in recovery of this and will continue to do so on multi-hour timescale (see attached photo for temps of the last 5hrs in the LVEA).
This evening, in the on-going program to evaluate noise produced by the HVAC, I shut down just the 5 operating CS turbines, in AH1,2,3. The figure shows the range increase (about 4 Mpc), DARM spectra (decrease between 20 and 200 Hz), and vibration spectra.
Start shutting down: 1:00 UTC Nov 9
Start turning on: 1:10
Start shutting down: 1:20
Start turning on: 1:30
During commissioning today I swept low frequencies (10-60 Hz) with the large speaker in the input arm, with the shaker on the PSL table, and with the shaker on the IMC tube, searching for how the CER ACs couple. More later.
Immediately after commissioning work, jumped into running calibration measurements (broadband [~5min] + simullines [~25min]) from roughly 0000-0036utc.
TITLE: 11/09 Eve Shift: 00:00-08:00 UTC (16:00-00:00 PST), all times posted in UTC
STATE of H1: Commissioning
OUTGOING OPERATOR: TJ
CURRENT ENVIRONMENT:
SEI_ENV state: CALM
Wind: 7mph Gusts, 6mph 5min avg
Primary useism: 0.02 μm/s
Secondary useism: 0.24 μm/s
QUICK SUMMARY:
Jenne, Naoki
Today we tried to measure the AS36 and AS72 sensing matrix to see if we could replace the AS36 sensing with AS72 for MICH ASC. Currently, we use AS36 for MICH, AS45 for DHARD, AS72 for SRC1, but the AS RFPDs are tuned for RF36/45, not for RF72 and the AS72 does not have good SNR for SRC1. If we could replace the AS36 with AS72 for MICH, we can tune the AS RFPDs for RF45/72 to have good SNR for both MICH/SRC1.
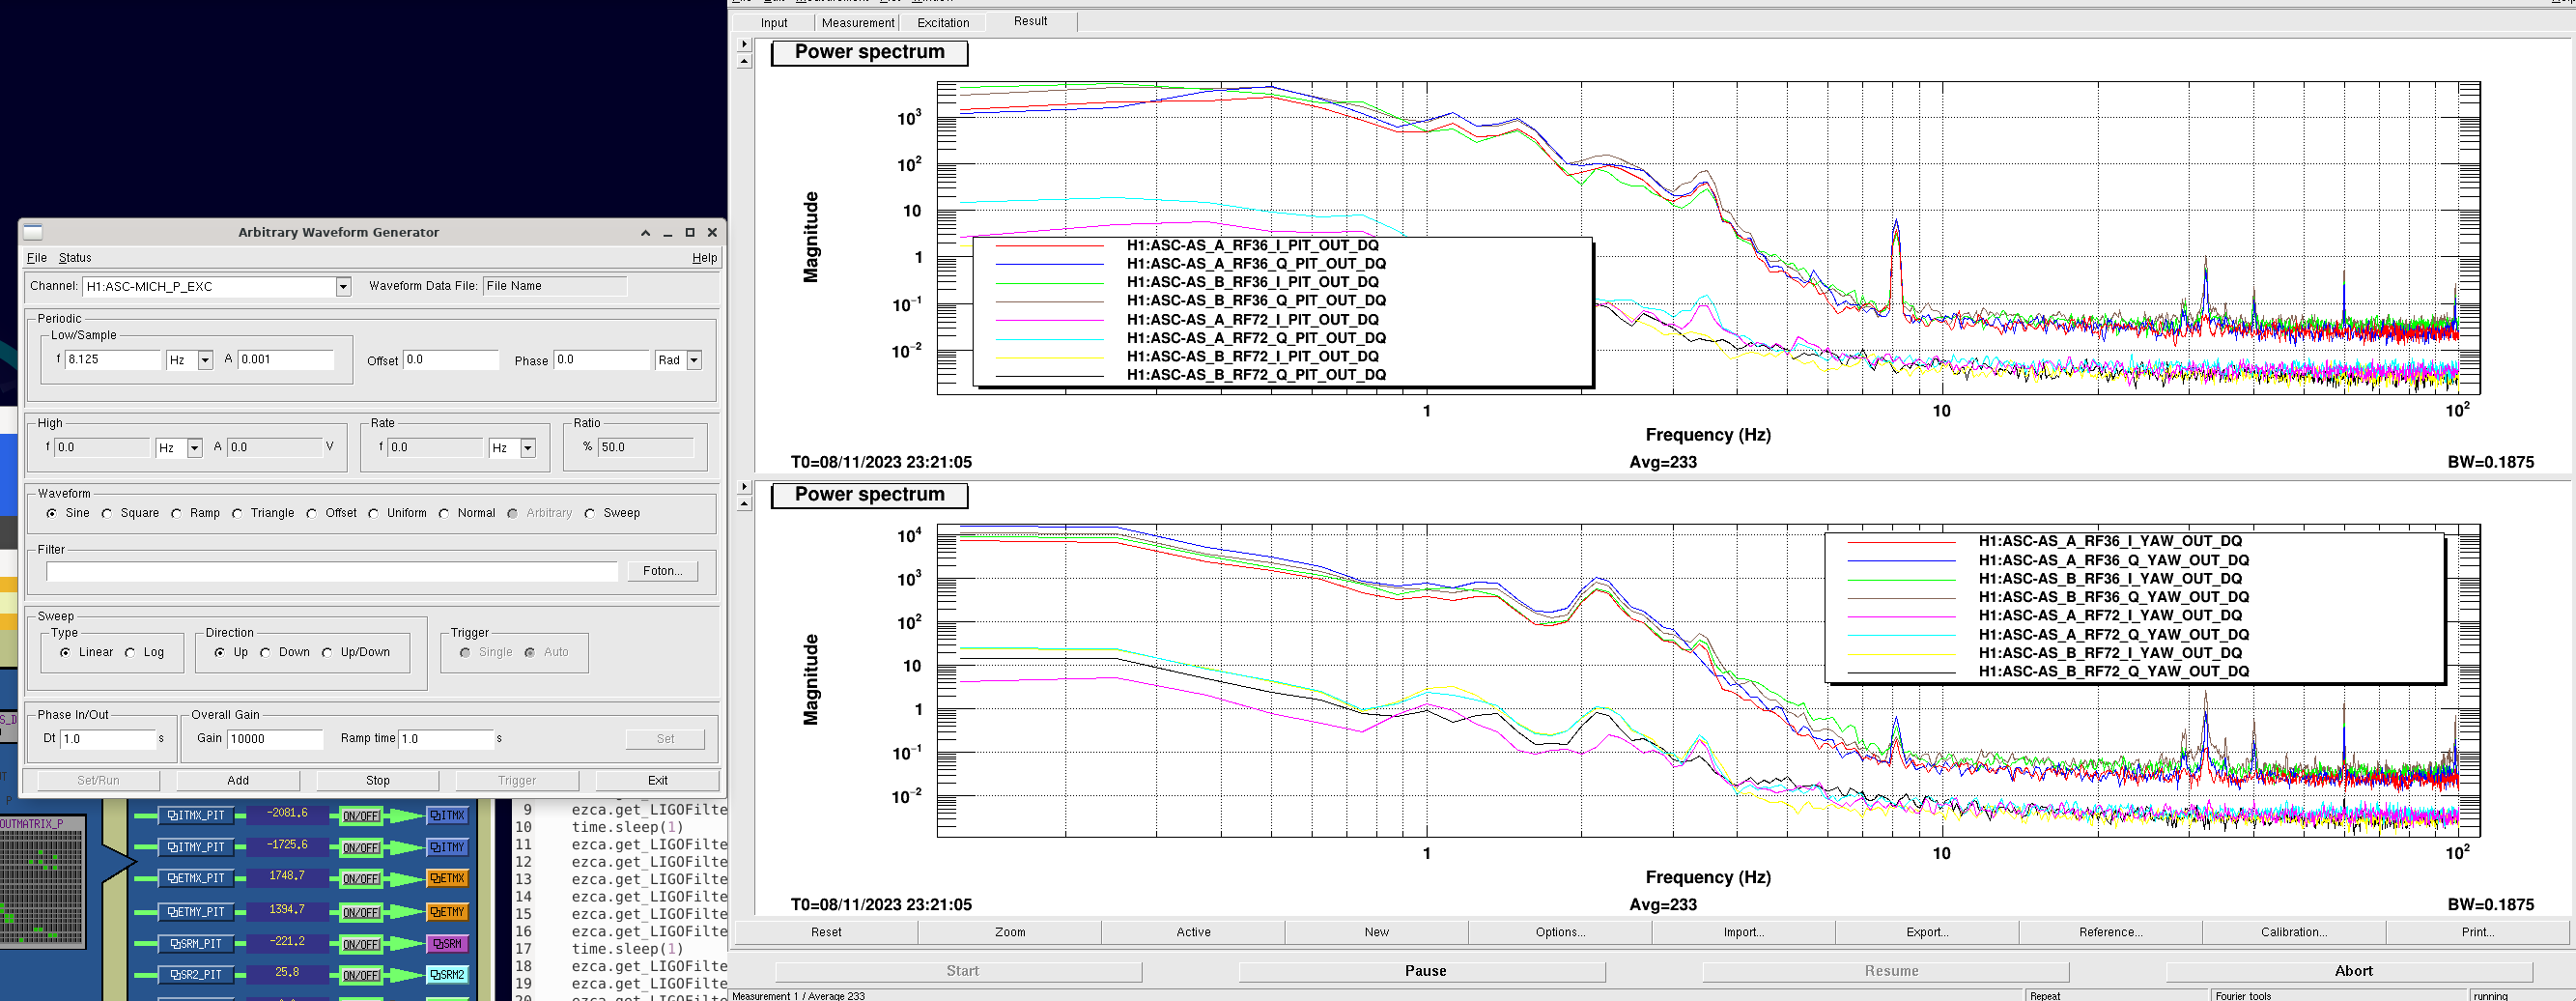
We tried to measure the AS36 and AS72 sensing matrix by injecting a 8.125 Hz line in MICH P. To avoid the ASC loop suppression, first we tried to turn on the notch filters at 8.125Hz in all ASC. There is a script to turn on/off the notch filters of all ASC in userapps/asc/h1/scripts/notch_8Hz_ON_OFF.py. We tried to run the script in the terminal, but the terminal does not recognize the ezca, so we moved to the guardian shell by typing guardian -i ISC_LOCK. In the guardian shell, we copied line 1-26 in the notch_8Hz_ON_OFF.py to turn on notch filters.
Then we started to inject a 8.125 Hz line in MICH_P_EXC with awggui. As shown in the attached figure, we set the amplitude 0.001 and kept increasing the overall gain to 10000. We clearly saw the 8 Hz line in AS36 sensors, but not in AS72. Since the 8 Hz excitation seems not to have a good SNR for AS72, we will excite the MICH/SRC1 in DC and see the response of AS36/72 sensors next time.
After the measurement, we copied line 29-49 in the notch_8Hz_ON_OFF.py to turn off the notch filters.
Naoki, Sheila, Camilla
In alog74059, it was pointed that the 80Hz BLRMS increased by 1.5dB after FC2 centering on October 27th, and this could be due to FC detuning change caused by the FC2 centering. Today we changed the FC detuning by +- 20 Hz from the nominal -28 Hz, but the nominal detuning seems already optimal as shown in the attached figure. We left the FC detuning at nominal value -28 Hz.
I went back and forth (~5 mins each) with the BS M2 coil drivers between their nominal low noise state, and their higher noise higher range state.
When in the higher noise state (state 2), there seems to be consistently higher noise between about 55 Hz up to 100 Hz. In the attached plot the blue / green is the nominal low noise state, while red / pink is the high noise state.
I'll work on making this an actual noise projection that we can include in the noise budget, using Craig's code for quad PUM noise as a guide.
We were in the high noise state 2 from 20:56:45 - 21:04:00. Then in low noise state from 21:06:10 - 21:11:15 (there's a glitch during this time). Back to high noise from 21:13:20 - 21:19:40 (there's a small glitch during this time). Back to low noise from 21:21:50 - 21:28:00. All times UTC on 8 Nov 2023. After this I handed back to Robert.
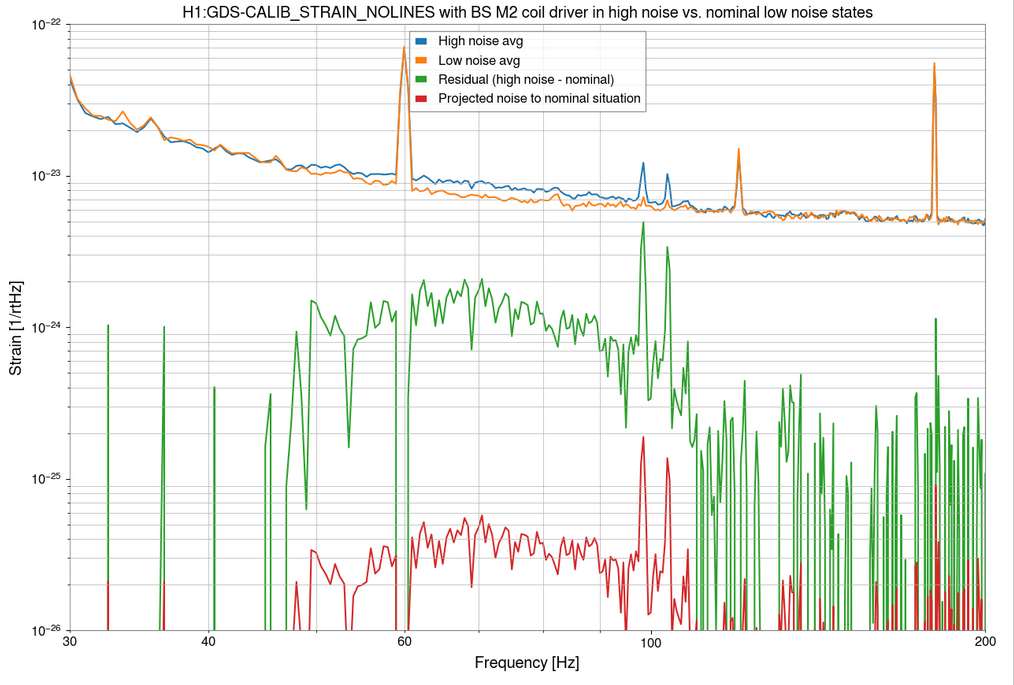
I've finally had a look at projecting this noise to what it looks like in our nominal state.
I'm 'following along' the philosophy of Craig's quad coil driver noise projections in https://git.ligo.org/aligo_commissioning/labutils/-/blob/master/coil_drivers_state_switch/plot_all_quad_pum_switch.py
I take an average of the ASDs of the noisy time (blue trace), and an average of the nominal quiet time (orange trace), then subtract them to get the excess power (green trace). I then take the residual excess power, and divide by the ratio of filters that are different between the two times, and that gives the projection of this excess power to our nominal state (red trace).
The attached plot shows that the projected noise (red) is more than a factor of 100x below our nominal sensitivity (orange), so BS M2 coil driver noise should not be an (immediate) issue for us.
The notebook is in /ligo/home/jenne.driggers/LHO_work/2023_11_21_BS_coil_driver_noise_budget/BS_coil_driver_noise_projection.ipynb
Oli Patane, Jeff Kissel
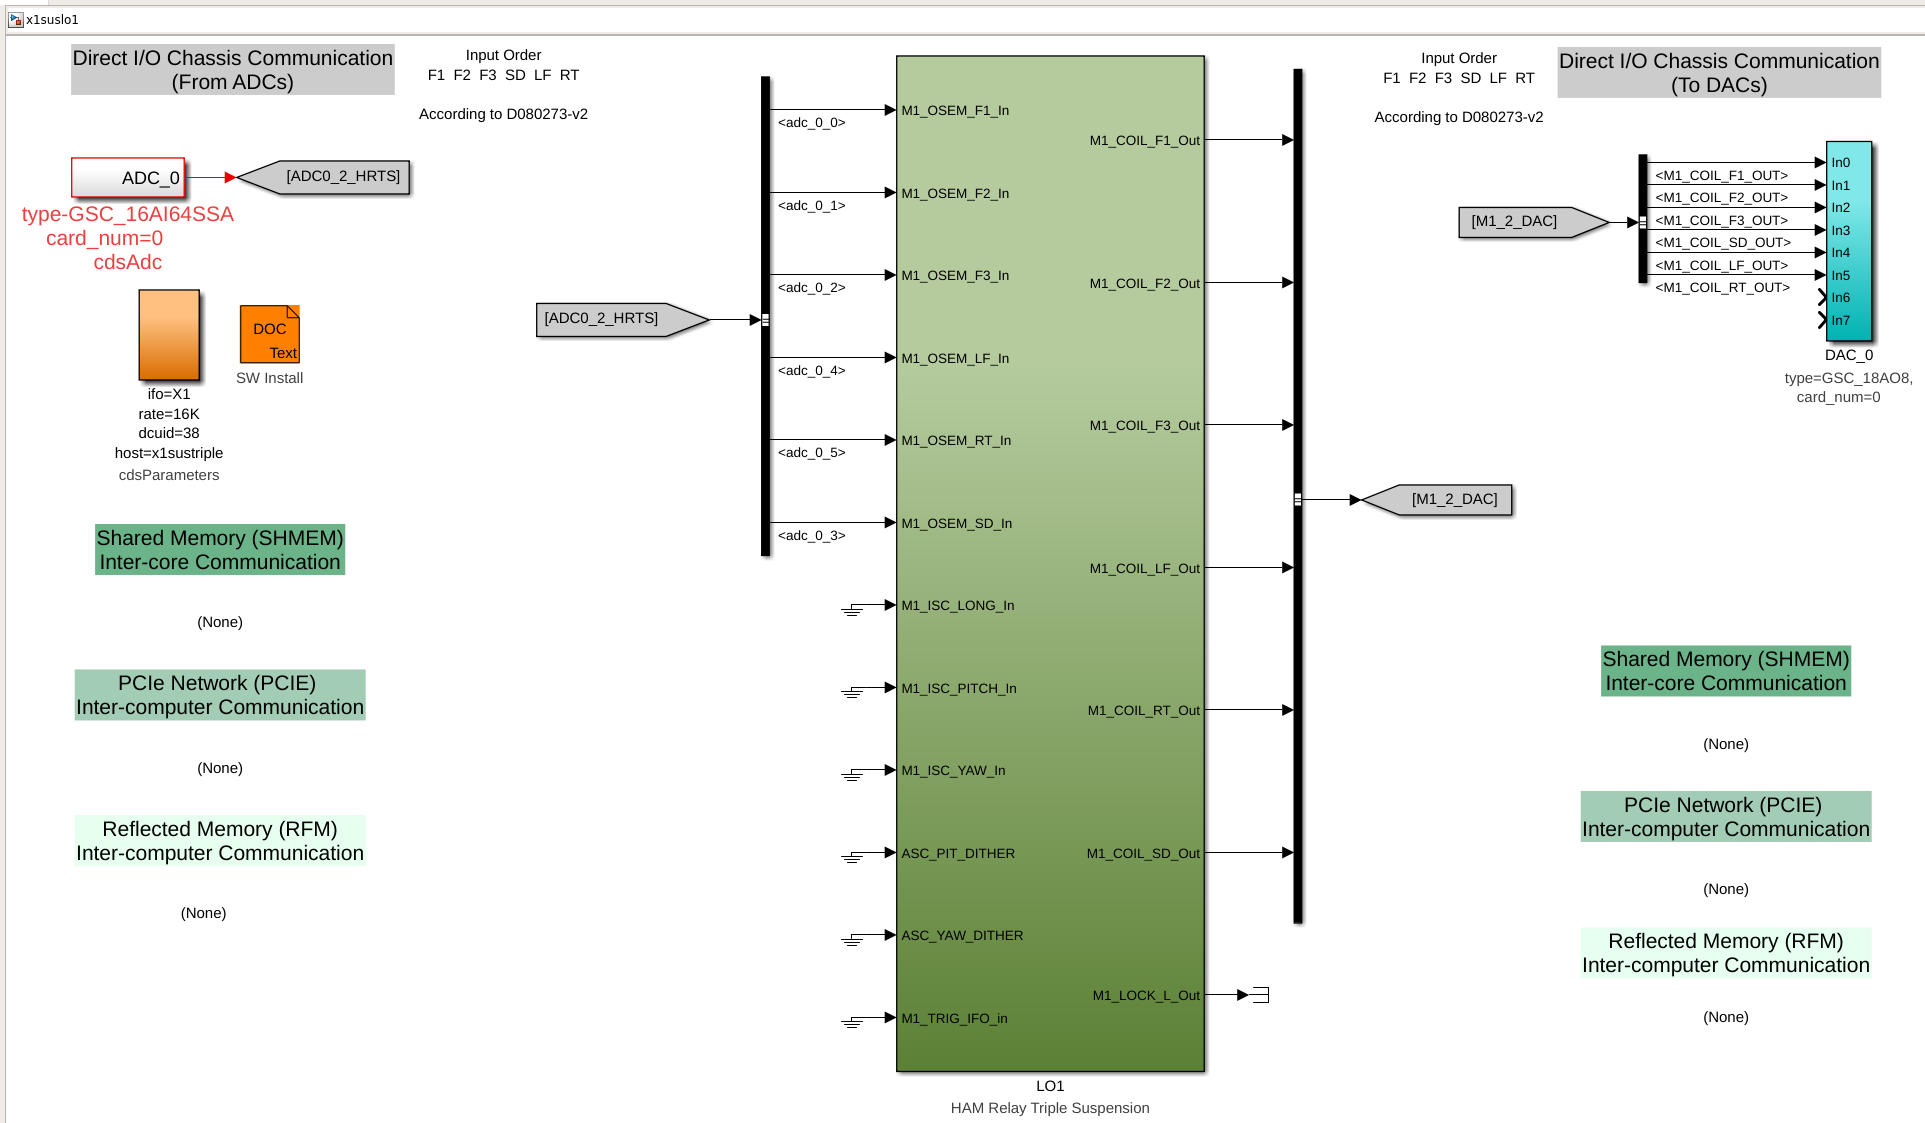
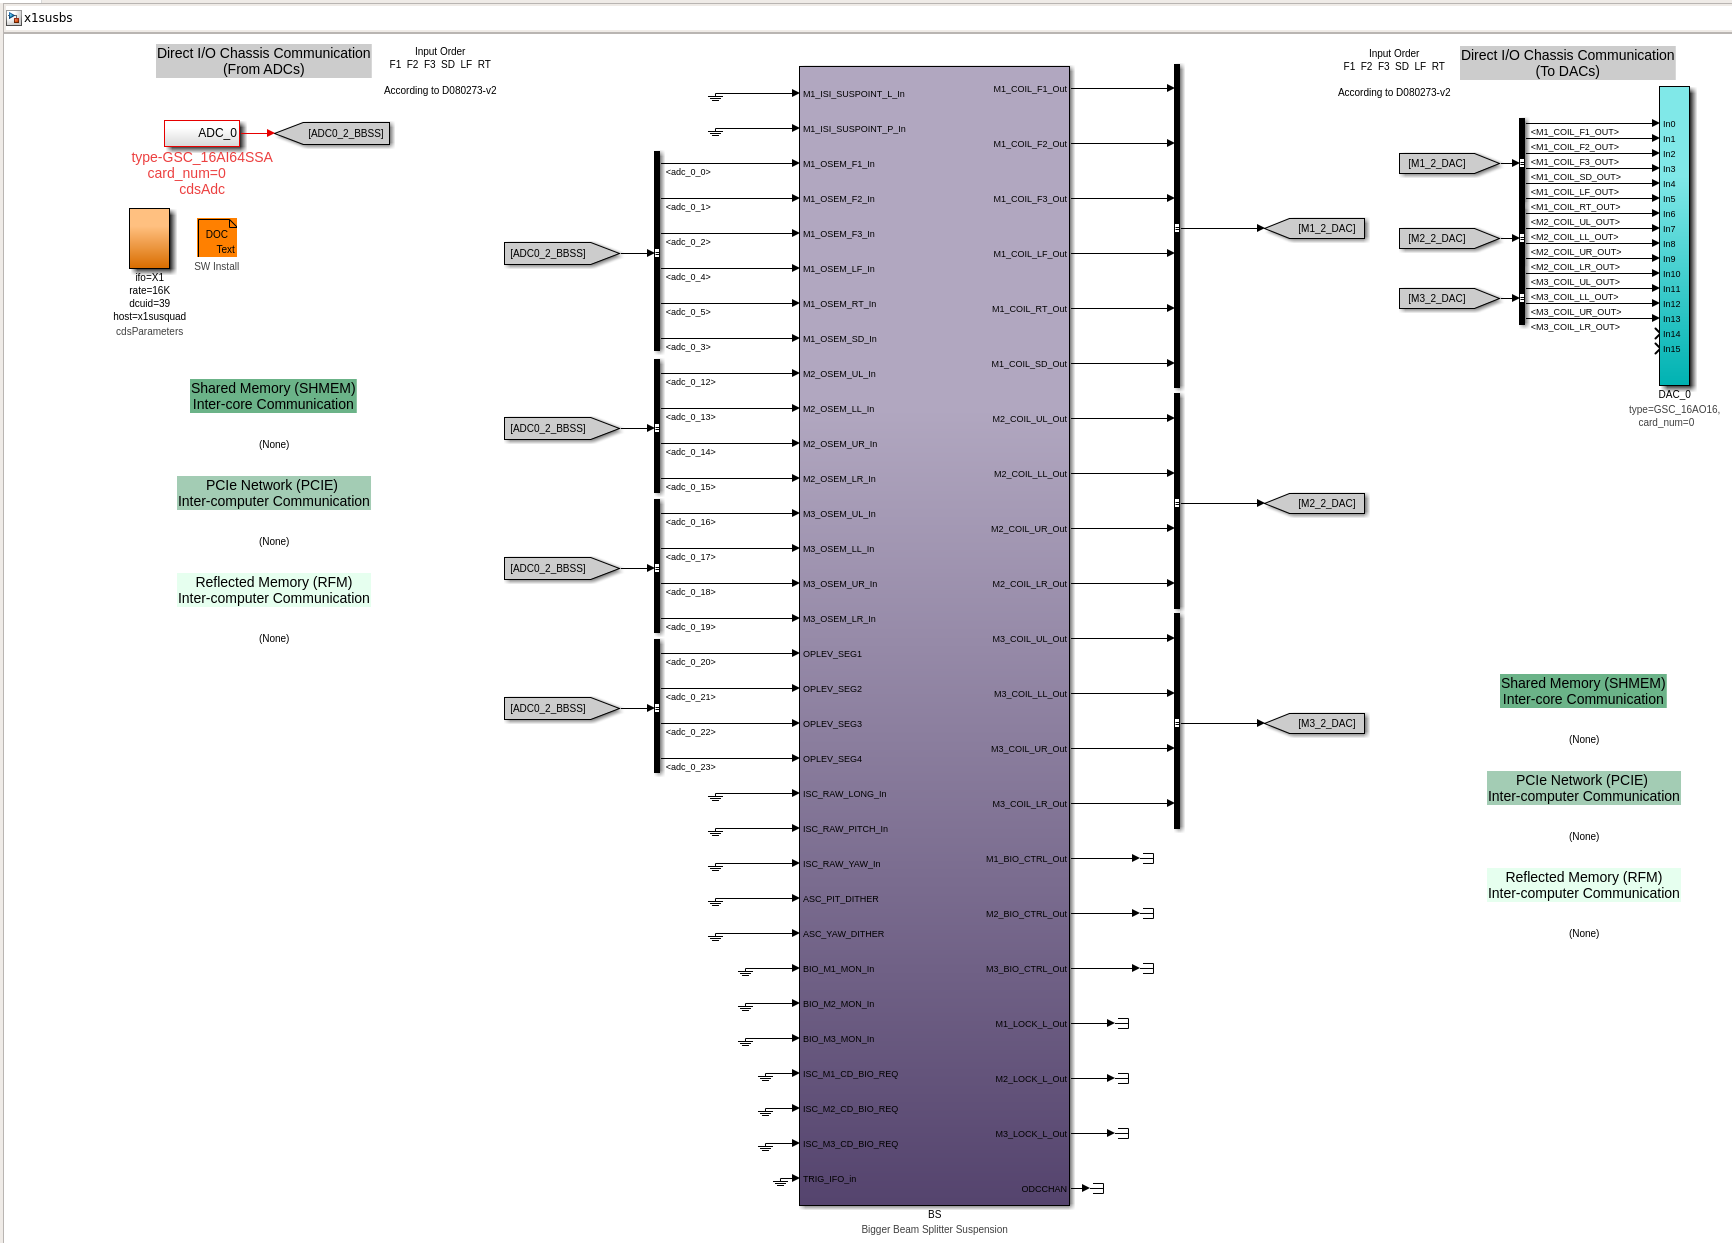
Continuing through our plan(T2300376) for the new O5 A+ suspensions (HRTS, HATS, and BBSS), we have finished, compiled, and installed the Simulink models for HRTS and BBSS onto the Triples and BSC teststands respectively. The models that we installed can be found in /opt/rtcds/userapps/release/sus/x1/models/x1sus{bs,lo1}.mdl.
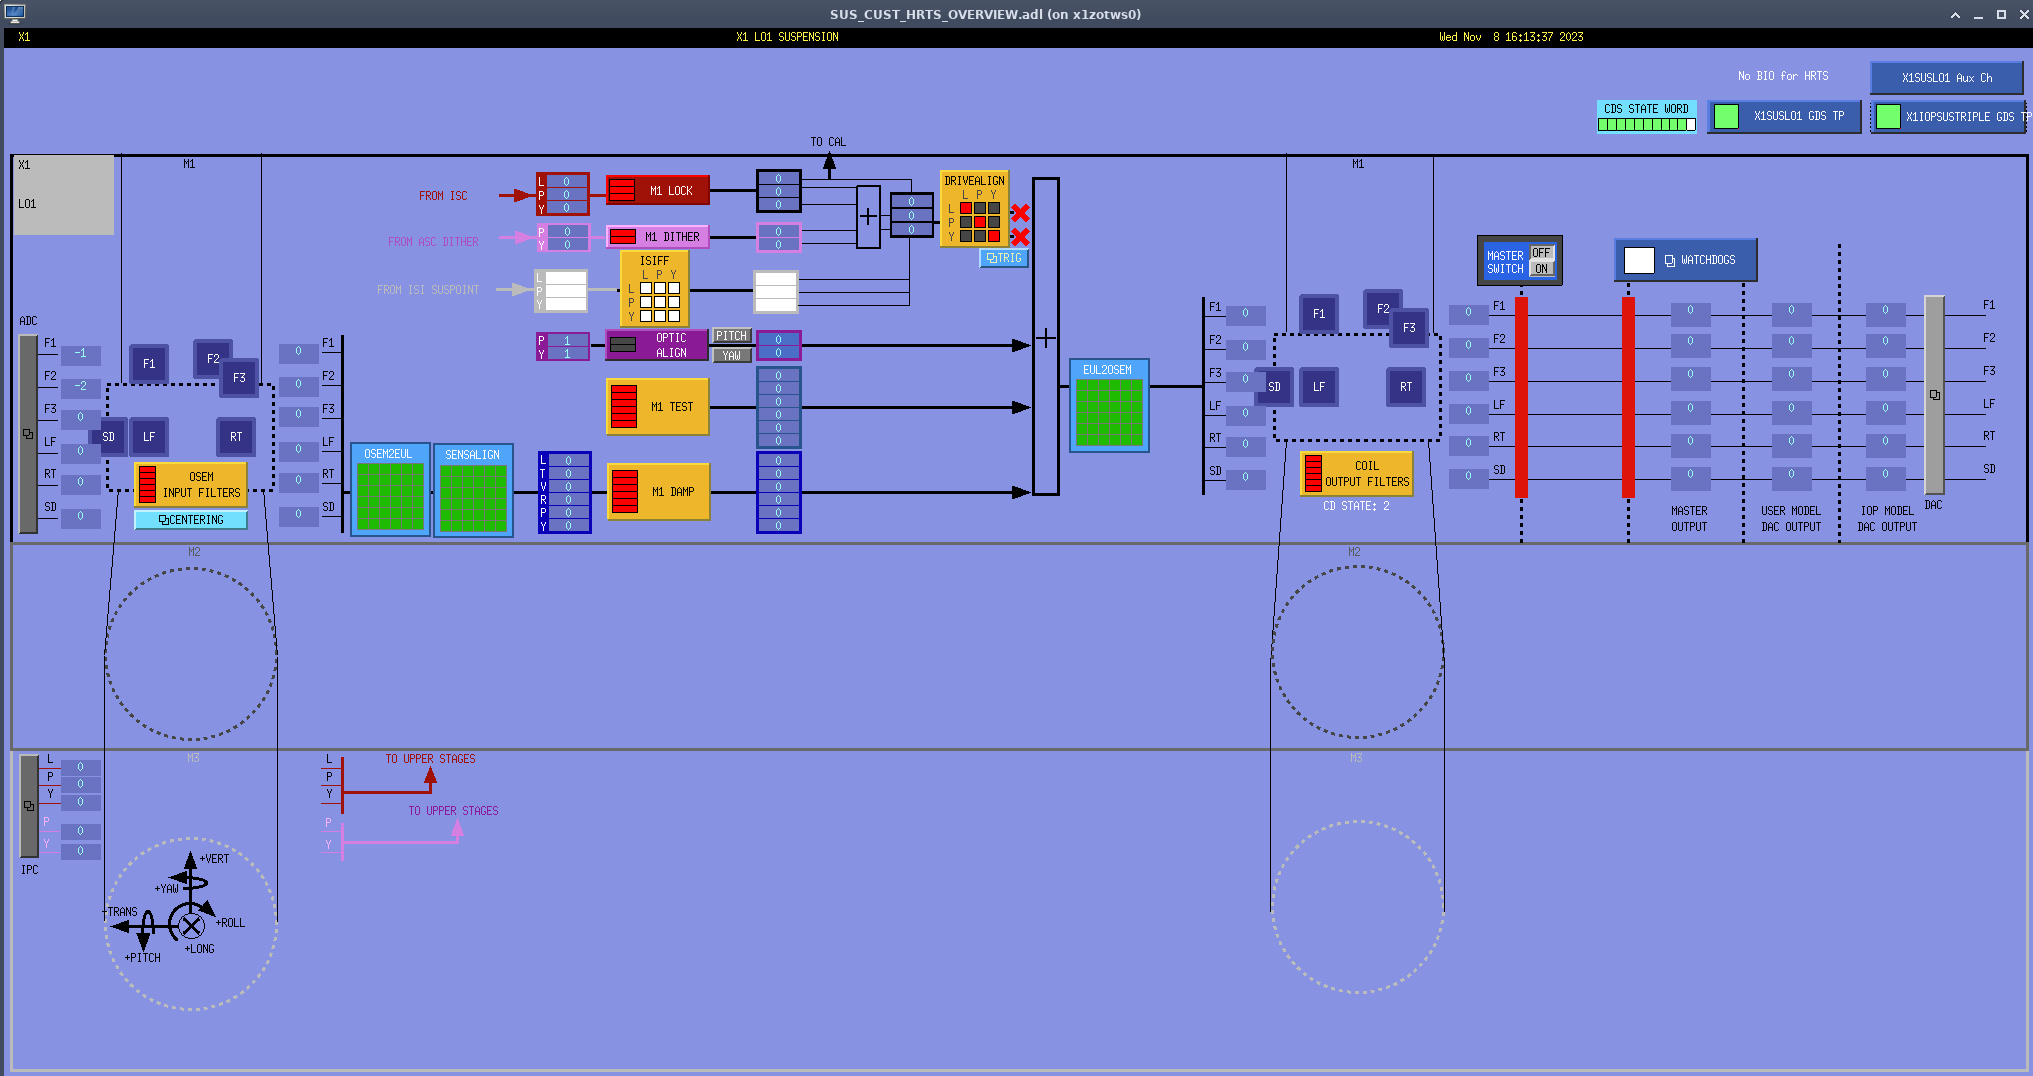
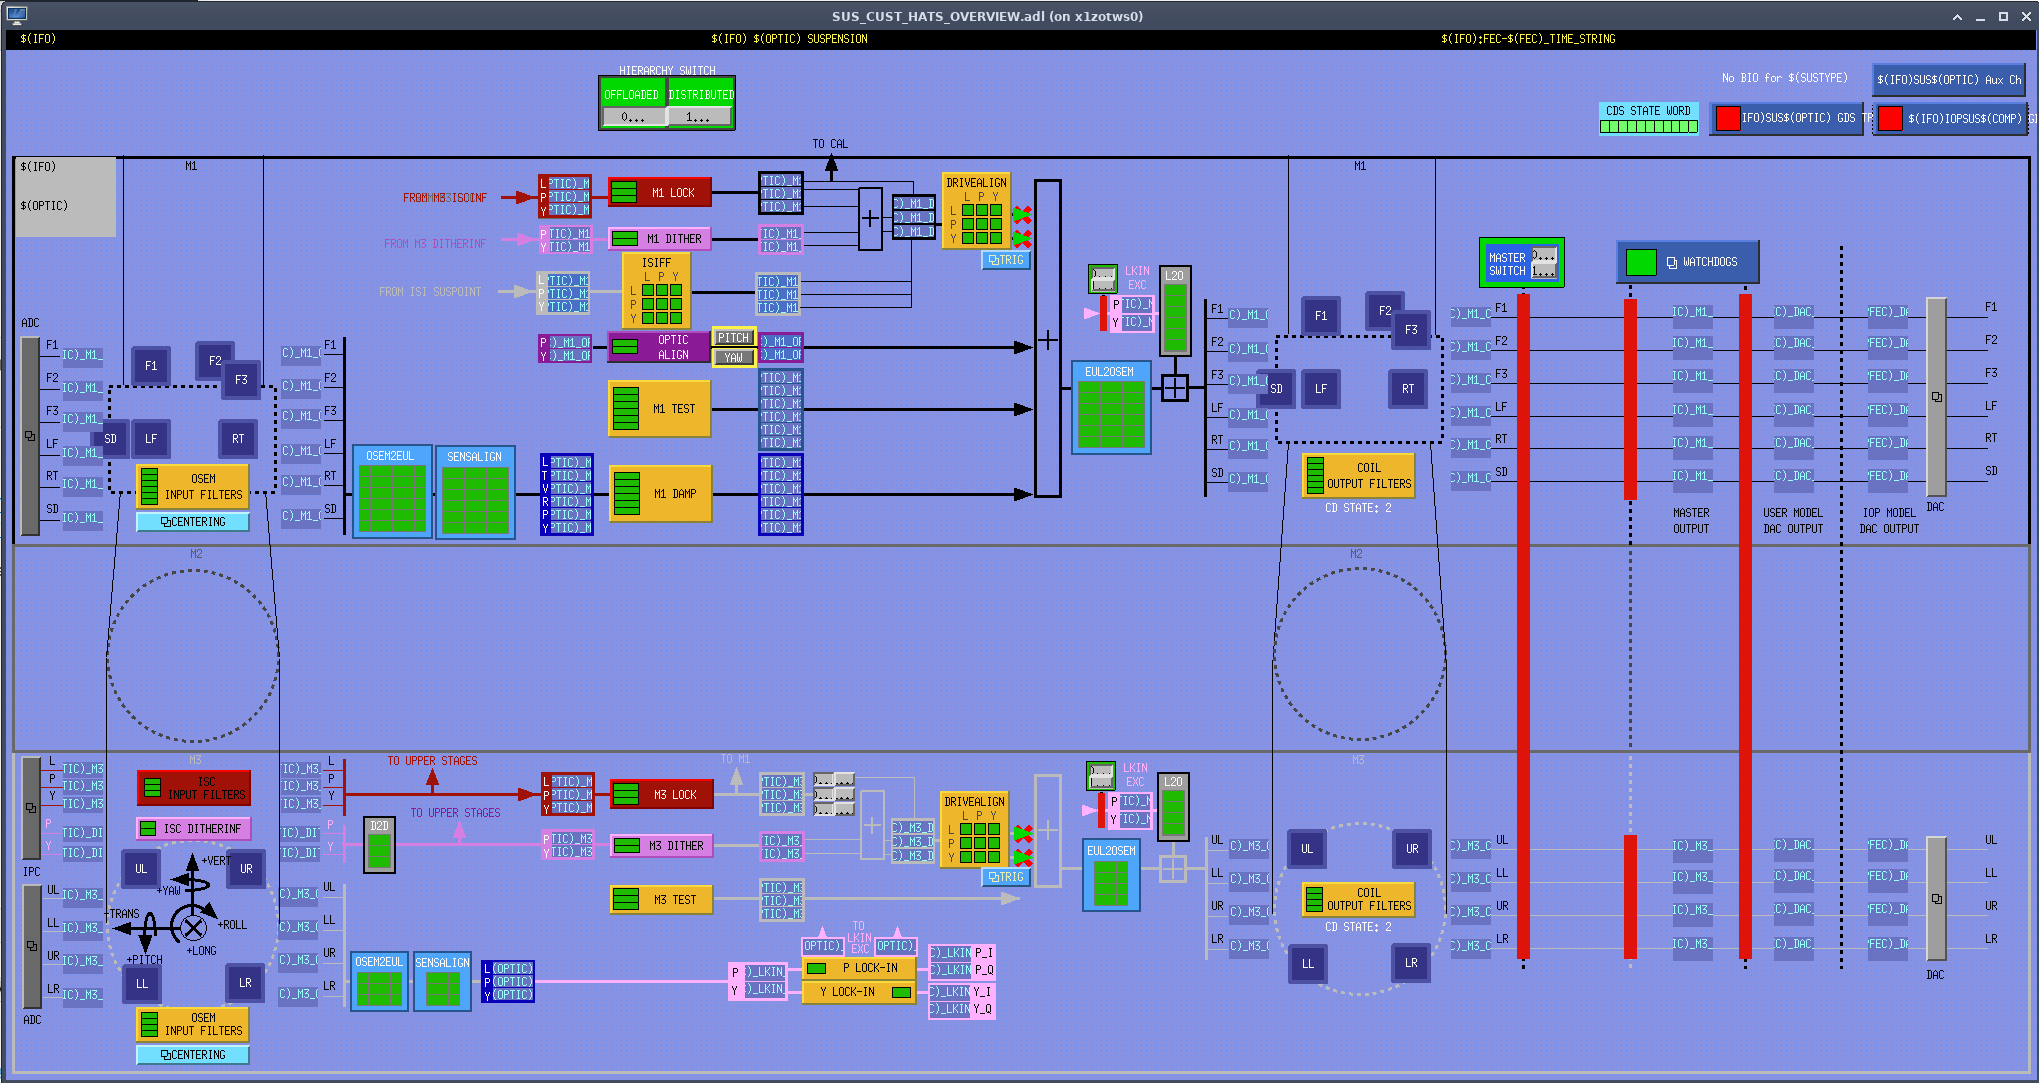
Also, we are close to done creating the medm suspension overview screens for HATS and HRTS (/opt/rtcds/userapps/release/sus/common/medm/hxts/SUS_CUST_{HRTS,HATS}_OVERVIEW.adl). They still need some editing, but here are the current state of the medm screens for the HRTS and the HATS.
Naoki, Camilla
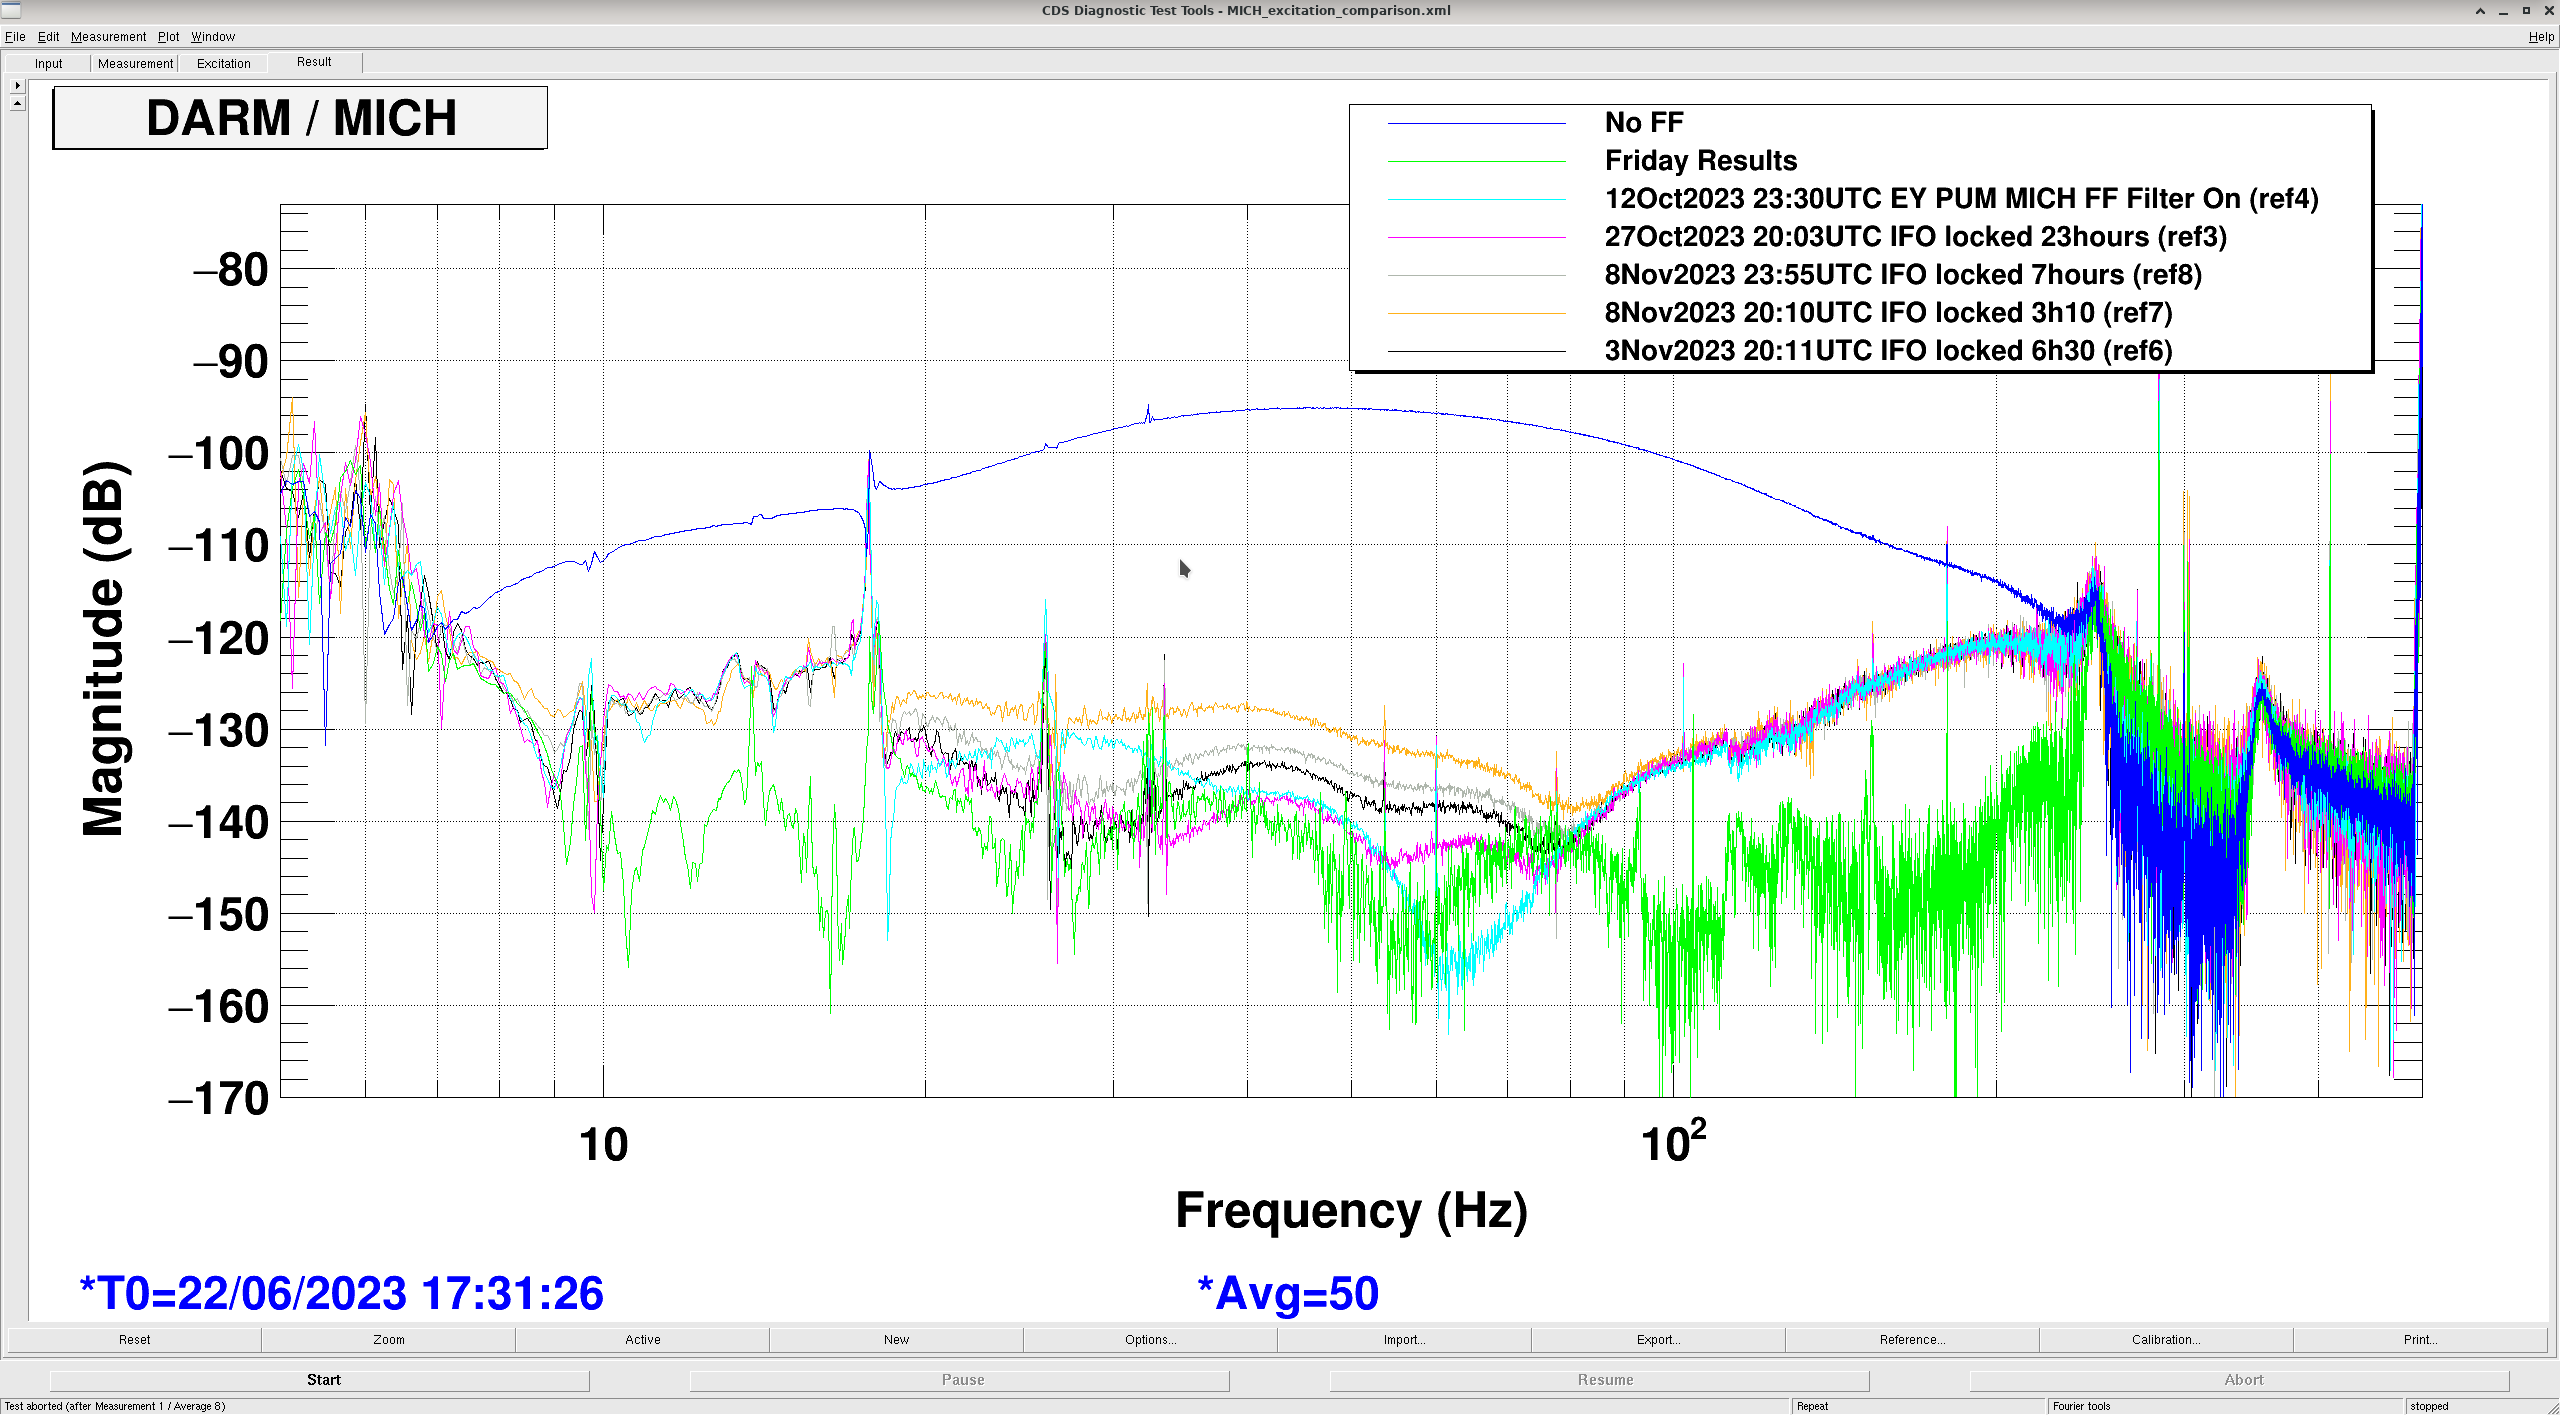
Last Friday 73773 Nov 3 (black trace, IFO locked 6h30), Naoki found the MICH FF had degraded since measured on Oct 27 (pink trace IFO locked 23h). Today we measured the MICH FF using /lsc/h1/scripts/feedforward/MICH_excitation_comparison.xml after the IFO had been locked 3 hours (yellow trace) and 7 hours (grey trace). See attached.
MICH FF effectiveness improves as the IFO thermalizes (compare yellow to grey) but also seems to be degrading over ~days (compare grey to black). MICH FF last tuned Oct 12 73420.
Double EndY Station Measurement!
We did the Same Measurement twice in the same configuration to determine if there would be any changes from one hour to the next.
First ENDY Station Measurement:
During the Tuesday maintenace, the PCAL team(Rick Savage & Tony Sanchez) went to ENDY with Working Standard Hanford aka WSH(PS4) and took End station measurements.
The ENDY Station Measurements were carried out according to the procedure outlined in Document LIGO-T1500062-v15, Pcal End Station Power Sensor Responsivity Ratio Measurements: Procedures and Log, and was completed by 10:30 am.
First Measurement Log
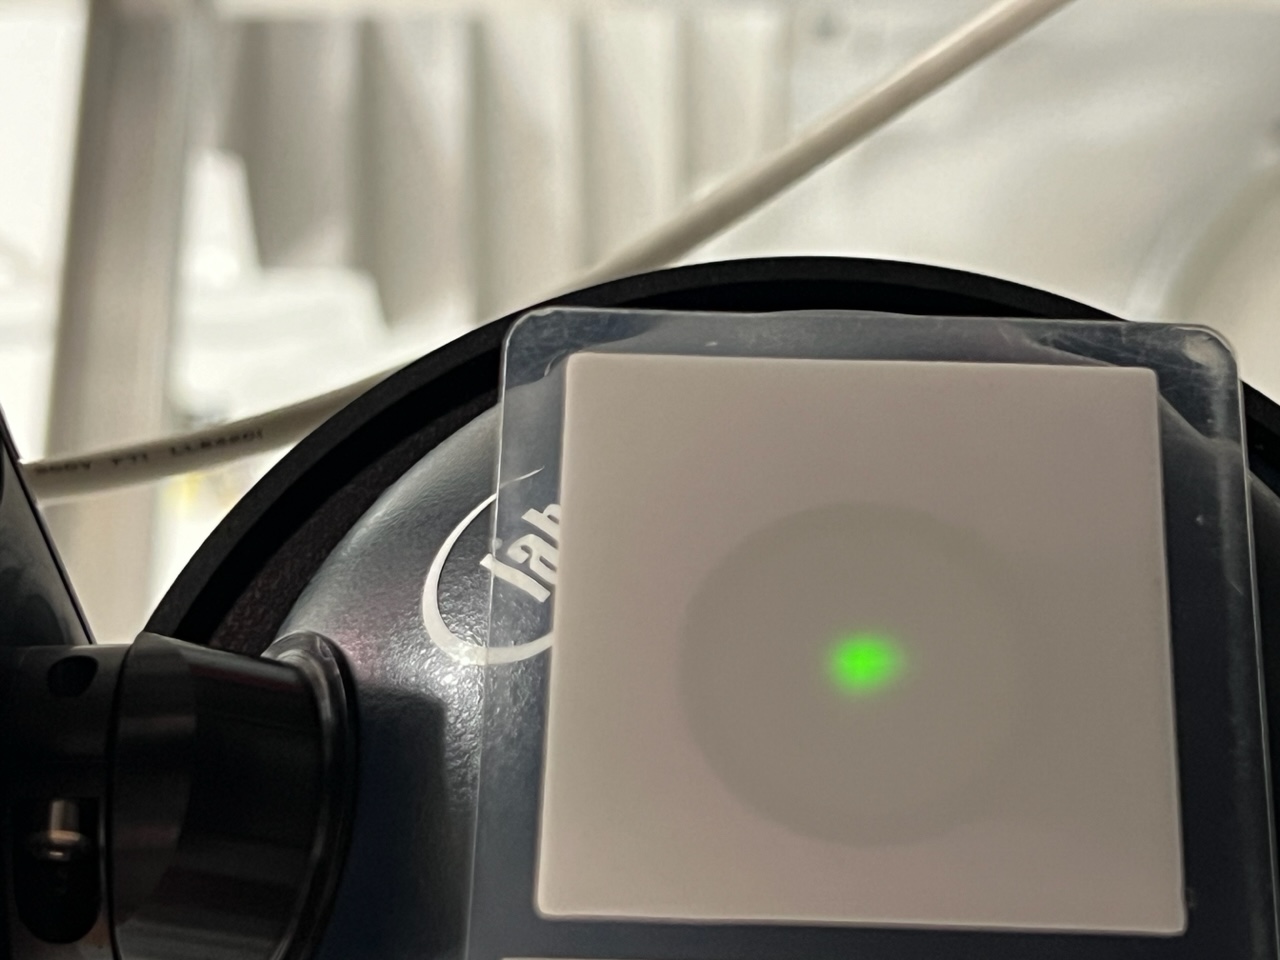
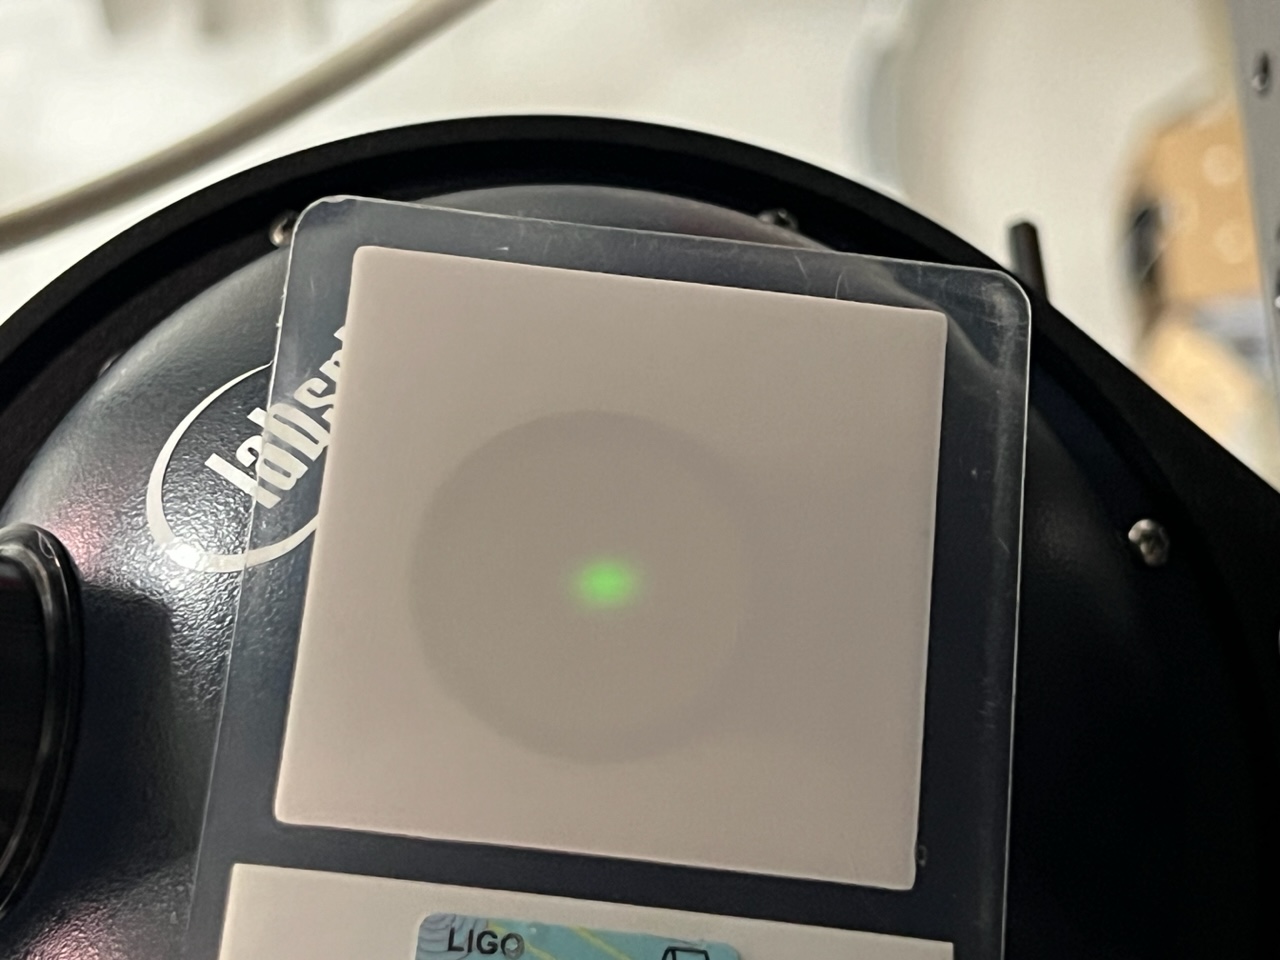
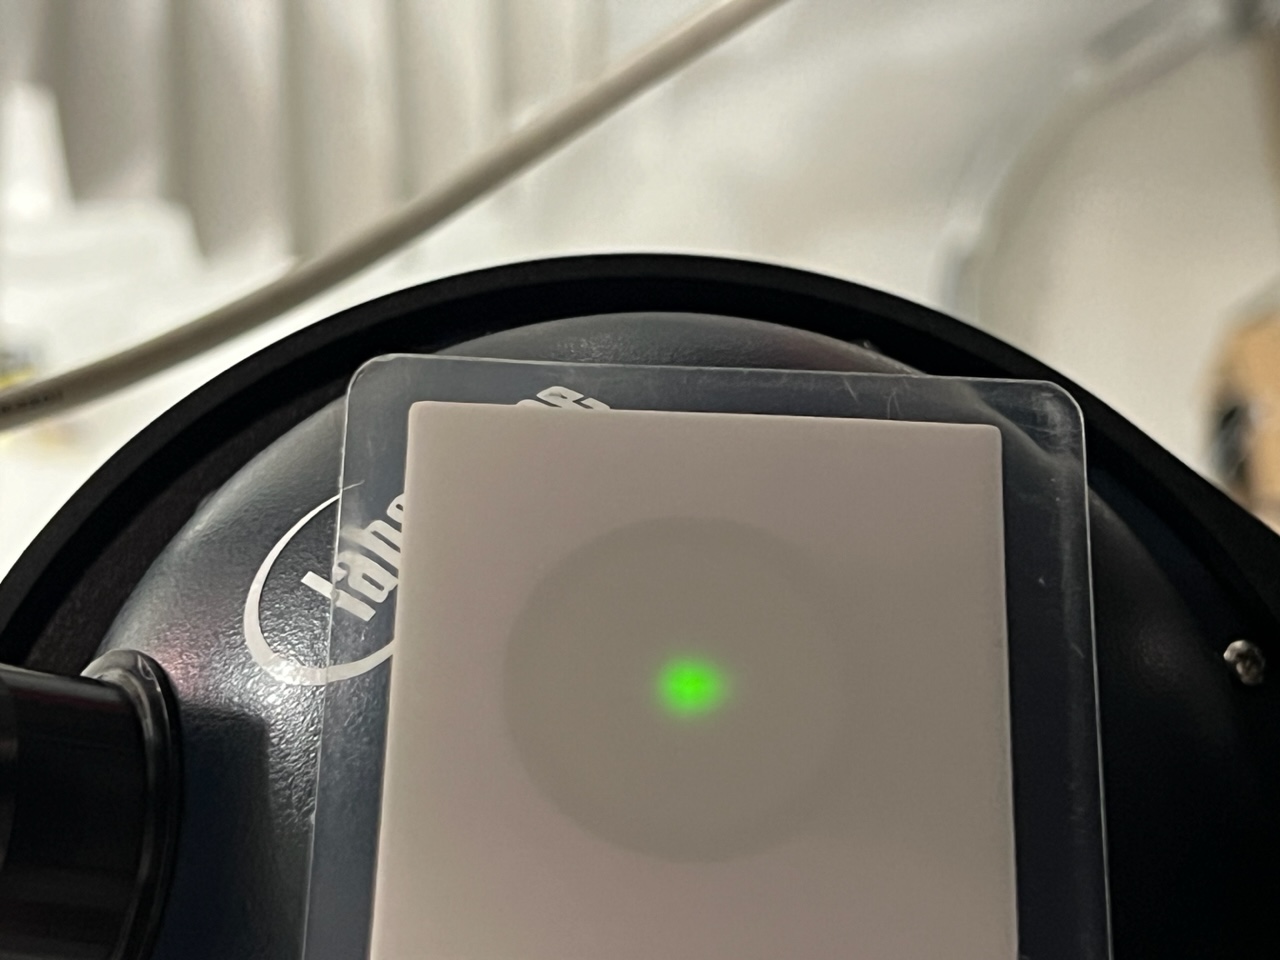
First thing we did is take a picture of the beam spot before anything is touched!
Martel votlage injection into the DAQ:
Martel_Voltage_Test.png graph. We also did a measurement of the Martel's voltages in the PCAL lab to calculate the ADC conversion factor, which is included on the above document.
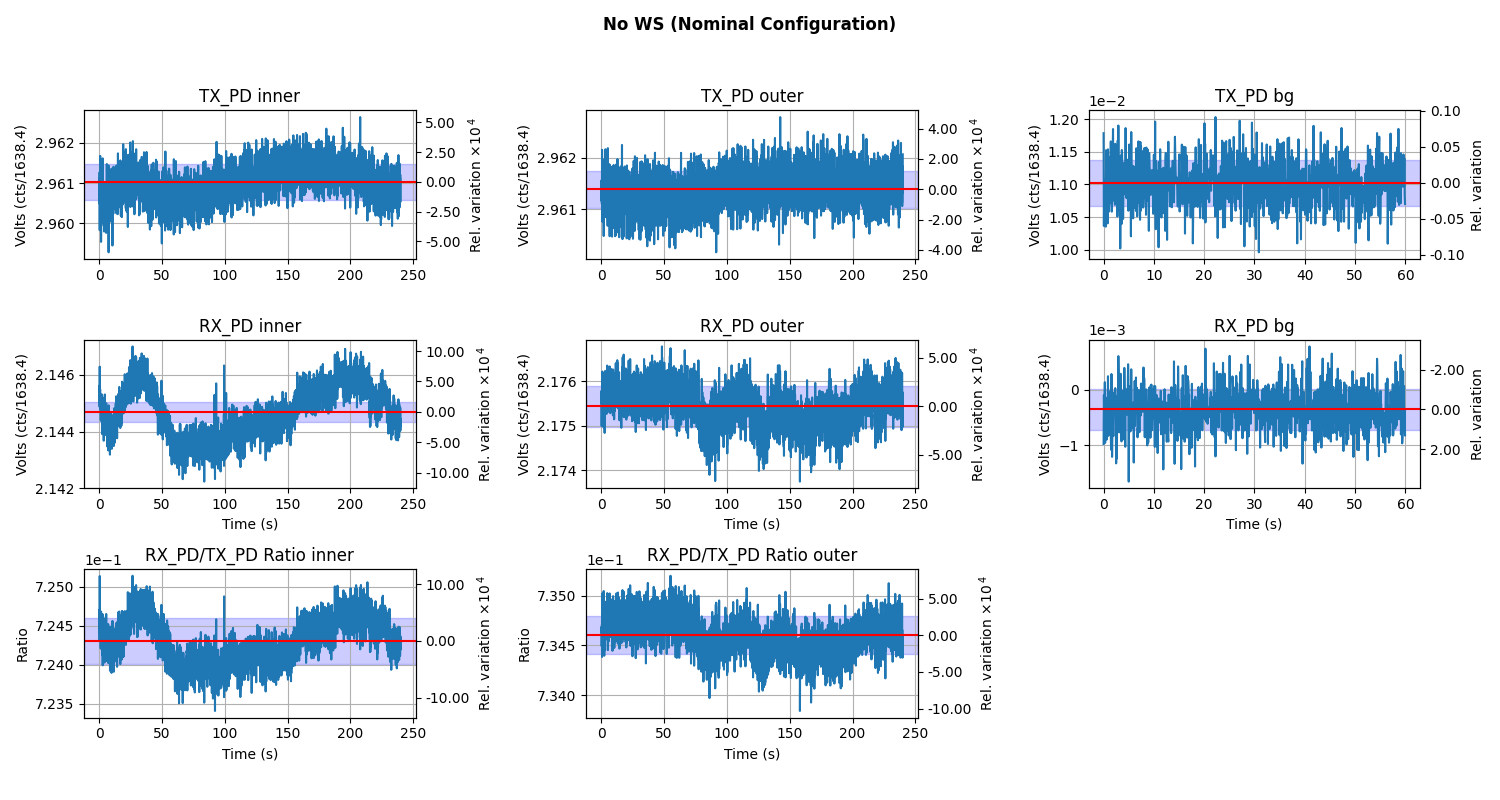
After the Martel measurement the procedure walks us through the steps required to make a series of plots while the Working Standard(PS4) is in the Transmitter Module. These plots are shown in WS_at_TX.png.
Next steps include: The WS in the Receiver Module, These plots are shown in WS_at_RX.png.
Followed by TX_RX.png which are plots of the Tranmitter module and the receiver module operation without the WS in the beam path at all.
The last picture is of the Beam spot after we had finished the measurement.
All of this data is then used to generate LHO_ENDY_PD_ReportV2.pdf which is attached, and a work in progress in the form of a living document.
Note: both measurements are on this Report.
NONE of this data and Analysis has been commited to the SVN as I have been Locked out of the SVN.
But it would have gone here: https://svn.ligo.caltech.edu/svn/aligocalibration/trunk/Projects/PhotonCalibrator/measurements/LHO_ENDY/
Then we did the measurement again,
Second Measurement Log
Martel plot
WS @ TX
WS @ RX
TX & RX
LHO EY PD Report V2 for the Second measurement
Final Beam Spot
PCAL Lab Responsivity Ratio Measurement:
A WSH/GSHL (PS4/PS5)FrontBack Responsivity Ratio Measurement was ran, analyzed, and pushed to the SVN.
The analysis of this measurement produces 4 PDF files which we use to vet the data for problems.
raw_voltages.pdf
avg_voltages.pdf
raw_ratios.pdf
avg_ratios.pdf
NONE of this lab data and Analysis has been commited to the SVN.
Obligitory BackFront PS4/PS5 Responsivity Ratio:
A WSH/GSHL (PS4/PS5)BF Responsivity Ratio measurement was ran, analyzed, and pushed to the SVN.
The analysis of this measurement produces 4 PDF files which we use to vet the data for problems.
raw_voltages2.pdf
avg_voltages2.pdf
raw_ratios2.pdf
avg_ratios2.pdf
This adventure has been brought to you by Rick Savage & Tony Sanchez.
TITLE: 11/08 Day Shift: 16:00-00:00 UTC (08:00-16:00 PST), all times posted in UTC
STATE of H1: Commissioning
INCOMING OPERATOR: Corey
SHIFT SUMMARY: Locked for 7 hours. We've been commissioning since 12PT (20UTC), that is now wrapping up but we are going to run a calibration measurement.
LOG:
| Start Time | System | Name | Location | Lazer_Haz | Task | Time End |
|---|---|---|---|---|---|---|
| 17:16 | FAC | Karen | Opt Lab | n | Tech clean | 17:37 |
| 17:17 | CDS | Fil | MY | n | Parts pickup | 17:38 |
| 17:39 | Camilla | OptLab | n | Looking for something | 17:46 | |
| 18:54 | FAC | Kim | H2 enlc | n | Tech clean | 20:00 |
| 20:01 | SQZ | Camilla | CR | n | SQZ tune | 20:08 |
| 20:05 | PEM | Robert | CER,LVEA | n | Moving, grabbing equipment | 20:35 |
| 20:09 | ISC | Camilla | CR | n | MICH exc | 20:17 |
The lock-loss-alert system is now running the old, non-Twilio code. Twilio is not able to send text messages until we verify our 'brand' with The Campaign Registry. Today was a registration deadline, so their verification service is very busy.
This means that we are back to using the cell phone providers (Verizon, ATT, etc) to send the SMS texts. I would recommend everyone who depends upon alert texts to send a test message before their shift starts.
This also means that unfortunately voice calling is not available, email and texts only.
Once Twilio is able to send our texts again, I'll switch back to the new software.
I'm not yet sure why, but we have abnormally high coherence with MICH ASC today. I wonder if this is related to our low PRG, and the fact that the power recycling gain seems to be about 3x more wobbly than normal.
This coherence seems to have reduced dramatically as we've thermalized, however the PRG is still low and wobbly. So, I now think they are unrelated.
Back to Observing after a rough night of earthquakes. Lock acquisition was fully automated which is fantastic to see after large earthquakes!
Our range looks a bit lower over the past 24 hours. Power recycling gain seems to be lower than normal as well. Doesn't seem to be correlated with the higher microseisms that we've been seeing (see attached).
The peak-to-peak values of the power recycling gain are also almost 3x what they are when the recycling gain is higher.
The last several locks, the PRG has been about 47. We're usually closer to 51, so this is certainly something to look at.
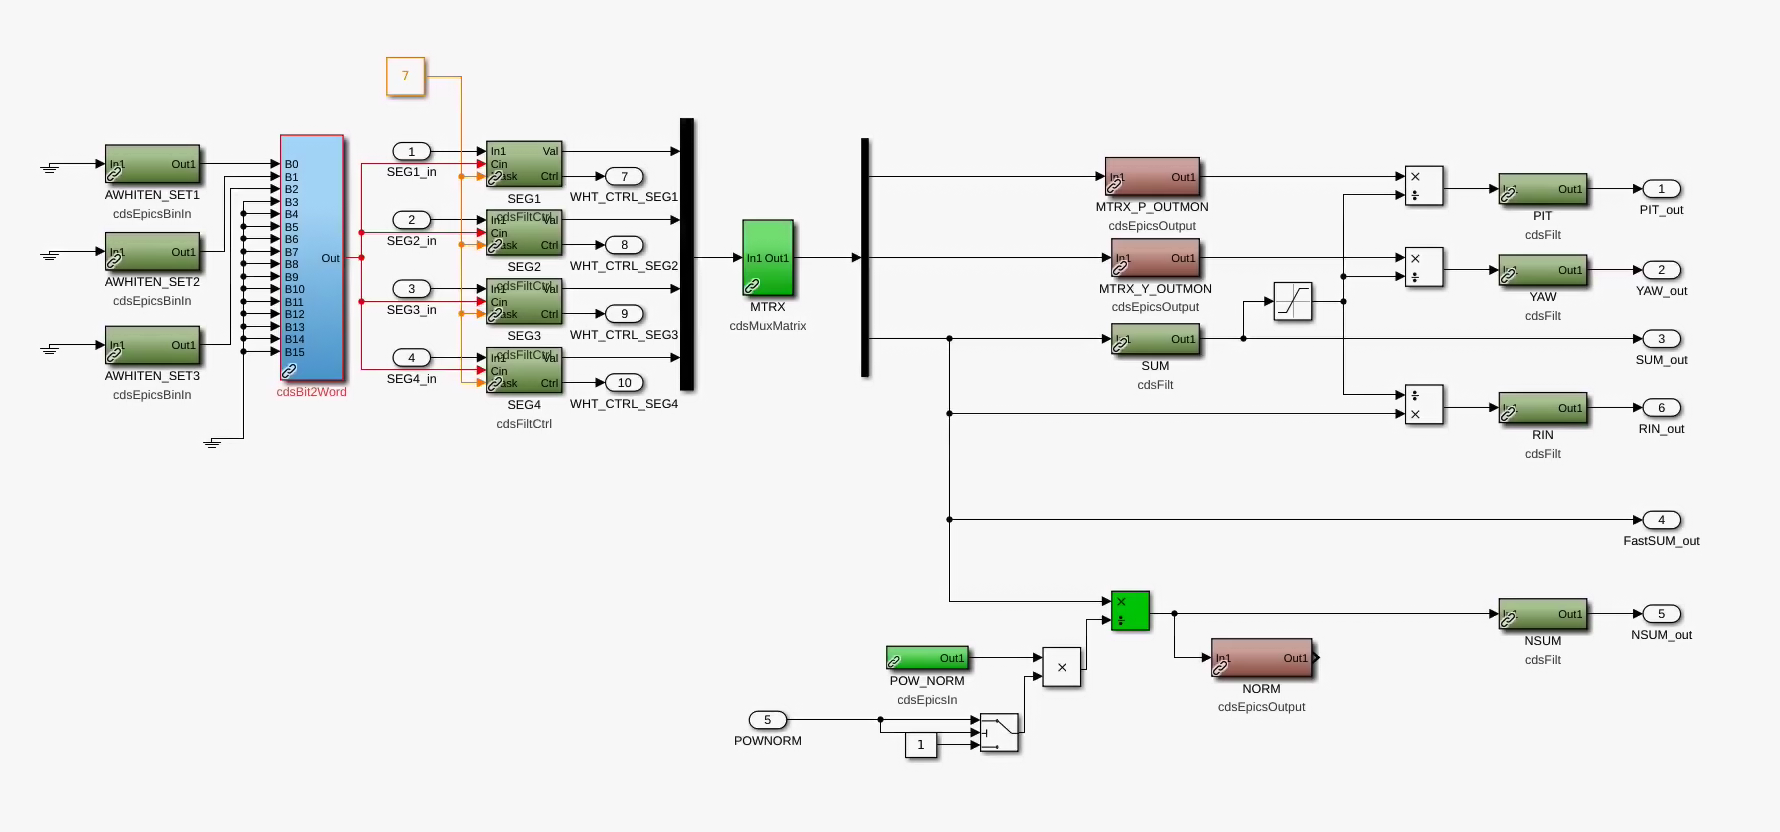
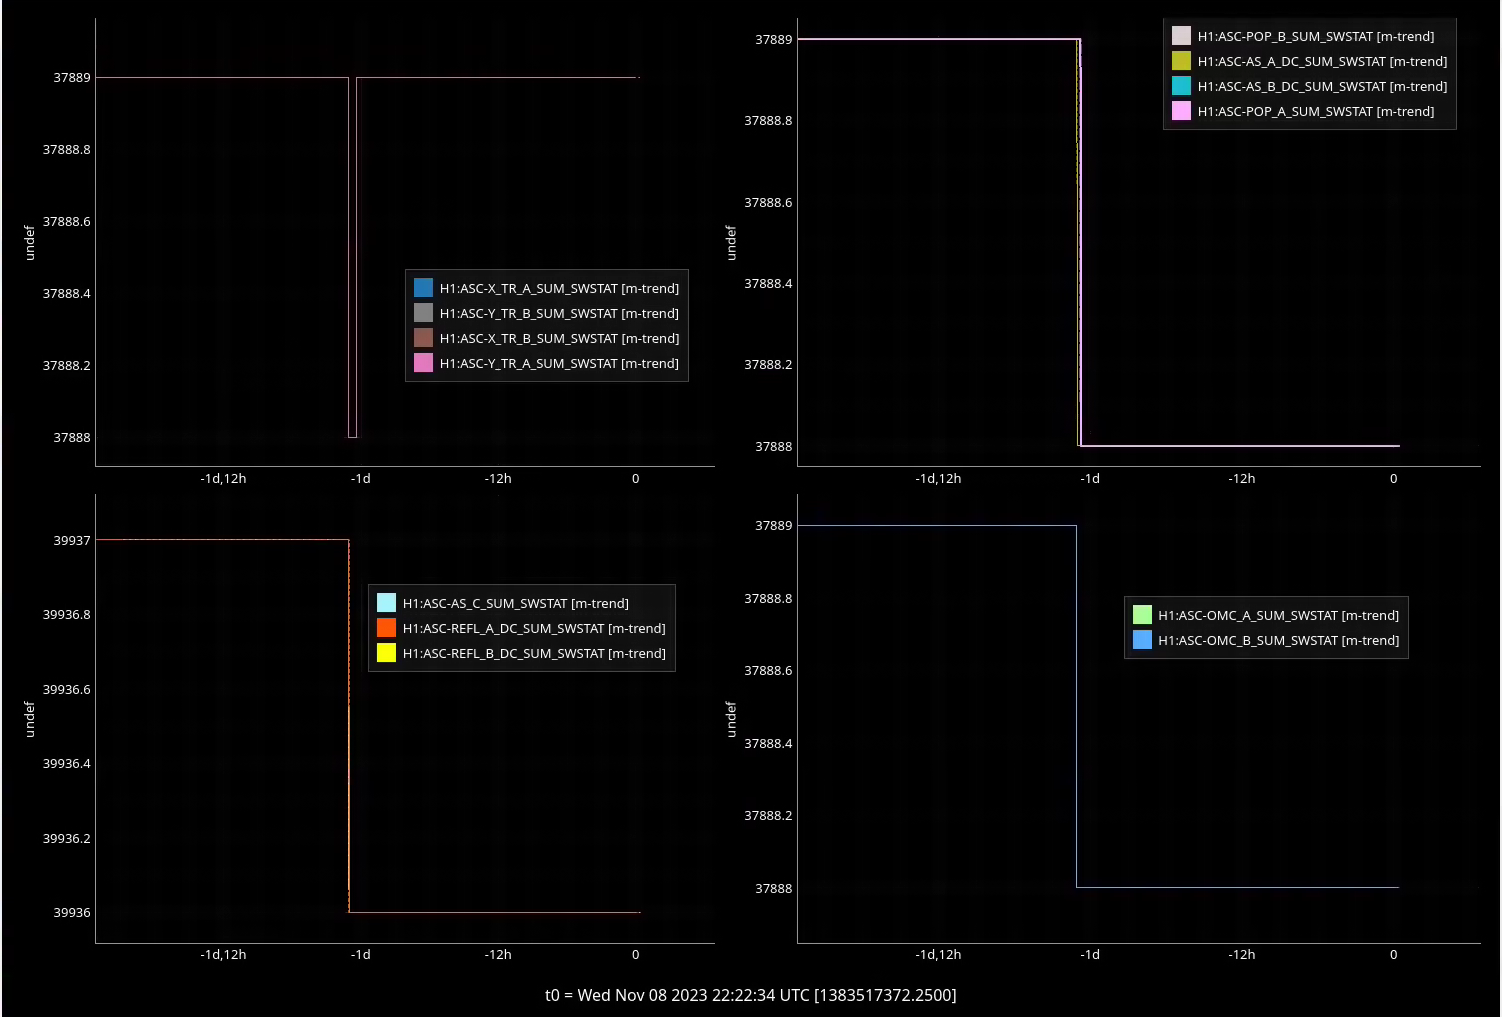
I disabled 1Hz LPF which was somehow present in the SUM (not NSUM) of the QPDs and WFS DCs that are used for normalization of PIT and YAW. These LPFs ruin the rejection of the intensity noise for QPDs and WFS DCs even at 1Hz.
Here's a list of the filter modules where the 1Hz LPF (all FM1) was disabled: H1:ASC-OMC_[AB]_SUM, H1:ASC-REFL_[AB]_DC_SUM, H1:ASC-AS_[AB]_DC_SUM, H1:ASC-AS_C_SUM, H1:ASC-POP_[AB]_SUM, H1:ASC-[XY]_TR_[AB]_SUM.
Note: Without LPF, when large clipping action is going on and SUM goes very small, I can imagine that PIT and YAW become somehow worse than with LPF. If that ever becomes a problem, enable 1Hz LPF.
Note 2: Green WFS DCs and QPDs don't have the BPF for SUM.
Turns out that disabling the LPF for PIT and YAW normalization has a side effect of making RIN channels 1 (one, unity), but only for ASC-OMC_[AB]. Others don't seem to have RIN channel.
I don't see this as an urgent problem, but if this RIN function is needed, we have to add a dedicated filter module just for RIN normalization purpose.
Also, this will make the sensitivity of ASC-OMC_RIN to the detchar safety injections go away, but this is just an unintended side effect of the change in the normalization. (See alog 74056.)
Well, turns out that H1:ASC-[XY]_TR_[AB]_SUM setting was reverted back right after I changed it, but the rest stood (1st attachment). I might turn the LPF for the TR sensors off later, but not now.
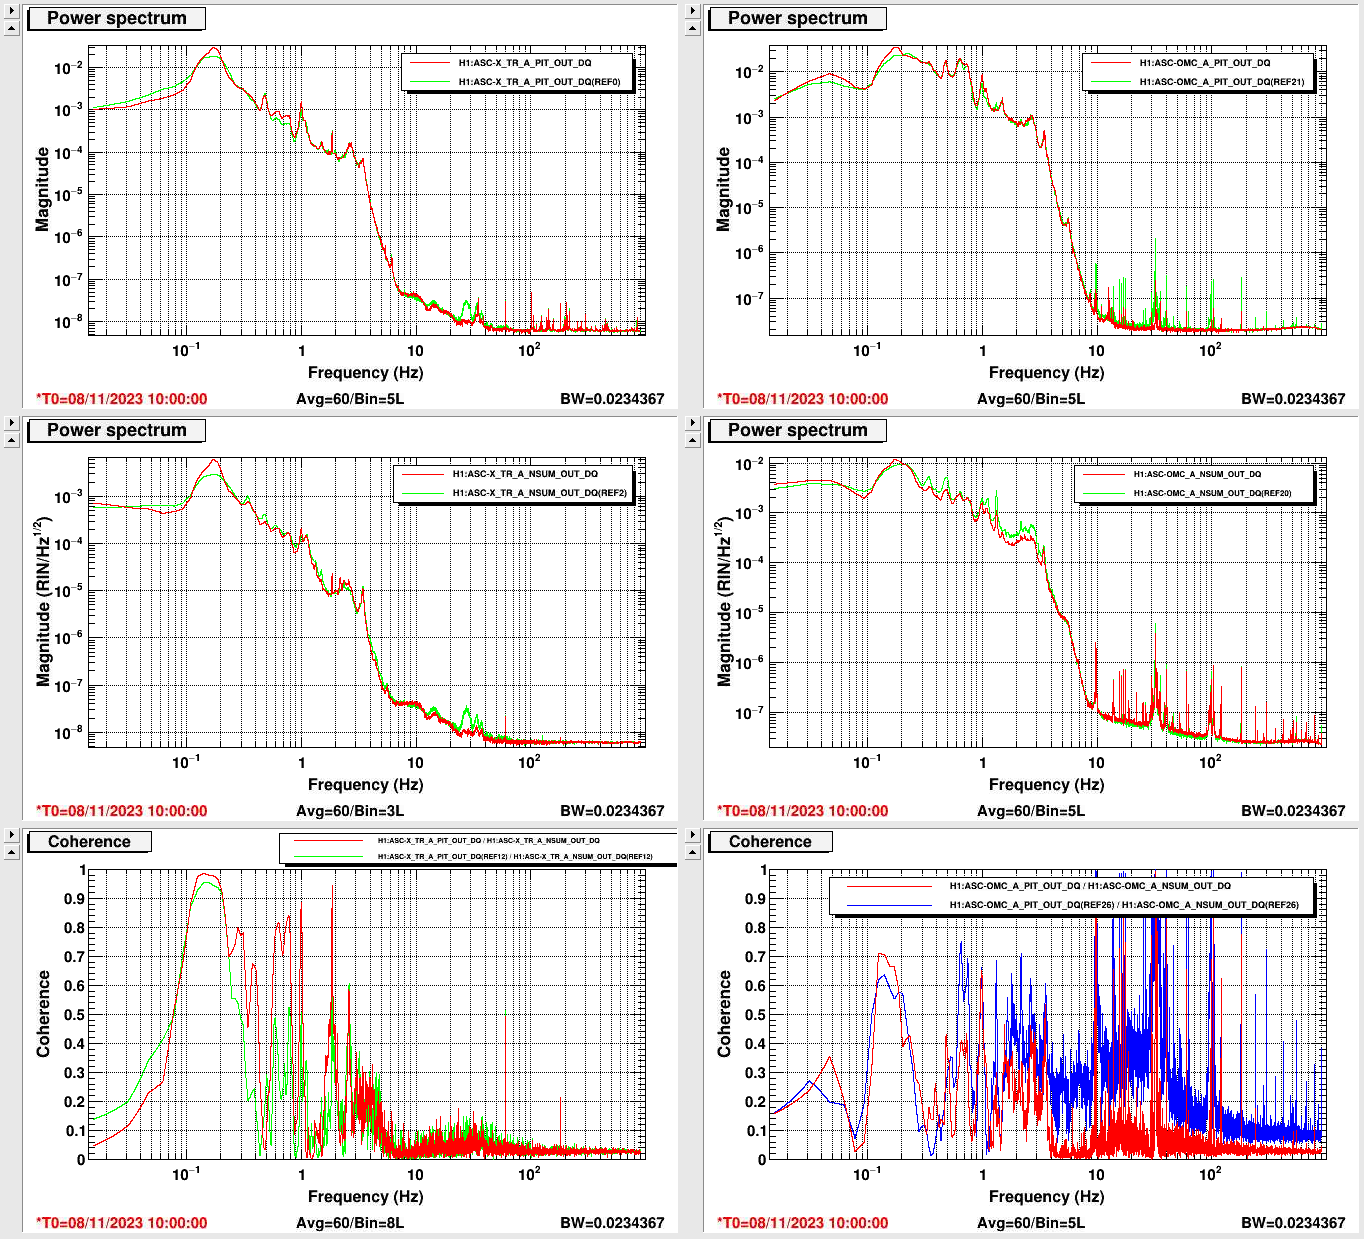
Anyway, 2nd attachment shows that disabling the LPF for OMC QPD SUM for normalization made a big reduction in AM to ASC leakage (2nd attachment right column, though only OMC_A is shown here). NSUM is calibrated to RIN. Current traces are from last night after the LPFs were disabled (Nov/08/2023 10:00:00 UTC), and references are before (Nov/07/2023 02:30:00 UTC), both in nominal low noise. As you can see, disabling LPF reduced the intensity noise coupling to OMC ASC by a large amount especially for f>10Hz. (I'm sure that the coupling was reduced at lower frequency too but it's hard to see the effect w/o injection.)
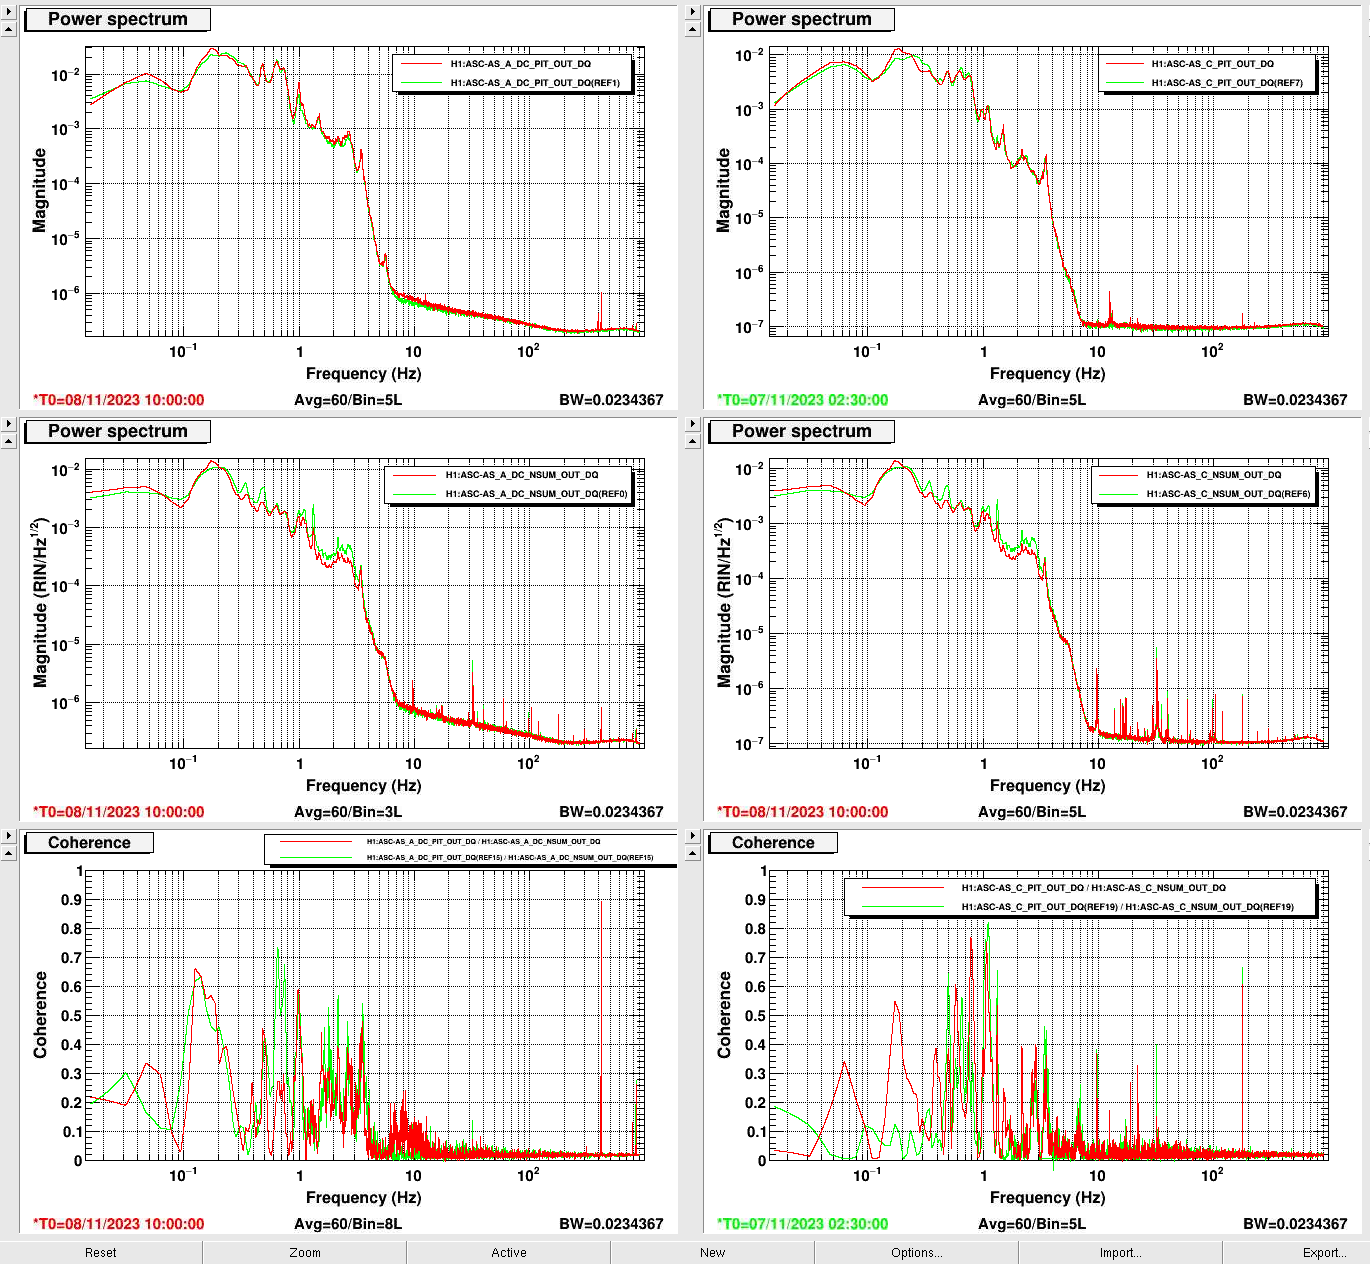
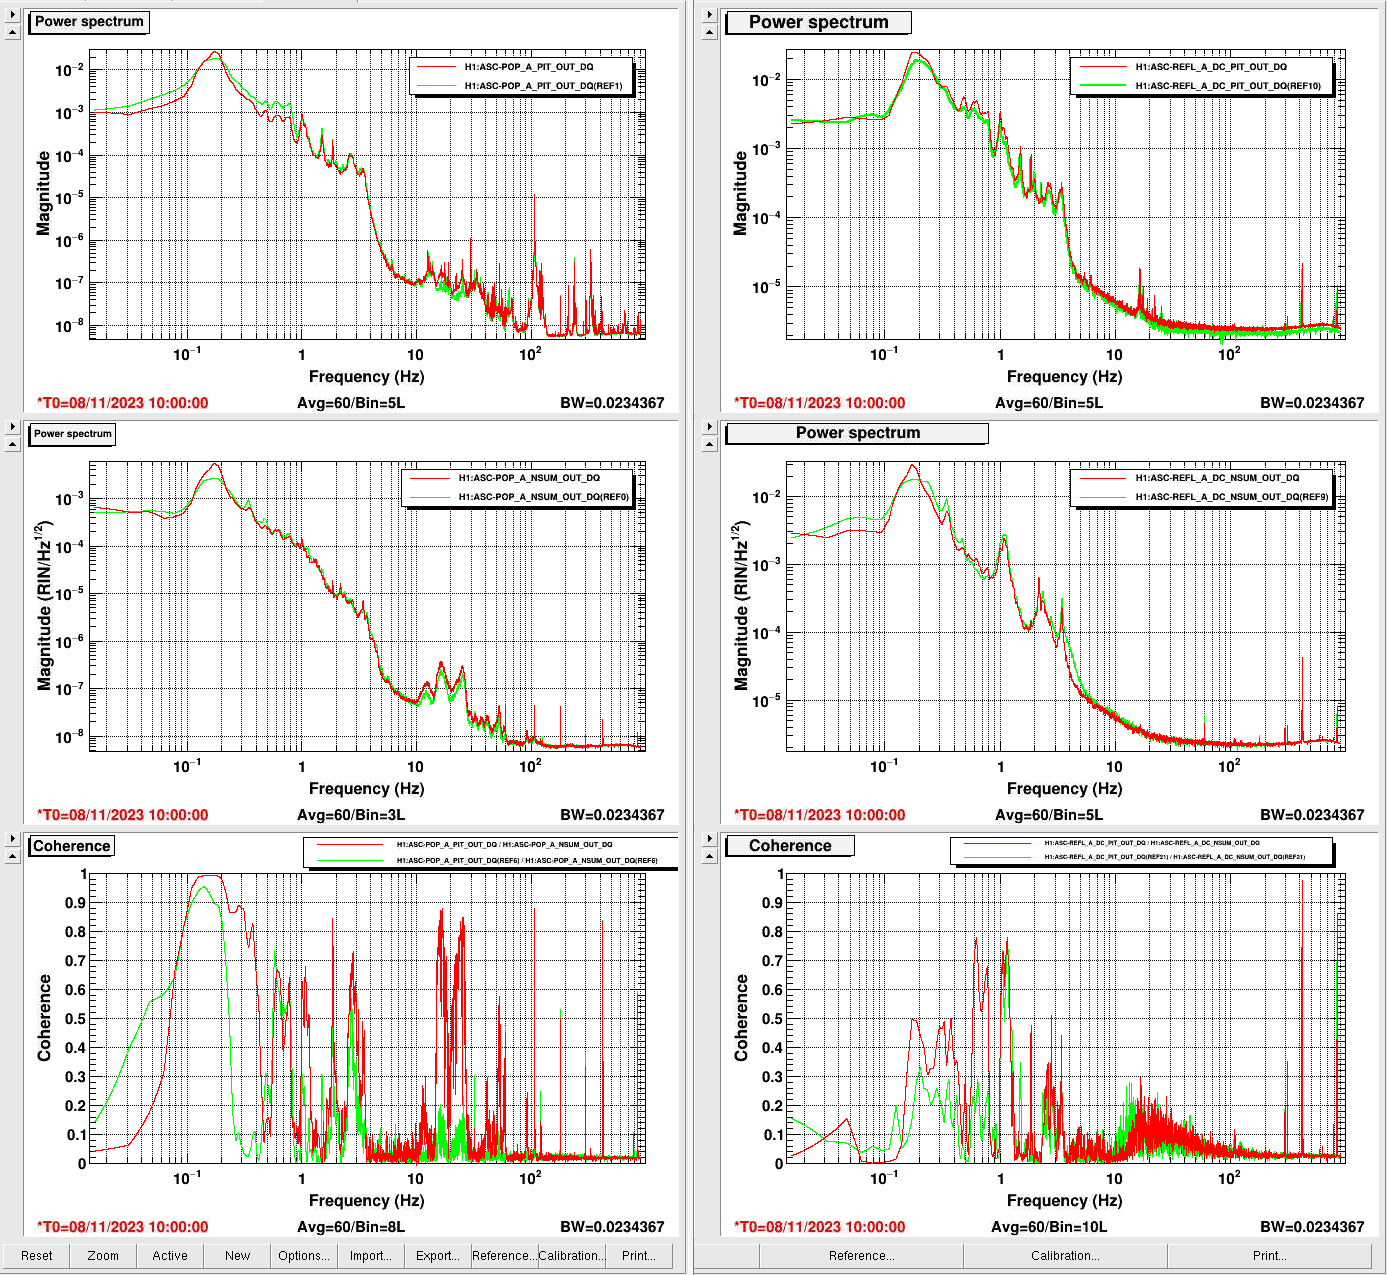
3rd and 4th attachment show similar plots for ASC-AS_[ABC], ASC-REFL and in-vac POP. I haven't done any deep analysis but there doesn't seem to be much improvement if any. In general, the larger the centering offset is, the bigger the intensity noise coupling is with LPF on, so it's understandable that the OMC qpds show the obvious improvements (because they have crazy centering offsets and the coupling was high with the LPF ON).