H1 was brought into a safe state.
All models are being shutdown in preparation for replacing the MSR timing master. We are keeping h1susauxb123 going for as long as it and the DAQ can to maintain vacuum trends.
TITLE: 11/03 Eve Shift: 23:00-07:00 UTC (16:00-00:00 PST), all times posted in UTC
STATE of H1: Lock Acqusition
OUTGOING OPERATOR: Austin
CURRENT ENVIRONMENT:
SEI_ENV state: CALM
Wind: 6mph Gusts, 4mph 5min avg
Primary useism: 0.02 μm/s
Secondary useism: 0.17 μm/s
QUICK SUMMARY: H1 had just relocked to NLN and lost lock while waiting for ADS to converge. H1 is now relocking.
TITLE: 11/03 Day Shift: 15:00-23:00 UTC (08:00-16:00 PST), all times posted in UTC
STATE of H1: Lock Aquisition
INCOMING OPERATOR: Ryan S
SHIFT SUMMARY:
- EX saturation @ 16:24
- 18:21 - inc 5.6 EQ from Nepal
- 18:52 - inc 5.1 EQ from Russia
- Lockloss @ 20:18, caused by MICH FF test
- Relocking:
- Lockloss @ 22:08, due to PUM crossover measurement
- Relocking:
- 22:43 - PSL DM 102 alert 300 nm, counts spiked to 310
LOG:
| Start Time | System | Name | Location | Lazer_Haz | Task | Time End |
|---|---|---|---|---|---|---|
| 15:58 | FAC | Karen | Optics Lab/VAC Prep | N | Tech clean | 16:17 |
| 16:00 | FAC | Tyler/Eric | CER | N | Rack work | 19:16 |
| 16:36 | PEM | Robert | EX | N | Change frequency of pump | 18:06 |
| 17:36 | VAC | Jordan/Travis | MY | N | Drop off parts | 18:02 |
| 18:17 | CDS | Erik/Fil | Roof | N | Check antenna (staying on platform) | 18:27 |
| 20:10 | ISC | Naoki | CR | N | MICH FF tuning | 20:21 |
| 20:11 | PEM | Robert | EX/Y/CER | N | Grab parts/set up | 21:09 |
| 20:28 | VAC | Travis/Jordan | LVEA | N | Roll in a rack | 20:49 |
| 20:28 | EPO | Jenne + 5 | LVEA | N | Quick walkaround | 20:49 |
| 21:29 | VAC | Travis | MY | N | Grab parts | 21:49 |
As was briefly mentioned in alogs 73853 and 73917, I injected into thermistor 2 (hot one which is directly mounted on the compression ring of the OM2 mirror) and thermistor 1 (cold one mounted on the back of the T-SAMS structure) independently, and measured the transfer fucntion from the injection to DCPD-SUM (and some other TFs).
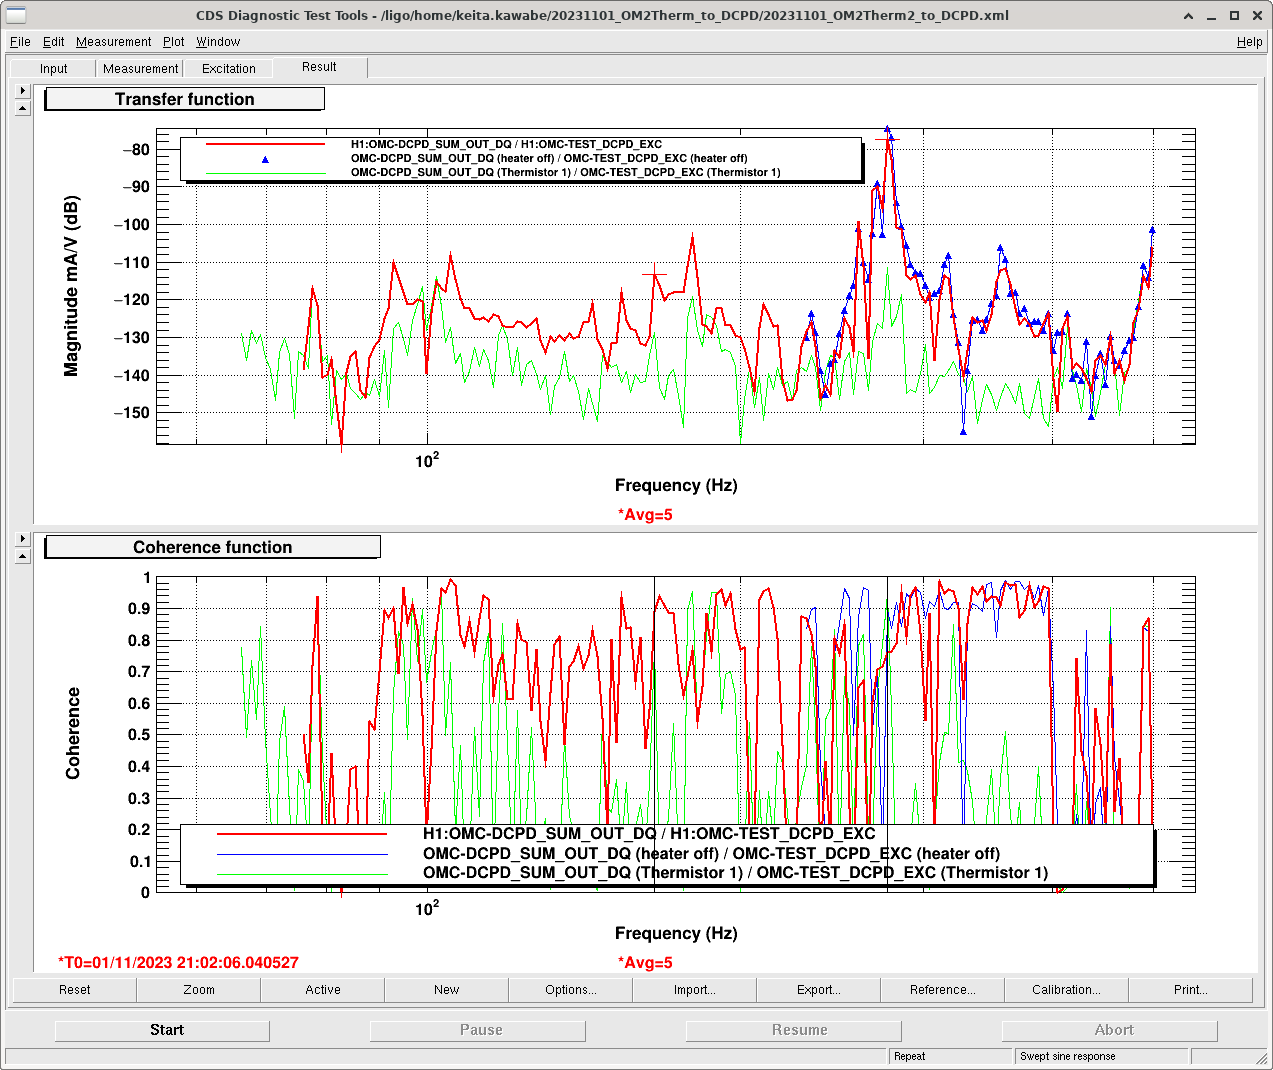
All traces in the attached show the transfer function and coherence from OMC-TEST_EXC (calibrated to the voltage across the Thermistor) and DCPD_SUM (in mA) when H1 is in high power. Red is the injection into Thermistor 2 (hot one), green is into Thermistor 1 (cold one), both while the heater was ON. There are many peaks, most notably the one centered at around 277Hz (that's where CW people observed the most problematic comb structure) but there are others like 78, 93, 105, 144, 154, 166, 314 and 356Hz with good coherence.
The coupling is actually very small for broadband noise, it's only problematic for lines like we've experienced. For example, even if we take the peak at 277Hz (-75dB = 1.8E-4 mA/V) for Thermistor 2, in order for the voltage noise to be comparable to e.g. the shot noise for 40mA DC (~1.1E-7 mA/sqrtHz), the voltage noise should be ~600uV/sqrtHz (because 1.1E-7 [mA/sqrtHz] / 1.8E-4 [mA/V]) at 277Hz, which is a big number.
Thermistor 1 TF amplitude is smaller by more than 30dB than Thermistor 2 measured at around the 277Hz peak. This cannot be explained by the current difference due to lower resistance of the hotter thermistor (thermistor 1 is 7.41k, thermistor 2 is 4.08k, measured on the floor). It should be the location of the thermistor. FYI Thermistor 2 is mounted on the compression ring of the T-SAMS and is therefore much closer to the mirror than Thermistor 1 that is mounted on the back.
Within the resolution of this measurement, frequencies of Thermistor 1 peaks that are visible do match with Thermistor 2, but the resolution is not great (~2Hz at around 277Hz) so it's not clear if we're looking at the same resonance driven by different thermistors, or if this is actually two different resonances, each belonging to one thermistor but not the other.
Blue is the injection into Thermistor 2, but this time the measurement was done immediately after the heater was turned OFF. I only measured down to 220Hz or so, but anyway I see no real difference between the blue and the red. This means that the magnetic field formed by the heater loop around the mirror is NOT relevant for the coupling. Since our experience was that the comb was NOT there while the OM2 was cold, maybe the coupling is dependent on the tightness of the compression ring.
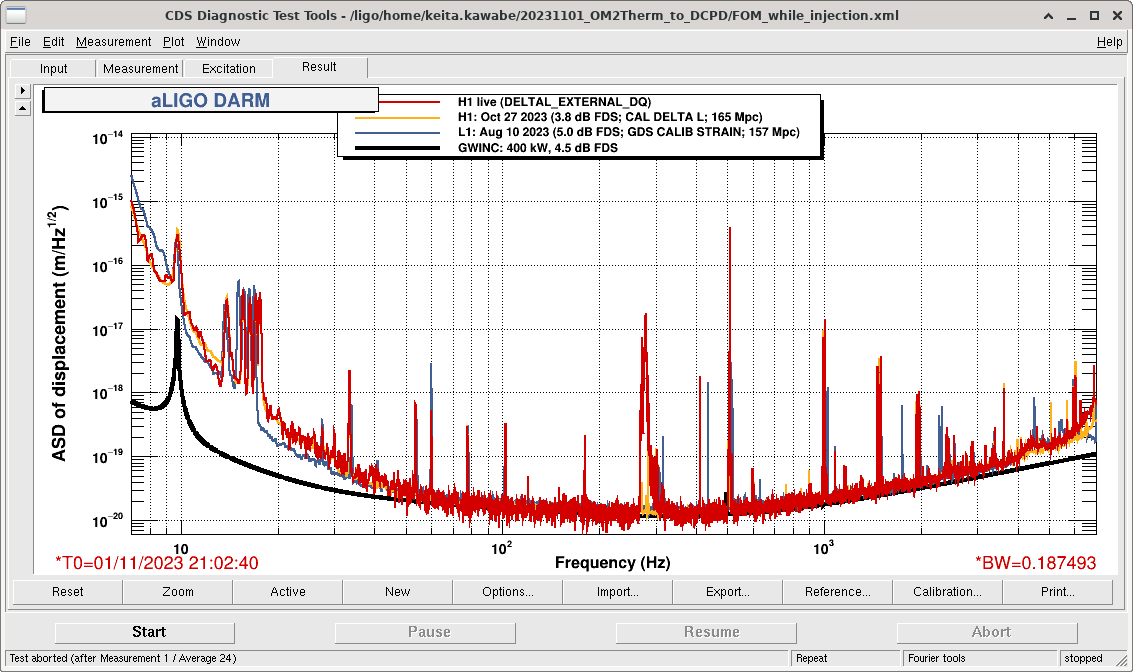
Injection amplitude was constant (A=8000 i.e. 16000cts pp sine wave for all frequencies, corresponding to ~4.9Vpp across the thermistor), and I was making huge lines in DARM (2nd attachment).
After the measurement, all breakout boards and temporary cables and handheld voltage reference and things were disconnected from the system (but were left on the work table by HAM6, I'll pick them up during the next maintenance). EXC cable was connected back to the DCPD whitening, and Beckhoff cable was connected back to the OM2 heater driver.
Do you see the responce in the DCPDs without the light i.e. is the coupling purely electric ?
No, without any light on the DCPD there were no lines on it.
We also tested direct coupling into the OMC PZT by putting the OMC half off the fringe using a direct laser beam. No signal as well.
Closes 26483, last checked here
check_T240_centering.py
There are 13 T240 proof masses out of range ( > 0.3 [V] )!
ETMX T240 2 DOF X/U = -0.937 [V]
ETMX T240 2 DOF Y/V = -1.133 [V]
ETMX T240 2 DOF Z/W = -0.307 [V]
ITMX T240 1 DOF X/U = -0.856 [V]
ITMX T240 1 DOF Y/V = 0.343 [V]
ITMX T240 1 DOF Z/W = 0.479 [V]
ITMX T240 3 DOF X/U = -0.839 [V]
ITMY T240 3 DOF X/U = -0.508 [V]
ITMY T240 3 DOF Z/W = -1.169 [V]
BS T240 1 DOF Y/V = -0.4 [V]
BS T240 3 DOF Y/V = -0.319 [V]
BS T240 3 DOF Z/W = -0.501 [V]
HAM8 1 DOF Z/W = -0.456 [V]
All other proof masses are within range ( < 0.3 [V] ):
ETMX T240 1 DOF X/U = 0.237 [V]
ETMX T240 1 DOF Y/V = 0.149 [V]
ETMX T240 1 DOF Z/W = 0.187 [V]
ETMX T240 3 DOF X/U = 0.129 [V]
ETMX T240 3 DOF Y/V = 0.138 [V]
ETMX T240 3 DOF Z/W = 0.12 [V]
ETMY T240 1 DOF X/U = 0.046 [V]
ETMY T240 1 DOF Y/V = 0.118 [V]
ETMY T240 1 DOF Z/W = 0.175 [V]
ETMY T240 2 DOF X/U = -0.043 [V]
ETMY T240 2 DOF Y/V = 0.178 [V]
ETMY T240 2 DOF Z/W = 0.058 [V]
ETMY T240 3 DOF X/U = 0.187 [V]
ETMY T240 3 DOF Y/V = 0.07 [V]
ETMY T240 3 DOF Z/W = 0.144 [V]
ITMX T240 2 DOF X/U = 0.158 [V]
ITMX T240 2 DOF Y/V = 0.279 [V]
ITMX T240 2 DOF Z/W = 0.266 [V]
ITMX T240 3 DOF Y/V = 0.171 [V]
ITMX T240 3 DOF Z/W = 0.155 [V]
ITMY T240 1 DOF X/U = 0.116 [V]
ITMY T240 1 DOF Y/V = 0.048 [V]
ITMY T240 1 DOF Z/W = -0.084 [V]
ITMY T240 2 DOF X/U = 0.079 [V]
ITMY T240 2 DOF Y/V = 0.164 [V]
ITMY T240 2 DOF Z/W = 0.082 [V]
ITMY T240 3 DOF Y/V = 0.084 [V]
BS T240 1 DOF X/U = -0.173 [V]
BS T240 1 DOF Z/W = 0.06 [V]
BS T240 2 DOF X/U = -0.119 [V]
BS T240 2 DOF Y/V = -0.018 [V]
BS T240 2 DOF Z/W = -0.155 [V]
BS T240 3 DOF X/U = -0.223 [V]
HAM8 1 DOF X/U = -0.261 [V]
HAM8 1 DOF Y/V = -0.227 [V]
check_sts_centering.py
There are 2 STS proof masses out of range ( > 2.0 [V] )!
STS EY DOF X/U = -4.117 [V]
STS EY DOF Z/W = 2.69 [V]
All other proof masses are within range ( < 2.0 [V] ):
STS A DOF X/U = -0.562 [V]
STS A DOF Y/V = -0.996 [V]
STS A DOF Z/W = -0.365 [V]
STS B DOF X/U = 0.523 [V]
STS B DOF Y/V = 0.901 [V]
STS B DOF Z/W = -0.553 [V]
STS C DOF X/U = -0.422 [V]
STS C DOF Y/V = 0.783 [V]
STS C DOF Z/W = 0.291 [V]
STS EX DOF X/U = -0.221 [V]
STS EX DOF Y/V = 0.044 [V]
STS EX DOF Z/W = 0.109 [V]
STS EY DOF Y/V = 0.141 [V]
STS FC DOF X/U = 0.327 [V]
STS FC DOF Y/V = -0.835 [V]
STS FC DOF Z/W = 0.748 [V]
Closes 26216
Laser Status:
NPRO output power is 1.815W (nominal ~2W)
AMP1 output power is 68.35W (nominal ~70W)
AMP2 output power is 137.2W (nominal 135-140W)
NPRO watchdog is GREEN
AMP1 watchdog is GREEN
AMP2 watchdog is GREEN
PMC:
It has been locked 1 days, 3 hr 8 minutes
Reflected power = 15.51W
Transmitted power = 109.7W
PowerSum = 125.2W
FSS:
It has been locked for 0 days 0 hr and 5 min
TPD[V] = 0.8141V
ISS:
The diffracted power is around 2.7%
Last saturation event was 0 days 0 hours and 5 minutes ago
Possible Issues: None
Lockloss @ 22:08, due to PUM crossover measurement.
Lockloss @ 20:18, caused by commissioner error.
BSC high freq noise is elevated for these sensor(s)!!!
ITMX_ST2_CPSINF_H3
ITMX_ST2_CPSINF_V1
But this is a trend going back several weeks already .
Fri Nov 03 10:14:04 2023 INFO: Fill completed in 14min 0secs
Jordan confirmed a good fill from curbside.
Daniel, Erik, Dave, Fil:
Erik discovered that the DTS DAQ also crashed at the same times last night, indicating a site wide timing issue could be the cause.
Daniel just found that the MSR timing server is reporting GPS issues. We are investigating and checking the spares status.
I've opened FRS29567 for this issue
Daniel, Fil, Marc, Erik, Dave:
Daniel has taken a closer look at the timing master issues and he says it appears more likely that the timing master will need to be replaced rather than an issue with the roof antenna or its cabling.
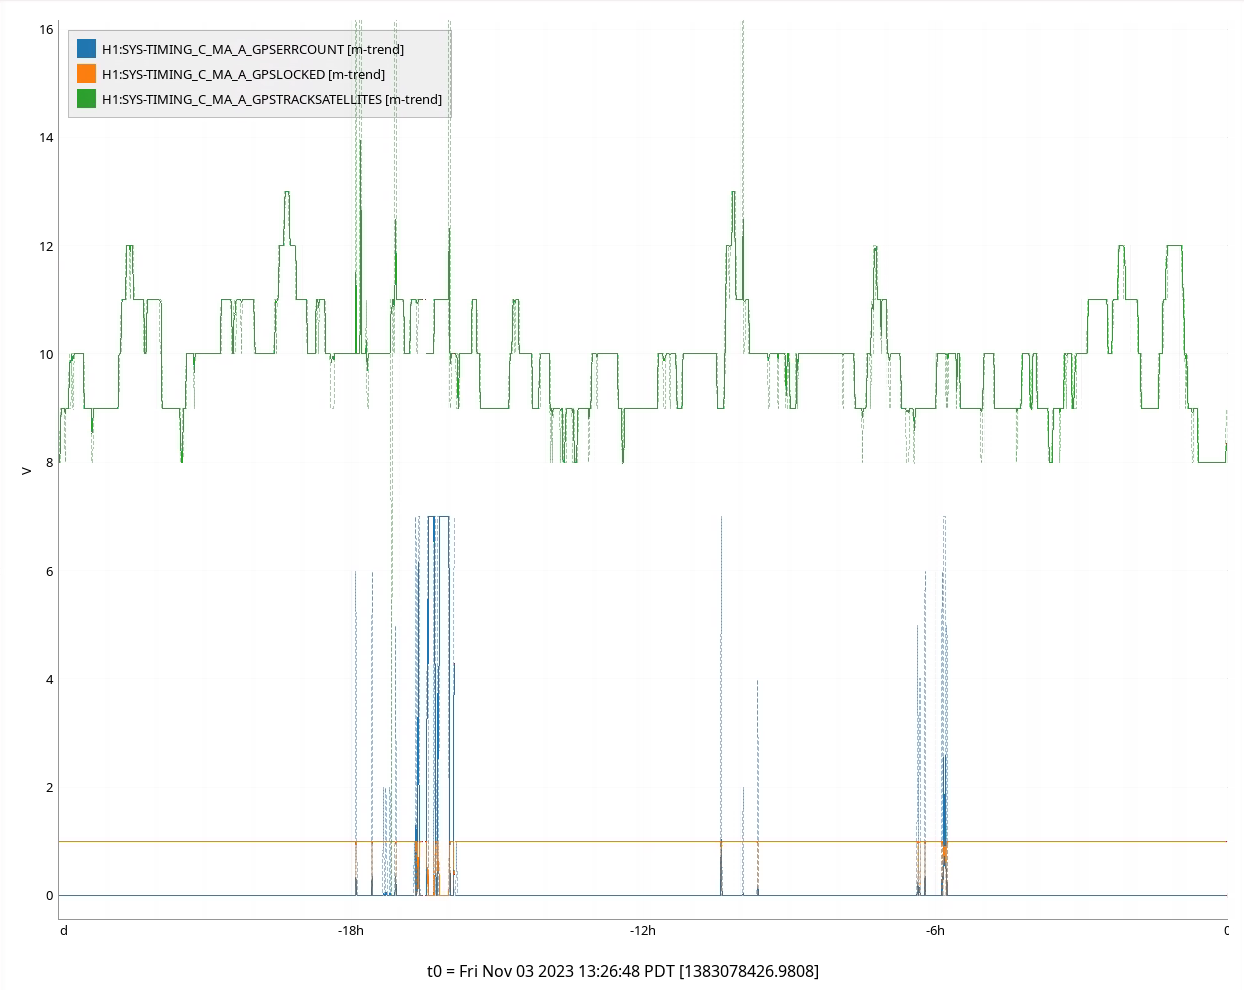
The attached 24 hour trend shows the timing master's GPS error count (blue) GPS locked status (orange) and number of tracked satellites (green).
The error burst on the left is 19:00 - 22:00 Thu night, which caused the two crashes. The smaller middle burst is 03:00 - 04:00 this morning. The larger right hand burst is 07:00 - 08:00 which was close to causing a crash.
Daniel further points out that the number of satellites remains good through out, and is sometimes too big (>60).
This all points to an internal error in the timing master and not an antenna issue.
We are readying the spare master chassis for a swap out.
In preparation for another potential timing error this weekend, I have pushed the current pitch/yaw offsets to SDF for the following suspensions: ETMX/Y, TMSX/Y, BS, PRM, SRM, SR2/3, PR2/3, MC1/2/3, IM1/4.
Daniel, Erik, Dave:
For a sanity check we verified that the DAQ's GPS time is correct.
Currently this is a hand calculation, Erik is writing code to automate it.
I checked two times:
14:00:00 Fri 03 Nov 2023 PDT (just a few minutes ago)
21:10:00 Thu 02 Nov 2023 PDT (between the first and second crash last night)
Decoding the CNS-II GPS receivers' IRIG-B channels recorded in the DAQ as H1:CAL-PCALX_IRIGB_DQ, H1:CAL-PCALY_IRIGB_DQ I get the UTC times:
21:00:18
04:10:18
PDT/UTC diff is +7hr. The GPS/UTC leap second diff is currently 18 seconds, so the DAQ timing is correct.
Austin's having pushed the slider values to the suspensions was extremely helpful in our recovery later in the afternoon. For the future, I suggest we also (a) Offload the IMC WFS (which I had forgotten to do on Tuesday, and forgetting caused a lot of difficulty) before doing this, and then (b) including *every* suspension just in case, and (c) Jeff reminds me that we should also include the IMC PZT when doing this. But, already having had most of them pushed was already a huge time saver!
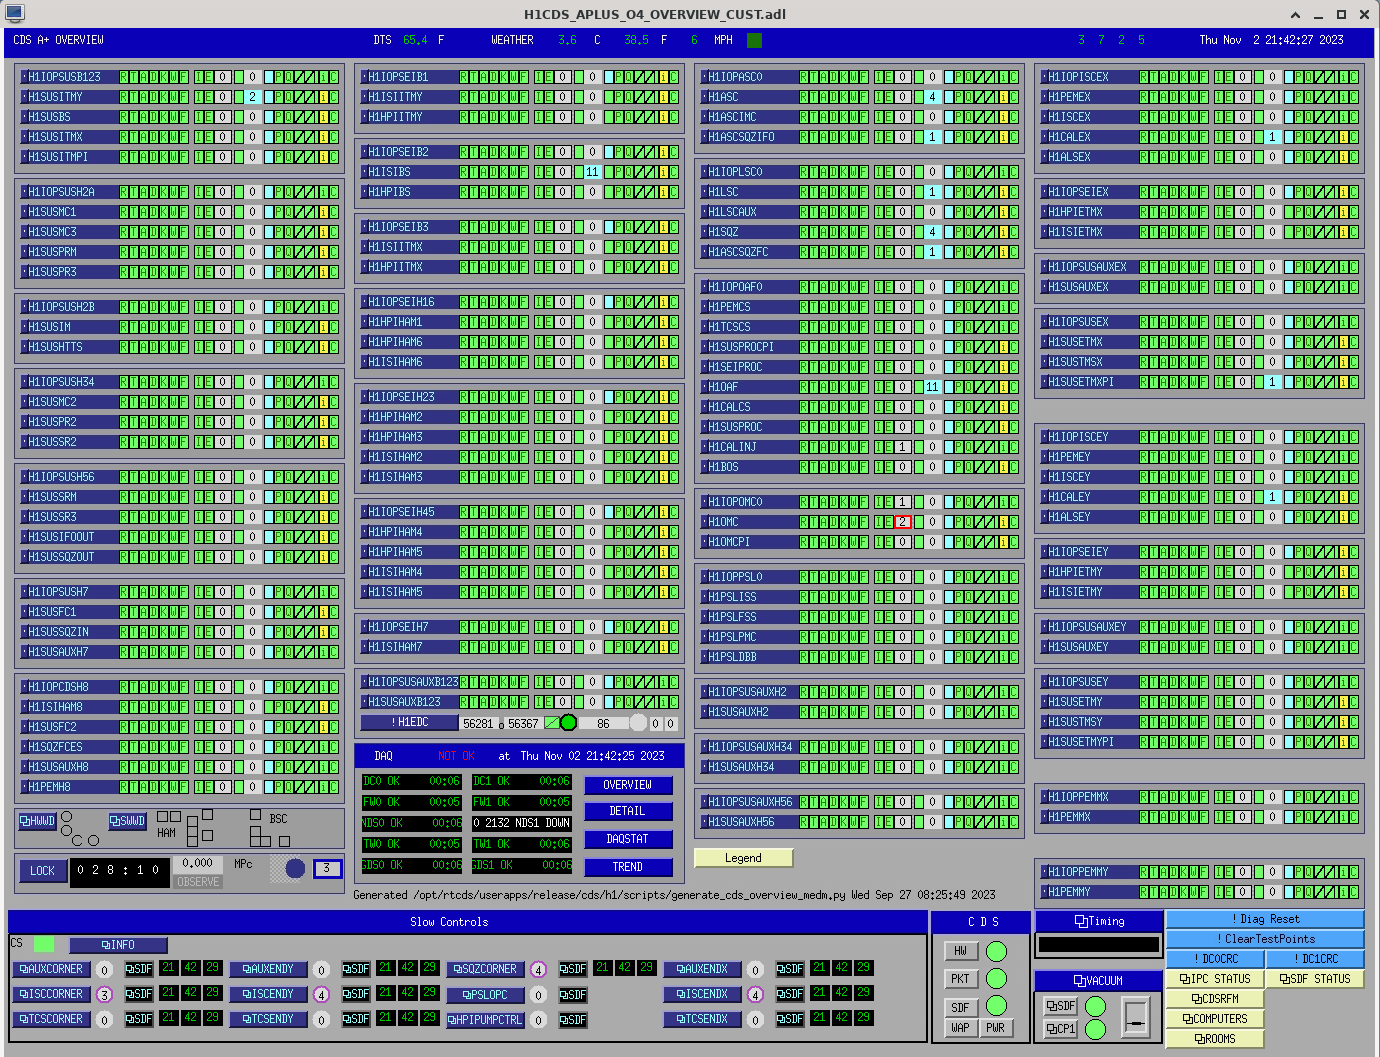
At 21:00:16 most of the front end systems showed multiple IPC errors. This corresponds to the lock loss.
Around this time the DAQ restarted itself. The DAQ then did a second restart at 21:36.
At the time of writing (23:15) the DAQ has been running for 1hr 39mins.
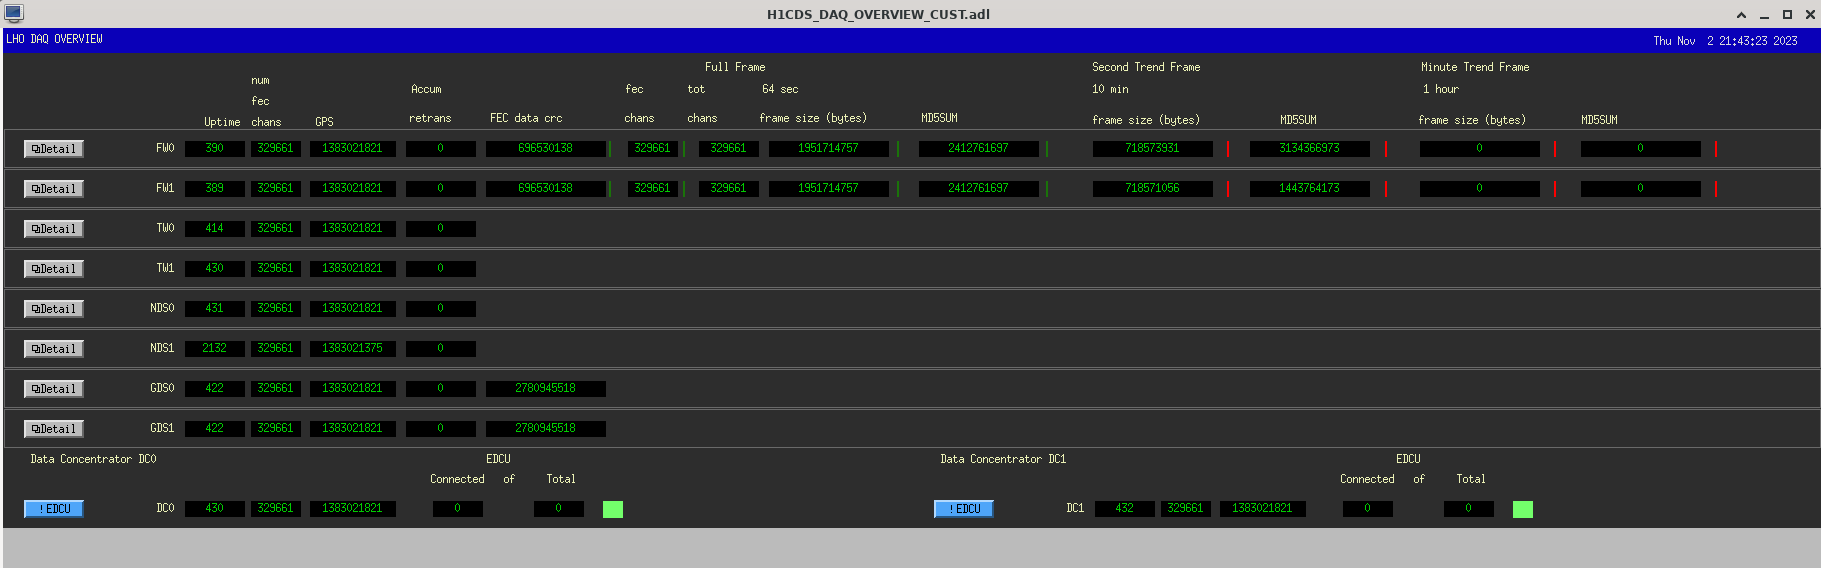
The CDS overview before any recovery is attached. Note that it appears that only models with Dolphin IPC receivers are showing IPC errors, for corner stations and end stations.
There were two NDS issues; NDS1 was frozen with an uptime of 2132 (time of second DAQ crash) and NDS0 was running for 1 second longer than DC0.
For immediate recovery I issued a DIAG_RESET to verify all the IPC errors were from transients and not currently active (this was verified) and I restarted both NDS1 (to unstick it) and NDS0 (to ensure it was synced with DC0).
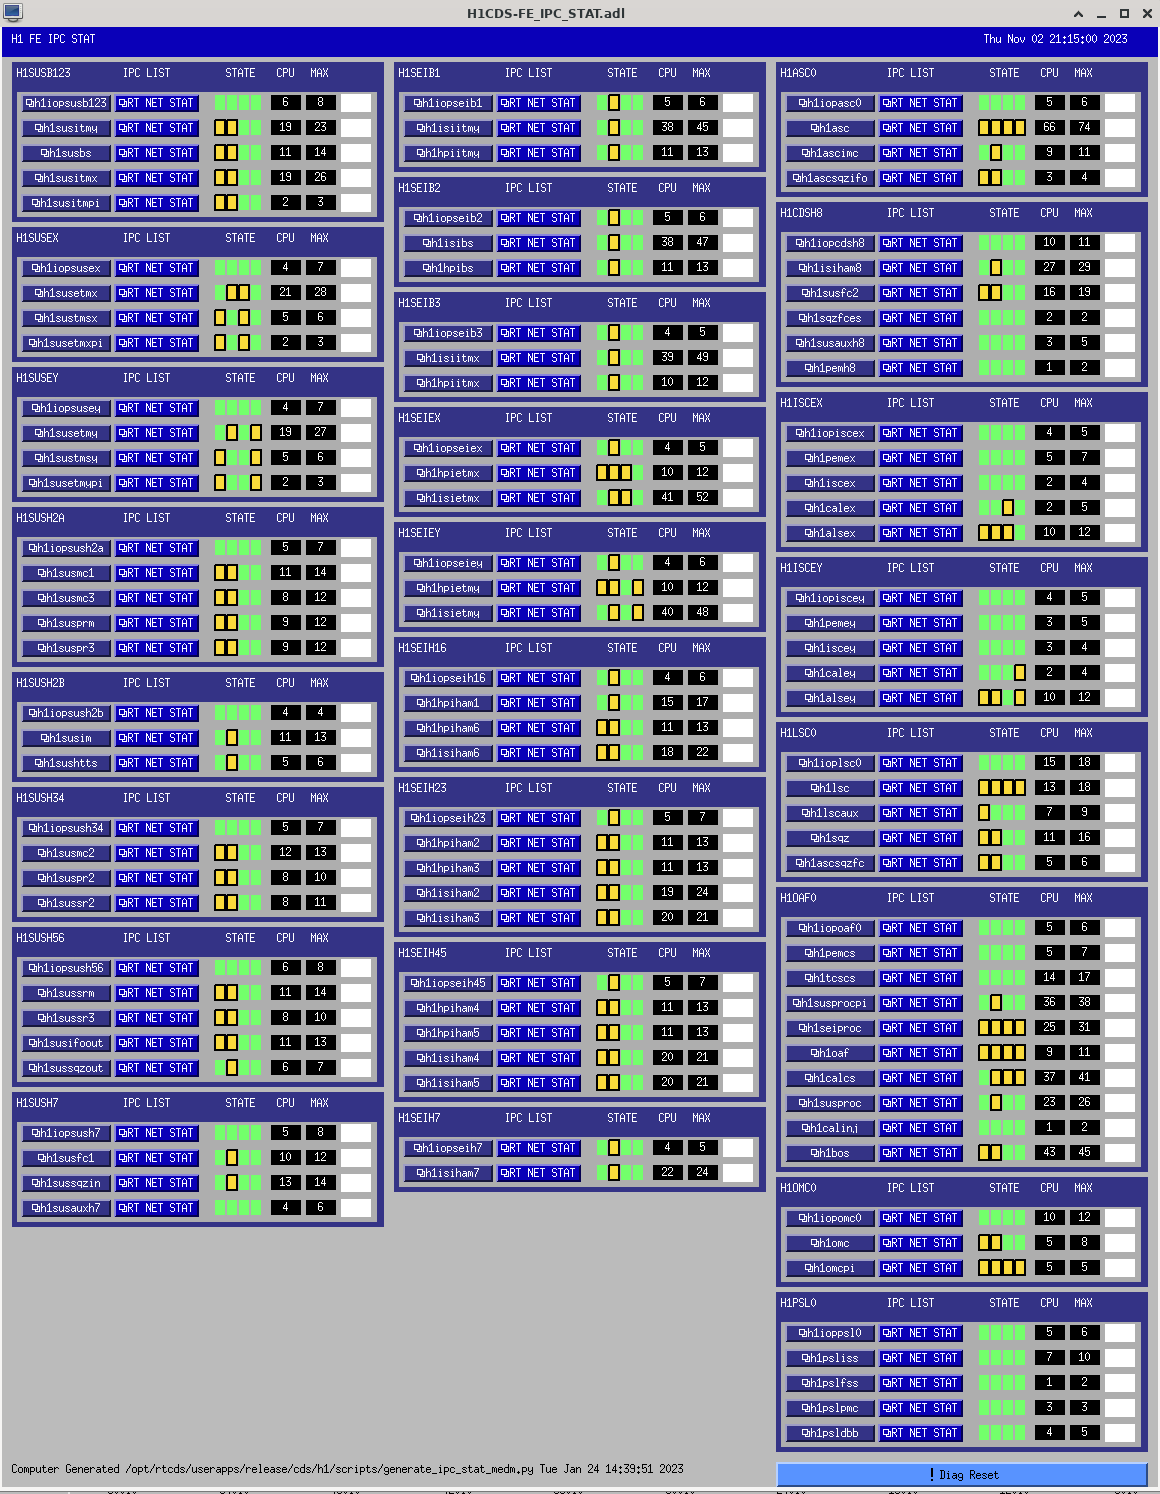
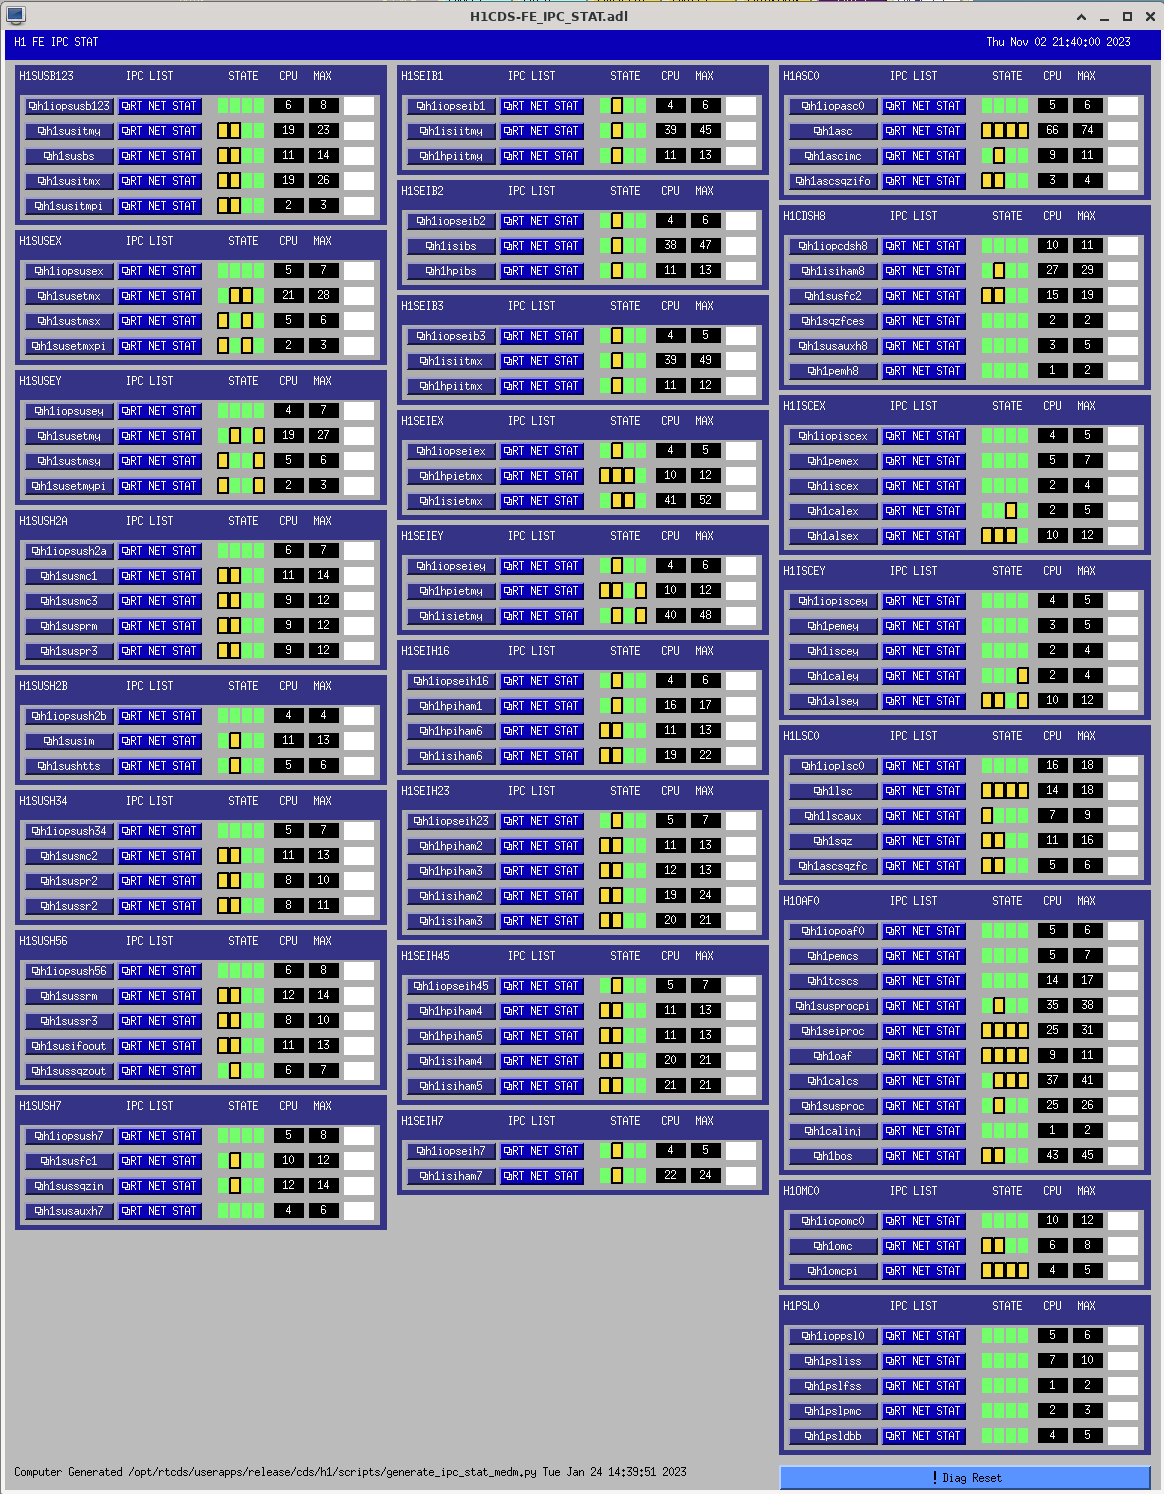
Here is a time machine capture of the IPC errors at 21:15 (after the 21:00 crash and when DAQ was back) and 21:40 (after the 21:36 crash, when DAQ was back and before I issued the DIAG_RESET at 21:42)
Note that all types of IPC are erroring (SHMEM, Dolphin, X-arm, Y-arm). The errors are geographically consistent (EX has only X-arm, EY has only Y-arm, CS has both).
In the morning I'll do a channel-by-channel scan to see if they all errored at the same time.
Dolphin dis_diag error scan
I ran a dis_diag scan on the Dolphined frontends. The only two FEs which showed errors were h1lsc0 and h1asc0, but the last scan was ran at 11am Tuesday and we then rebooted these two machines at 1pm Tuesday for the IO Chassis work, so these could be errors from that time.
The errors have been cleared, I'll rescan in the morning
h1lsc0 Uncorrectable Link Errors: 9
h1asc0 Uncorrectable Link Errors: 9
Test stand DAQ restarted at the same times plus two seconds for the same reason: data starvation from front ends. It's a separate network, isolated from CDS. The common component is the timing system. A timing discontinuity from the IOP models would explain all systems, including IPC errors and interruption of DAQ data.
Test stand daq log
Nov 02 21:00:19 x1daqdc0 daqd[30510]: Dropped data from shmem or received 0 dcus; gps now = 1383019237, 0; was = 1383019228, 13; dcu count = 5
Nov 02 21:00:19 x1daqdc0 daqd[30510]: expected gps = 1383019228
Nov 02 21:00:19 x1daqdc0 daqd[30510]: expected cycle = 14
Nov 02 21:00:19 x1daqdc0 daqd[30510]: expected nano = 62500013
Nov 02 21:00:19 x1daqdc0 daqd[30510]: first 5 dcuids seen
Nov 02 21:00:19 x1daqdc0 daqd[30510]: saw dcu 166 - gps: 1383019237 nano: 0 cycle: 0
Nov 02 21:00:19 x1daqdc0 daqd[30510]: saw dcu 161 - gps: 1383019237 nano: 0 cycle: 0
Nov 02 21:00:19 x1daqdc0 daqd[30510]: saw dcu 36 - gps: 1383019237 nano: 0 cycle: 0
Nov 02 21:00:19 x1daqdc0 daqd[30510]: saw dcu 34 - gps: 1383019237 nano: 0 cycle: 0
Nov 02 21:00:19 x1daqdc0 daqd[30510]: saw dcu 35 - gps: 1383019237 nano: 0 cycle: 0
Nov 02 21:00:20 x1daqdc0 kernel: dqprod[30534]: segfault at 7f11acedb9d0 ip 00007f12313ac2e8 sp 00007f116b9bac40 error 4 in libpthread-2.28.so[7f12313a9000+f000]
Nov 02 21:00:20 x1daqdc0 kernel: Code: 00 00 41 56 41 55 41 54 55 53 48 83 ec 40 64 48 8b 04 25 28 00 00 00 48 89 44 24 38 31 c0 48 85 ff 0f 84 1b 01 00 00 48 89 fb <8b> bf d0 02
Nov 02 21:00:20 x1daqdc0 systemd[1]: rts-daqd.service: Main process exited, code=killed, status=11/SEGV
Nov 02 21:00:20 x1daqdc0 systemd[1]: rts-daqd.service: Failed with result 'signal'.
Nov 02 21:36:08 x1daqdc0 daqd[5453]: Dropped data from shmem or received 0 dcus; gps now = 1383021386, 0; was = 1383021377, 13; dcu count = 5
Nov 02 21:36:08 x1daqdc0 daqd[5453]: expected gps = 1383021377
Nov 02 21:36:08 x1daqdc0 daqd[5453]: expected cycle = 14
Nov 02 21:36:08 x1daqdc0 daqd[5453]: expected nano = 62500013
Nov 02 21:36:08 x1daqdc0 daqd[5453]: first 5 dcuids seen
Nov 02 21:36:08 x1daqdc0 daqd[5453]: saw dcu 166 - gps: 1383021386 nano: 0 cycle: 0
Nov 02 21:36:08 x1daqdc0 daqd[5453]: saw dcu 161 - gps: 1383021386 nano: 0 cycle: 0
Nov 02 21:36:08 x1daqdc0 daqd[5453]: saw dcu 36 - gps: 1383021386 nano: 0 cycle: 0
Nov 02 21:36:08 x1daqdc0 daqd[5453]: saw dcu 34 - gps: 1383021386 nano: 0 cycle: 0
Nov 02 21:36:08 x1daqdc0 daqd[5453]: saw dcu 35 - gps: 1383021386 nano: 0 cycle: 0
Nov 02 21:36:09 x1daqdc0 kernel: dqprod[5475]: segfault at 7f04e0edb9d0 ip 00007f05640162e8 sp 00007f04a55b9c40 error 4 in libpthread-2.28.so[7f0564013000+f000]
Nov 02 21:36:09 x1daqdc0 kernel: Code: 00 00 41 56 41 55 41 54 55 53 48 83 ec 40 64 48 8b 04 25 28 00 00 00 48 89 44 24 38 31 c0 48 85 ff 0f 84 1b 01 00 00 48 89 fb <8b> bf d0 0
Nov 02 21:36:09 x1daqdc0 systemd[1]: rts-daqd.service: Main process exited, code=killed, status=11/SEGV
Nov 02 21:36:09 x1daqdc0 systemd[1]: rts-daqd.service: Failed with result 'signal'.
h1daqdc0:
Nov 02 21:00:15 h1daqdc0 daqd[315938]: Dropped data from shmem or received 0 dcus; gps now = 1383019233, 0; was = 1383019226, 13; dcu count = 19
Nov 02 21:00:15 h1daqdc0 daqd[315938]: expected gps = 1383019226
Nov 02 21:00:15 h1daqdc0 daqd[315938]: expected cycle = 14
Nov 02 21:00:15 h1daqdc0 daqd[315938]: expected nano = 62500013
Nov 02 21:36:04 h1daqdc0 daqd[327260]: Dropped data from shmem or received 0 dcus; gps now = 1383021382, 0; was = 1383021375, 13; dcu count = 19
Nov 02 21:36:04 h1daqdc0 daqd[327260]: expected gps = 1383021375
Nov 02 21:36:04 h1daqdc0 daqd[327260]: expected cycle = 14
Nov 02 21:36:04 h1daqdc0 daqd[327260]: expected nano = 62500013
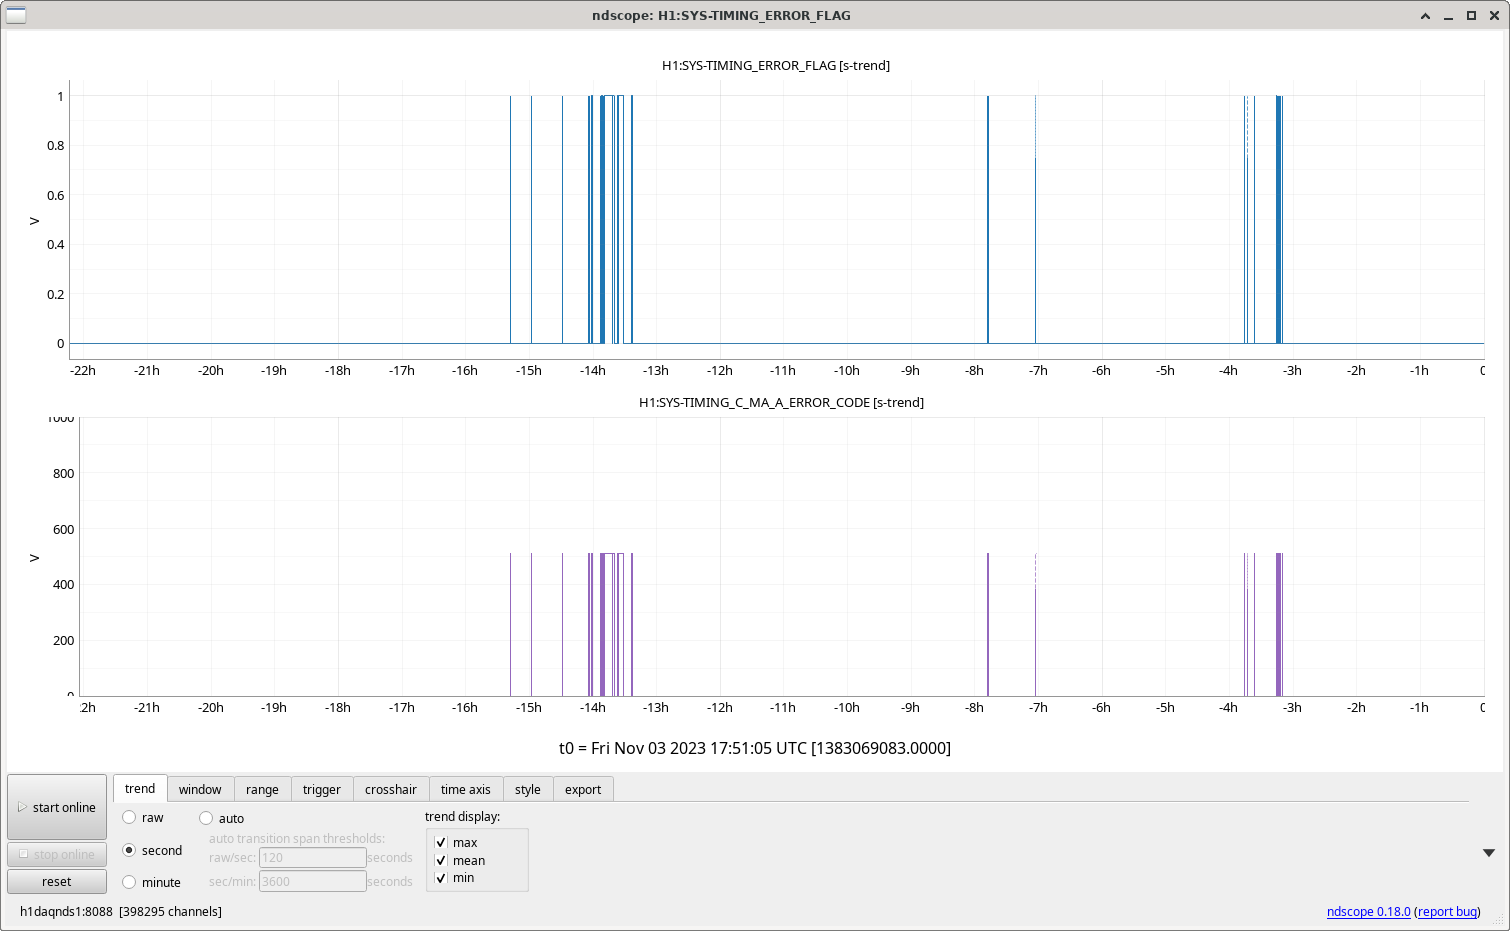
Timing master experiences trouble with GPS lock. 512 in the plot below indicates that the GPS module isn't locked to GPS.
Fil, Dave, control room:
In preparation for Fil's replacement of the +24V DC Power Supply which is powering h1lsc0 and h1asc0's IO Chassis, I have powered down these two front end computers.
Process was:
IPMI Reports:
WP 11502
Kepco power supply replaced. Both IO chassis and FE computers powered on.
Tue31Oct2023
LOC TIME HOSTNAME MODEL/REBOOT
12:59:06 h1lsc0 ***REBOOT***
12:59:07 h1asc0 ***REBOOT***
13:00:42 h1asc0 h1iopasc0
13:00:42 h1lsc0 h1ioplsc0
13:00:55 h1asc0 h1asc
13:00:55 h1lsc0 h1lsc
13:01:08 h1asc0 h1ascimc
13:01:08 h1lsc0 h1lscaux
13:01:21 h1asc0 h1ascsqzifo
13:01:21 h1lsc0 h1sqz
13:01:34 h1lsc0 h1ascsqzfc
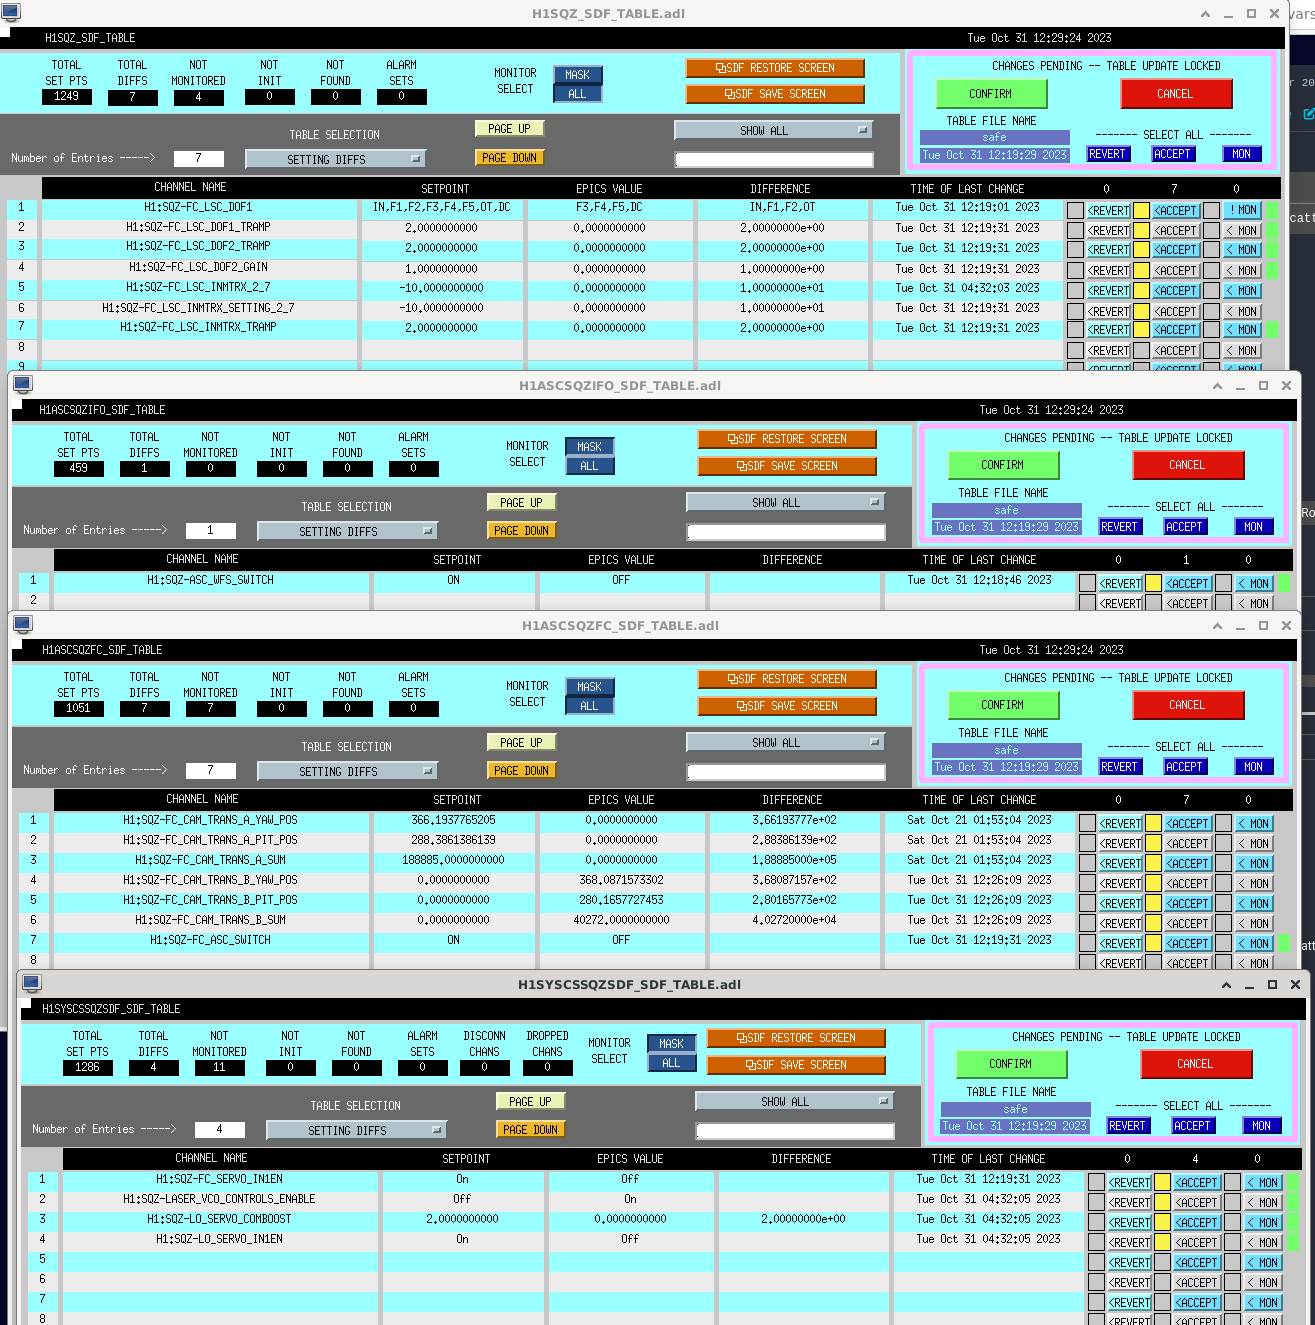
Attached sqz sdfs that Naoki and I set so that SQZ would come back in a good (with FC DOWN) state. Lots of these will need to be re-accepted later when SQZ is relocked as some of our sfae.snap and observe.snaps are linked files.
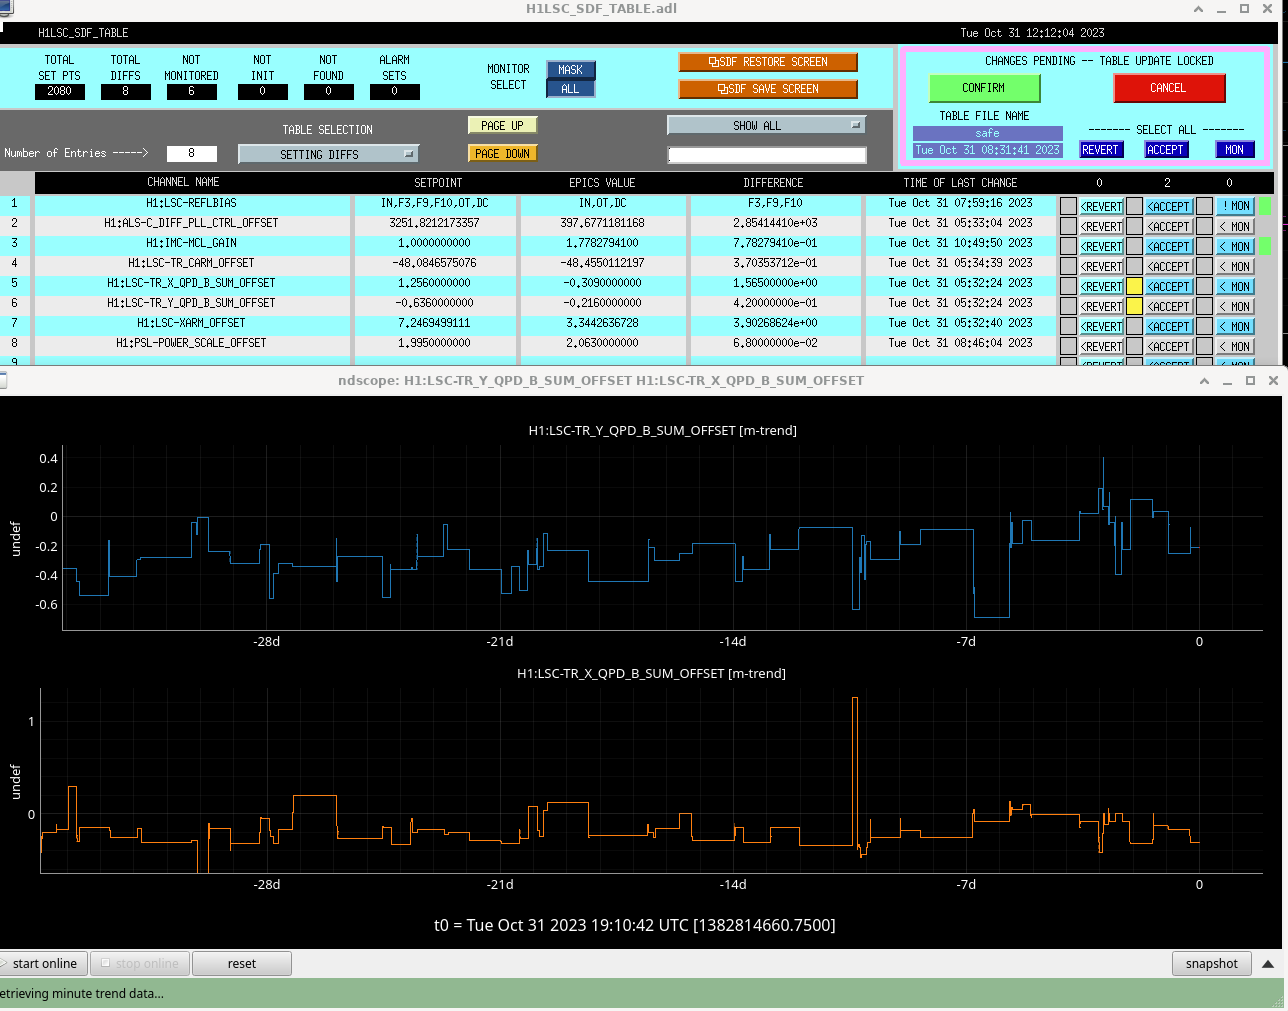
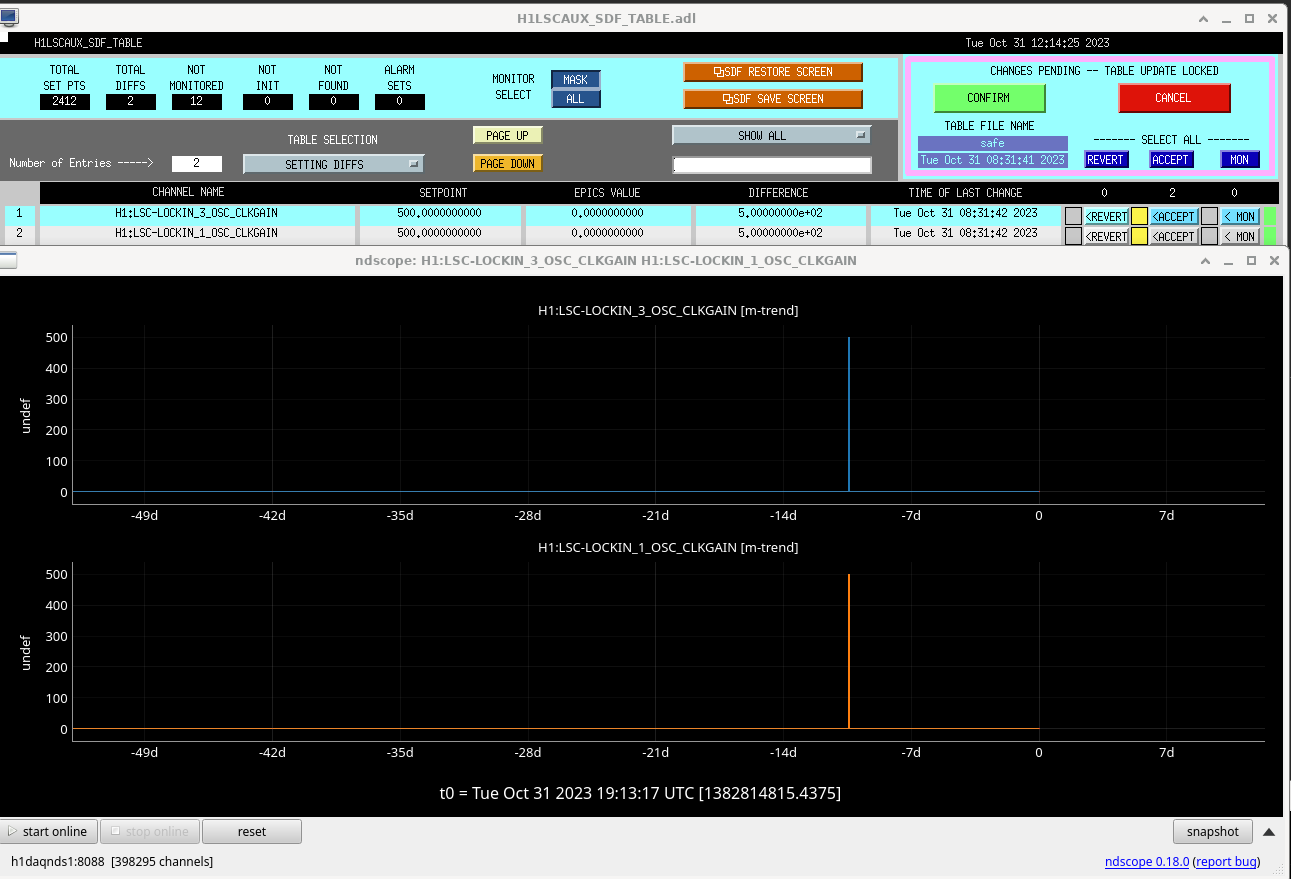
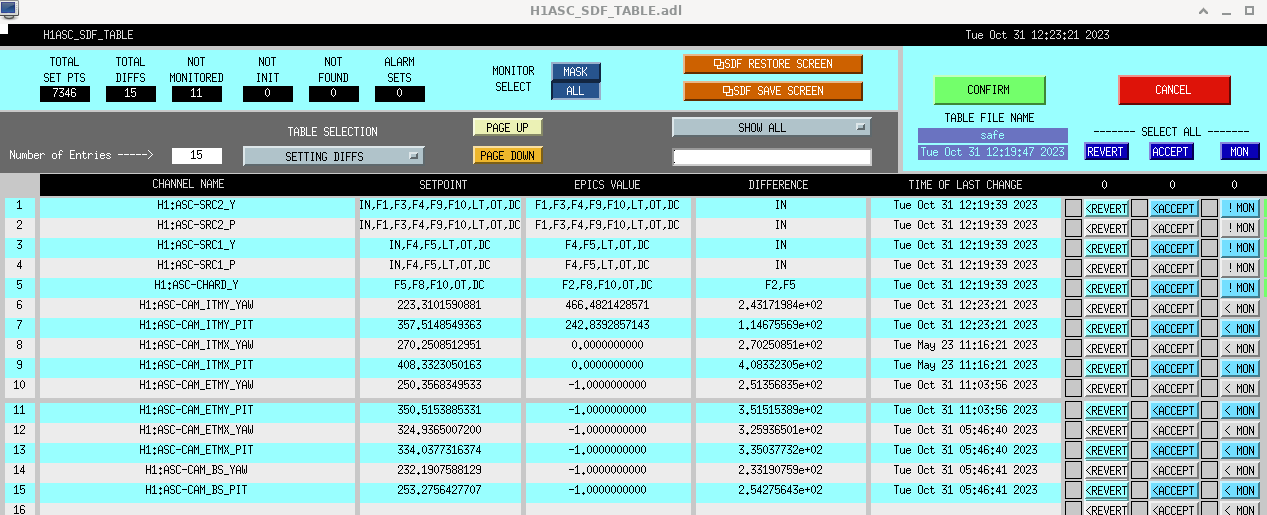
Jenne checked sdfs for h1asc, h1ascimc, h1lsc, h1lscaux.
Attached are SDF tables for h1lsc, h1lscaux, and h1asc. There were no diffs for h1ascimc.
The tables have the mask set to ALL, so that it was showing also differences that are not monitored, since *everything* gets reverted to the safe value when we boot a computer.
For h1lsc, I only accepted the TR QPD B offsets, to keep them roughly close to how they are when we've been locking. These do get reset every lock (which is why they are not monitored), but if we don't accept them then we'll struggle more than usual with finding IR when we're ready to relock. Everything else is either guardian controlled, or otherwise not so important.
For h1lscaux, I don't really know why those values of 500 were saved to have those oscillators on, but the scope shows that we don't usually actually use them. This sdf table is not reverted upon each relock (but would have been when we rebooted), so that's likely why we never noticed / cared about these values. Anyhow, we don't want random oscillators on (even if the output matrix is zeros so those don't go anywhere), so I accepted them to zeros.
For h1asc, I didn't accept any changes, but just in case we have confusion later, I took a screenshot of the diffs that we have.
There were no diffs at all for h1ascimc, so I didn't bother taking a screenshot of an empty SDF table.
Austin is working on bringing the IMC back online, and the alignment looks quite poor. In retrospect, I should have (and forgot to do) offloaded the IMC WFS to the suspensions, since the reboot will have lost the integrated alignment offsets that we were sending to the IMC suspensions. Austin is going to revert the IMC sus to their earlier top mass osem values as a way of hand-offloading the WFS, and hopefully the IMC will lock and behave after that.
H1-ISC-C1 IO ASC & LSC power supply was replaced on Tuesday. Supply location H1-VDC-C2 slot 22A (left side).
Outgoing Supply S1201935 Incoming supply (blank) New supply has ball bearing fan.
Outgoing supply had sleeve bearing fan that failed due to being worn out. Will replace with ball bearing fan and put back into spares inventory when parts are available.
F. Mera, F. Clara, M. Pirello
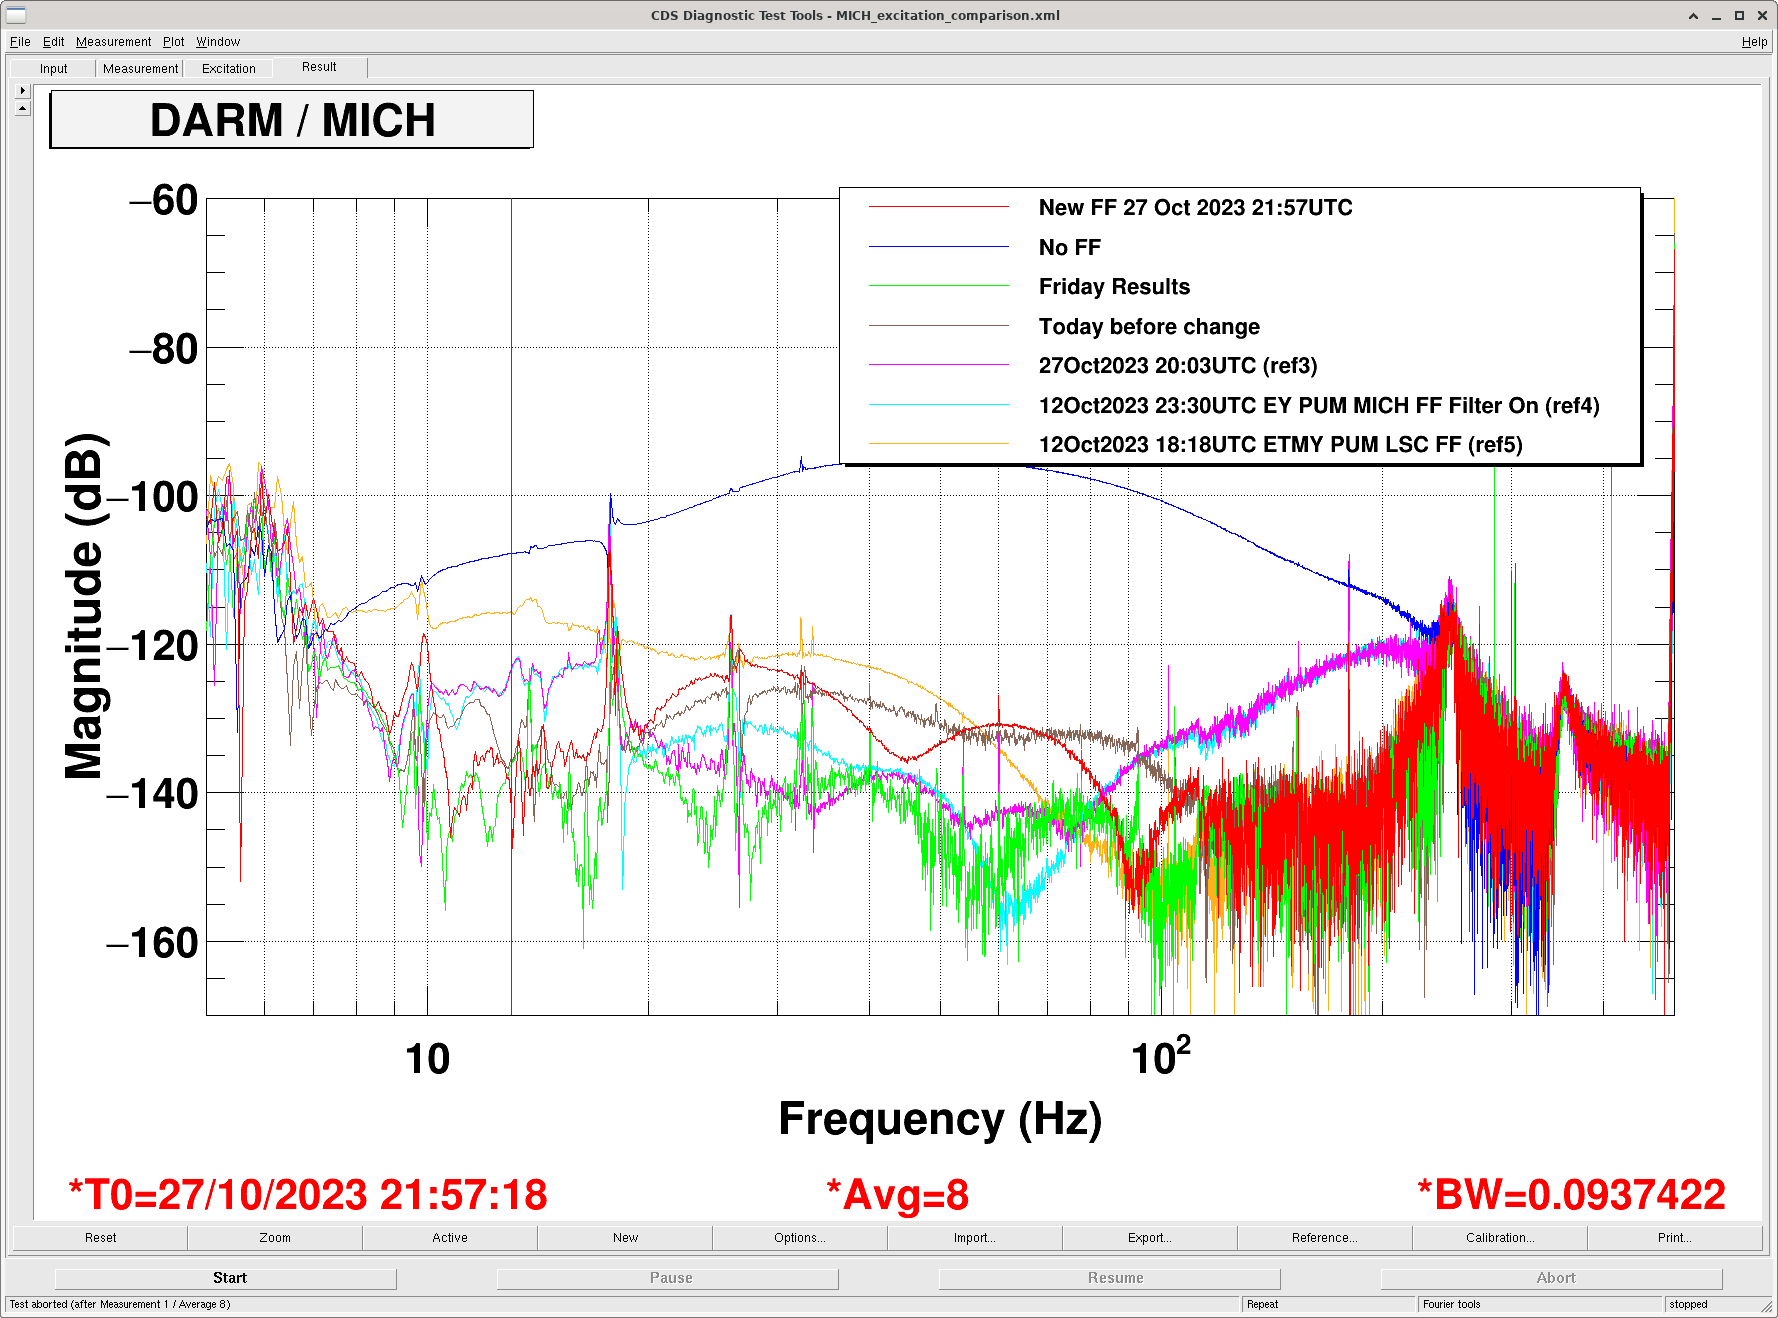
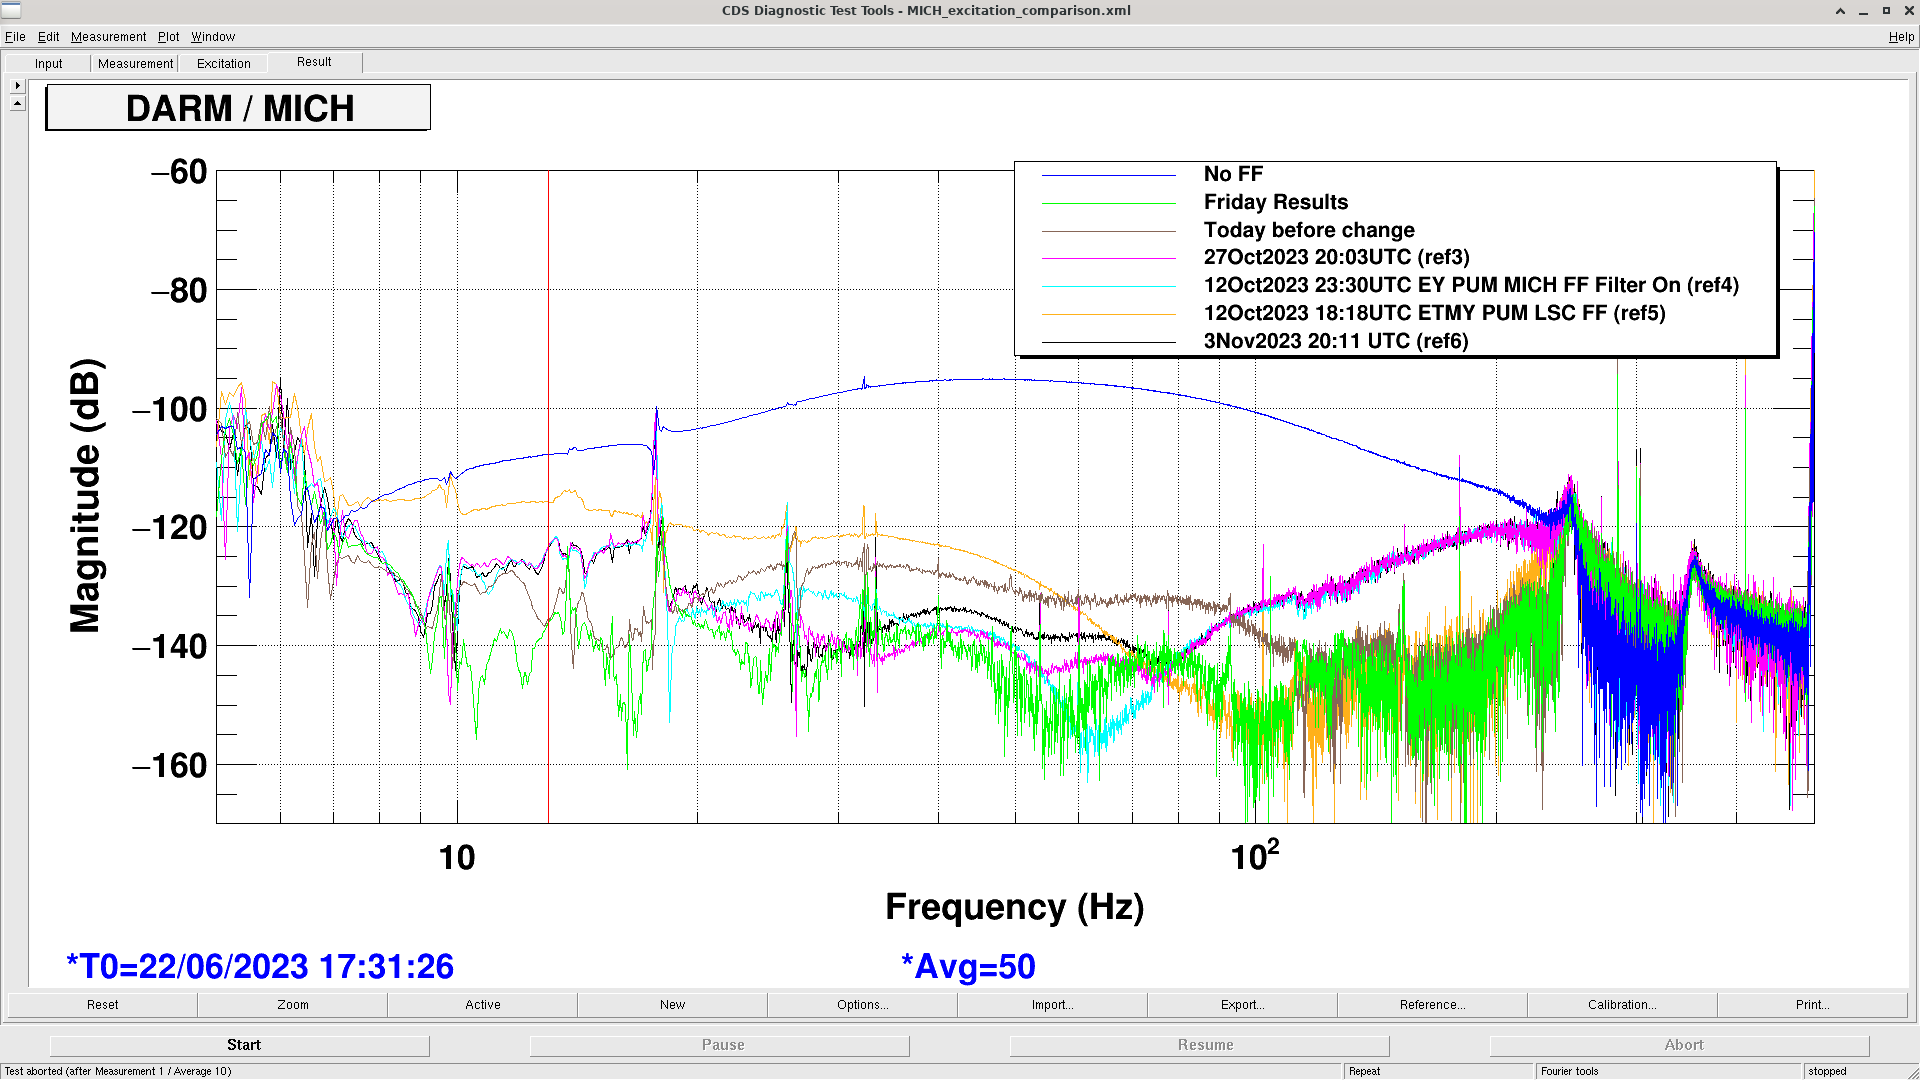
Took MICH FF measurements following instructions in lsc/h1/scripts/feedforward/README.md but running MICHFF_excitation_ETMYpum.xml. Data saved in lsc/h1/scripts/feedforward/ as .txt files. Last tuned MICH in 73420.
I saved a new filter in FM6 as 27-10-23-b (red trace) but it made the MICH coupling worse between 20 and 80Hz so we left the original (pink trace). We could try to re-fit the data to load in Wednesday's commissioning period.
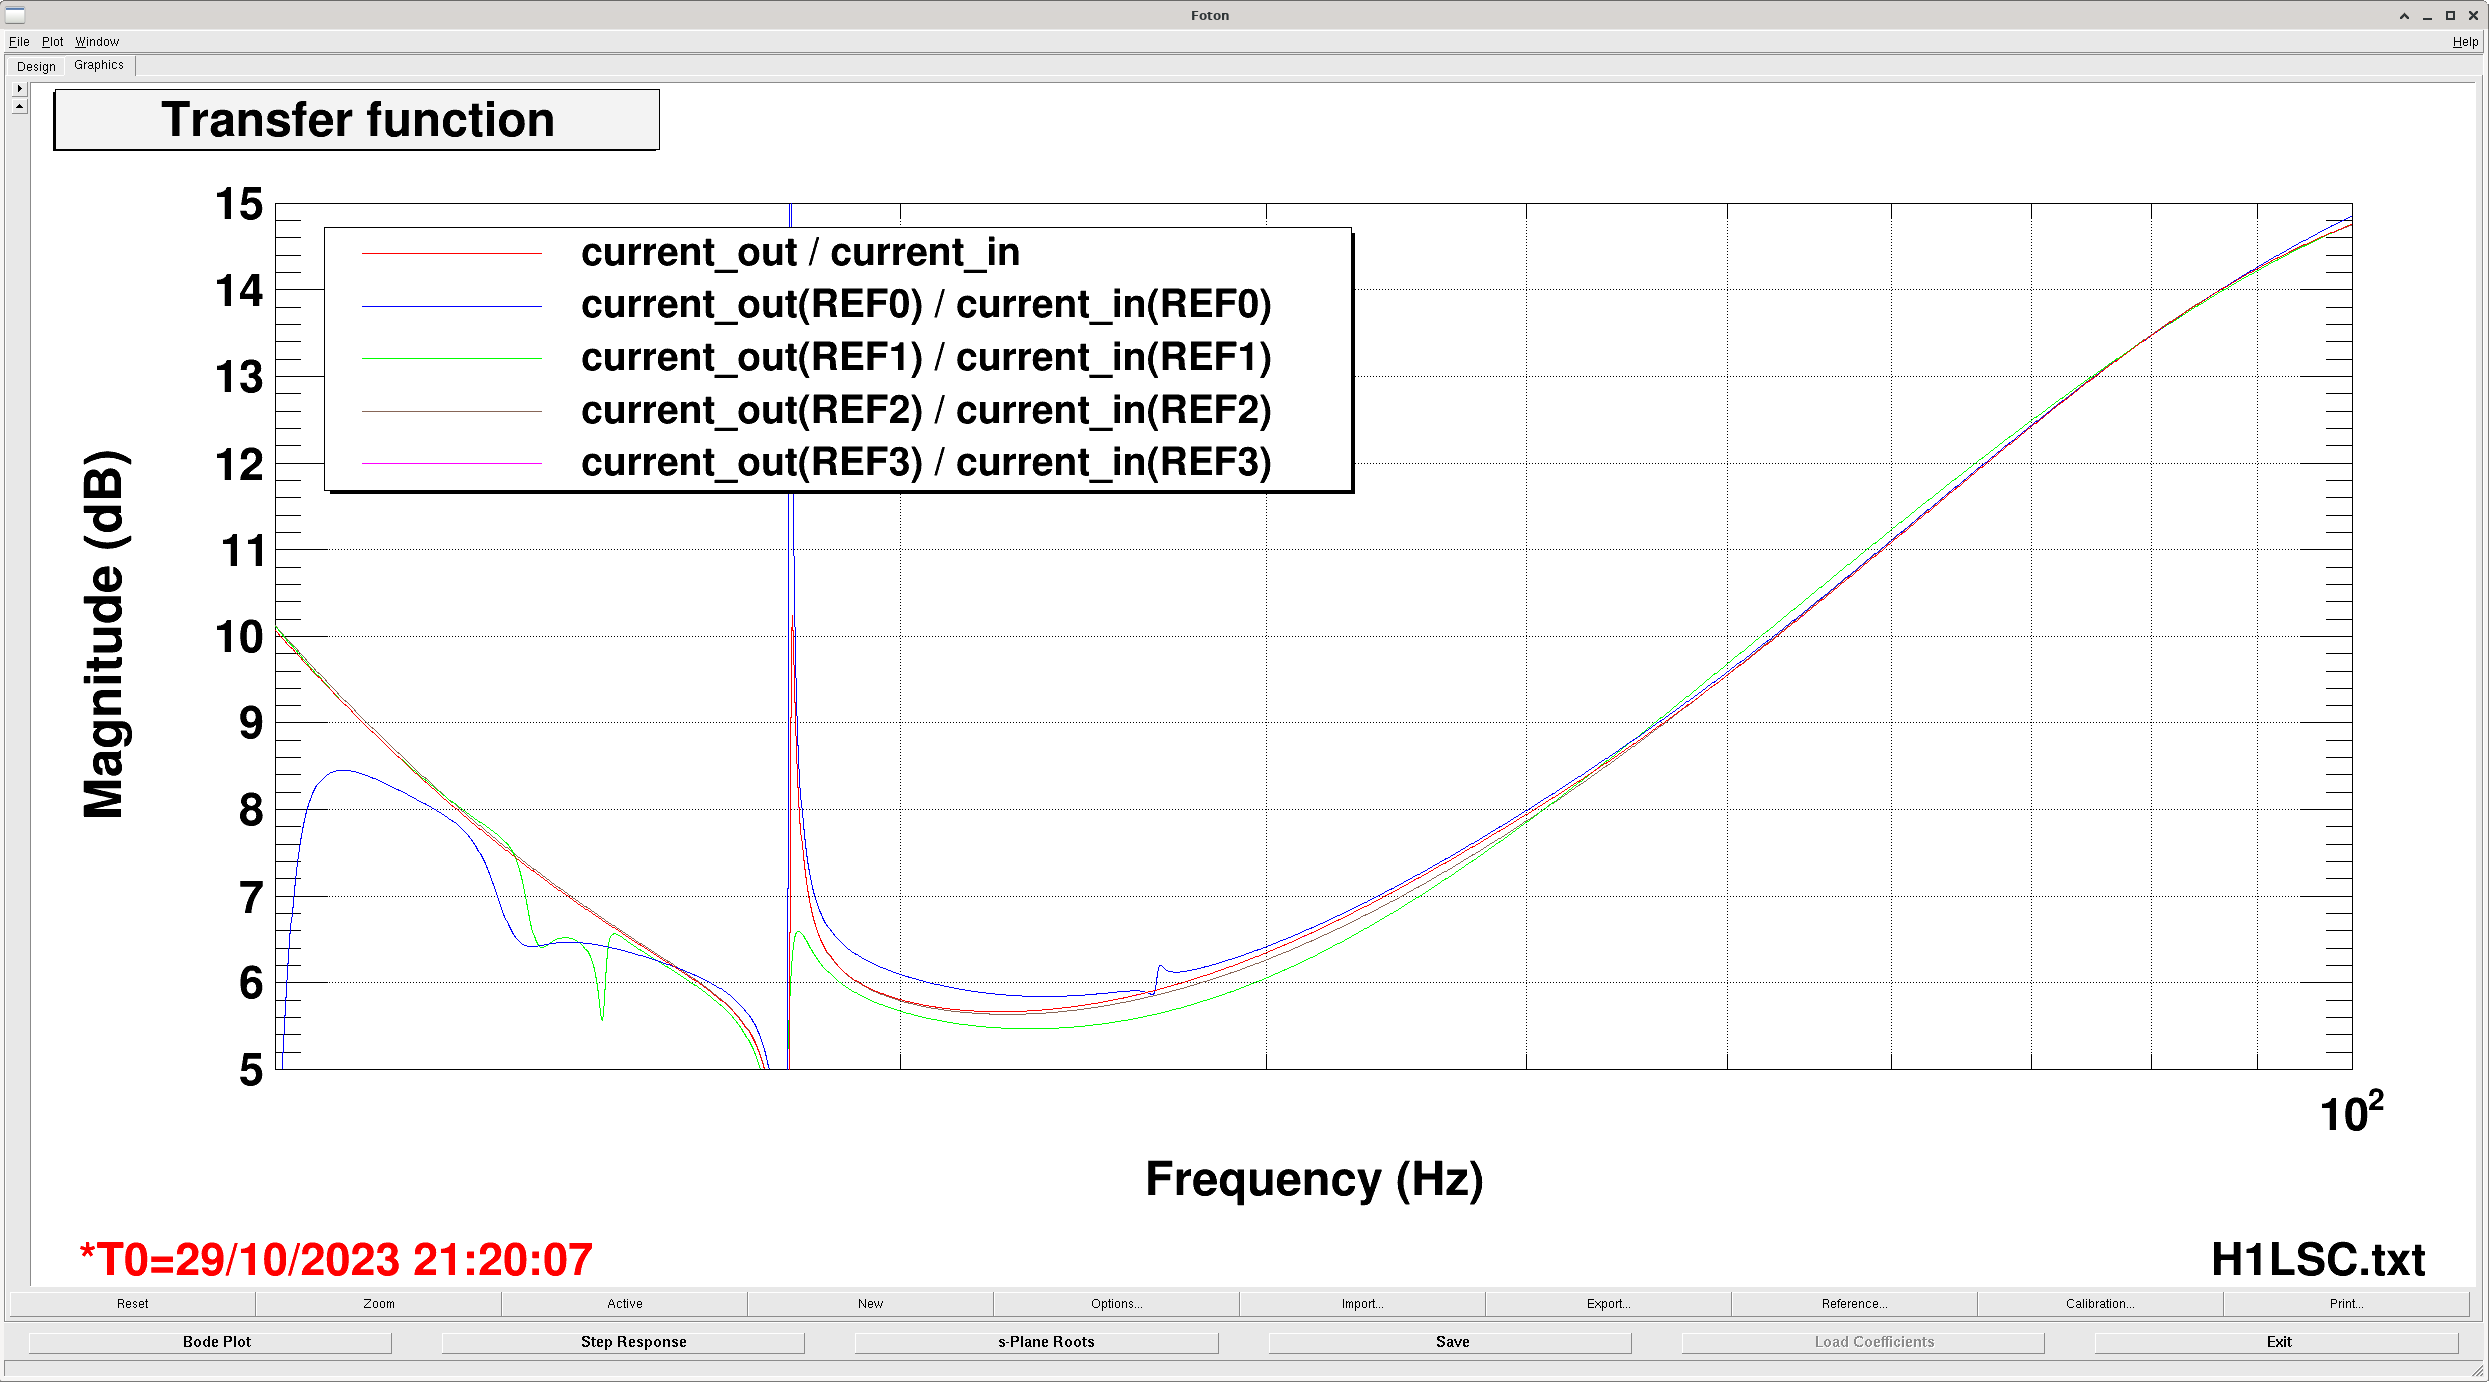
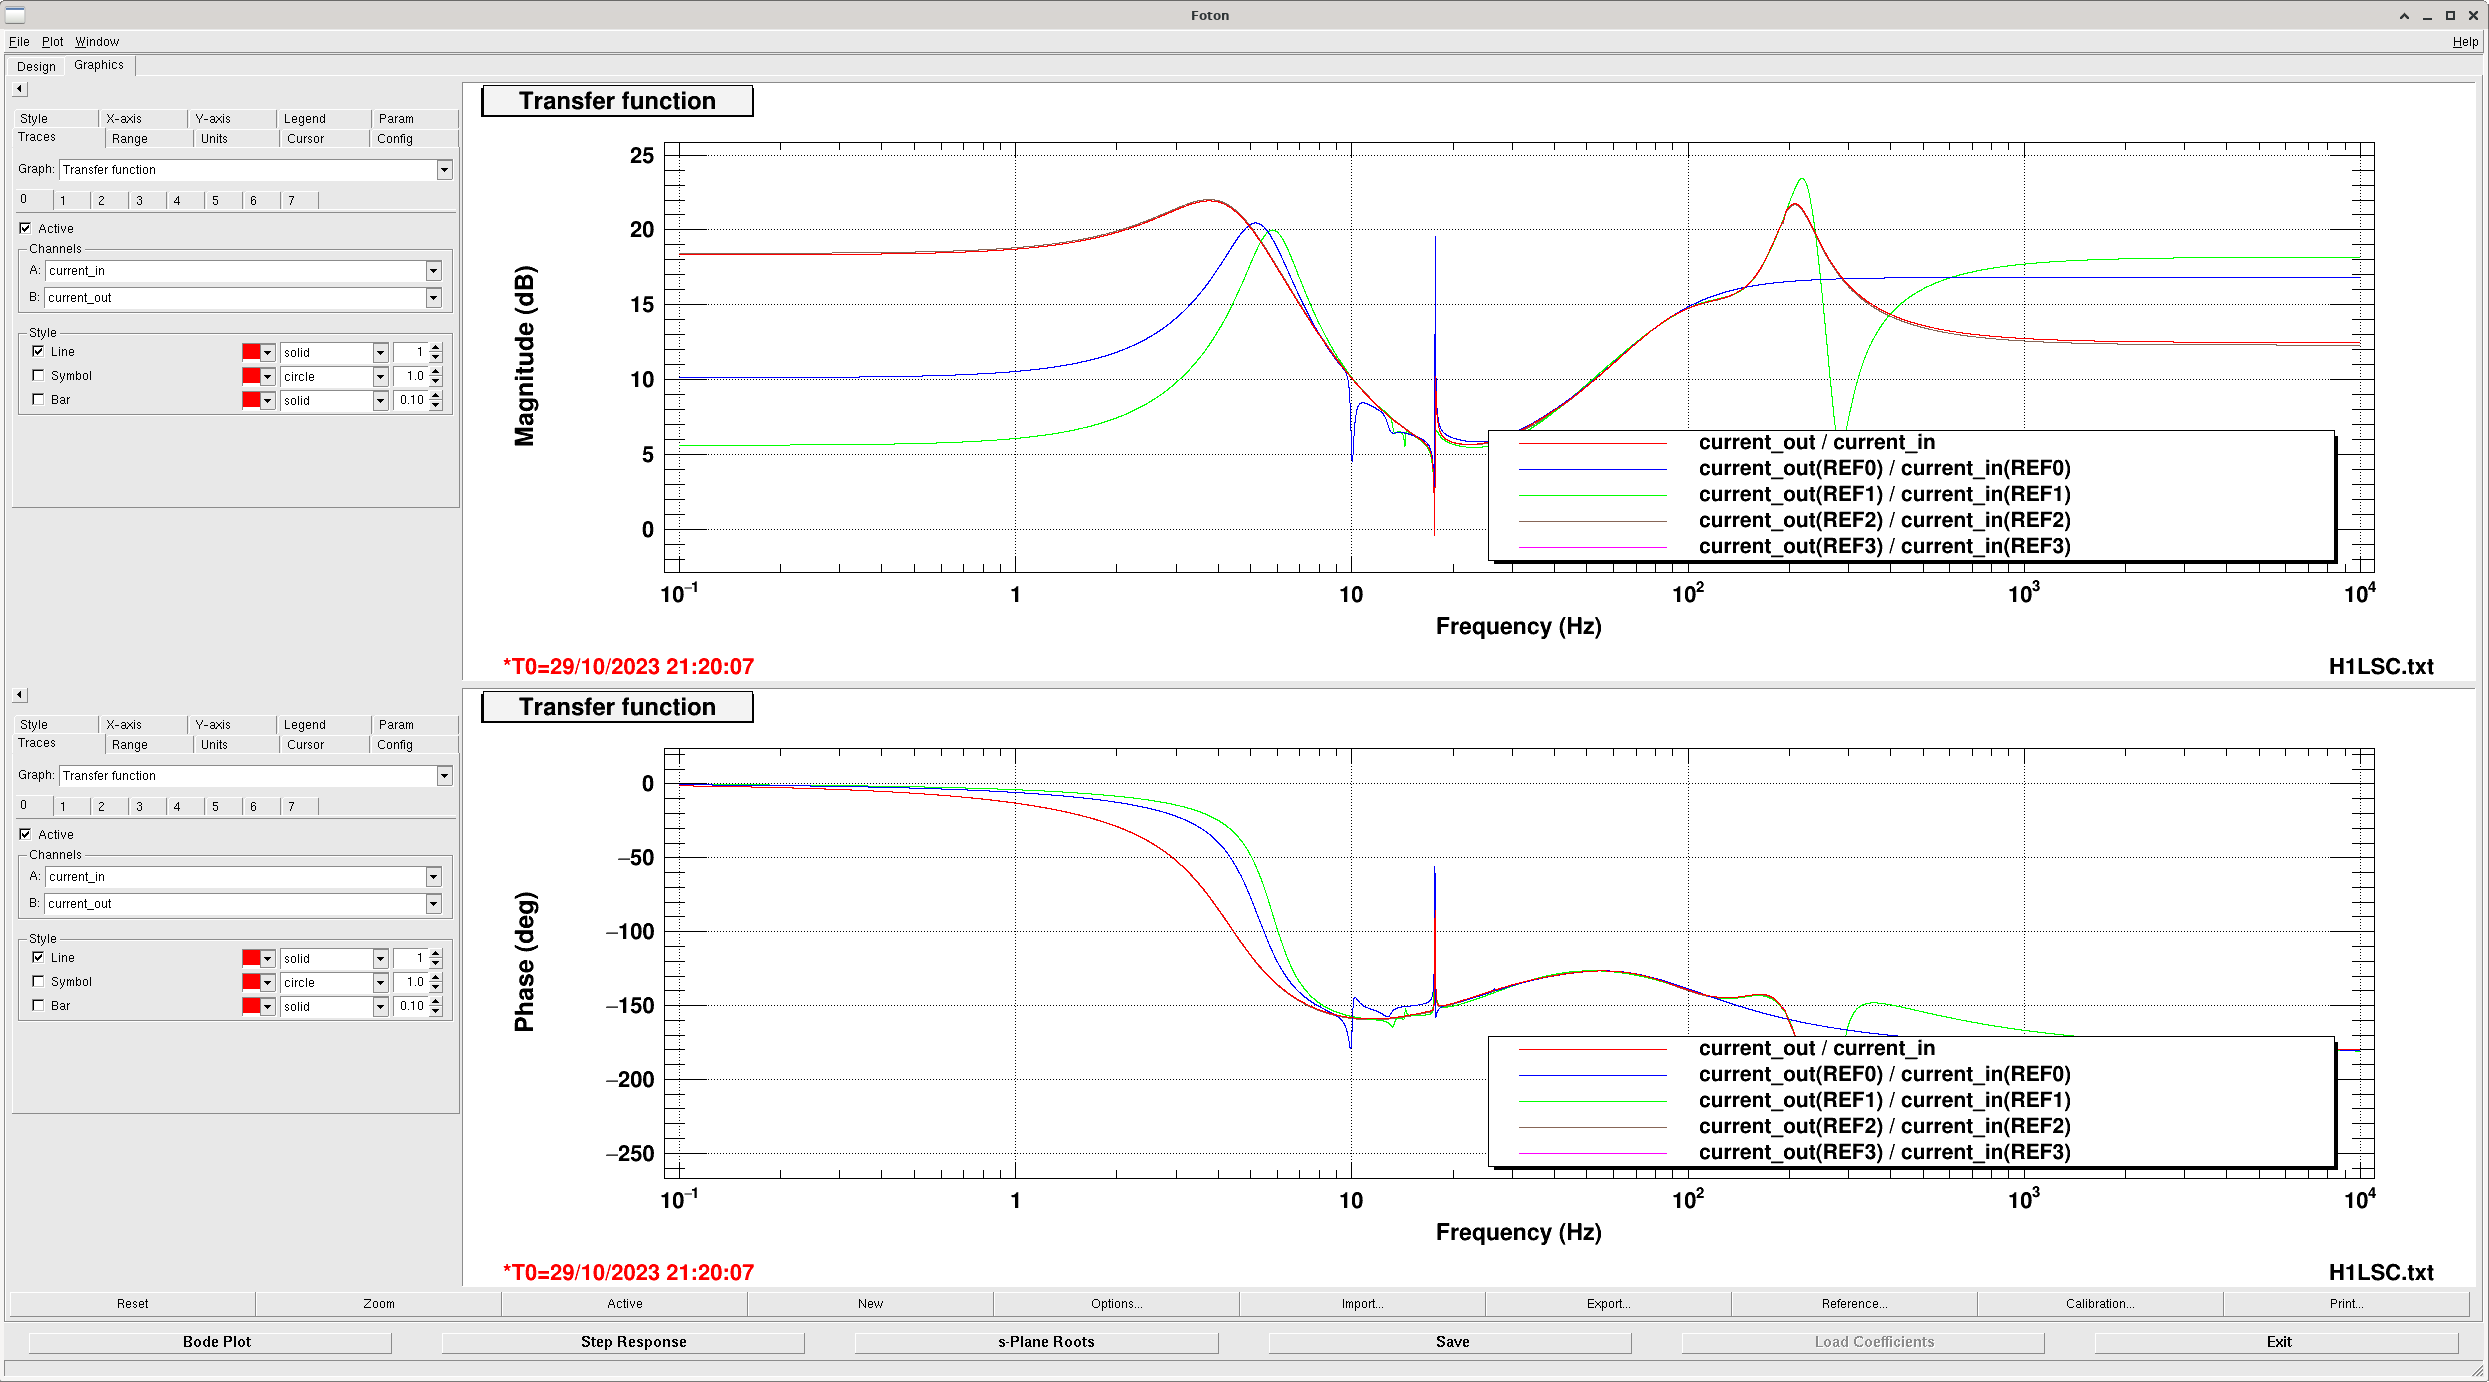
I re-fit this data and think i have a better filter saved (not loaded) in FM3 as "27-10-23-a". We could try this during a commissioning period this week if we wanted to try to further improve MICH.
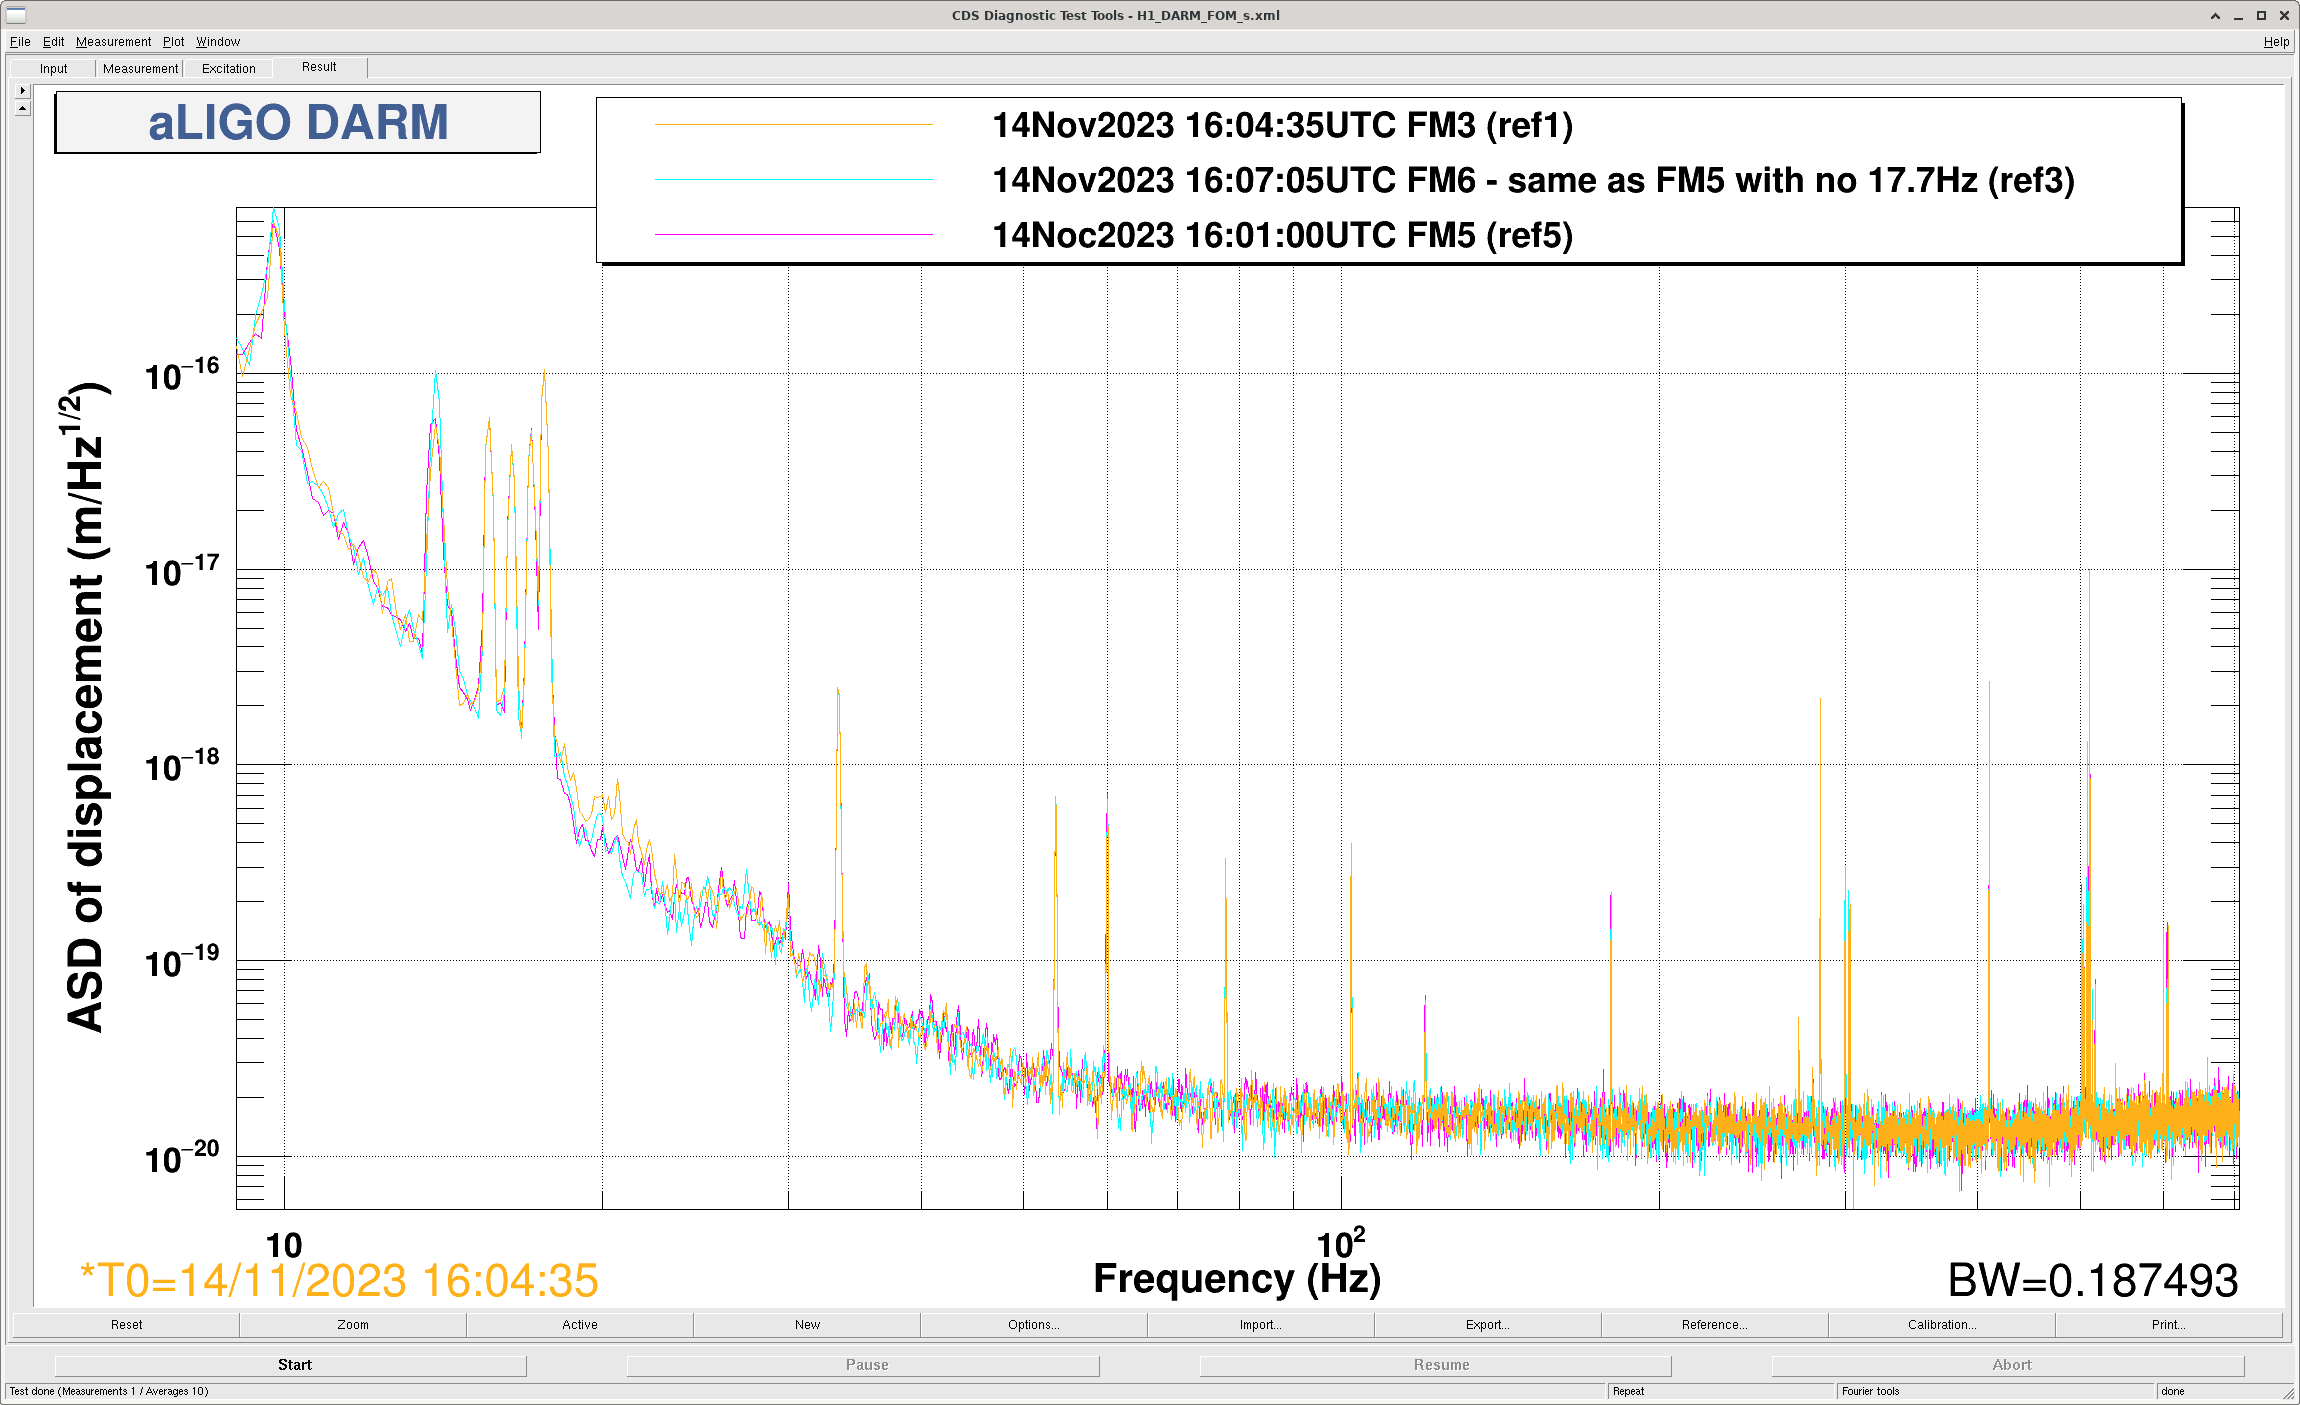
Tried this FM3 FF 2023/11/14 16:04:30UTC to 16:06:30UTC. It did not cause a lockloss. I did not run the MICH comparism plot but DARM looked slightly worse. Plot attached.
From 16:07:05, I tried FM6 which is the currently installed MICH FF (FM5) without the 17.7Hz feature 74139.
I tried to test a new MICH FF FM3 Camilla made. First I measured the current MICH FF FM5 as shown in the attached figure. The pink and black curves are the current MICH FF FM5 on 20231027 and 20231103, respectively. The current MICH FF gets worse between 30-80 Hz in a week. The MICH FF on 20231103 was measured after 6.5 hours into lock. Then I ramped the MICH FF gain to 0 and turned off FM5 and turned on FM3. After I ramped the MICH FF gain to 1, a lockloss happened immediately.
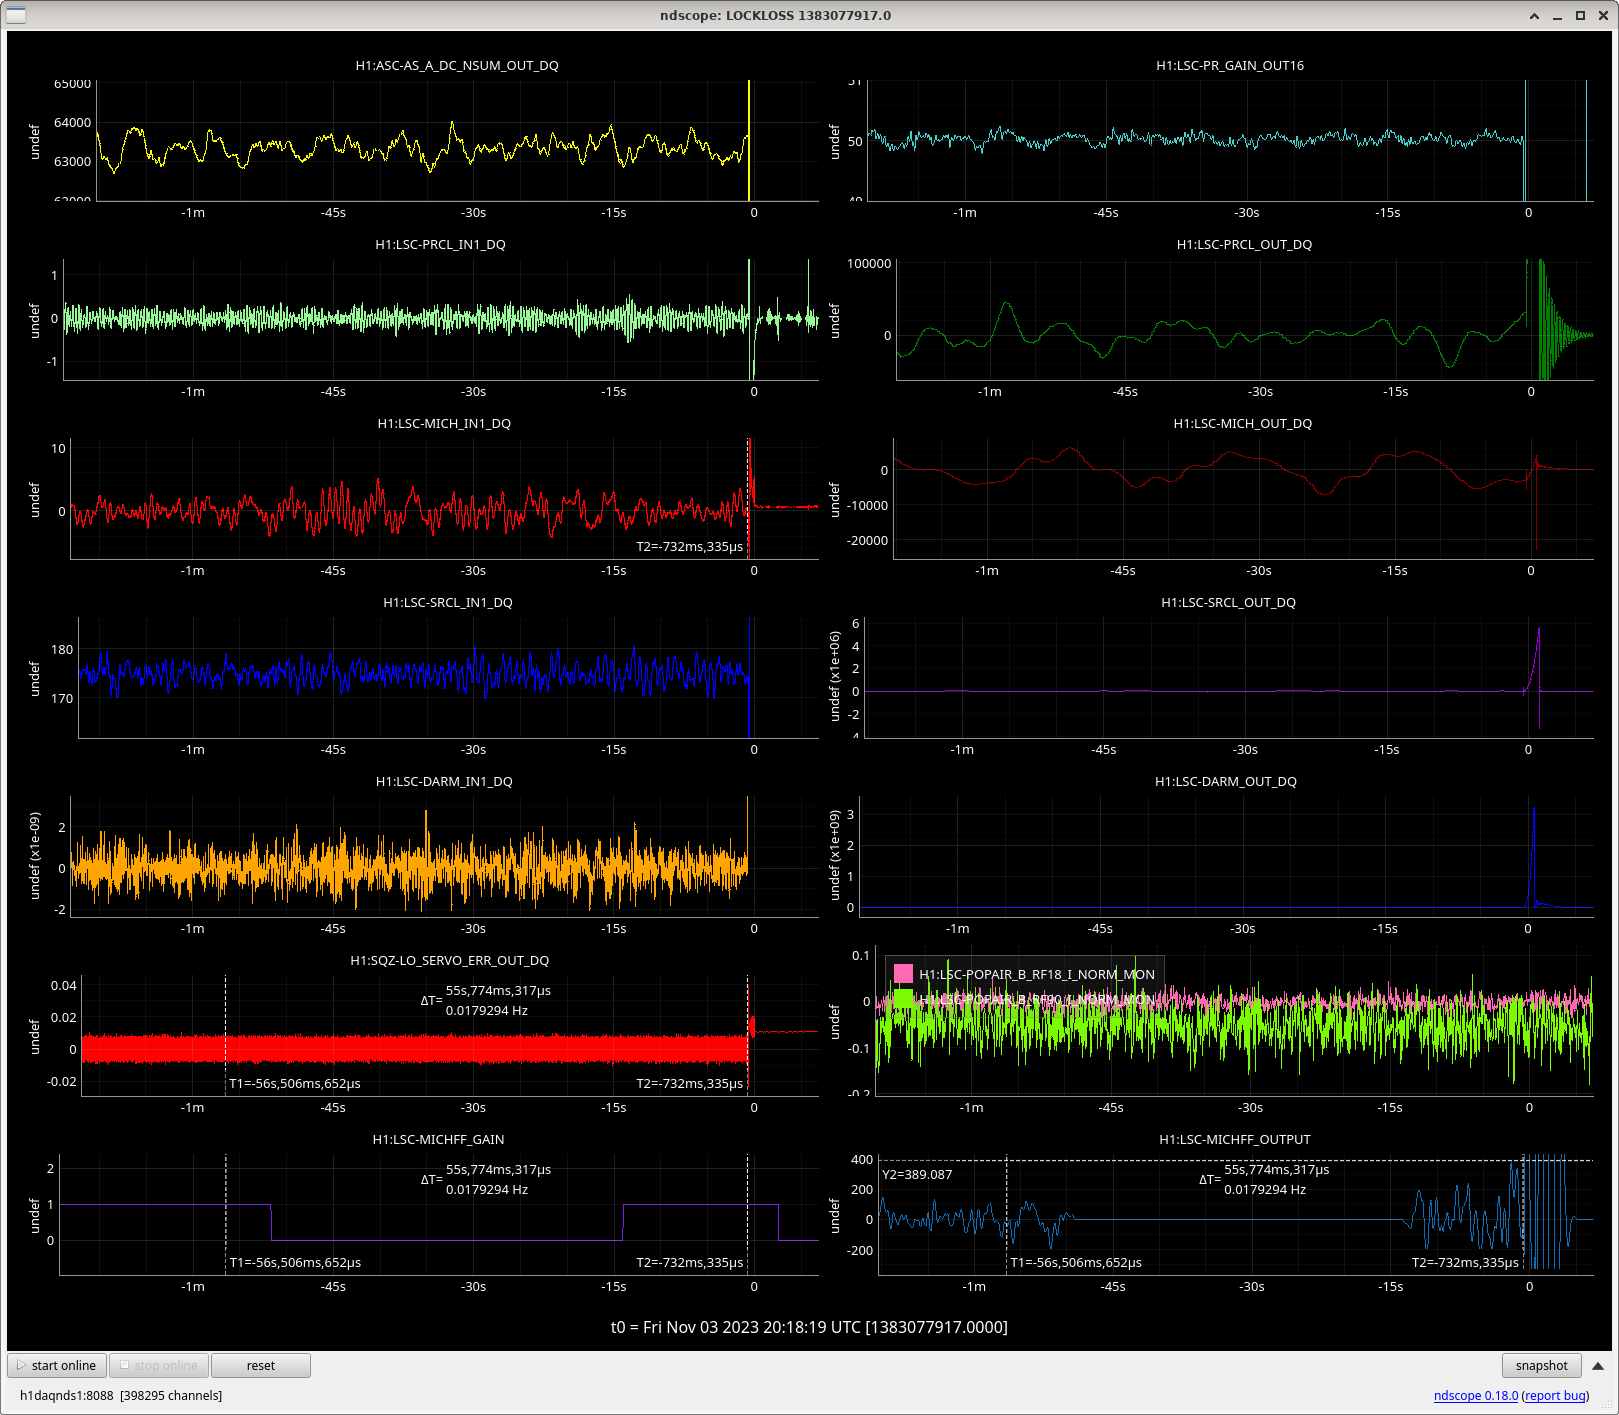
Sorry that this caused the 1383077917 lockloss.
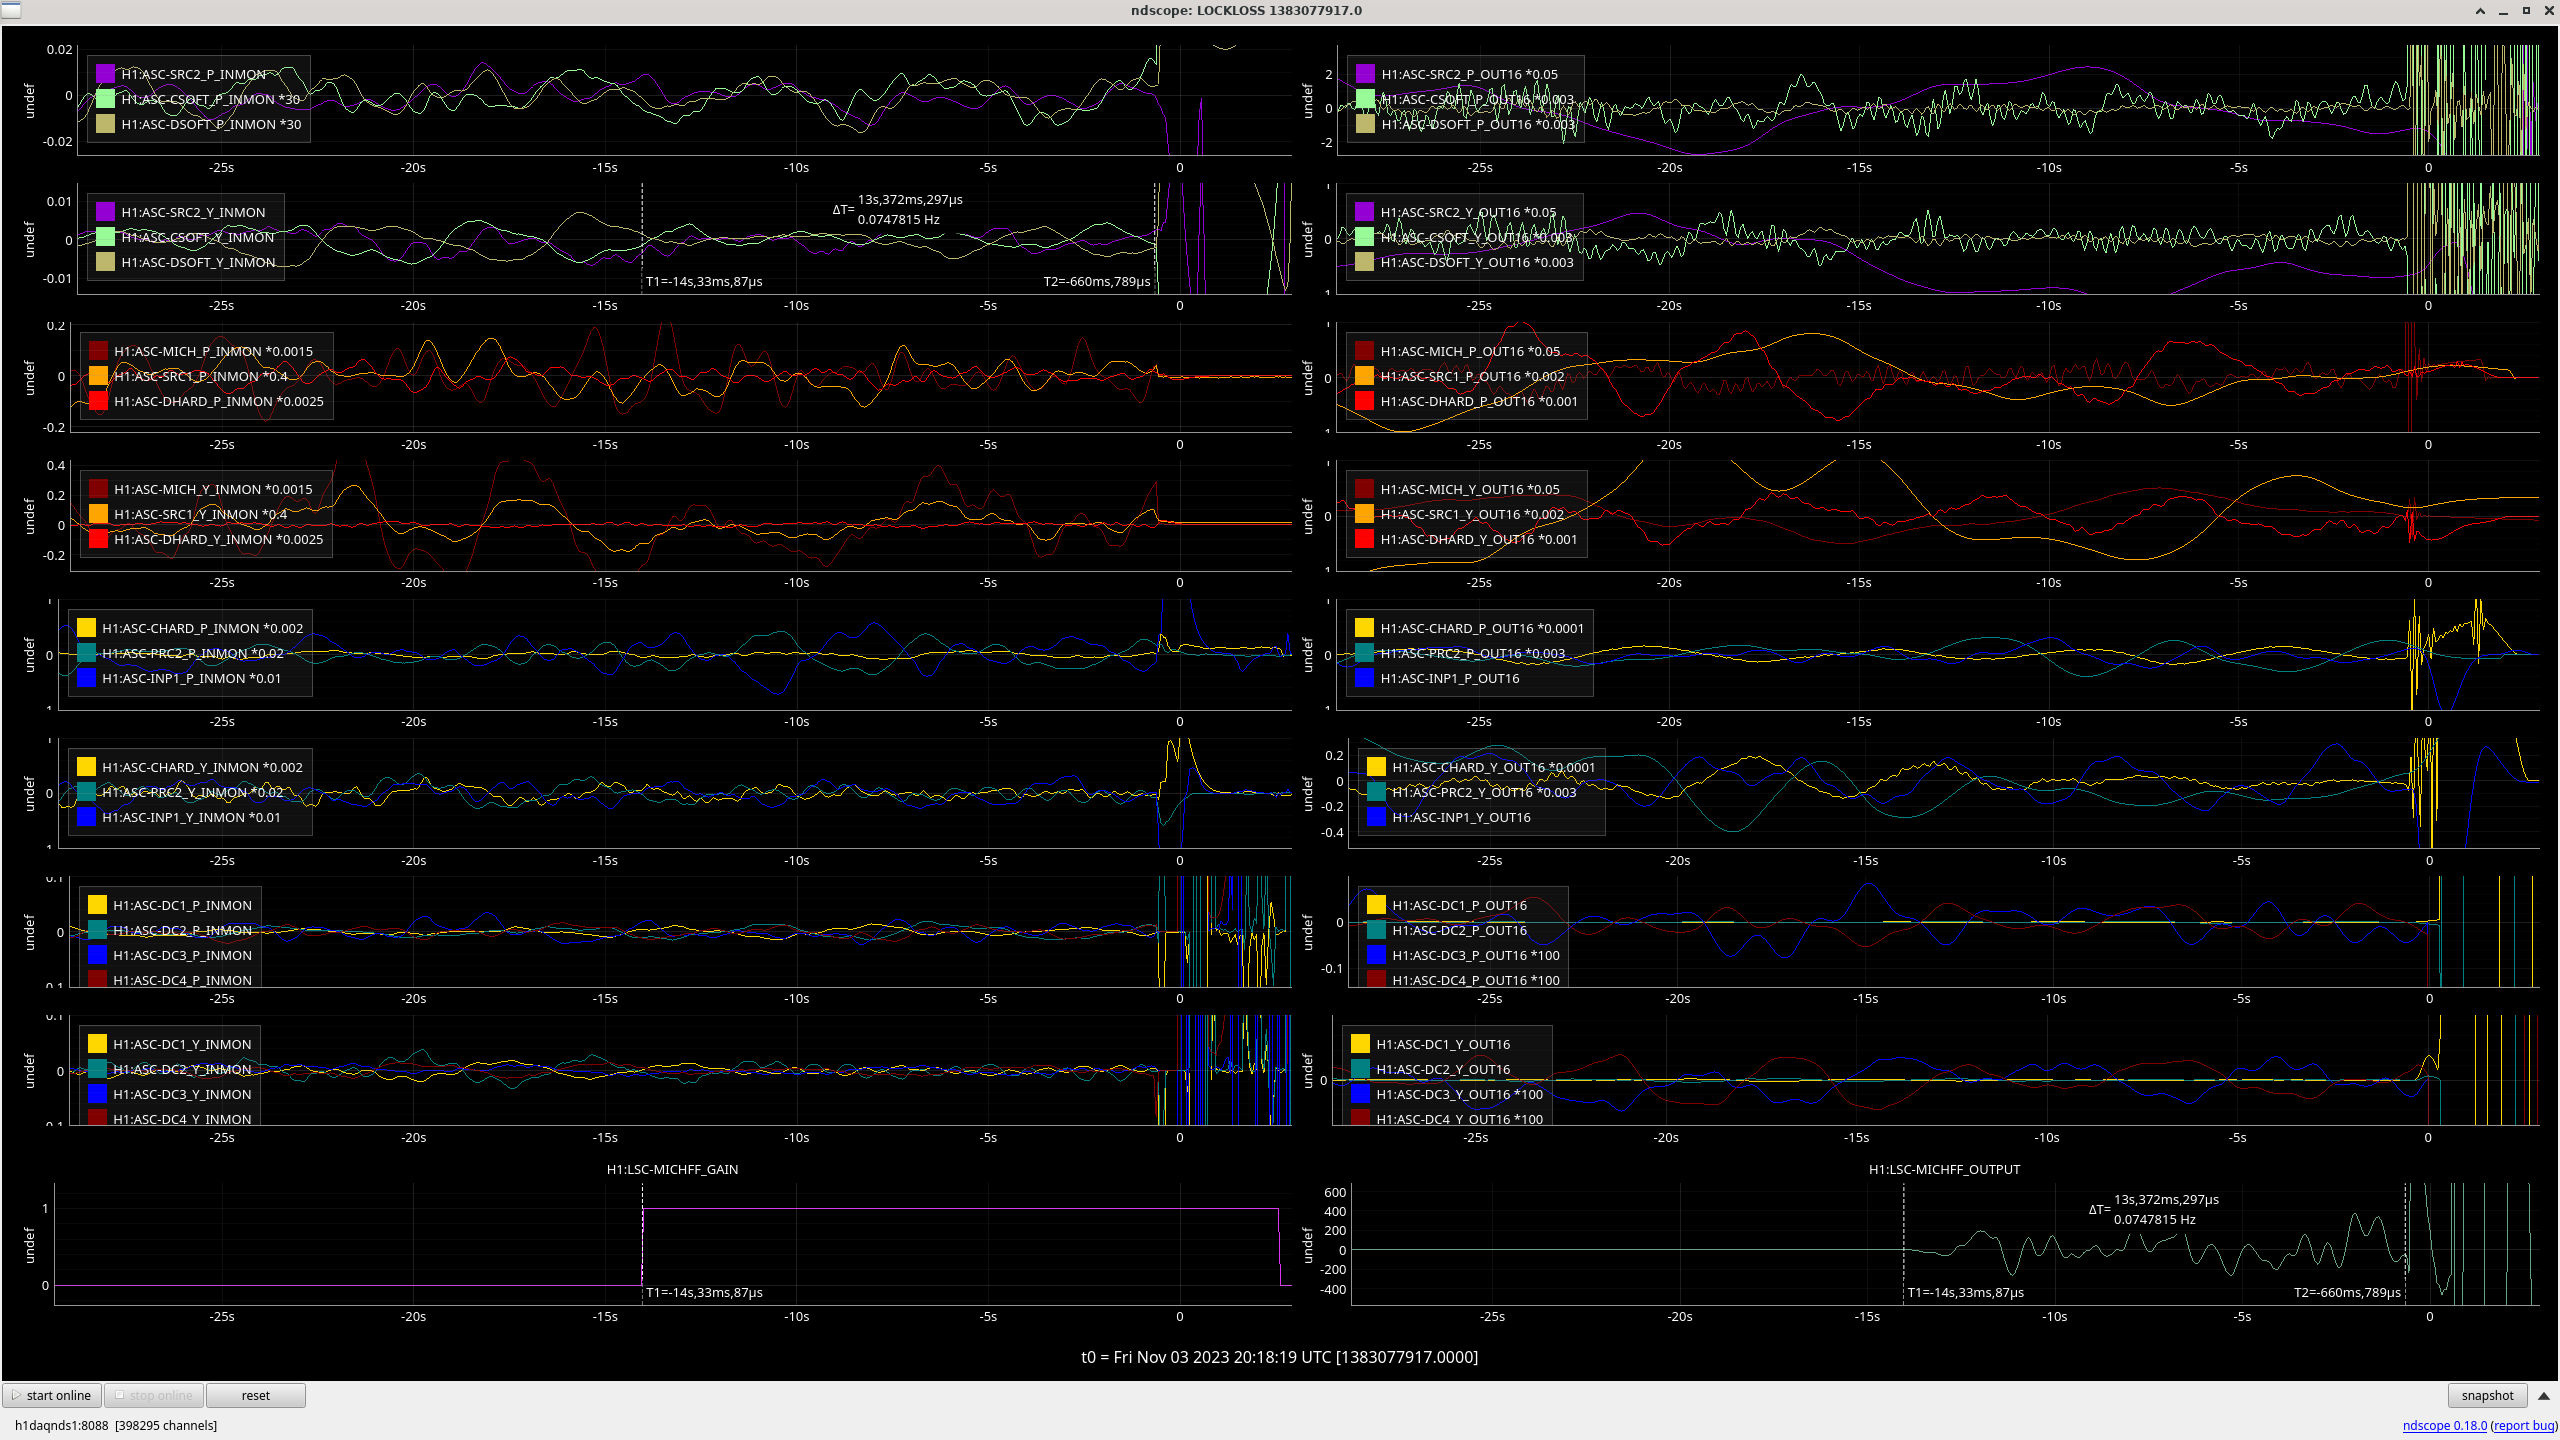
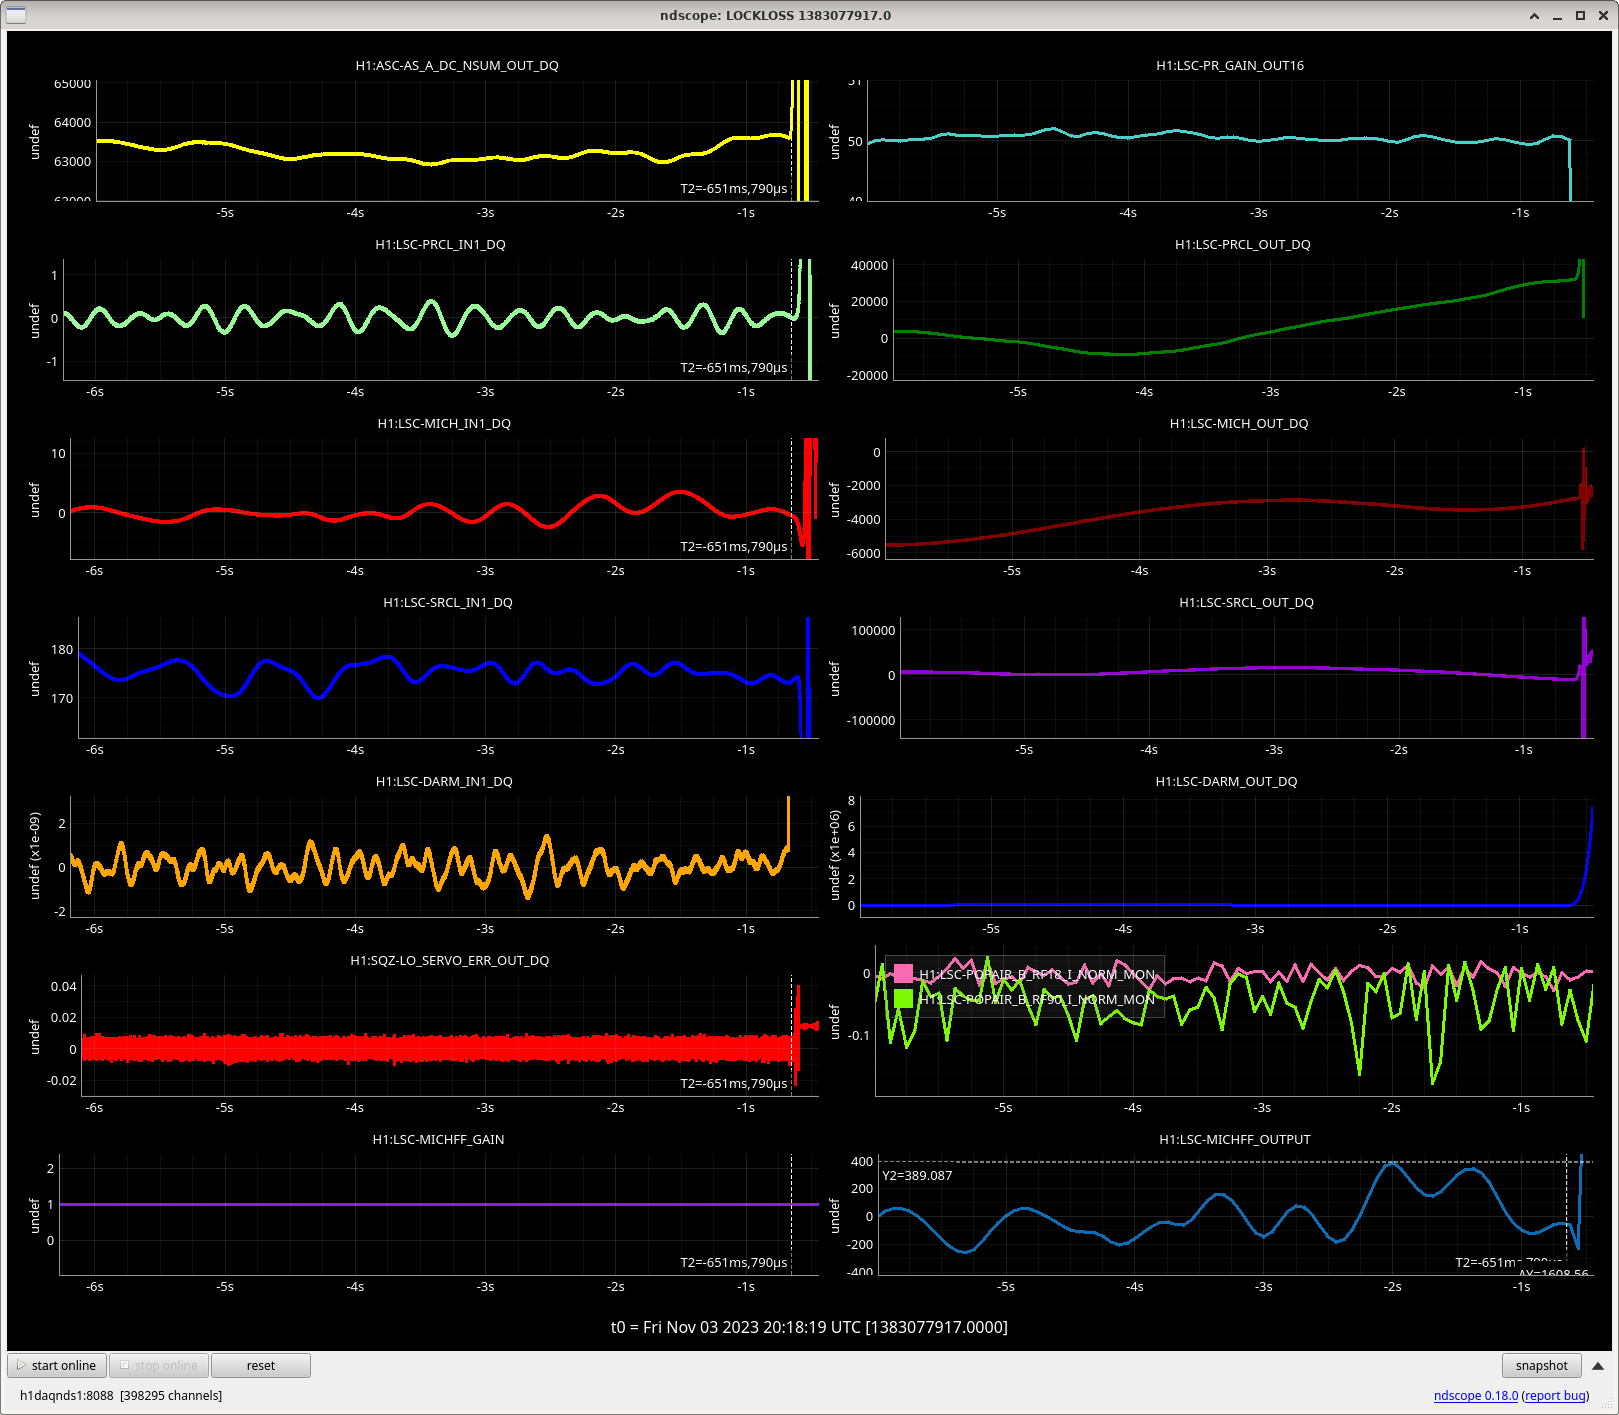
Unsure why this FM3 would be unstable. Lockloss occurred 10 seconds after MICHFF had finished ramping on (13s - 3sec ramp time). FM3 MICH_FF looks to be outputting ~ factor of 2 higher than the current FM5 filter. Don't see any obvious instabilities in the 10seconds before the lockloss.
LSC and ASC plots attached. I wonder if the lockloss was just badly timed. We could attempt to repeat this before our Tuesday Maintenance period.
The spare timing master has been installed, all SFPs are green. Daniel reports timing system is green.
The DAQ restarted itself, looking ok now.
I hand started the susaux models, all looks good. We restarted the running susauxb123 models once it was no longer the only front end running.
We are now starting all of the models.
Old Unit S1103261
New Unit S1103262
All models running, SWWD have been untripped. DAQ is good.
Handing over to control room to recover the IFO.
H1 has been recovered and started observing as of 03:37 UTC.