Daniel, Erik, Dave, Fil:
Erik discovered that the DTS DAQ also crashed at the same times last night, indicating a site wide timing issue could be the cause.
Daniel just found that the MSR timing server is reporting GPS issues. We are investigating and checking the spares status.
I've opened FRS29567 for this issue
TITLE: 11/03 Day Shift: 15:00-23:00 UTC (08:00-16:00 PST), all times posted in UTC
STATE of H1: Observing at 154Mpc
OUTGOING OPERATOR: TJ
CURRENT ENVIRONMENT:
SEI_ENV state: CALM
Wind: 4mph Gusts, 2mph 5min avg
Primary useism: 0.02 μm/s
Secondary useism: 0.21 μm/s
QUICK SUMMARY:
- H1 has been locked for 1:15
- CDS/SEI ok
The IFO was needing assistance at find IR again. It had found it on an attempt before, but after losing lock while trying to lok DRMI it couldn't couldn't get close enough to a resonant point to work. I found it by hand at a point a bit further away than our usual spots. PRMI locked, but it seemed less stable than normal, and then DRMI seemed way off so I ran an initial alignment. The alignment was completely autonomous and looks like it helped locking as we are currently powering up.
The COMM beatnote seems to have fallen to -11dB. PR3 is in a slightly different P position than it was ~14 days ago according to the oplevs, but I doubt this was the reason for any of Oli's locking troubles.
TITLE: 11/03 Eve Shift: 23:00-07:00 UTC (16:00-00:00 PST), all times posted in UTC
STATE of H1: Lock Acquisition
INCOMING OPERATOR: TJ
SHIFT SUMMARY: Lost lock after 29( I think) hours being locked. Lockloss was probably caused by Dolphin issues(73947), although so far it seems like the issues are documented as occurring 8 seconds after we lost lock, so it's all a bit confusing whether the issues actually caused the lockloss. I had trouble relocking and we kept losing lock at FIND_IR and LOCKING_ALS even after an initial alignment - not sure why that was (maybe related to all the FIND_IR issues from the past few days). We eventually made it back up and just got into Observing. The violins are looking pretty good suprisingly so I will leave the gain for ITMY 5/6 off for now.
LOG:
23:00UTC Observing and Locked for 23.5 hours.
23:53 Ryan C turns on air compresser at VPW (presumeably on for no more than a couple mins)
03:00 Dropped out of Observing due to SQZ_SHG reaching PZT limit (73943)
03:08 I put us back into Observing
04:00:06 Lockloss (73945)
- 04:15 Errors with DC0, GDS0, FW1, FW0
- Connections reestablished
04:00 LOCKLOSS_SHUTTER_CHECK went to SHUTTER_FAIL - I fixed it by doing what I've done before for the CHECK_SHUTTER issue (72784)
04:12:23 ALS_XARM reports "[INCREASE_FLASHES.run] USERMSG 2: Arm in Fault state! Waiting..."
04:35 Lockloss from FIND_IR right after IR was not found
- Errors with DC0, GDS0, FW1, FW0
- Connections reestablished
04:37 I put the detector in DOWN while contacting Dave
04:39 BRSX/Y_STAT nodes in Errors - I just reloaded them and the errors went away (Dave said the errors might just be a result of the computer issues)
05:18 Started relocking again
05:20 Lockloss at LOCKING_ALS
05:22 Lockloss at LOCKING_ALS
05:50 Detector couldn't get past MICH_OFFLOADED, so I went to DOWN and started an Initial Alignment
06:15 Initial alignment completed
06:18 Lockloss at FIND_IR
07:03 Reached NOMINAL_LOW_NOISE
07:22 Observing
| Start Time | System | Name | Location | Lazer_Haz | Task | Time End |
|---|---|---|---|---|---|---|
| 00:41 | PCAL | Tony, Rick | PCal Lab | y(local) | PCAL work | 02:11 |
At 21:00:16 most of the front end systems showed multiple IPC errors. This corresponds to the lock loss.
Around this time the DAQ restarted itself. The DAQ then did a second restart at 21:36.
At the time of writing (23:15) the DAQ has been running for 1hr 39mins.
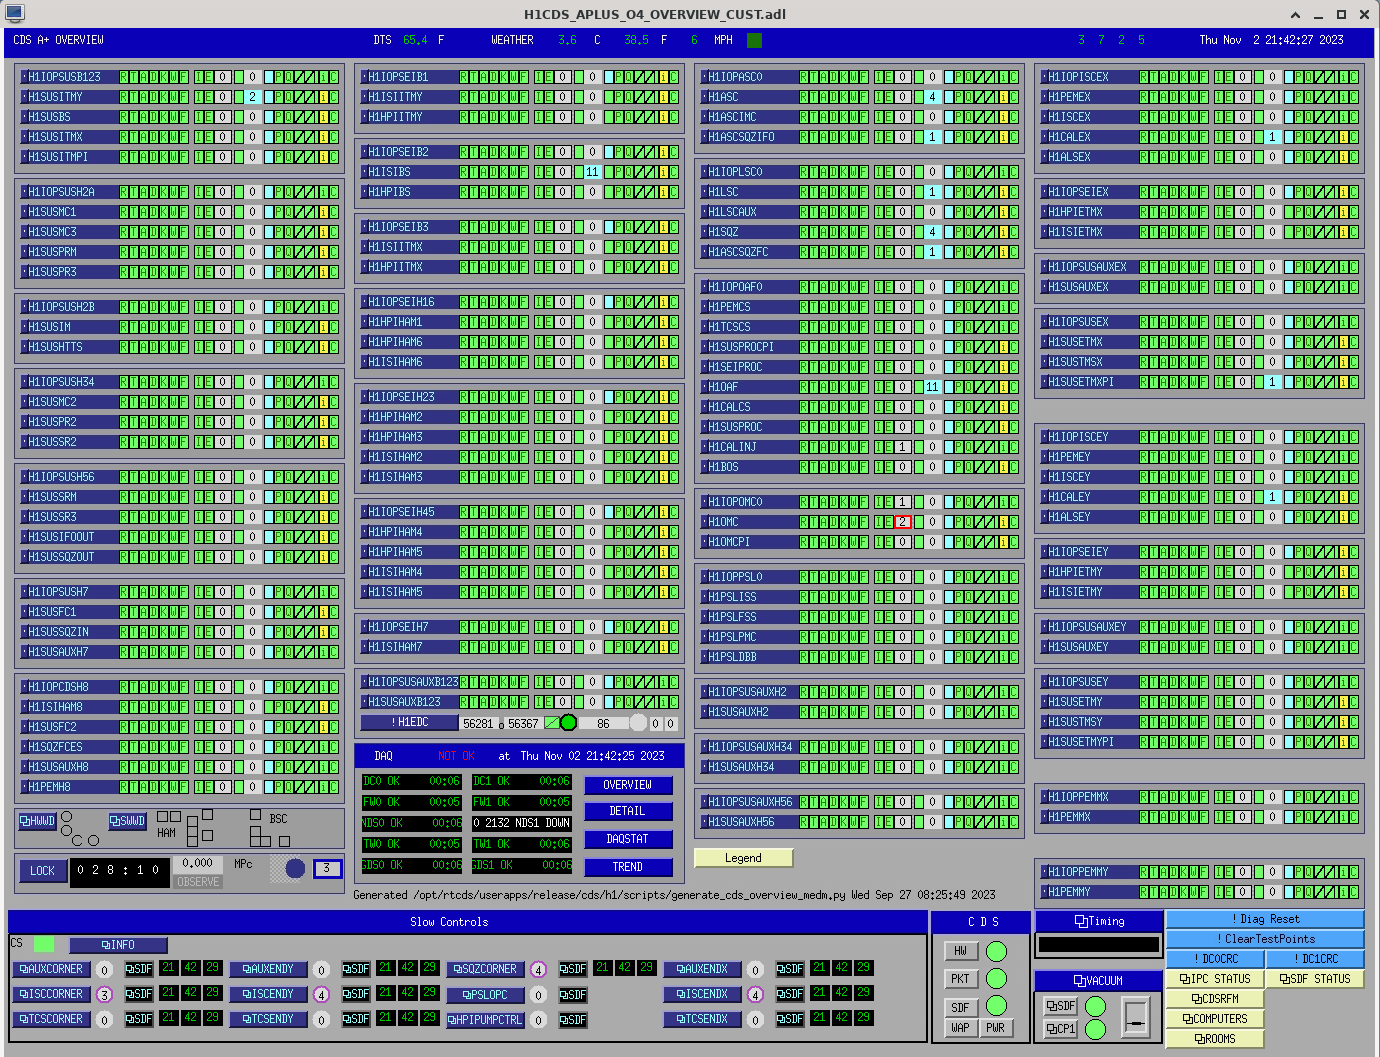
The CDS overview before any recovery is attached. Note that it appears that only models with Dolphin IPC receivers are showing IPC errors, for corner stations and end stations.
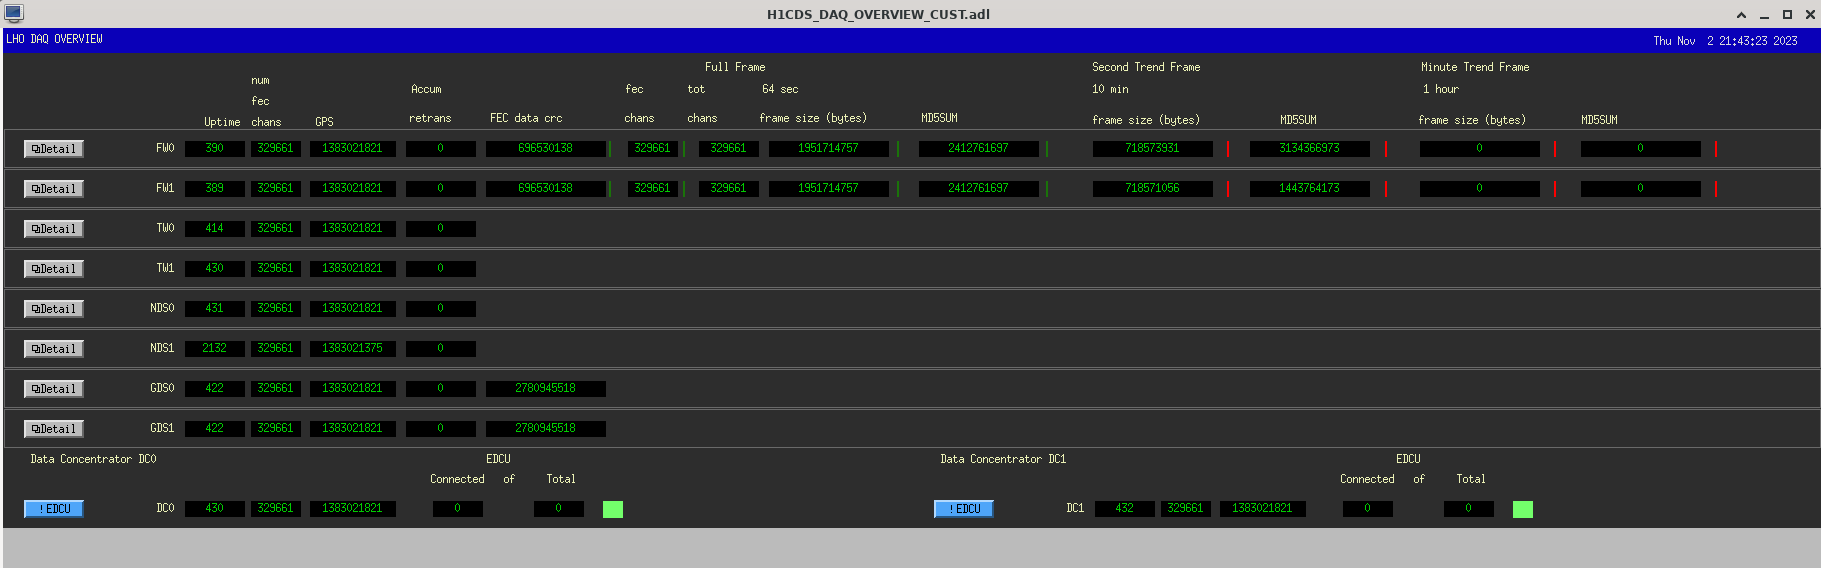
There were two NDS issues; NDS1 was frozen with an uptime of 2132 (time of second DAQ crash) and NDS0 was running for 1 second longer than DC0.
For immediate recovery I issued a DIAG_RESET to verify all the IPC errors were from transients and not currently active (this was verified) and I restarted both NDS1 (to unstick it) and NDS0 (to ensure it was synced with DC0).
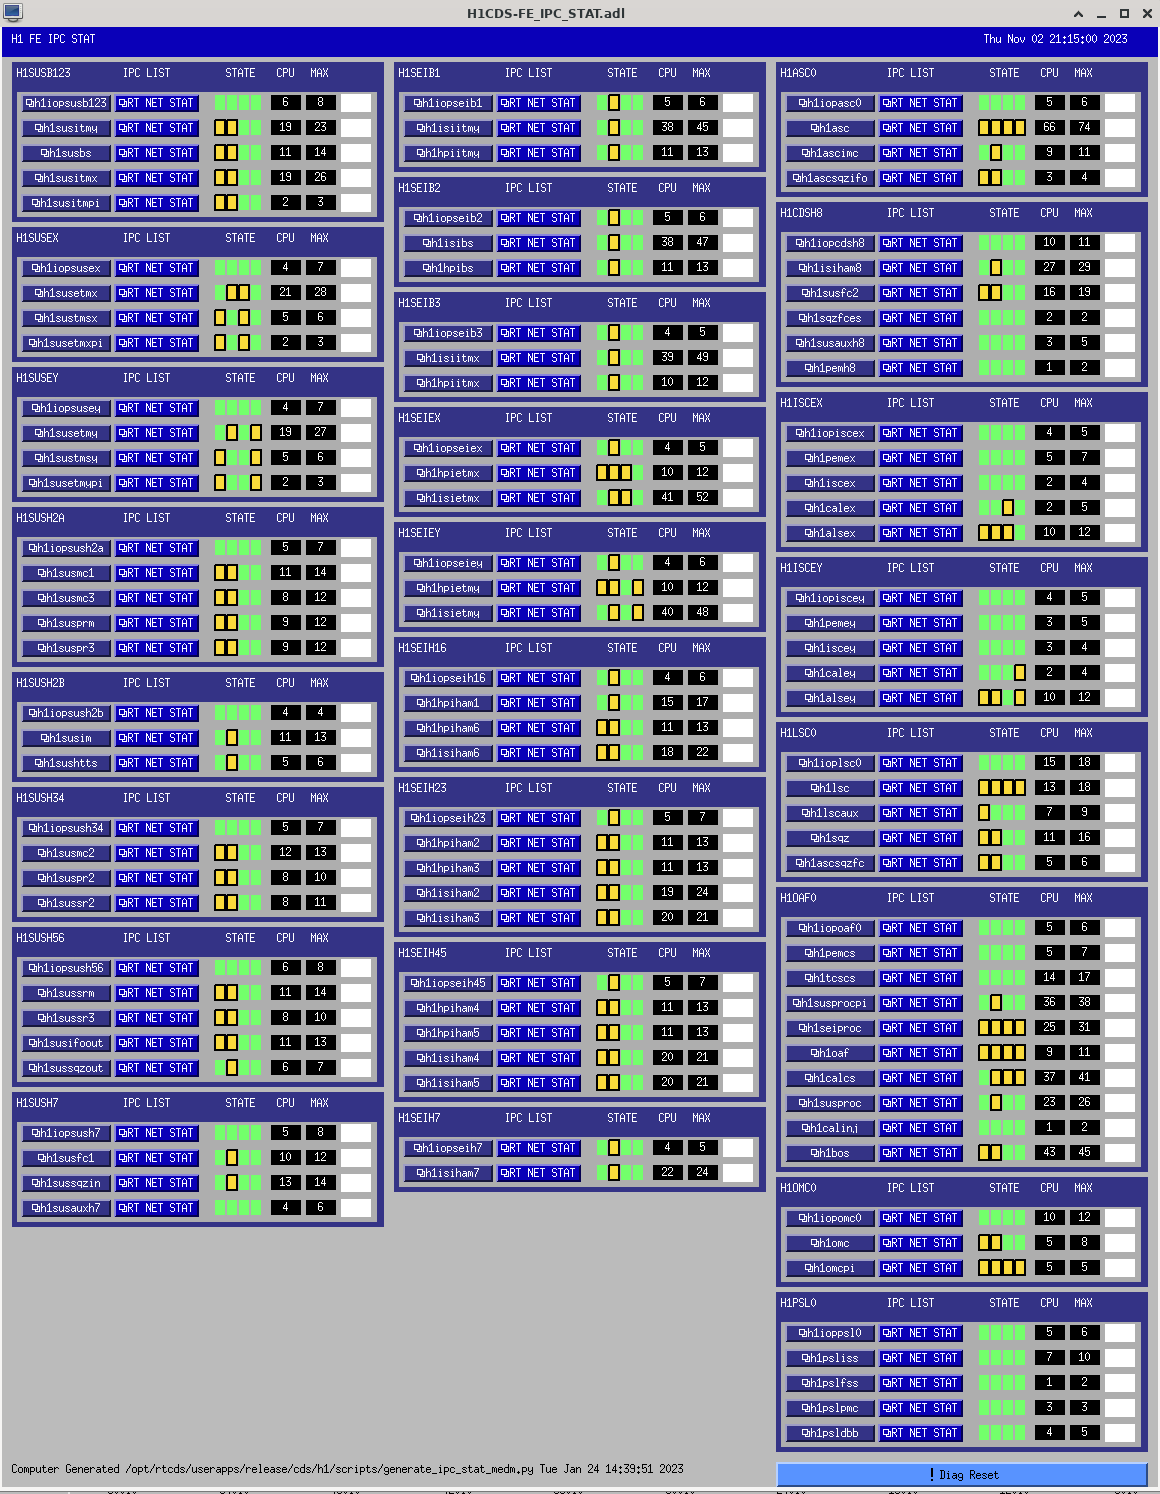
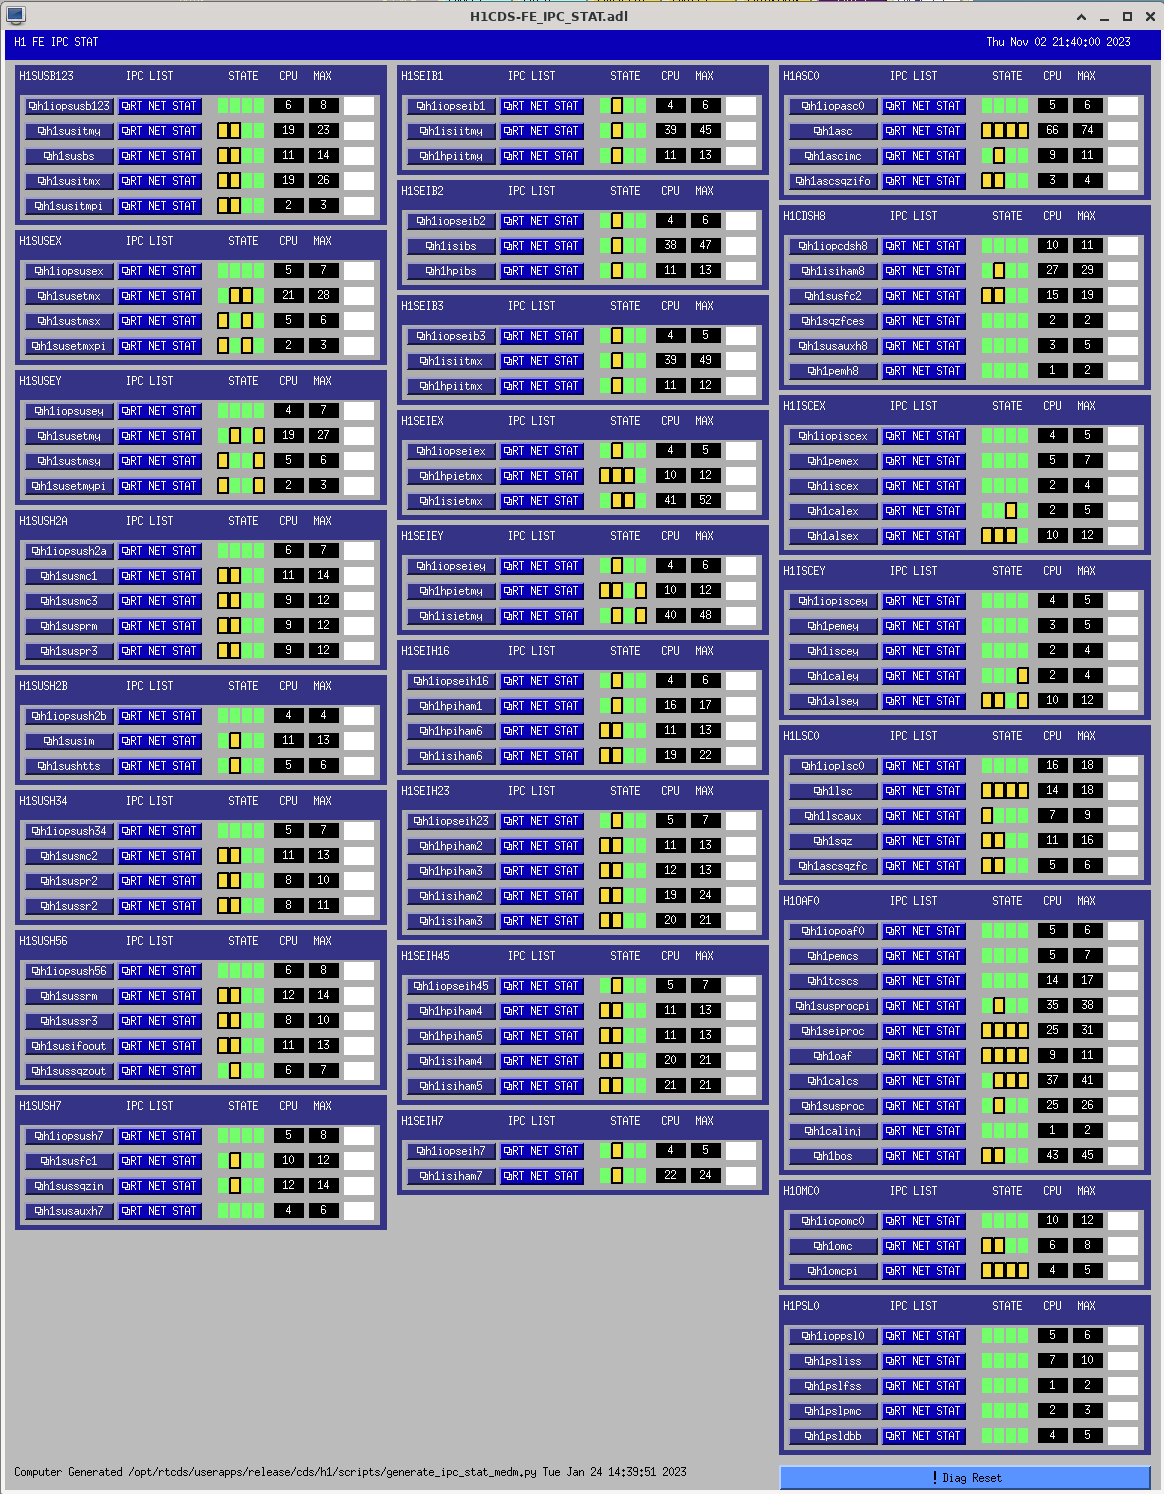
Here is a time machine capture of the IPC errors at 21:15 (after the 21:00 crash and when DAQ was back) and 21:40 (after the 21:36 crash, when DAQ was back and before I issued the DIAG_RESET at 21:42)
Note that all types of IPC are erroring (SHMEM, Dolphin, X-arm, Y-arm). The errors are geographically consistent (EX has only X-arm, EY has only Y-arm, CS has both).
In the morning I'll do a channel-by-channel scan to see if they all errored at the same time.
Dolphin dis_diag error scan
I ran a dis_diag scan on the Dolphined frontends. The only two FEs which showed errors were h1lsc0 and h1asc0, but the last scan was ran at 11am Tuesday and we then rebooted these two machines at 1pm Tuesday for the IO Chassis work, so these could be errors from that time.
The errors have been cleared, I'll rescan in the morning
h1lsc0 Uncorrectable Link Errors: 9
h1asc0 Uncorrectable Link Errors: 9
Test stand DAQ restarted at the same times plus two seconds for the same reason: data starvation from front ends. It's a separate network, isolated from CDS. The common component is the timing system. A timing discontinuity from the IOP models would explain all systems, including IPC errors and interruption of DAQ data.
Test stand daq log
Nov 02 21:00:19 x1daqdc0 daqd[30510]: Dropped data from shmem or received 0 dcus; gps now = 1383019237, 0; was = 1383019228, 13; dcu count = 5
Nov 02 21:00:19 x1daqdc0 daqd[30510]: expected gps = 1383019228
Nov 02 21:00:19 x1daqdc0 daqd[30510]: expected cycle = 14
Nov 02 21:00:19 x1daqdc0 daqd[30510]: expected nano = 62500013
Nov 02 21:00:19 x1daqdc0 daqd[30510]: first 5 dcuids seen
Nov 02 21:00:19 x1daqdc0 daqd[30510]: saw dcu 166 - gps: 1383019237 nano: 0 cycle: 0
Nov 02 21:00:19 x1daqdc0 daqd[30510]: saw dcu 161 - gps: 1383019237 nano: 0 cycle: 0
Nov 02 21:00:19 x1daqdc0 daqd[30510]: saw dcu 36 - gps: 1383019237 nano: 0 cycle: 0
Nov 02 21:00:19 x1daqdc0 daqd[30510]: saw dcu 34 - gps: 1383019237 nano: 0 cycle: 0
Nov 02 21:00:19 x1daqdc0 daqd[30510]: saw dcu 35 - gps: 1383019237 nano: 0 cycle: 0
Nov 02 21:00:20 x1daqdc0 kernel: dqprod[30534]: segfault at 7f11acedb9d0 ip 00007f12313ac2e8 sp 00007f116b9bac40 error 4 in libpthread-2.28.so[7f12313a9000+f000]
Nov 02 21:00:20 x1daqdc0 kernel: Code: 00 00 41 56 41 55 41 54 55 53 48 83 ec 40 64 48 8b 04 25 28 00 00 00 48 89 44 24 38 31 c0 48 85 ff 0f 84 1b 01 00 00 48 89 fb <8b> bf d0 02
Nov 02 21:00:20 x1daqdc0 systemd[1]: rts-daqd.service: Main process exited, code=killed, status=11/SEGV
Nov 02 21:00:20 x1daqdc0 systemd[1]: rts-daqd.service: Failed with result 'signal'.
Nov 02 21:36:08 x1daqdc0 daqd[5453]: Dropped data from shmem or received 0 dcus; gps now = 1383021386, 0; was = 1383021377, 13; dcu count = 5
Nov 02 21:36:08 x1daqdc0 daqd[5453]: expected gps = 1383021377
Nov 02 21:36:08 x1daqdc0 daqd[5453]: expected cycle = 14
Nov 02 21:36:08 x1daqdc0 daqd[5453]: expected nano = 62500013
Nov 02 21:36:08 x1daqdc0 daqd[5453]: first 5 dcuids seen
Nov 02 21:36:08 x1daqdc0 daqd[5453]: saw dcu 166 - gps: 1383021386 nano: 0 cycle: 0
Nov 02 21:36:08 x1daqdc0 daqd[5453]: saw dcu 161 - gps: 1383021386 nano: 0 cycle: 0
Nov 02 21:36:08 x1daqdc0 daqd[5453]: saw dcu 36 - gps: 1383021386 nano: 0 cycle: 0
Nov 02 21:36:08 x1daqdc0 daqd[5453]: saw dcu 34 - gps: 1383021386 nano: 0 cycle: 0
Nov 02 21:36:08 x1daqdc0 daqd[5453]: saw dcu 35 - gps: 1383021386 nano: 0 cycle: 0
Nov 02 21:36:09 x1daqdc0 kernel: dqprod[5475]: segfault at 7f04e0edb9d0 ip 00007f05640162e8 sp 00007f04a55b9c40 error 4 in libpthread-2.28.so[7f0564013000+f000]
Nov 02 21:36:09 x1daqdc0 kernel: Code: 00 00 41 56 41 55 41 54 55 53 48 83 ec 40 64 48 8b 04 25 28 00 00 00 48 89 44 24 38 31 c0 48 85 ff 0f 84 1b 01 00 00 48 89 fb <8b> bf d0 0
Nov 02 21:36:09 x1daqdc0 systemd[1]: rts-daqd.service: Main process exited, code=killed, status=11/SEGV
Nov 02 21:36:09 x1daqdc0 systemd[1]: rts-daqd.service: Failed with result 'signal'.
h1daqdc0:
Nov 02 21:00:15 h1daqdc0 daqd[315938]: Dropped data from shmem or received 0 dcus; gps now = 1383019233, 0; was = 1383019226, 13; dcu count = 19
Nov 02 21:00:15 h1daqdc0 daqd[315938]: expected gps = 1383019226
Nov 02 21:00:15 h1daqdc0 daqd[315938]: expected cycle = 14
Nov 02 21:00:15 h1daqdc0 daqd[315938]: expected nano = 62500013
Nov 02 21:36:04 h1daqdc0 daqd[327260]: Dropped data from shmem or received 0 dcus; gps now = 1383021382, 0; was = 1383021375, 13; dcu count = 19
Nov 02 21:36:04 h1daqdc0 daqd[327260]: expected gps = 1383021375
Nov 02 21:36:04 h1daqdc0 daqd[327260]: expected cycle = 14
Nov 02 21:36:04 h1daqdc0 daqd[327260]: expected nano = 62500013
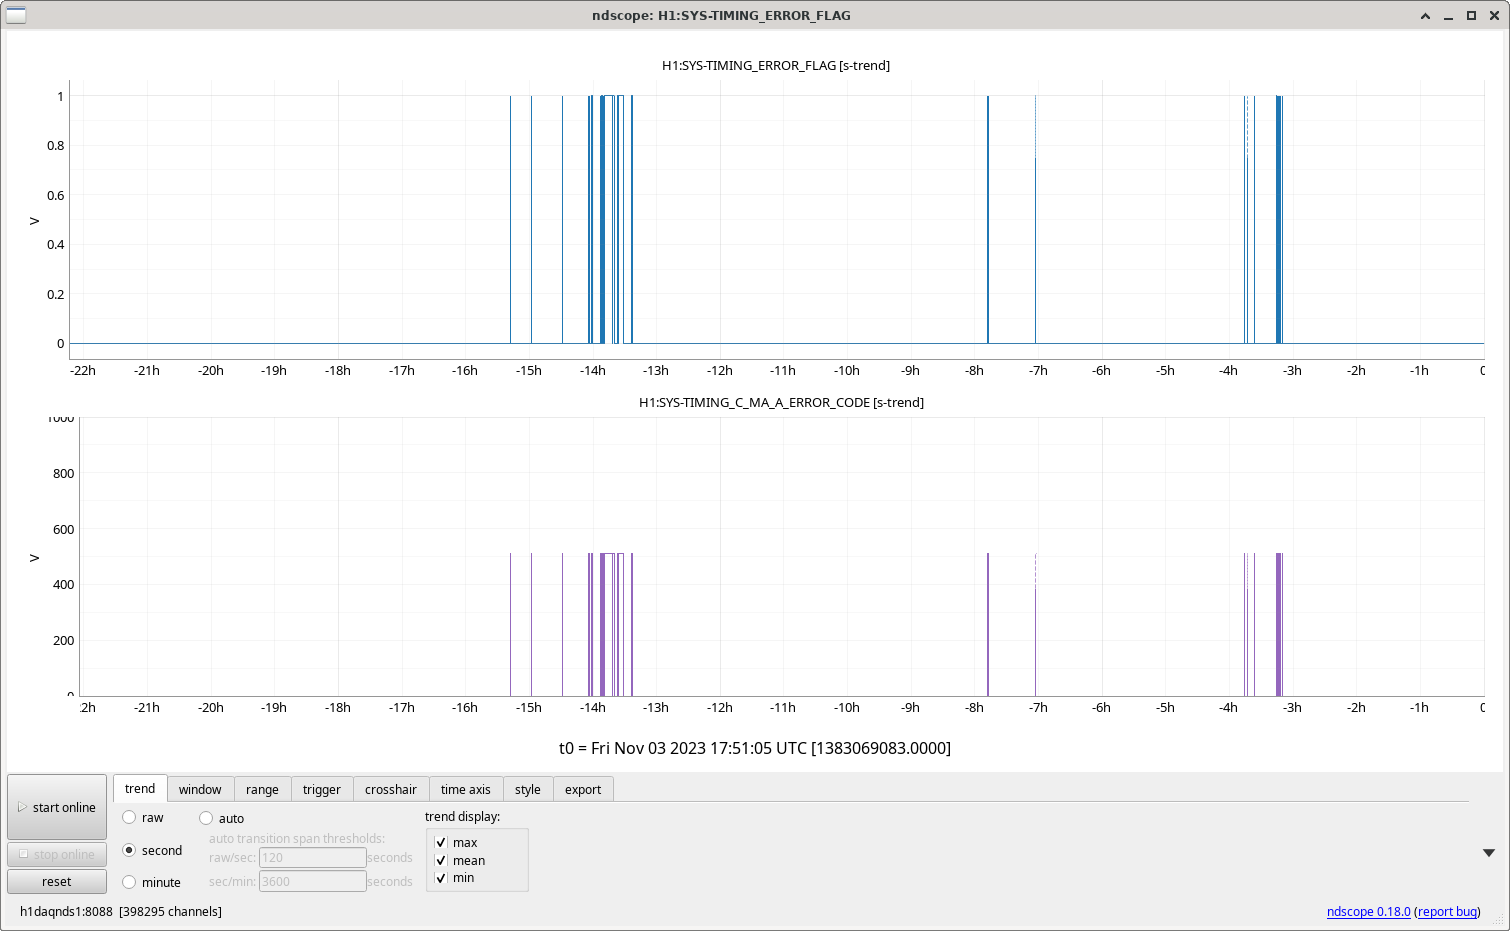
Timing master experiences trouble with GPS lock. 512 in the plot below indicates that the GPS module isn't locked to GPS.
Lockloss @ 11/03 04:00UTC
Right after the lockloss verbals said:
04:00 LOCKLOSS_SHUTTER_CHECK went to SHUTTER_FAIL
04:12:23 ALS_XARM reports "[INCREASE_FLASHES.run] USERMSG 2: Arm in Fault state! Waiting..."
04:35 Lockloss from FIND_IR right after IR was not found
- Errors with DC0, GDS0, FW1, FW0 again
- Connections reestablished
04:37 I put the detector in DOWN while waiting for Dave to verify that the computers were good - Guardian was slow to react to me INIT'ing DOWN and I had to reselect a few times
04:39 BRSX/Y_STAT nodes in Errors
BRSX/Y Log output:
Observing at 157Mpc and have been Locked for 27.5 hours.
At 03:00 we dropped out of Observing for some reason, and when I came back from the kitchen at 03:08 everything looked fine so I put us back into Observing.
It looks like the SQZ_SHG's PZT reached its limit and unlocked. On 11/03 03:00:13, SQZ_SHG logged: 'USERMSG 0: PZT voltage limits exceeded.'
Not sure if it is relevant to this issue, but a couple of hours ago, between 01:32 - 01:36 UTC on 11/03, SQZ_SHG logged 'USERMSG 0: SHG PZT volts low, may be noisy, try relocking' many times.
Jim and I have been working to tune up the gain matching for the vertical GS-13s in the HAM-ISIs. We are making good progress. I've got a new fancy-pants comb-drive which allows us to get good SNR for the HAMs from about 0.1 Hz to 3ish Hz, and maybe up to 6 or 7 Hz with the v4 version. If you have some interest in frequency-dependant comb drives, LMK and we can talk. These really improve your life for measurements below 1 Hz, so maybe this is just a seismic thing.
There's a bunch of development, some measurements, and some analysis documented in SEI log 2316 and attachments. This is mostly off-line stuff, but I wanted to link it in the log because we'll probably start using this stuff in ernest at the sites very soon to see if we can improve the microseismic performance of the HAM-ISIs.
Tyler, Eric, Richard, Robert
Since the last site-wide HVAC shutdown in August (72308) there have been a number of improvements in interferometer control and reductions in HVAC vibrations and coupling. In addition, last month the ACs in the CER were identified as significant sources which had not been shut down in earlier site-wide shutdowns (73430). So we shut down the HVAC site-wide today, including the CER ACs as well as the usual turbines and chillers at the corner and end stations:
Start shutting down Nov 2, 18:06 UTC
Start turning on Nov 2, 18:20 UTC
The August shutdown increased range by roughly 10 Mpc to about 160 Mpc and Figure 1 shows that today's shutdown increased range by about 10 Mpc to about 169 Mpc. Figure 2 shows DARM spectra before during and after the shutdown. The reduction in noise seems to be broad band, reaching from 10 to 200 Hz, with the biggest feature being the 52 Hz peak which I think comes from the chilled water pump driving the cryobaffle at EX.
There were a couple of problems, to be expected as we continue to exercise the system, which I had not done since O3. For example, one of the two CER systems did not turn back on, and will be looked at tomorrow. There appears to be a slight average increase in range associated with having these three ACs off. I plan to study the coupling mechanisms for the CER ACs more this visit and also use focussed shutdowns to pinpoint other contributions.
TITLE: 11/02 Day Shift: 15:00-23:00 UTC (08:00-16:00 PST), all times posted in UTC
STATE of H1: Observing at 160Mpc
INCOMING OPERATOR: Oli
SHIFT SUMMARY: Locked for 23.5 hours. Violin modes seem to have leveled out and are no longer damping at the rate they were, but overall are much lower. VEA temperature is back to stable after Robert's sitewide HVAC shutdown.
LOG:
| Start Time | System | Name | Location | Lazer_Haz | Task | Time End |
|---|---|---|---|---|---|---|
| 15:08 | FAC | Karen | Opt Lab | n | Tech clean | 15:11 |
| 15:22 | FAC | Tyler, Robert | EX | n | Change air handler fan and speeds | 15:23 |
| 17:16 | FAC | Tyler, Eric | EX | n | Looking at supply fan | 17:17 |
| 17:22 | PCAL | Tony | OptLab | local | PCAL sphere measurement in lab | 19:22 |
| 18:05 | FAC/PEM | Robert | site | Brief HVAC shutdowns | 20:05 | |
| 21:20 | VAC | Jordan | MY | n | Drop off parts | 22:08 |
| 21:55 | VAC | Gerardo | FCTE | n | Looking at vacuum | 22:39 |
TITLE: 11/02 Eve Shift: 23:00-07:00 UTC (16:00-00:00 PST), all times posted in UTC
STATE of H1: Observing at 158Mpc
OUTGOING OPERATOR: TJ
CURRENT ENVIRONMENT:
SEI_ENV state: CALM
Wind: 6mph Gusts, 4mph 5min avg
Primary useism: 0.02 μm/s
Secondary useism: 0.25 μm/s
QUICK SUMMARY:
Observing and Locked for 23.5 hours. ITMY 5/6 and 8 are looking okay.
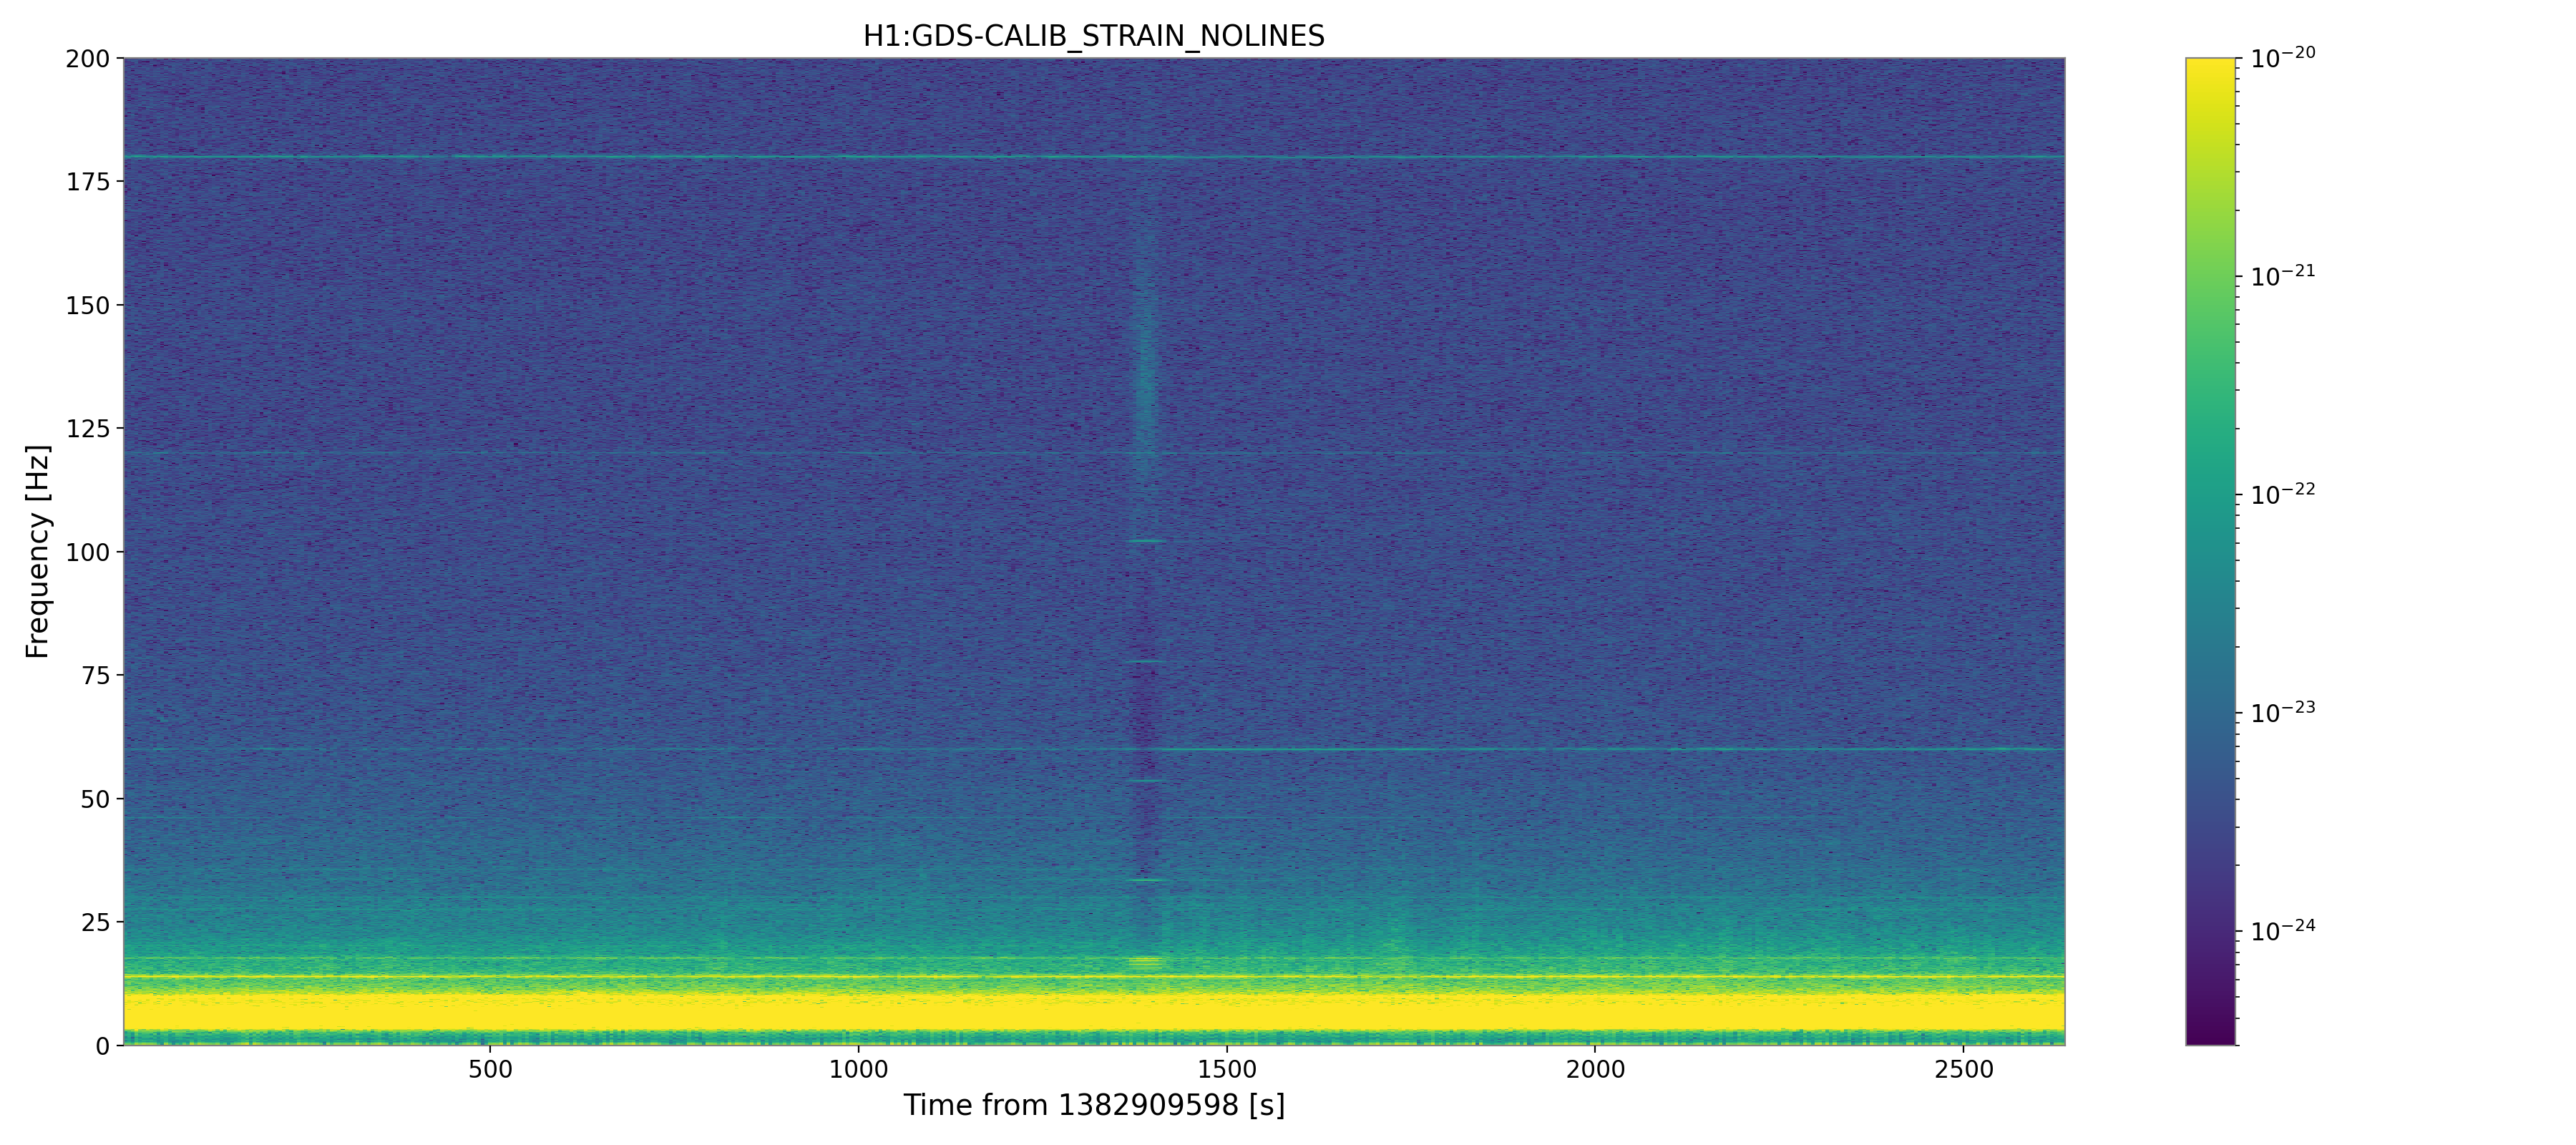
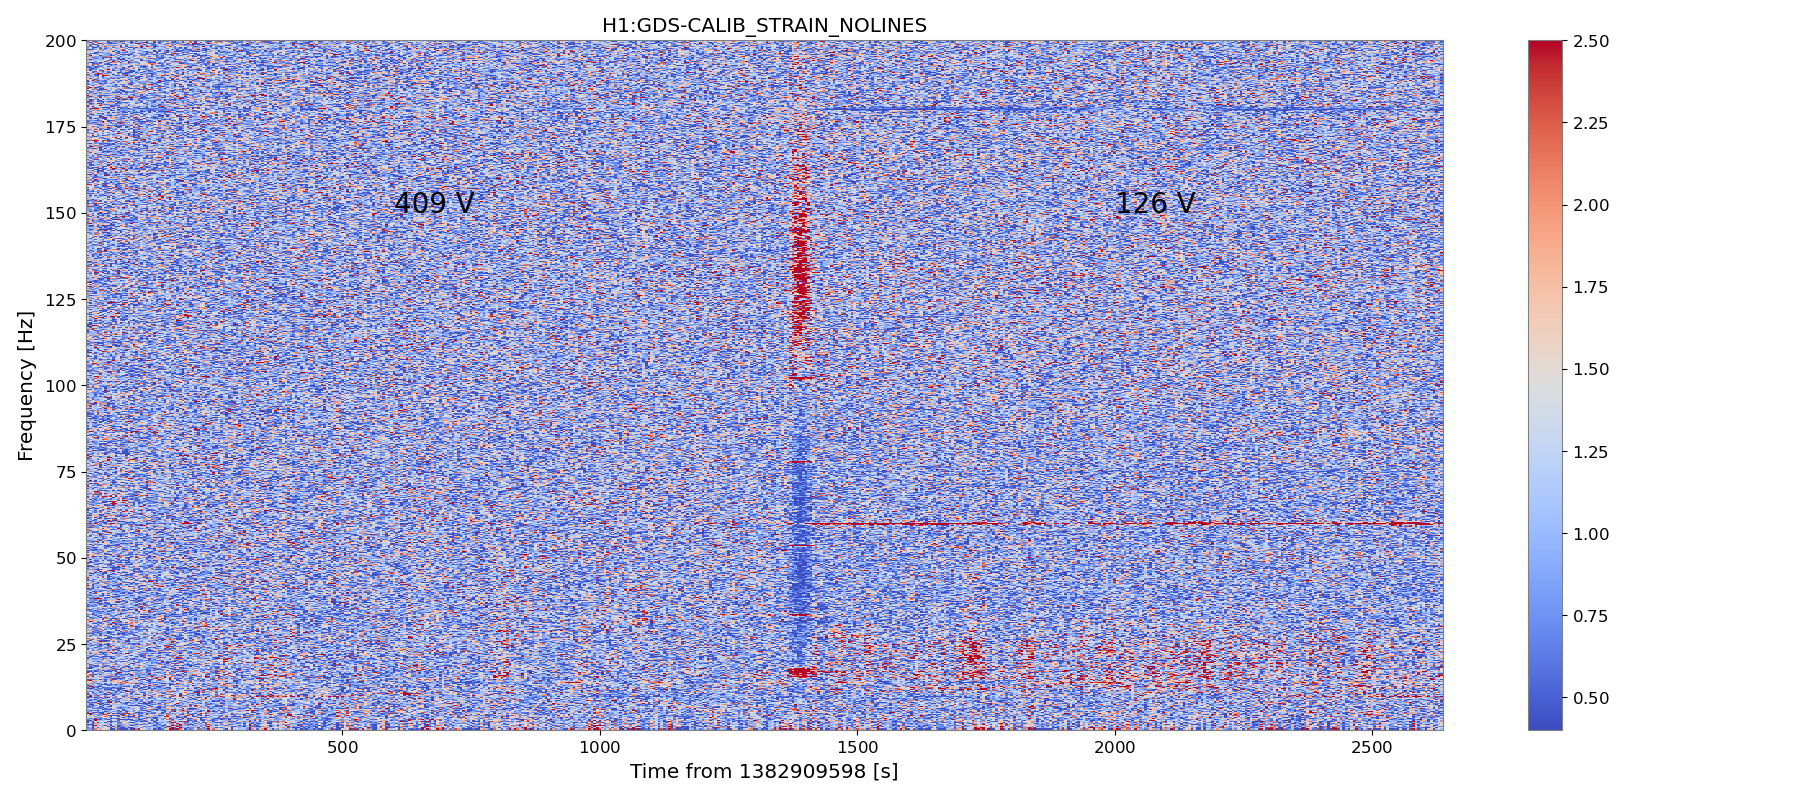
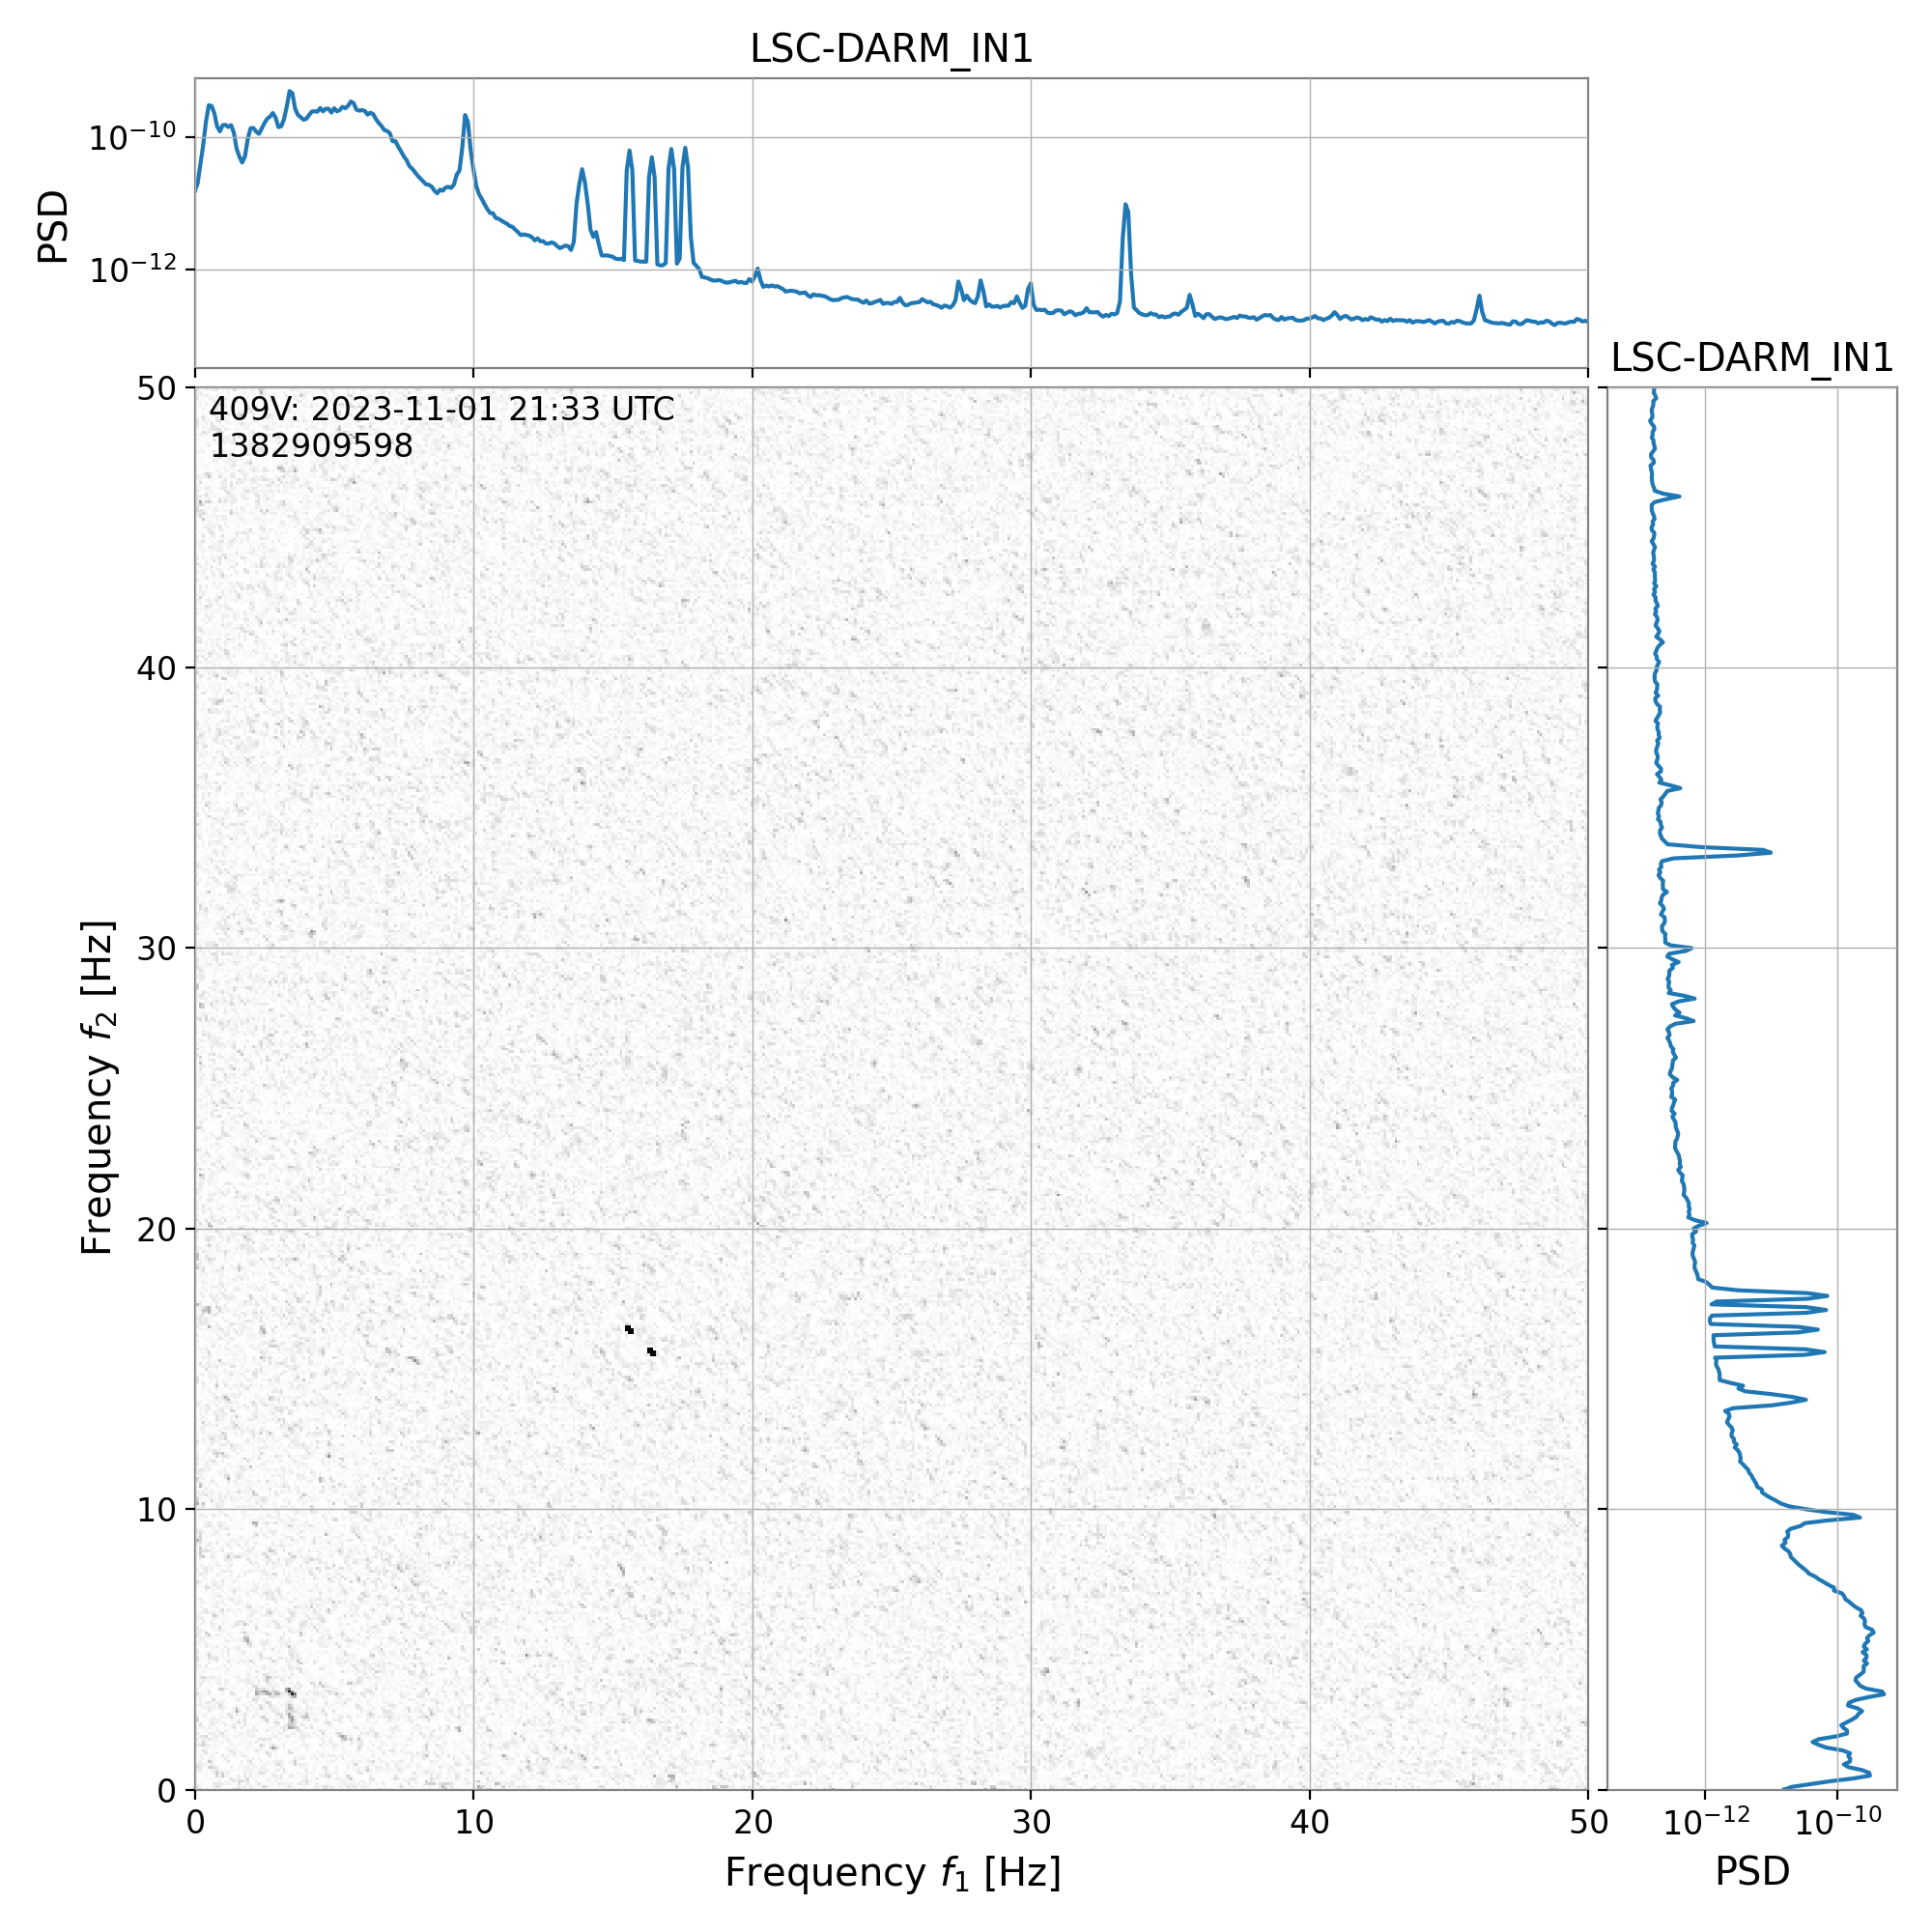
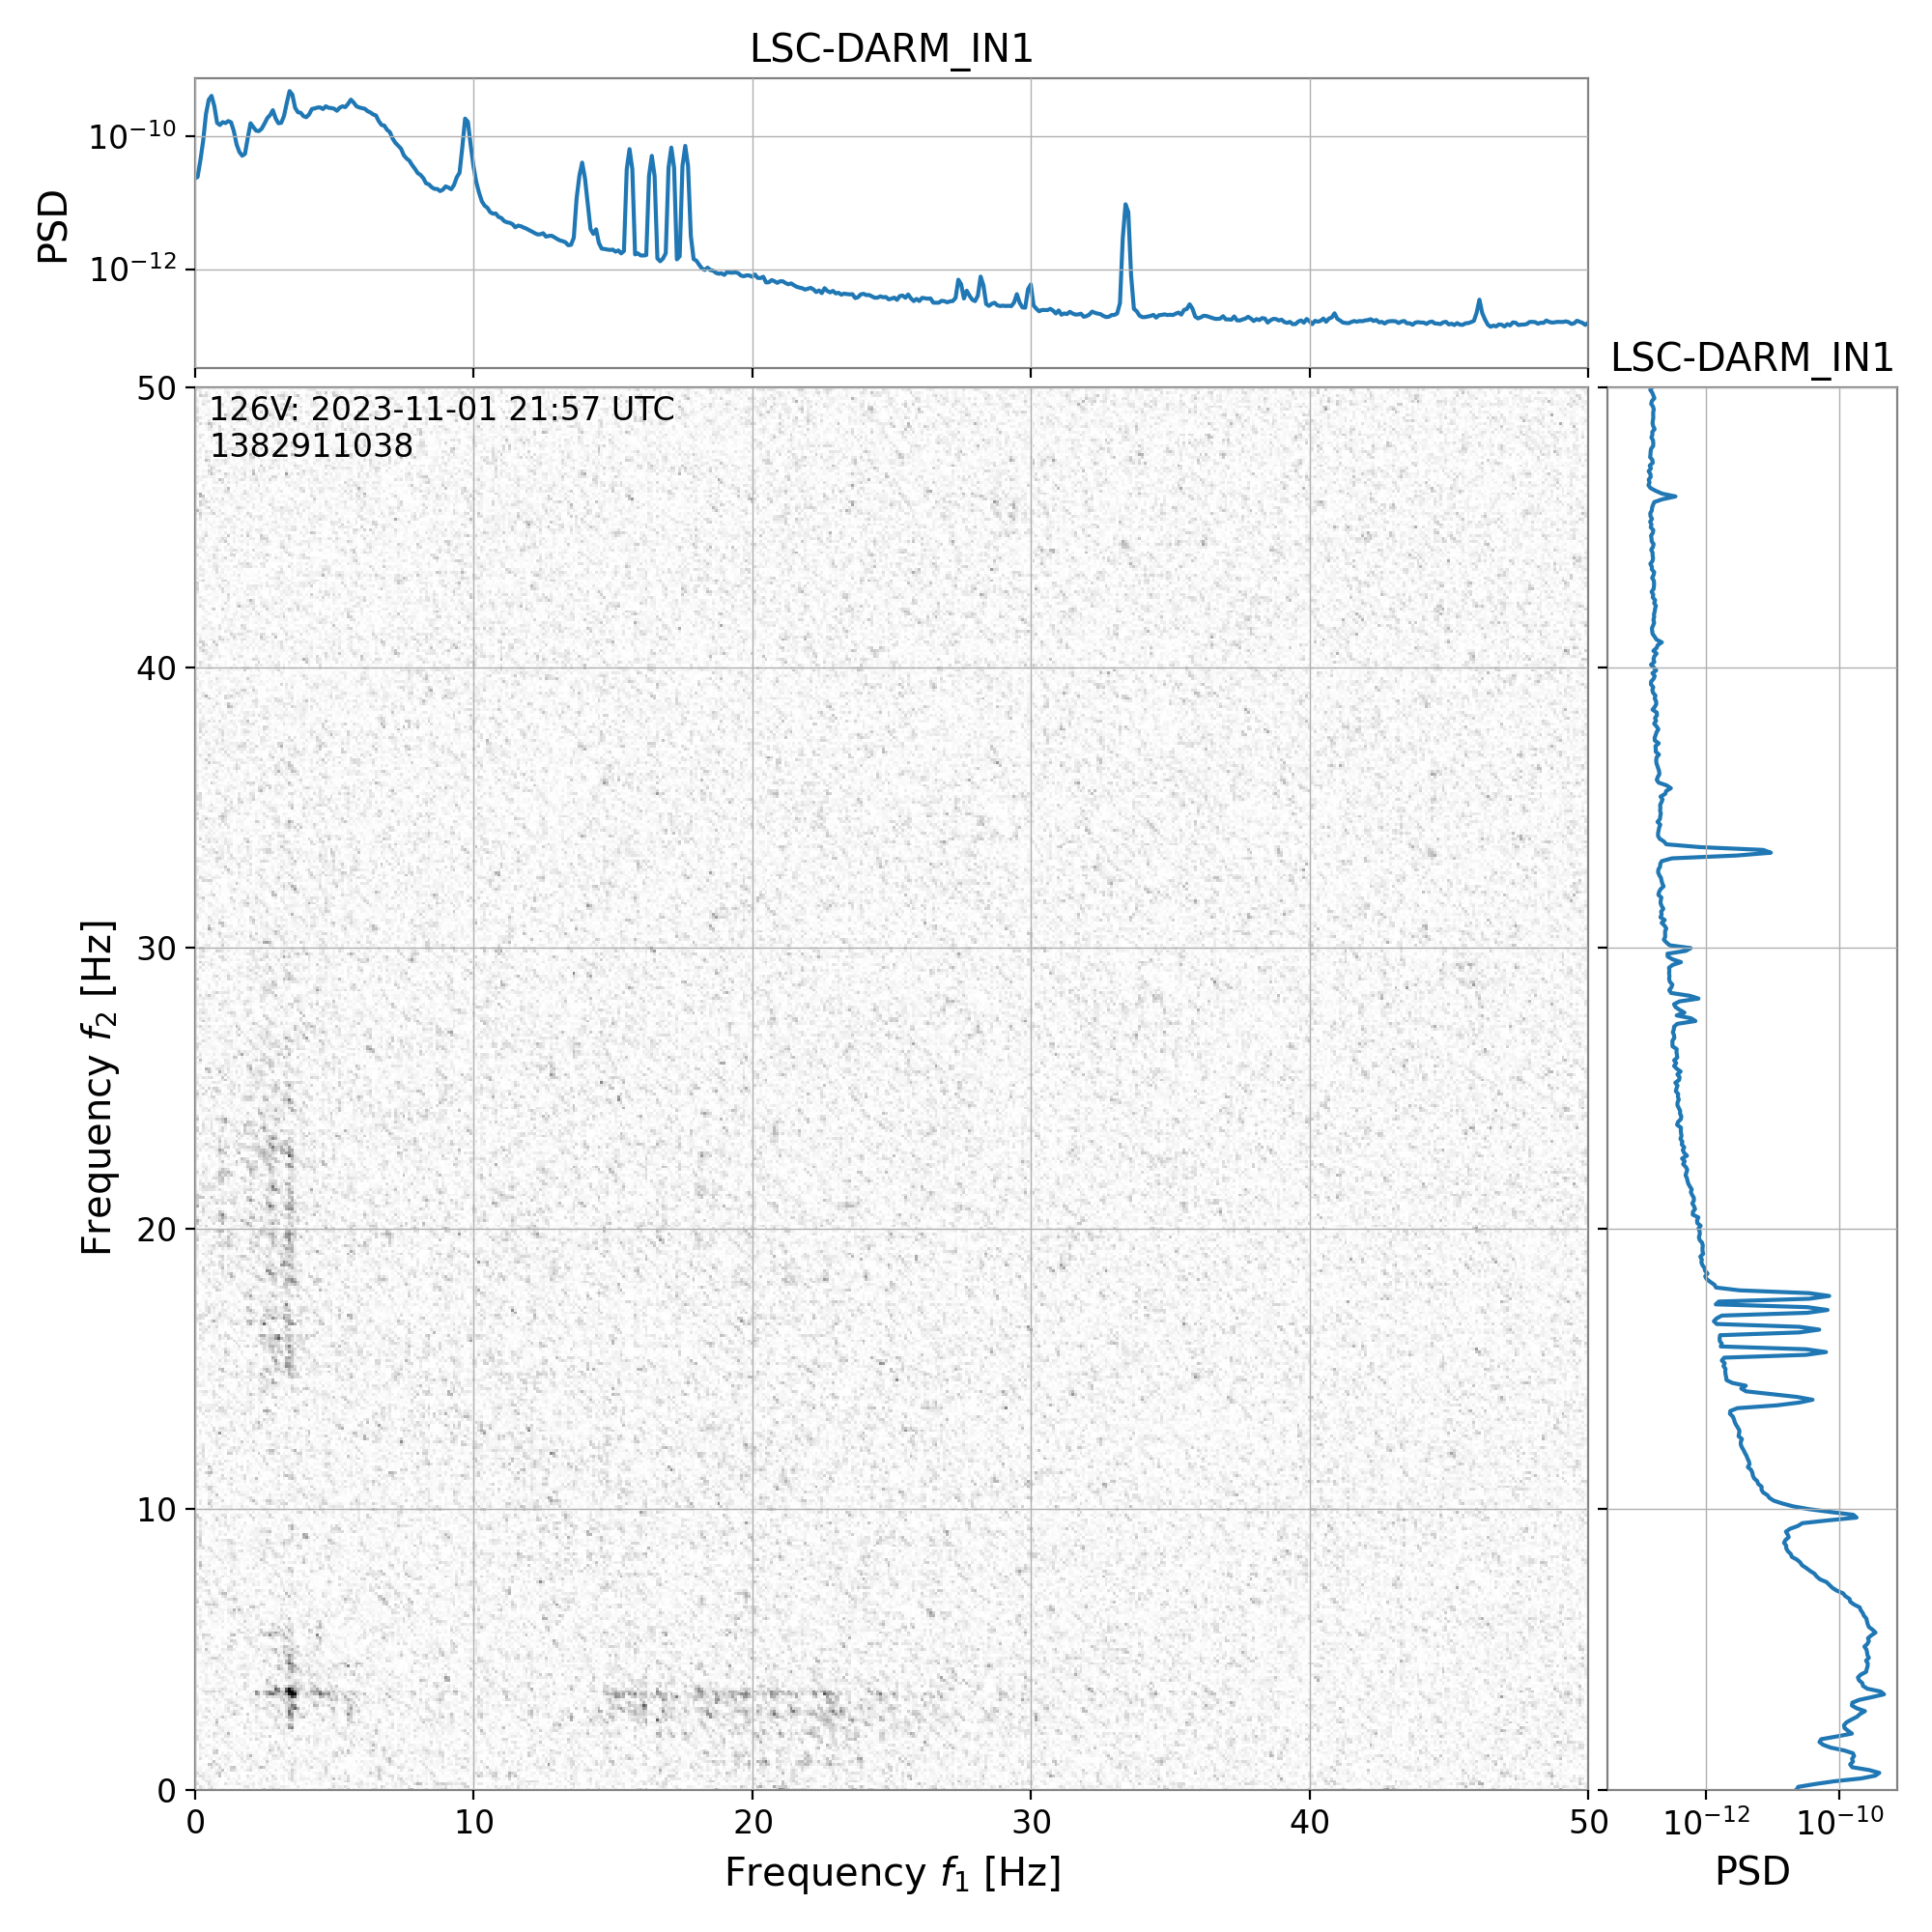
Following up on the nonstationary noise (and DARM bicoherence) reported in 73662, which motivated the addition of a DARM boost/resG in 73740 (still in place, but hasn't reduced the nonstationarity).
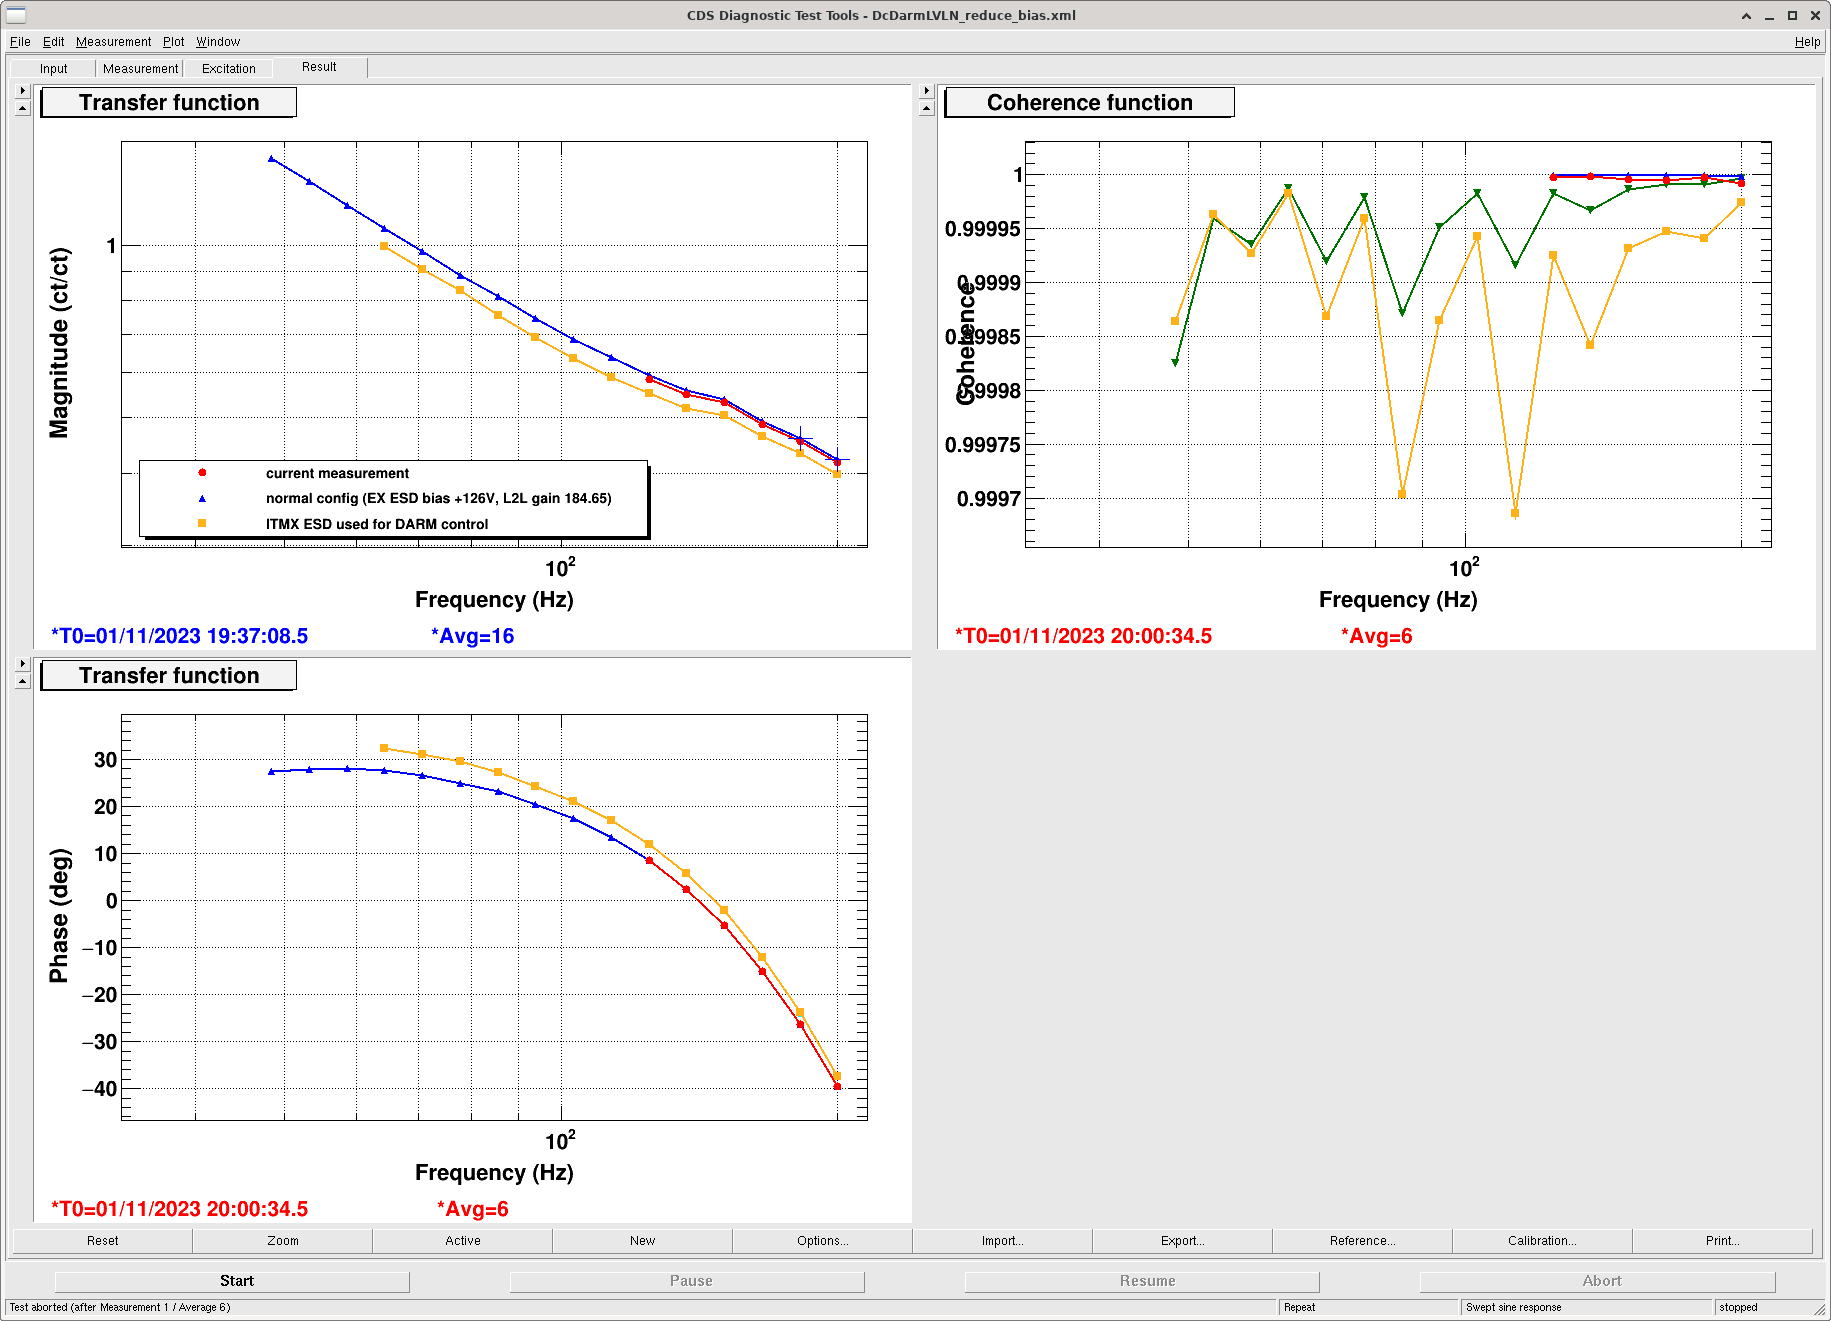
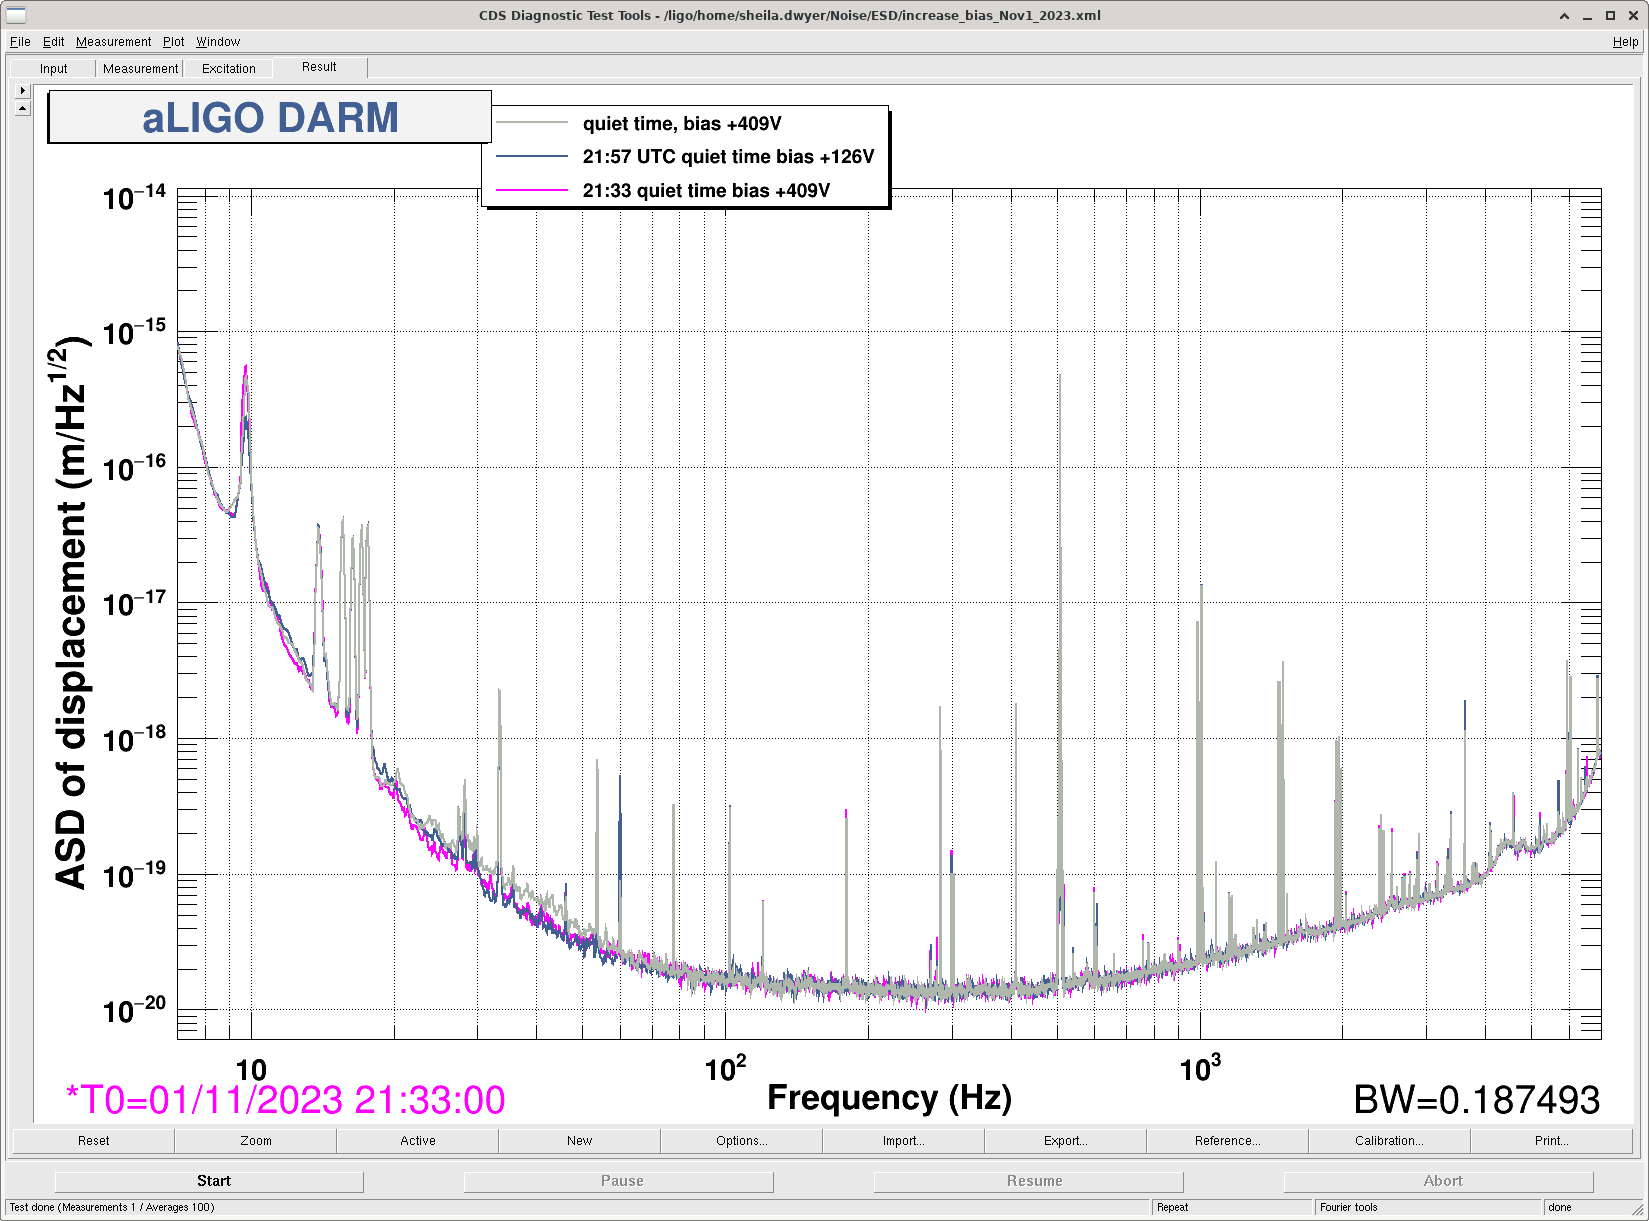
I increased the EX ESD bias from it's normal value of +126V to +409V, and compensated with the gain in L3 L2L drivealign, the settings I used resulted in a DARM gain 1.2% lower than the nominal. In the first test, there were many glitches during the high bias time, we repeated the test a second time and didn't see glitches the second time. A comparison of spectra at these times doesn't show much difference other than the normal breathing of the low frequency DARM spectra. An inital look at spectragrams also doesn't show anything obvious.
quiet times:
commands I used:
ezca['SUS-ETMX_L3_DRIVEALIGN_L2L_TRAMP'] = 60
ezca['SUS-ETMX_L3_LOCK_BIAS_TRAMP'] = 60
#go to positive half bias
ezca['SUS-ETMX_L3_DRIVEALIGN_L2L_GAIN'] = 74.982 #71.892
ezca['SUS-ETMX_L3_LOCK_BIAS_GAIN'] = 2
#go to positive full bias
ezca['SUS-ETMX_L3_DRIVEALIGN_L2L_GAIN'] = 48.6366 #47.22
ezca['SUS-ETMX_L3_LOCK_BIAS_GAIN'] = 2.85
#go to nominal settings (+126V bias) Nov 2023
ezca['SUS-ETMX_L3_DRIVEALIGN_L2L_GAIN'] = 184.65
ezca['SUS-ETMX_L3_LOCK_BIAS_GAIN'] = 1
Here's a first analysis of the effetc oof the ESD bias.
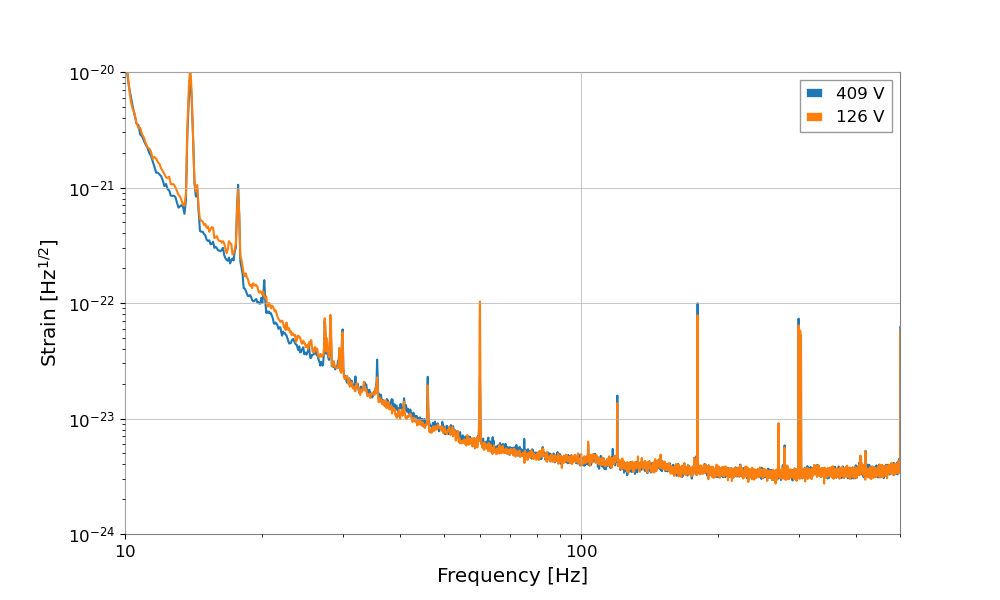
The attached PSD confirms that, in this particular time, a bias of 409V give better DARM below 30 Hz, but worse DARM above 30Hz, compared to a bias of 126V
To see if this is chance, one can look at a spectrogram. Even better, at a spectrogram whitened with the median spectrum of DARM when the bias is at 409V. Two observations:
So my conclusion would be that the worse spectrum above 30 Hz when the bias is 409V is real, but at the same time the non-stationarity is larger when the bias is at 126V.
One can look at the bicoherence of DARM with itself at 126V and at 409V. There is a striking difference: at 126V one sees the usual bicoherence of noise between 15 and 25 Hz with low frequency DARM, while at 409V this bicoherence is gone.
In conclusion, we should do a couple of repeated swithing tests to be sure, but for now: a bias of 409V seems to worsen slightly the noise above 30 Hz, but it reduces the non-stationary noise below 30 Hz.
The observation that the non-staationarity changes with the bias is interesting. It seems to indicate that the non-linearity that modulates high freqeuncy noise with low frequency motion is in the DARM actuation, namely in the ESD.
It is also consistent with the observation that tthe non-stationariity does not depend on the DARM low frequency gain, as shown by the boost experiment. This is because incrreasing the DARM low frequency gain changes the error signal, but the cntrol signal is almost exactly the same.
We should try to reduce the low frequency (<4 Hz) control signal to the ESD by reworking the DARM offloading to L2 and upper stages.
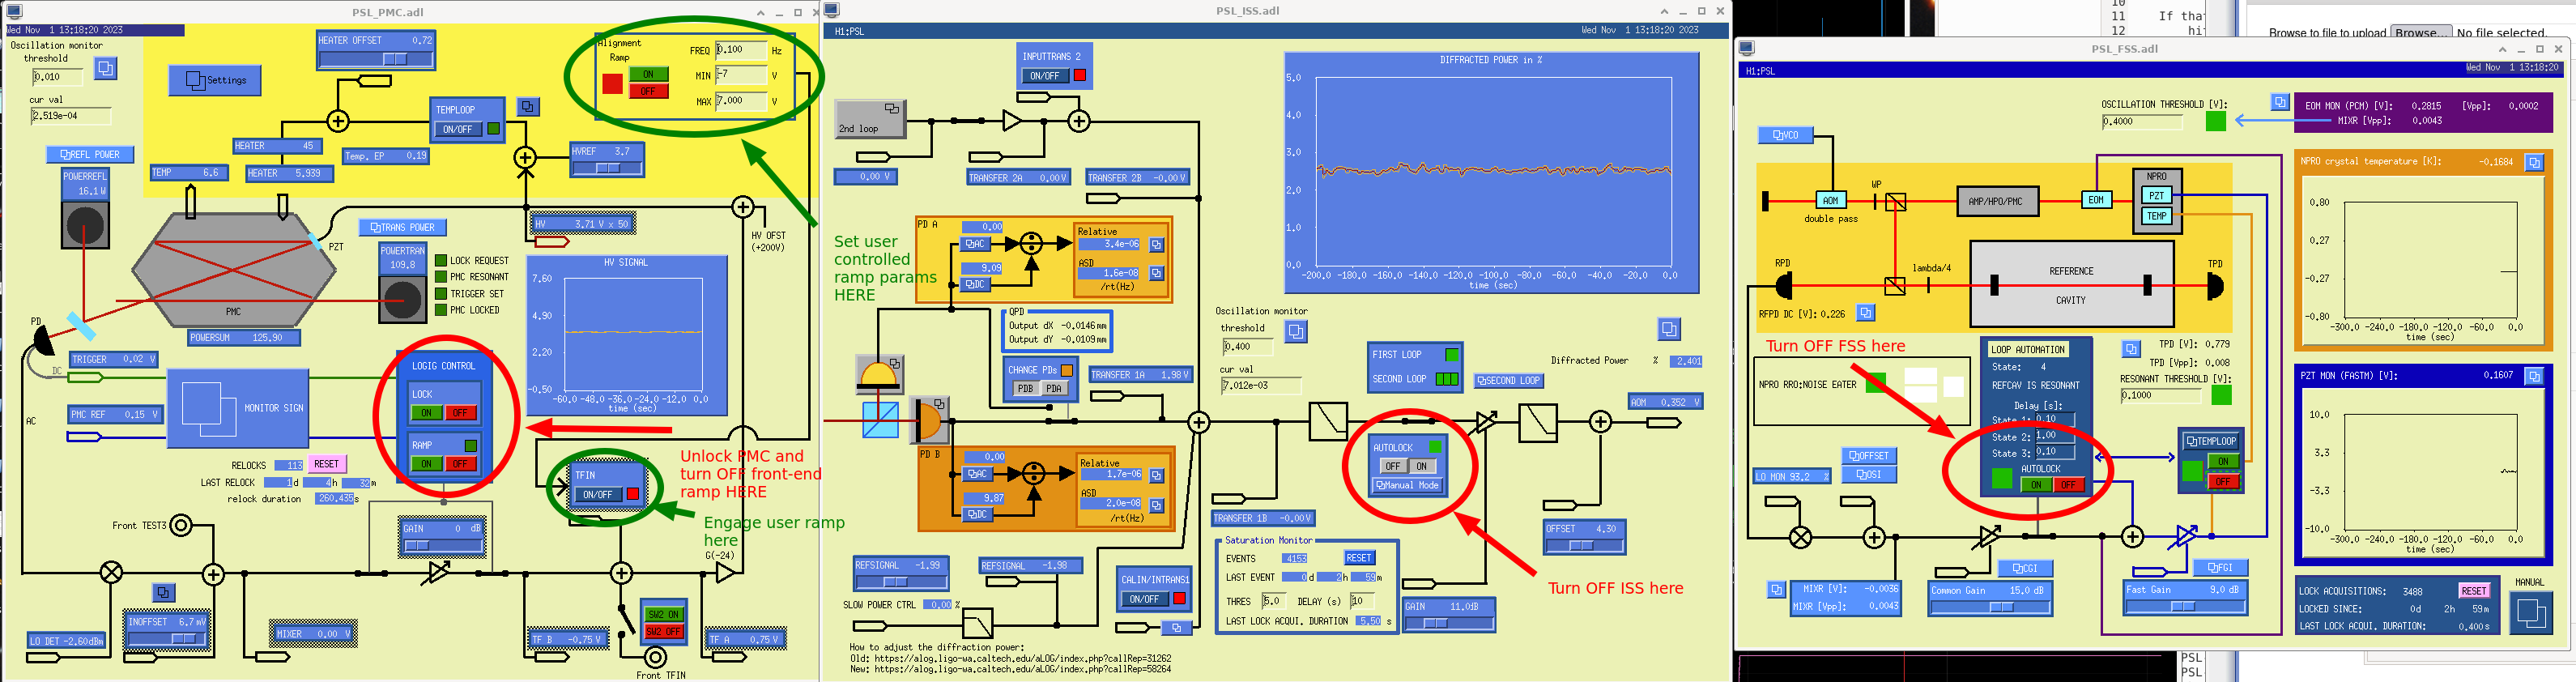
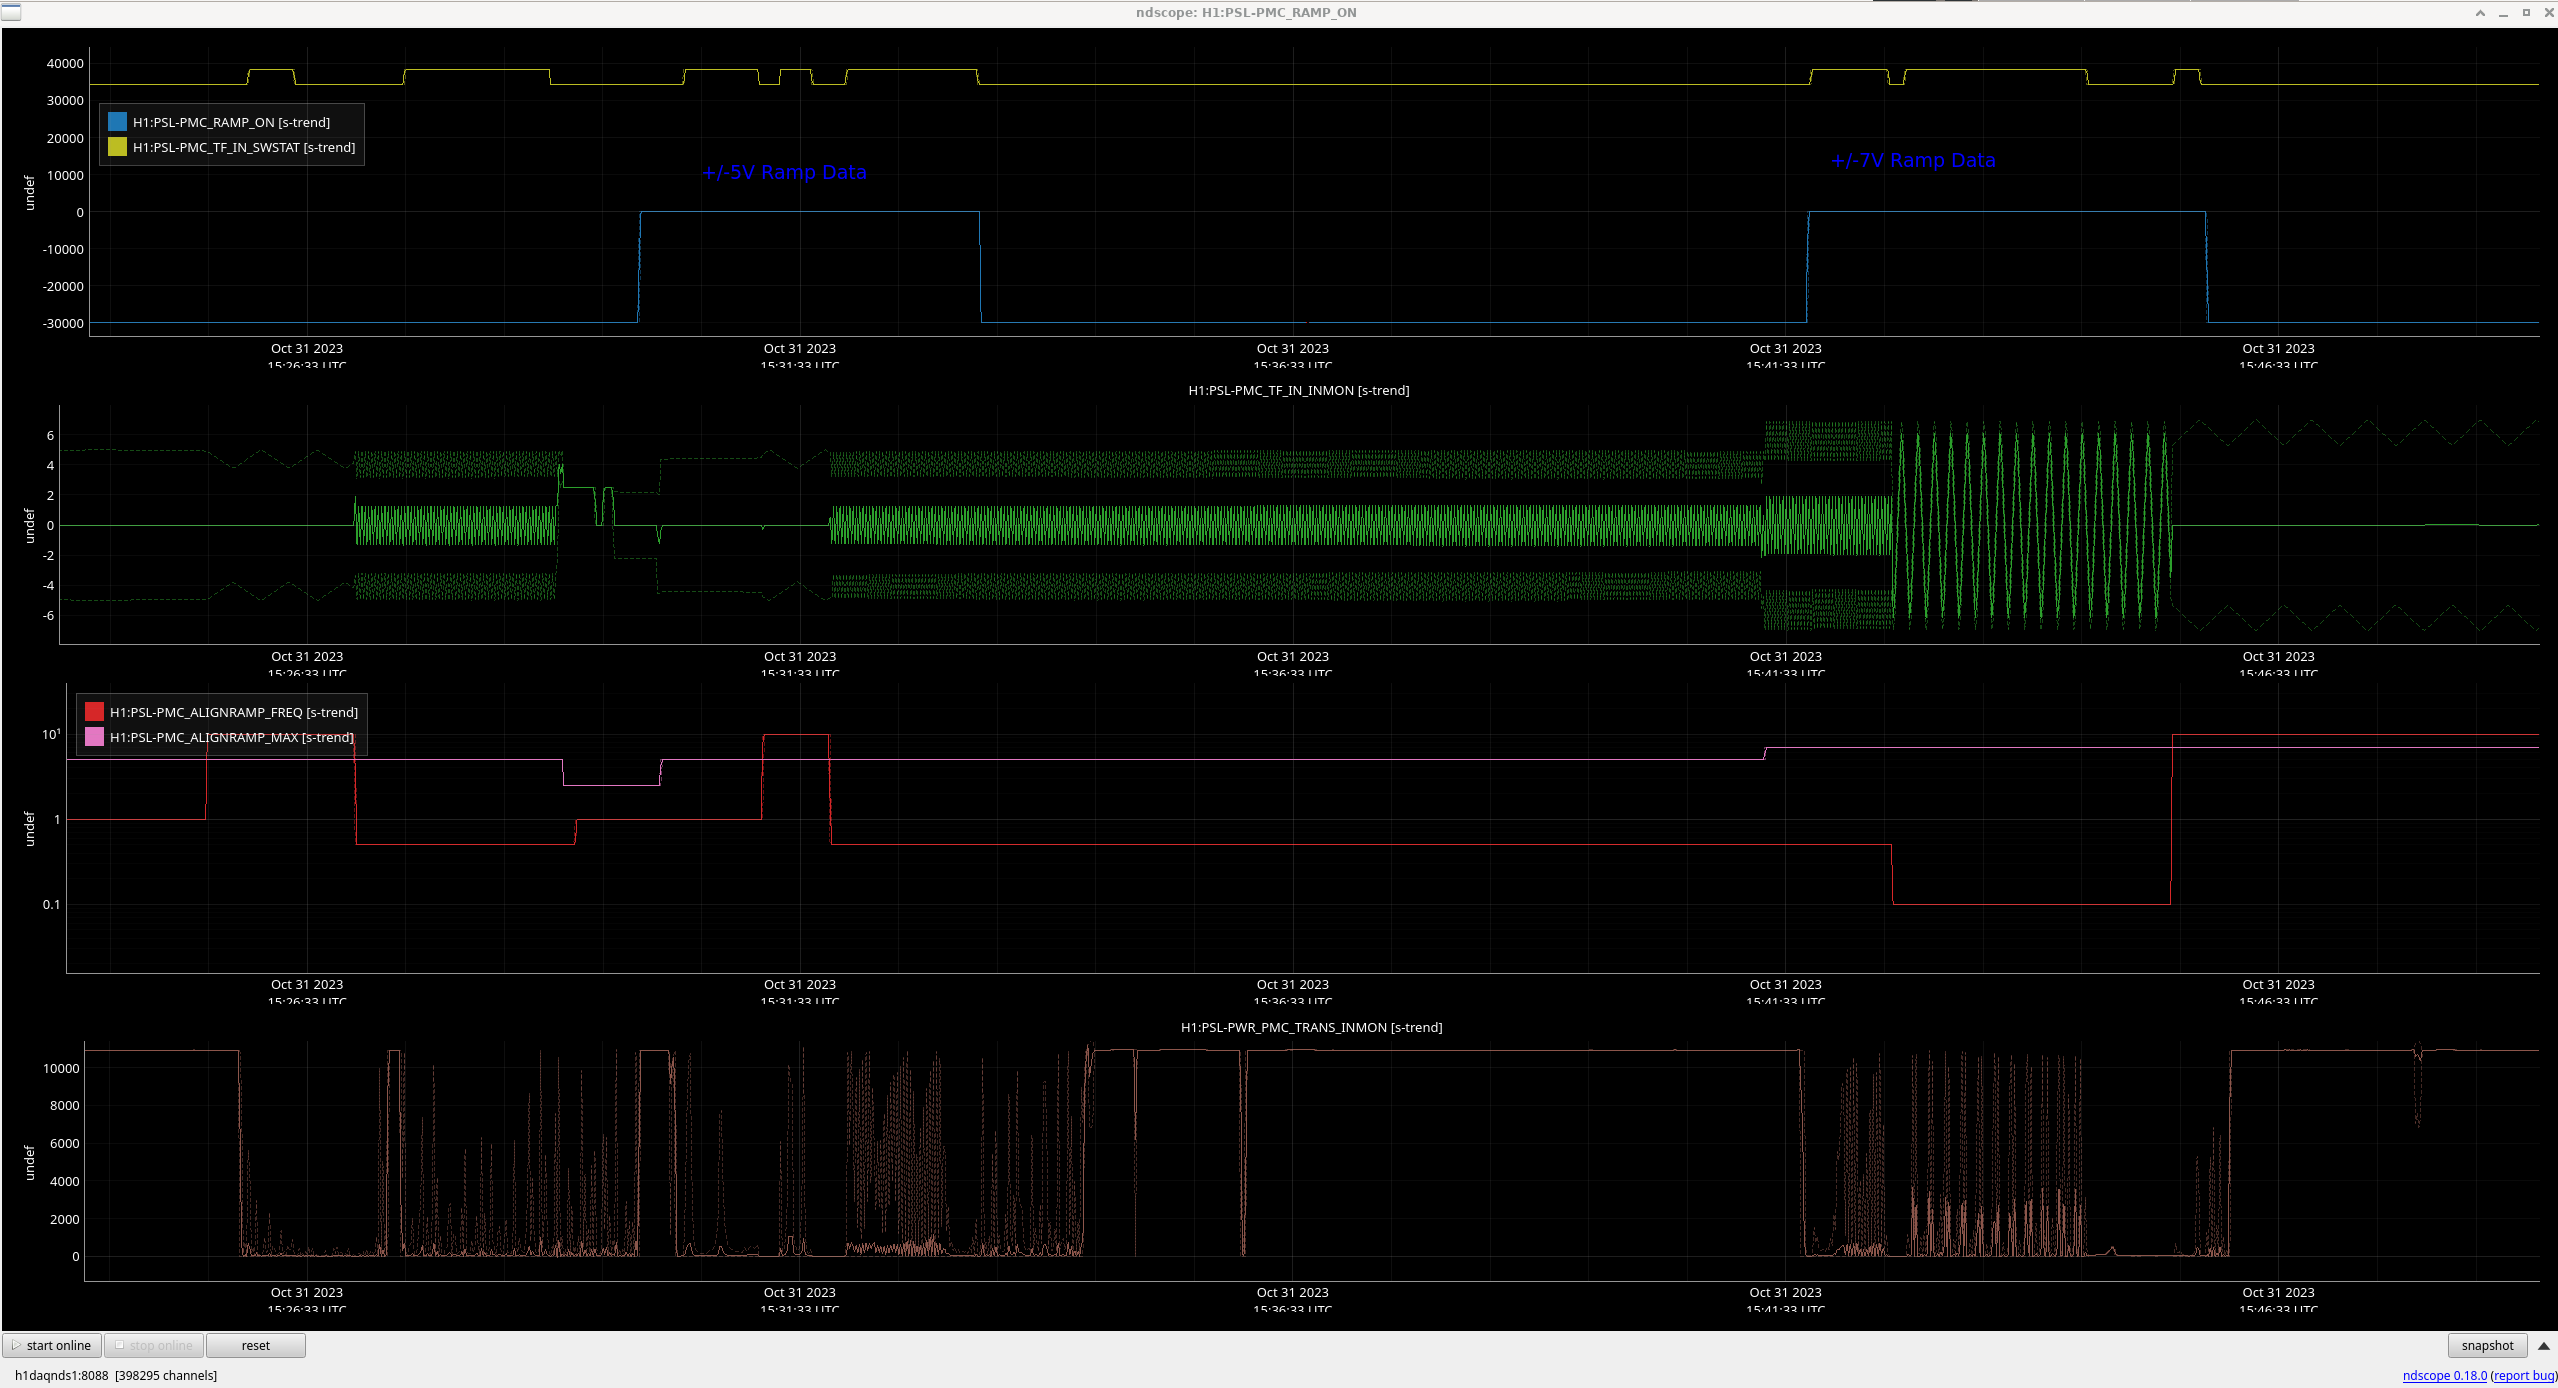
J. Kissel (with help/advice from J. Driggers, S. Dwyer, J. Oberling) WP 11493 Why am I doing this PRIMER We're yak-shaving again; this time in support of better understanding what the eventual frequency / phase noise will be incoming from a PSL pick-off (at the point of RefCav reflection much like SQZ or ALS fiber pickoffs, see D1300348) for the current design of SPI L (see G2301177; the longitudinal, or "L" DOF of future seismic platform interferemeters "SPI"), corroborating current estimates shown in SWG:12112. The idea is to establish a "[Hz / V]" linear calibration for the PMC length control PZT, such that once established, we can measure the PSL "frequency noise" in various configurations of the detector (e.g. "only RefCav locked," "only IMC + RefCav," "full IFO CARM + IMC + RefCav"). Critically, for the planned frequency-band in which we plan to use SPI L for ISI platform control -- we care about "frequency noise" delivered on the fiber in the 0.01 to 5 Hz region; this *not* a frequency region typically plotted -- from 10 to 10000 Hz, since that's where the main interferometer (IFO), or frequency-dependent squeezer (FDS or SQZ), or arm length stabilization (ALS), systems care about frequency noise (see e.g. chapter of 3 of P1800022 or chapter 6 of P2200287) -- so it's been a struggle to find plot of this noise in the frequency band we need. Notice that I put "frequency noise" in quotes. This is because, for a single fabry perot cavity (be it linear, triangular, or bowtie) on resonance, 1 lambda0 1. lambda0 ---- df = ------- df = ---- dL = ------- dphi f0 c L0 2*pi*L0 where df = actual frequency noise of the laser, whose frequency is f0 lambda0 = wavelength of the laser c = speed of light = lambda0 * f0 dL = actual cavity length / acoustic noise L0 = the roundtrip length of the cavity dphi = phase noise of the laser which means that (a) all of these noises can be re-cast as version of each other if you know the laser wavelength and cavity length, and (b) that *sources* of these noise can all get confused together when you're just measuring one thing, e.g. the typical error signal -- the reflected light from the cavity. This fact, (b), is why I but "frequency noise" in quotes, or call it *effective* frequency noise. Now -- the PMC itself is a cavity that is in-air, relatively short, and relatively low finesse. As such, the PSL PMC will never measure the *actual* full IFO CARM + IMC + RefCav *actual* frequency noise, since that frequency (or length, or phase) noise is established with the full 4 km arm cavities, suspended on a BSC+ISI+QUAD system in vacuum. What we'll end up measuring with the PMC are the *other* noises which are "artifacts" of the measurement -- cavity length noise (sometimes called "acoustic" noise), shot noise of the PMC REFL sensor, etc. BUT -- this "frequency noise" is still relevant because it serves as an upper limit on the *effective* frequency noise on the PSL table. Further, one of the open questions for the SPI L is how we'll use it operationally; only when the full IFO is locked or "at 'all' times, or at least when the PMC + ISS + FSS is locked"? So, we also want to see if the PMC "frequency noise" measures anything different in the three configurations of the IFO -- and again, we want this information between 0.01 to 5 Hz. Eventually, we'll *also* use the FDS system -- which similarly receives fiber-delivered PSL light -- to *then* establish how much *additional* effective frequency noise is added by the fiber as it traverses across the LVEA via the standard LIGO fiber delivery system. OK. That sets the scene, now on to the actual attempt at creating the linear "[Hz/V]" calibration for the PSL PMC PZT. Measurement PRIMER The principle of the measurement is relatively standard: (0) Understand the *modeled* cavity parameters, including length of the cavity, and frequency "light houses" and a function of cavity length -- :: the HG00 modes (the mode at which the cavity is designed to resonate, and thus cause the highest signal on the transmission PD) :: the distance between the HG00 models -- the free-spectral-range :: and the frequencies of other, non-HG00 modes in relation to the HG00 mode, or :: if there are Pound-Drever-Hall control-side bands on the HG00 carrier light. (1) With the cavity unlocked, drive the length of the cavity using the length actuator in a smooth linear ramp and watch some photodiode in transmission as the cavity flashes through its various resonant modes. Ensure that ramp pushes the cavity length through at least one full free-spectral range. This ramp through the length of the cavity is often called a cavity "sweep," and sometimes also called a "mode scan." Typically, the drive signal is a triangular or saw-tooth wave-form, such that one gets a repeated linear ramp. (2) While doing so, record the time series of both the driver value -- in this case a PZT voltage, [V] -- and the transmitted light. The units of the transmitted light actually don't matter, but it's always nice to have a timeseries plotted in physical units, so if you can calibrate the PD into Watts of transmitted power [W]. With the repeated ramp, you can even gather statistics as the cavity sweeps through the same FSR multiple times. We expect to see the HG00 "carrier" peak to have the highest transmission; and thus these are the standard candle "goal posts" that are the most obvious feature. (3) Then, map the frequencies of "peaks" in the transmitted light time series to a frequency vector, by assigning the modeled frequency of each feature (the two HG00, any clearly identified control side bands, any clearly identified non-HG00 modes, etc. from step 0 ). (4) Now, map the frequency vector on to the PZT voltage vector to obtain a frequency as a function of voltage. Here's the kicker: a PZT is a non-linear actuator. So, in order to obtain a *linear* calibration, in [Hz/V], one needs to fit the function from (4) to a polynomial (depending on the number of modeled and identified features in the "cavity sweep," and the personal preference of the data analyst, this can be quadratic, cubic, quartic, etc.) and then take the linear coefficient of that fit as the "[Hz/V]" for a known, typical value for the operating voltage of the PZT. Another point -- because the PZT is non-linear: (a) The answer may depend on the maximum and minimum amplitude of the ramp / sweep, (b) The answer may depend on the rate (or frequency) at which the ramp repeats (i.e. the sweep frequency). (c) One may get a different answer from a ramp with a positive slope vs. a ramp with a negative slope. (d) It has hysteresis; even though one might request the same position by requesting the same voltage, the physical position where the PZT lands may be slightly different each time your request the same voltage, or said differently, there's no guarantee that a requested triangle wave with fixed amplitude will push the cavity to the same starting length on each cycle Also, because there's no a priori clear map of HG00 mode to voltage ahead of time, there's no guarantee that the cavity's free-spectral range is lined up with 0V, i.e. no guarantee that a ramp from +7V to -7V drive will *get* you two HG00 modes and one FSR. It's these additional points, the kicker, and step (3) that I hadn't remembered, and/or didn't re-appreciate before I got started. Ah well. Hopefully these things can be done offline. Measurement Technique 2023-10-31_MeasurePMCSweep_Notes.txt are more detailed notes of the "procedure," but the summary of the specifics: - With the IFO unlocked, the IMC unlocked, the FSS and ISS OFF, and the PMC unlocked, - I used the user-controlled excitation "PSL-PMC_ALIGNRAMP" that feeds into the H1:PSL-PMC_TF_IN filterbank in order to drive a triangle wave (i.e. successive linear ramps, one positive sloped and one negative sloped) into the PMC's PZT - In order :: to combat the suspicions of non-linearity, and :: because we didn't know what triangle wave frequency would be best as a compromise between "much less than the PMC cavity pole," and "faster than we expect the free-running PSL alignment, intensity, and frequency to drift" I recorded 6 different measurements with two amplitudes and three ramp rates (triangle wave frequency; time spacing between voltage maximums): H1:PSL-PMC_ALIGNRAMP _FREQ [Hz] _MIN [V] _MAX [V] Trial 1 0.5 -5.0 +5.0 Trial 2 1.0 -5.0 +5.0 Trial 3 10. -5.0 +5.0 Trial 4 0.1 -7.0 +7.0 Trial 5 0.5 -7.0 +7.0 Trial 6 10. -7.0 +7.0 I also show a screenshot of the three FSS, ISS, and PMC MEDM screens, with highlights of what to click to get started in the above configuration after the operator holds the IFO ISC_LOCK guardian state in DOWN, and the IMC_LOCK guardian in OFFLINE. Further, I show a trend of the relevant channels during the the whol series of measurements. Since none of the relevant fast channels are stored in the frames (namely, H1:PSL-PMC_TF_IN_IN1 [the ramp] H1:PSL-PWR_PMC_TRANS_IN1 [the PMC trans PD]), I captured the time series of the ramps using the "triggered time response" feature of DTT. These templates live in /ligo/home/jeffrey.kissel/2023-10-31 2023-10-31_1521UTC_H1PSL_PMC_TRANS_pm5Volts_0p5Hzramp.xml 2023-10-31_1521UTC_H1PSL_PMC_TRANS_pm5Volts_10Hzramp.xml 2023-10-31_1521UTC_H1PSL_PMC_TRANS_pm5Volts_1Hzramp.xml 2023-10-31_1521UTC_H1PSL_PMC_TRANS_pm7Volts_0p1Hzramp.xml 2023-10-31_1521UTC_H1PSL_PMC_TRANS_pm7Volts_0p5Hzramp.xml 2023-10-31_1521UTC_H1PSL_PMC_TRANS_pm7Volts_10Hzramp.xml where the file name indicates which amplitude and ramp rate. I then exported these timeseries and plotted the results in matlab, see first attachment, 2023-10-31_1521UTC_H1PSL_PMC_rawData.pdf. The top panel is the PZT voltage triangle wave with the wave maxima highlighted in red, and minima highlighted in green; each traverse from red to green is a "negative slope" ramp, and the traverse from green to red is a "positive slope" ramp. The bottom panel shows the PMC TRANS PD during the triangle wave, where times of maxima and minima of the ramp's triangle wave are highlighted. Don't squint too hard -- I make better plots shown in the "Results" section below. First Results After a ton of timeseries parsing, and array index juggling, I took the above raw data and stacked the 6 trials into groups -- every time a negative slope ramp was traversed :: 2023-10-31_1521UTC_H1PSL_PMC_negSlope.pdf, and every time a positive slope ramp was traversed :: 2023-10-31_1521UTC_H1PSL_PMC_posSlope.pdf. For each page, which is each trial, Top panel :: I show every PZT voltage ramp stacked on top of each other. These all look like a very boring single line, but this indicates that I've done my timeseries stacking and index juggling correctly. Bottom panel :: I show the PMC TRANS PD for each of these ramps. These are only synchronized in time by the MAX and MIN requested ramp voltage, and show some spread. *This* is indicative that the PZT is an imperfect actuator that has hysteresis, as discussed above under (d). First Impressions from these Results (I) Positive slope ramps show clear non-linearity around the HG00 mode, especially for the 0.1 Hz and 0.5 Hz data at both excitation amplitudes. So, with this in mind, only the negative slope data is really useful. (II) From the negative slope ramps are much cleaner, and indeed it looks like the from +7 to -7 [V] ramps were enough voltage to traverse 2 HG00 modes. (III) Given the alignment of the HG00 modes, we can get the most use out of the +7 to -7 [V] 0.5 [Hz] ramp rate data, but maybe also the +5 to -5 [V] 10 [Hz] ramp rate data. (IV) What's ODD is that we don't seem to see evidence for the 35.5 MHz sidebands that are imposed on the PSL light incident on the PMC. We would expect, visually, that the sidebands would be symmertric about the HG00. We see no symmetric features. Maybe the modulation index is really low? Dunno. (V) We guess that everything seen in this "mode scan" is higher order modes. Next Steps From T0900616: PMC Parameter Modeled Value Measured Value L (roundtrip) 2.02 m 2.02 m +/- 0.008 m) Finesse 124.708 (124.536 +/- 5.091) 120.44 +/- 0.6 FWHM 1.19 MHz (1.195 MHz +/- 0.0488 MHz) 1.19 MHz +/- 0.06 MHz Free Spectral Range 148.532 MHz +/- 0.585 MHz 148.32 MHz +/- 0.742 MHz So we at least know two points on the voltage to frequency map (ie step 3 from above). But, because we know the PZT in nonlinear in so many different ways, we need to make sure we identify some of the other non-HG00 resonances. We did *not* record camera images during this sweep, so doing so will have to rely on guesses from modeling the cavity (or maybe there's some other characterization documentation DCC that we can find). Then we can do step 3 and 4. I note that when we eventually get to the "linearization" step, we need to know the typical operating voltage. The 2023-10-31_H1PSL_PMC_PZT_Voltage_TypicalOperatingVoltage.png attachment shows the typical operating voltage is ~0.77 [V] -- in the same voltage units as the user-defined ramp. Note -- this voltage is *not* the final voltage applied to the PZT. We have to do some further research, but I think this voltage and the ramp voltage units are DAC voltage (which I presume has the standard LIGO general standards DAC range of +/- 10 [V_peak] or 20 [V_pp]). The MEDM screen indicates that there's a -24 dB gain drop, and then I suspect that the voltage is amplified in analog by somehting like a D060283 board. We'll see.
The raw .txt file exported data lives in
/ligo/svncommon/SeiSVN/seismic/Common/SPI/Results/
2023-10-31_1521UTC_H1PSL_PMC_pm5Volts_0p5Hzramp_ts.txt
2023-10-31_1521UTC_H1PSL_PMC_pm5Volts_10Hzramp_ts.txt
2023-10-31_1521UTC_H1PSL_PMC_pm5Volts_1Hzramp_ts.txt
2023-10-31_1521UTC_H1PSL_PMC_pm7Volts_0p1Hzramp_ts.txt
2023-10-31_1521UTC_H1PSL_PMC_pm7Volts_0p5Hzramp_ts.txt
2023-10-31_1521UTC_H1PSL_PMC_pm7Volts_10Hzramp_ts.txt
The script to process the data and get it at least to a post-processed form shown in the plots in the main entry lives here:
/ligo/svncommon/SeiSVN/seismic/Common/SPI/Scripts/
process_PMC_sweep_20231031.m
To further model the expected frequency separation of higher order modes in the PMC mode scan, I've found a few more resources: In addition to the aLIGO PMC Design Documentation, T0900616, circa 2017 Liu Jian and Kentaro Mogushi worked with Rick Savage and Peter King to improve the design of the PMC -- namely to change the design from gluing the mirrors on the rigid body of the PMC to bolting the mirrors to the body. The best presentation I can find on that upgrade is G1701481. Some loss measurements were made of the glued PMCs, and the documentation of those measurements contains some juicy design details of the PMC -- see T1600204. During that design process, as Liu was learning about the details of the PMC, he put together a tech note, E1700340 that hints at further details of the *new* PMC design, which is now installed in the H1 PSL (though I can't find an explicit aLOG documenting when exactly).
Sheila and I used this data to get a rough calibration of the PZT HV channel: 0.0236 V/MHz, as in alog 81385.
Summary:
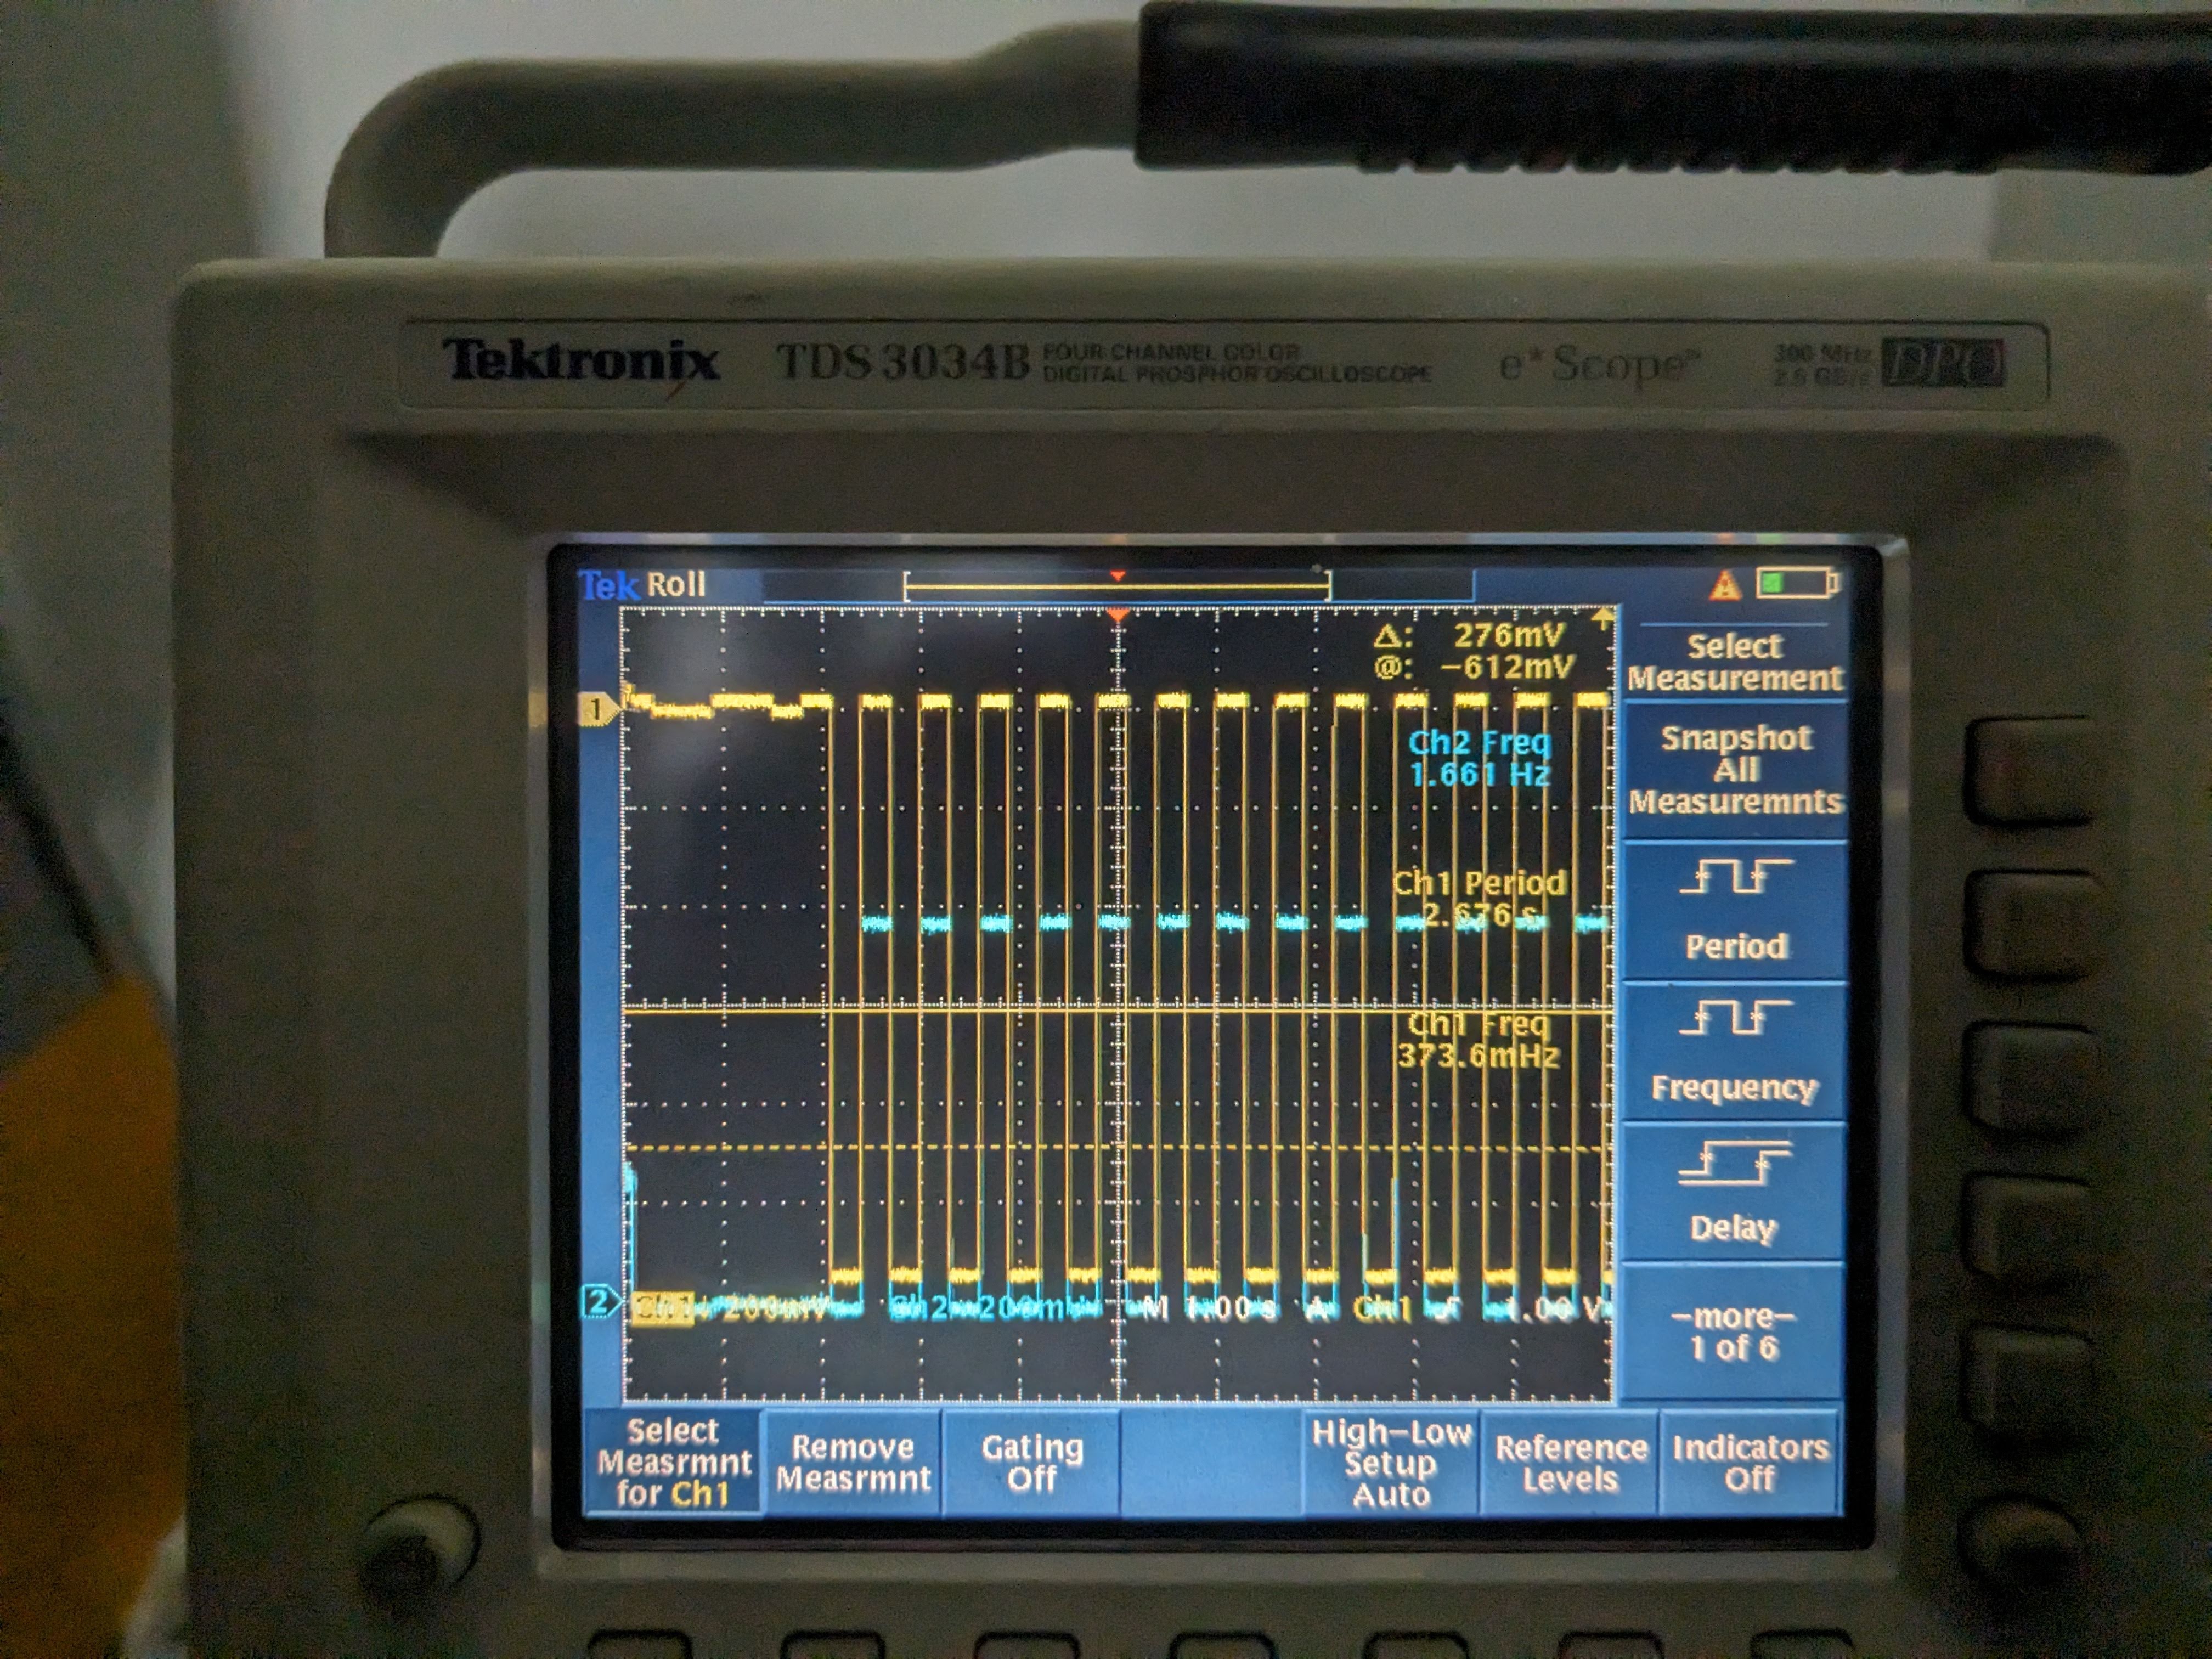
It seems that the supply voltage for thermistors is oscillating, the frequency depends on whether or not the supply is loaded with thermistors (830mHz open to 1.66Hz fully connected to the in-chamber thermistors), the amplitude of the oscillation jumps seemingly randomly, and this is also happening for the unused Beckhoff module for the yet-to-be-installed second T-SAMS unit, all measured at the back of the Beckhoff chassis. (Can't we measure this from Beckhoff itself, without me going to the floor?)
Fil and Fernando quickly set up the same Beckhoff module in the lab and didn't observe this. Could we swap or maybe restart the modules in the chassis?
As of now, Beckhoff cable is disconnected from the back of the heater driver chassis. (I'm applying DetChar-Request tag just so people know, but we're just changing from one no-comb configuration to the other.)
Detaisls:
Since the past findings about OM2 and 1.66Hz comb (alogs 73367, 73233, 72967 72241 and 72061) didn't make sense, I went to the floor and remeasured the comb in the Beckhoff heater output (which goes to the heater driver input) as well as thermistor pins in the back of the heater driver chassis while Beckhoff connection was intact.
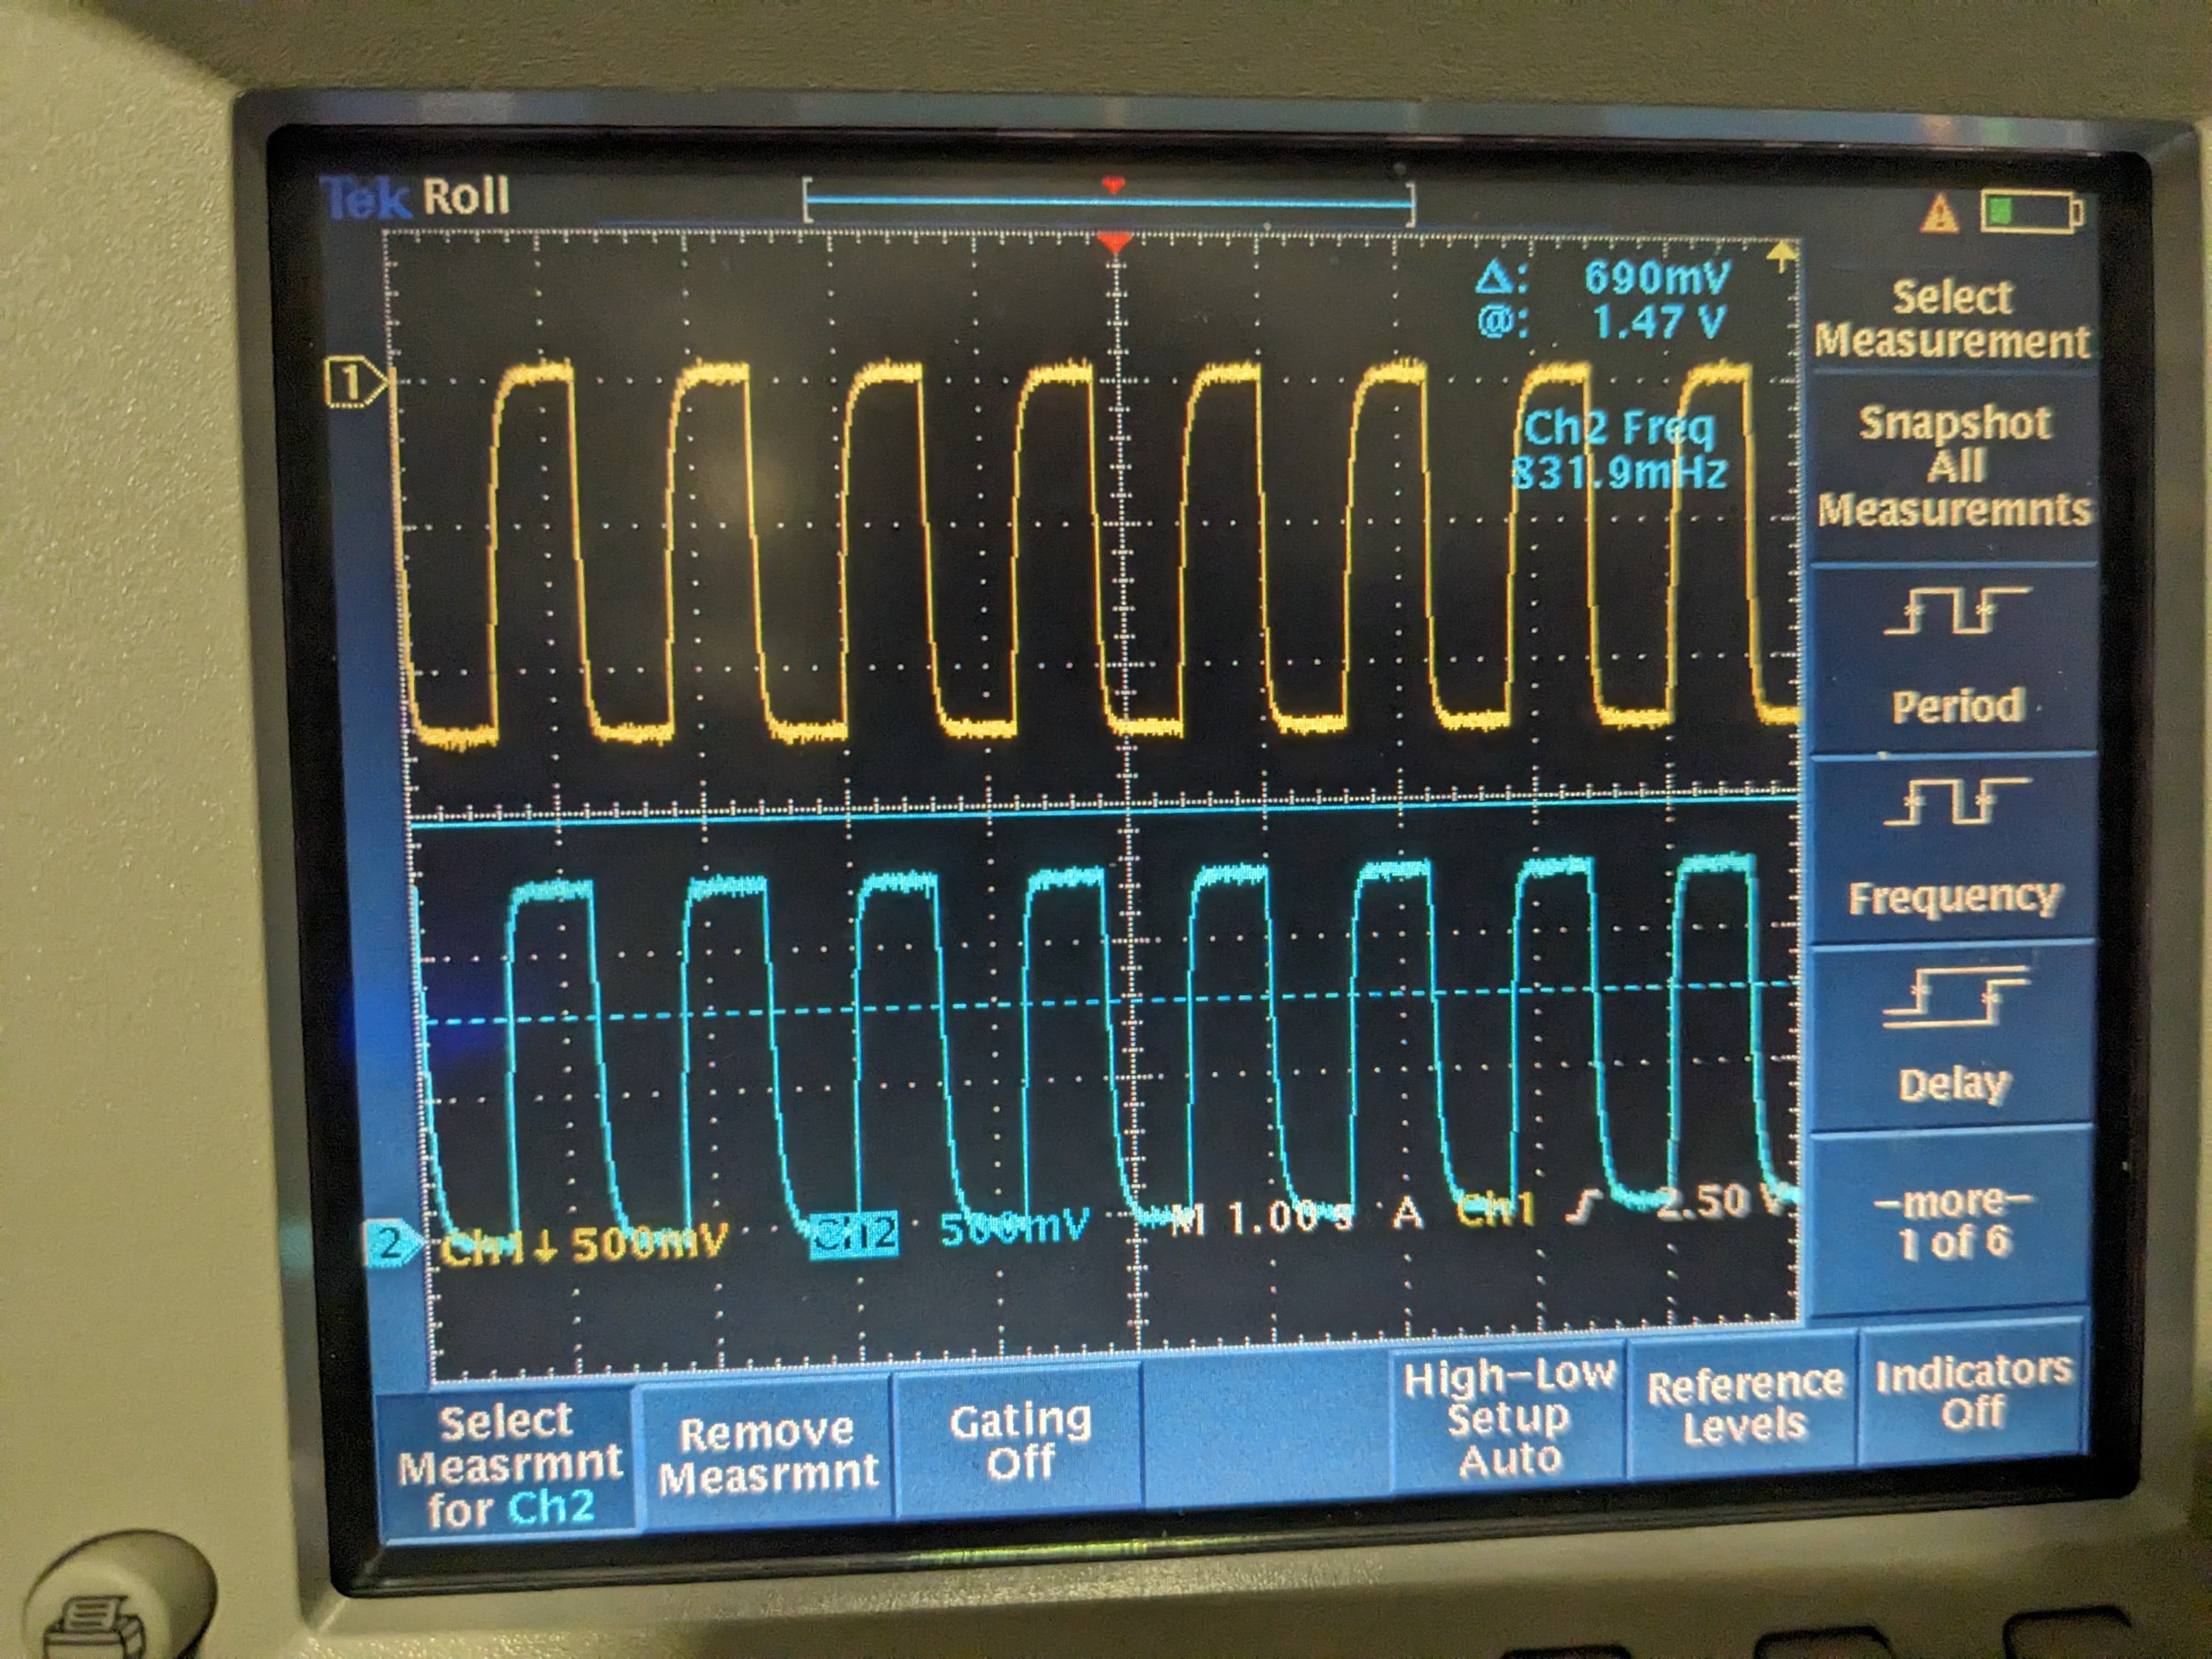
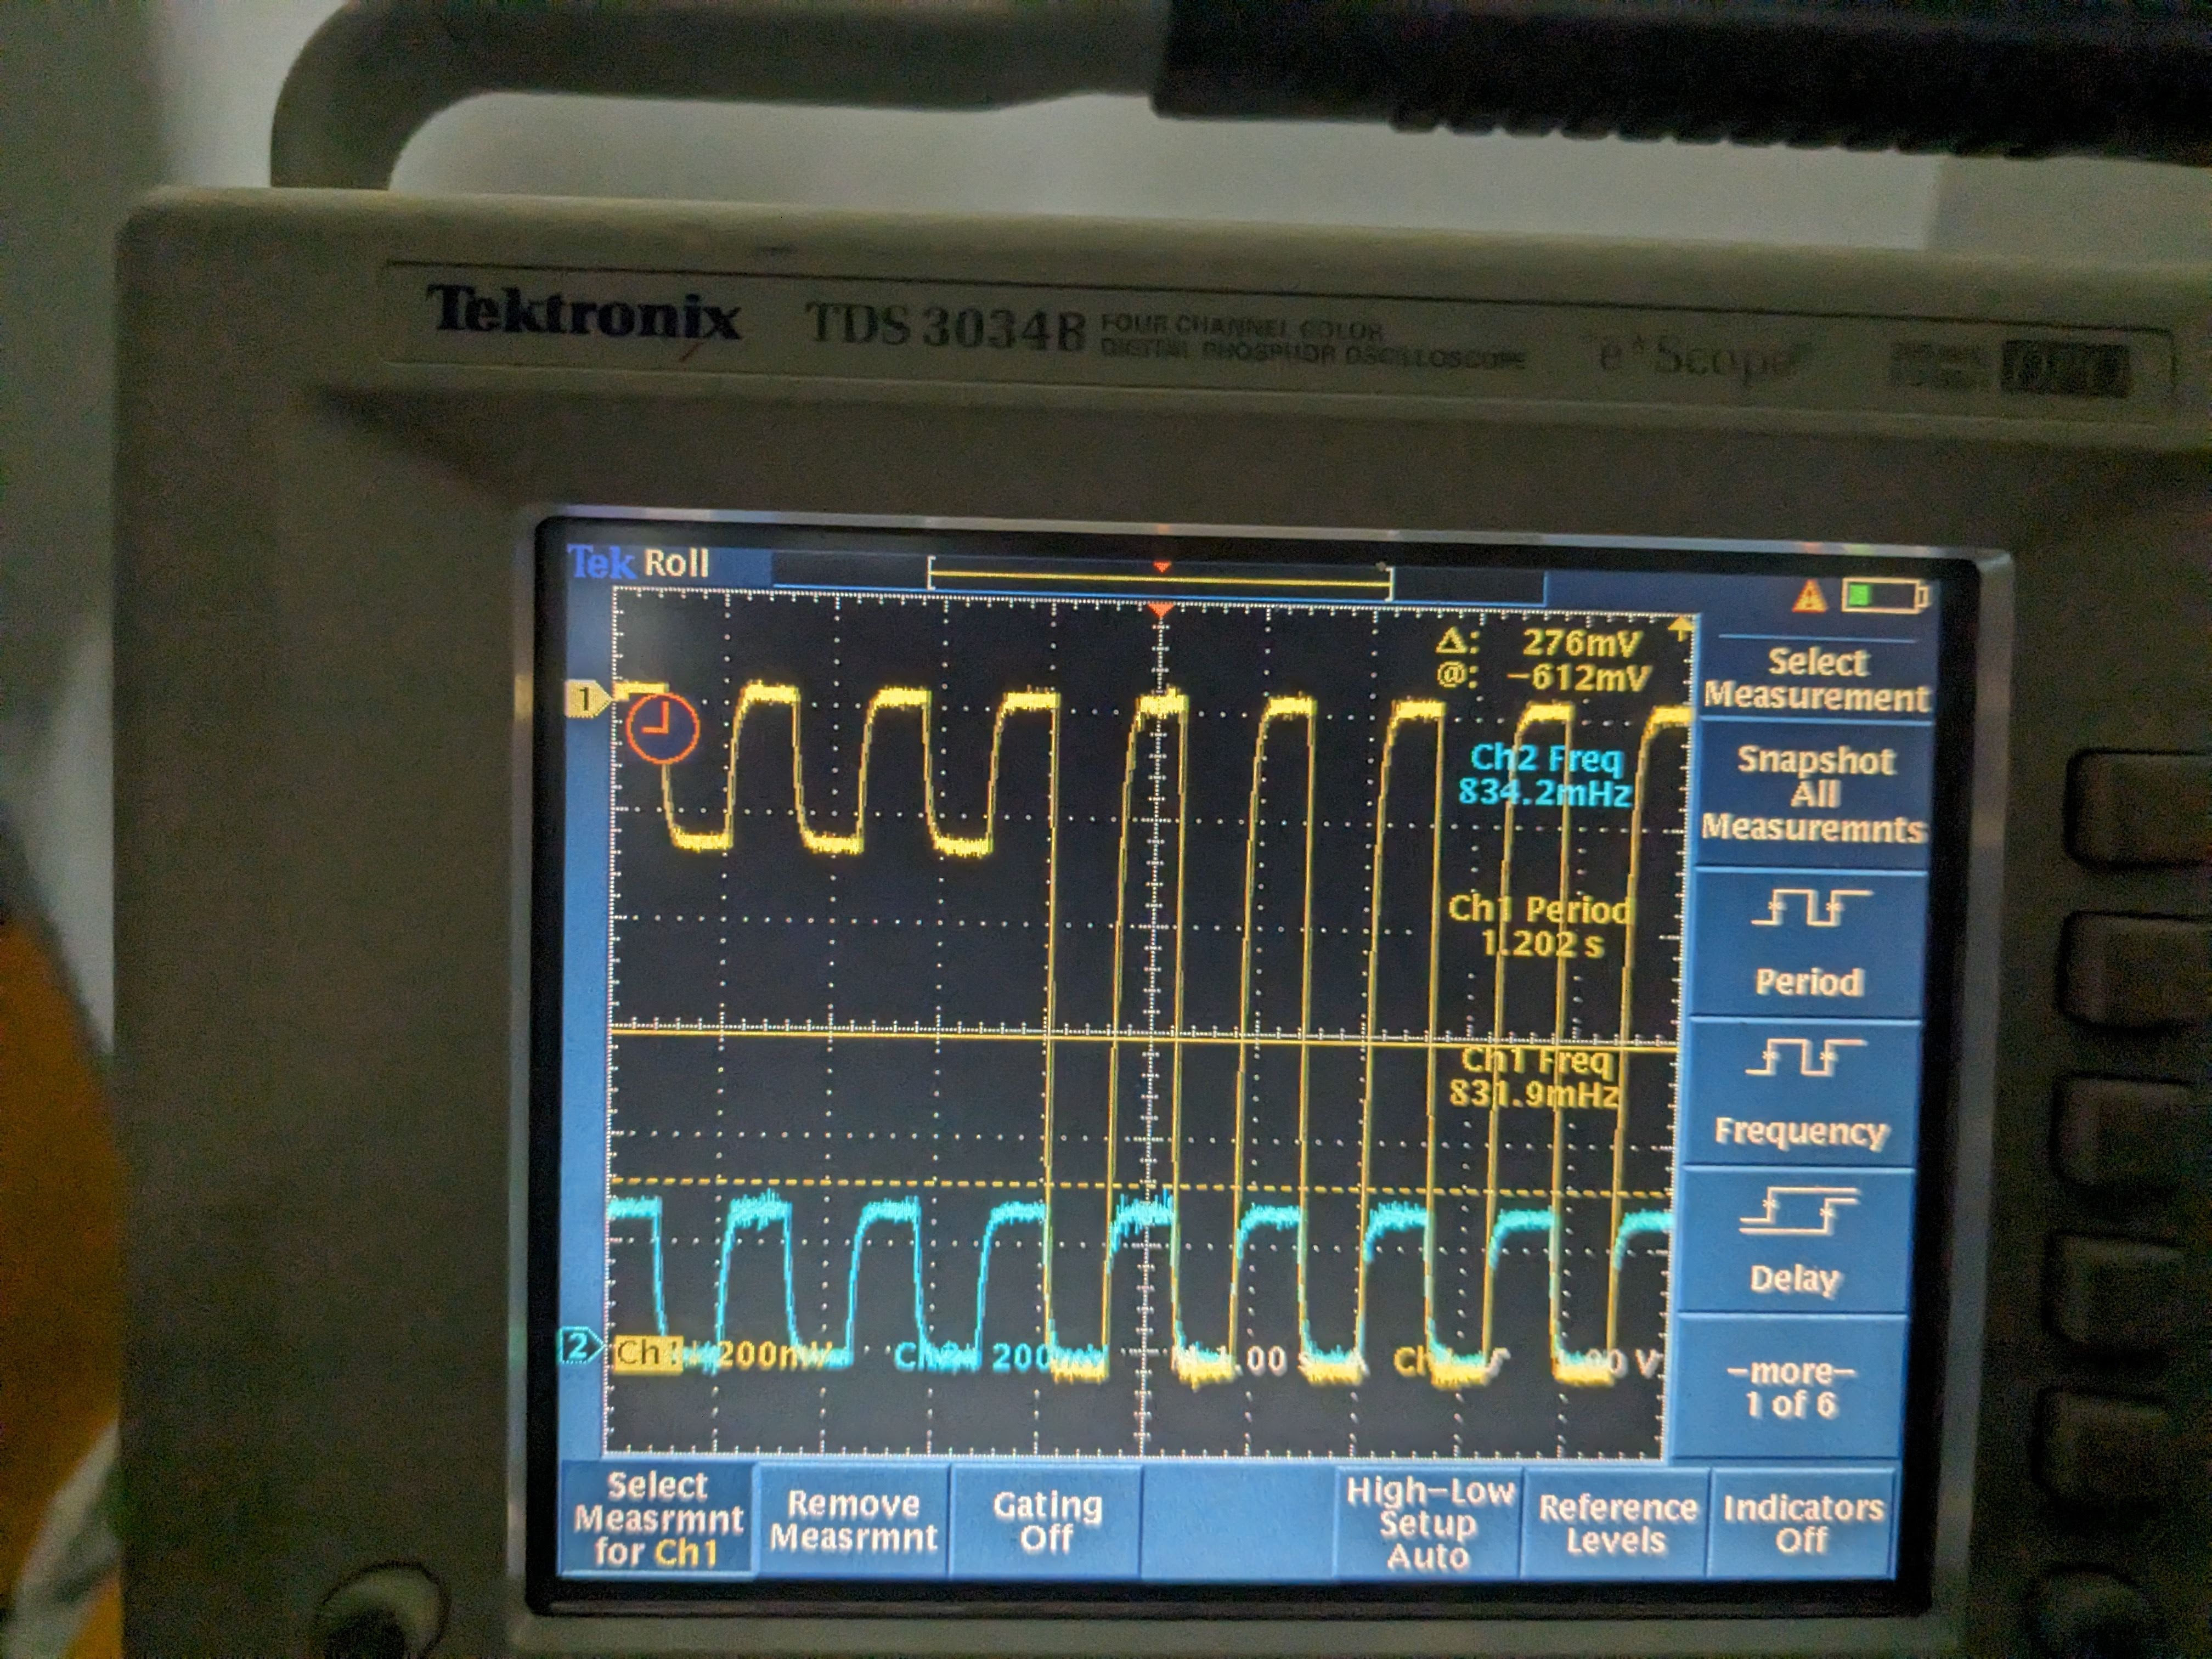
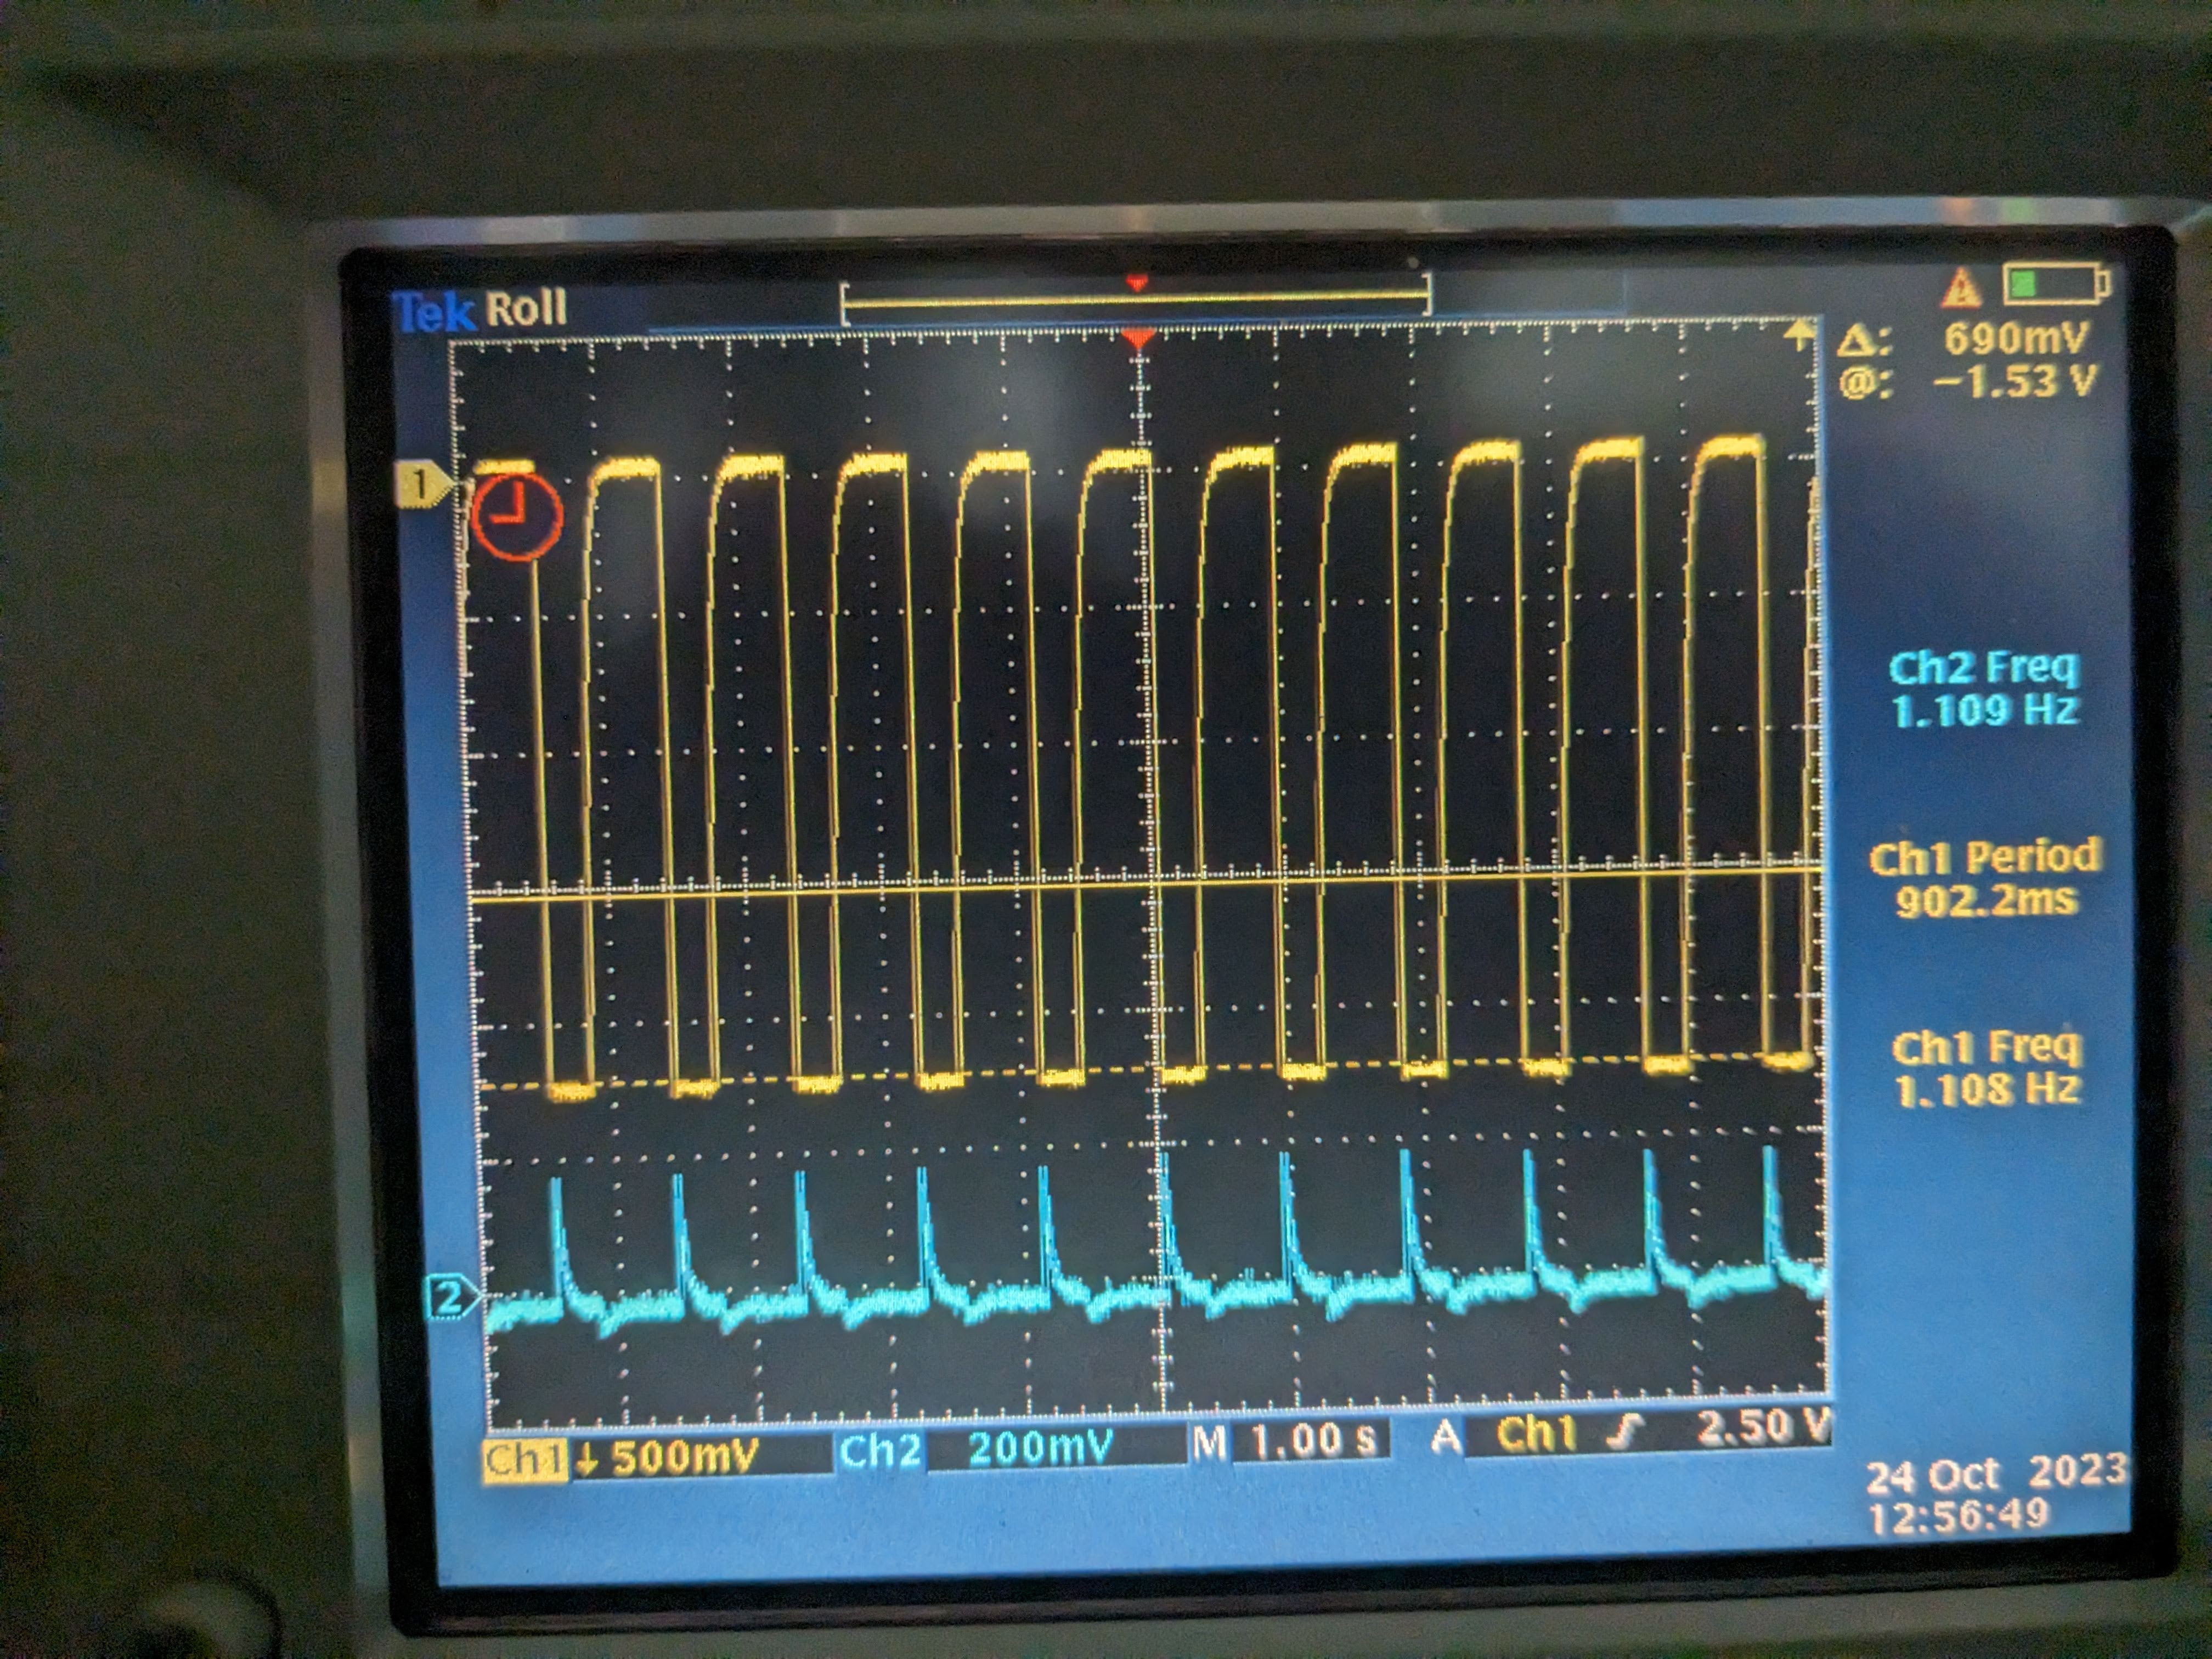
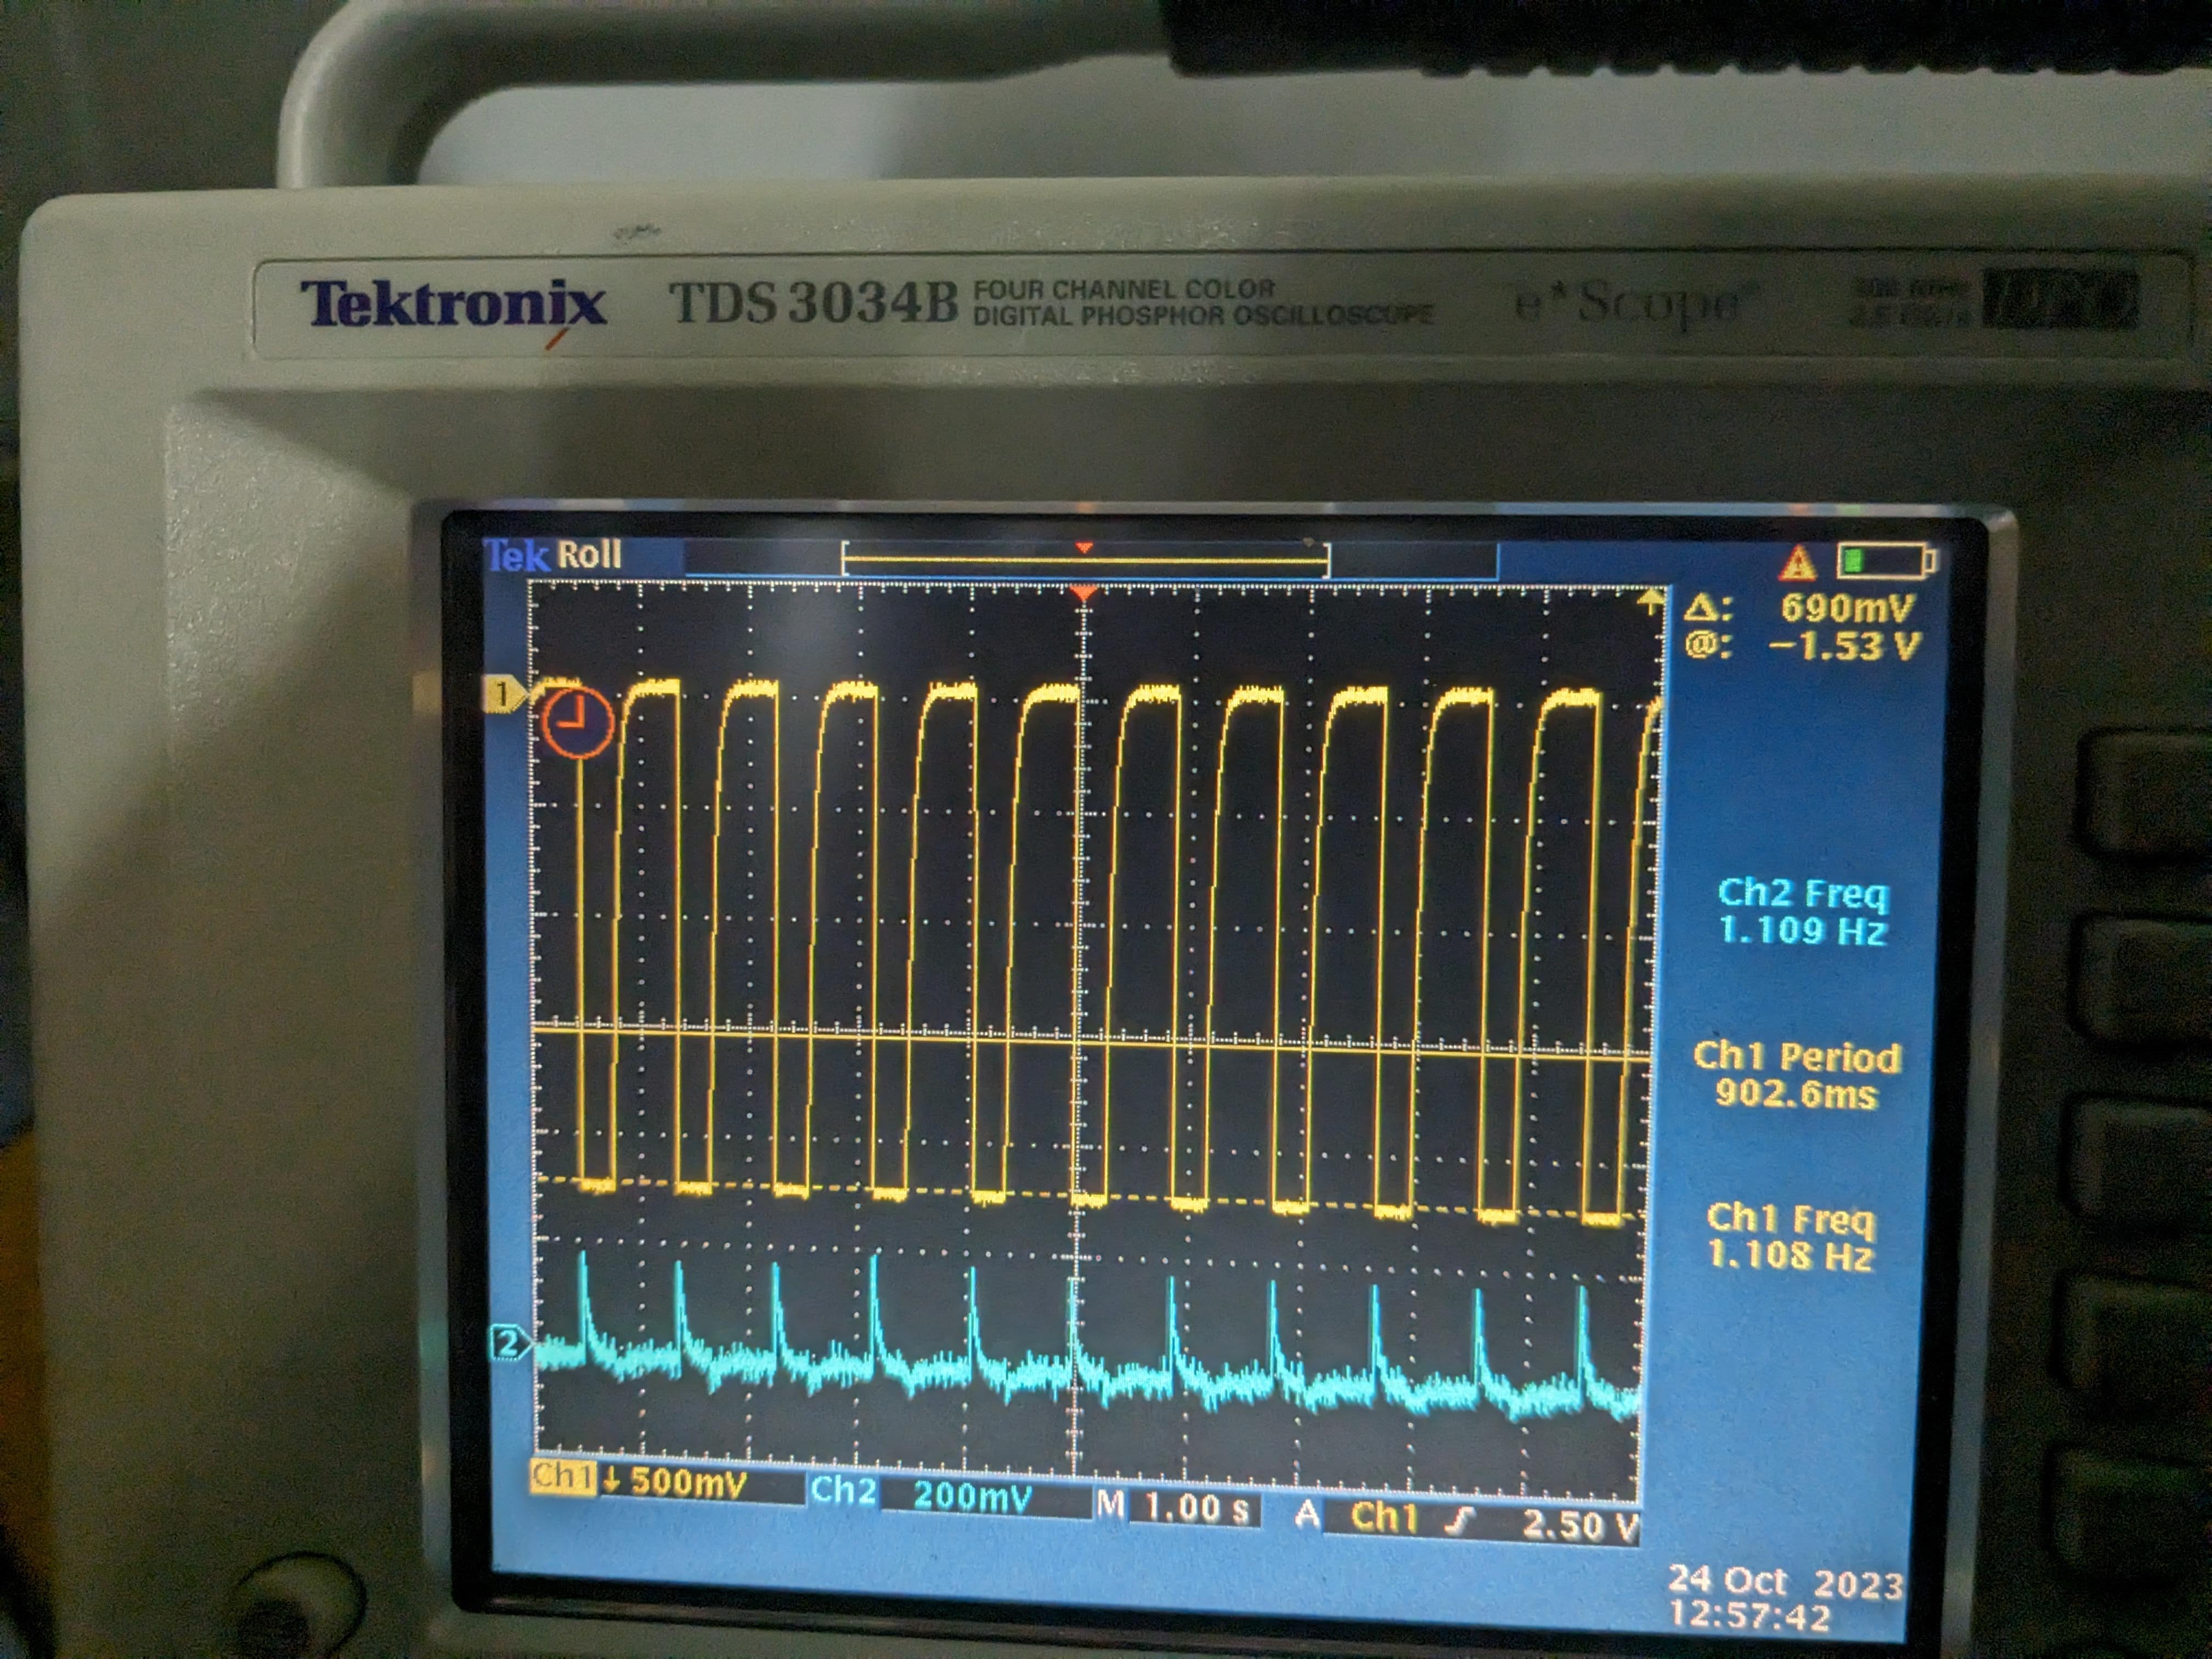
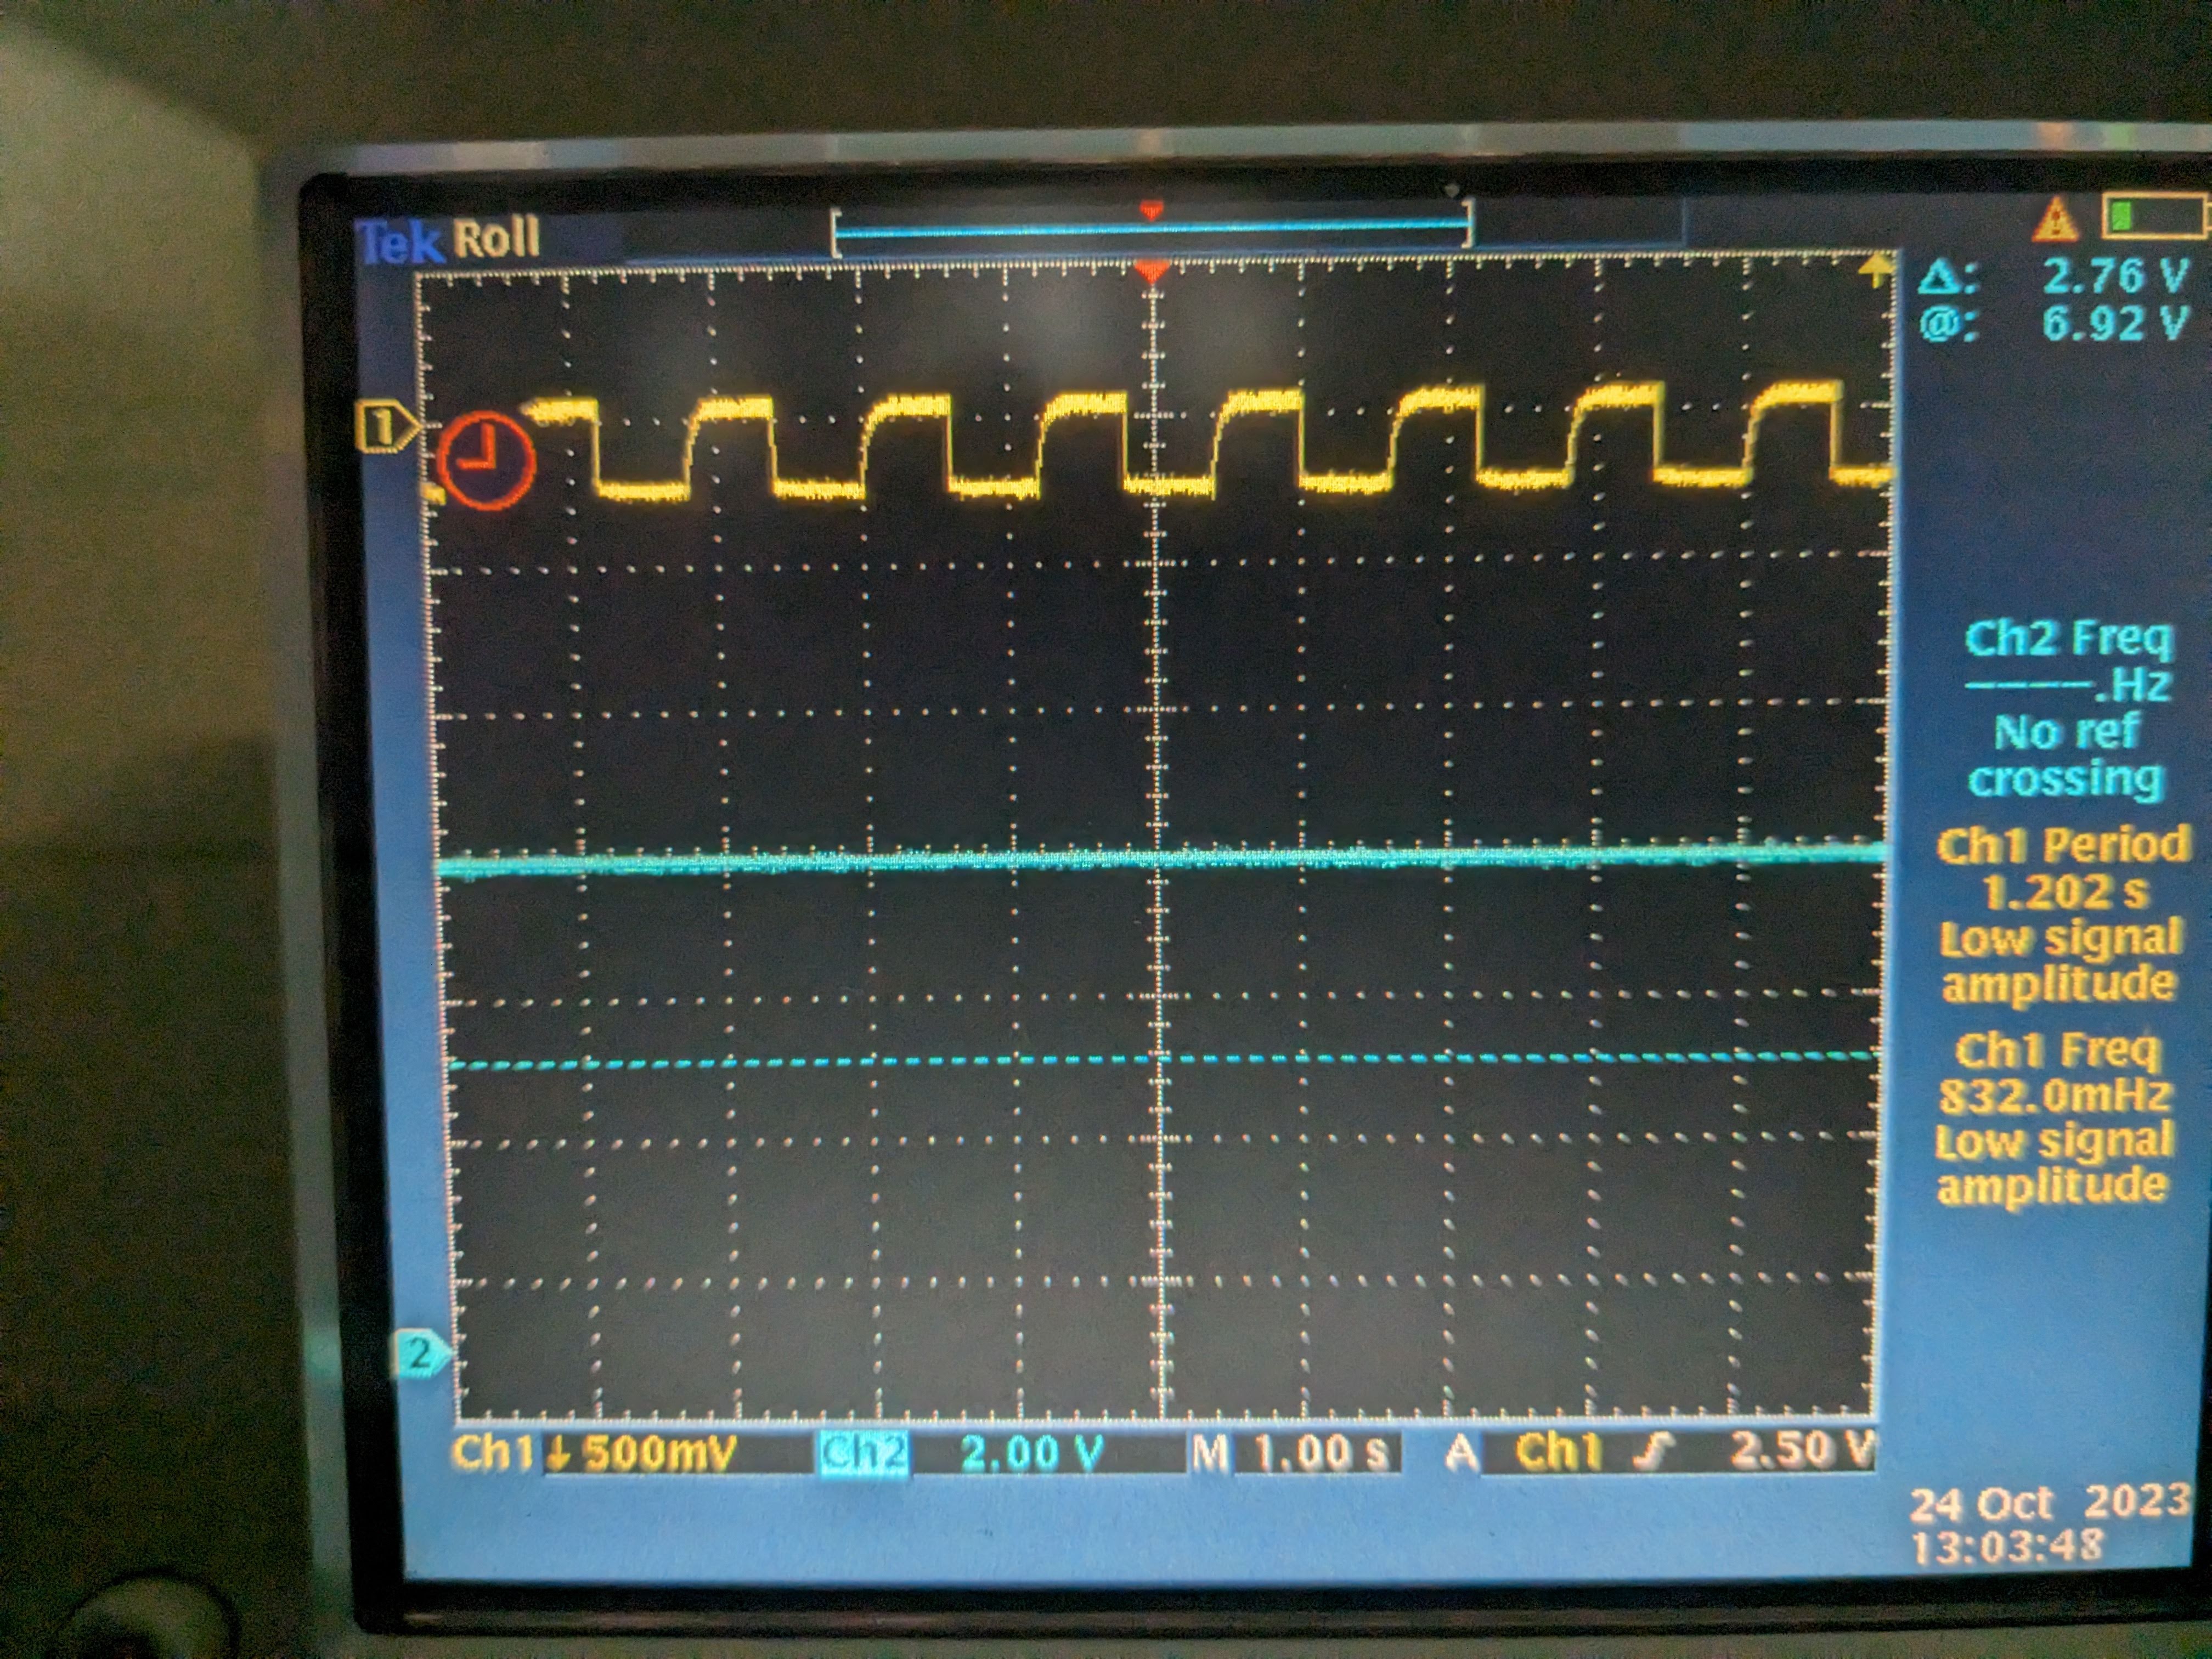
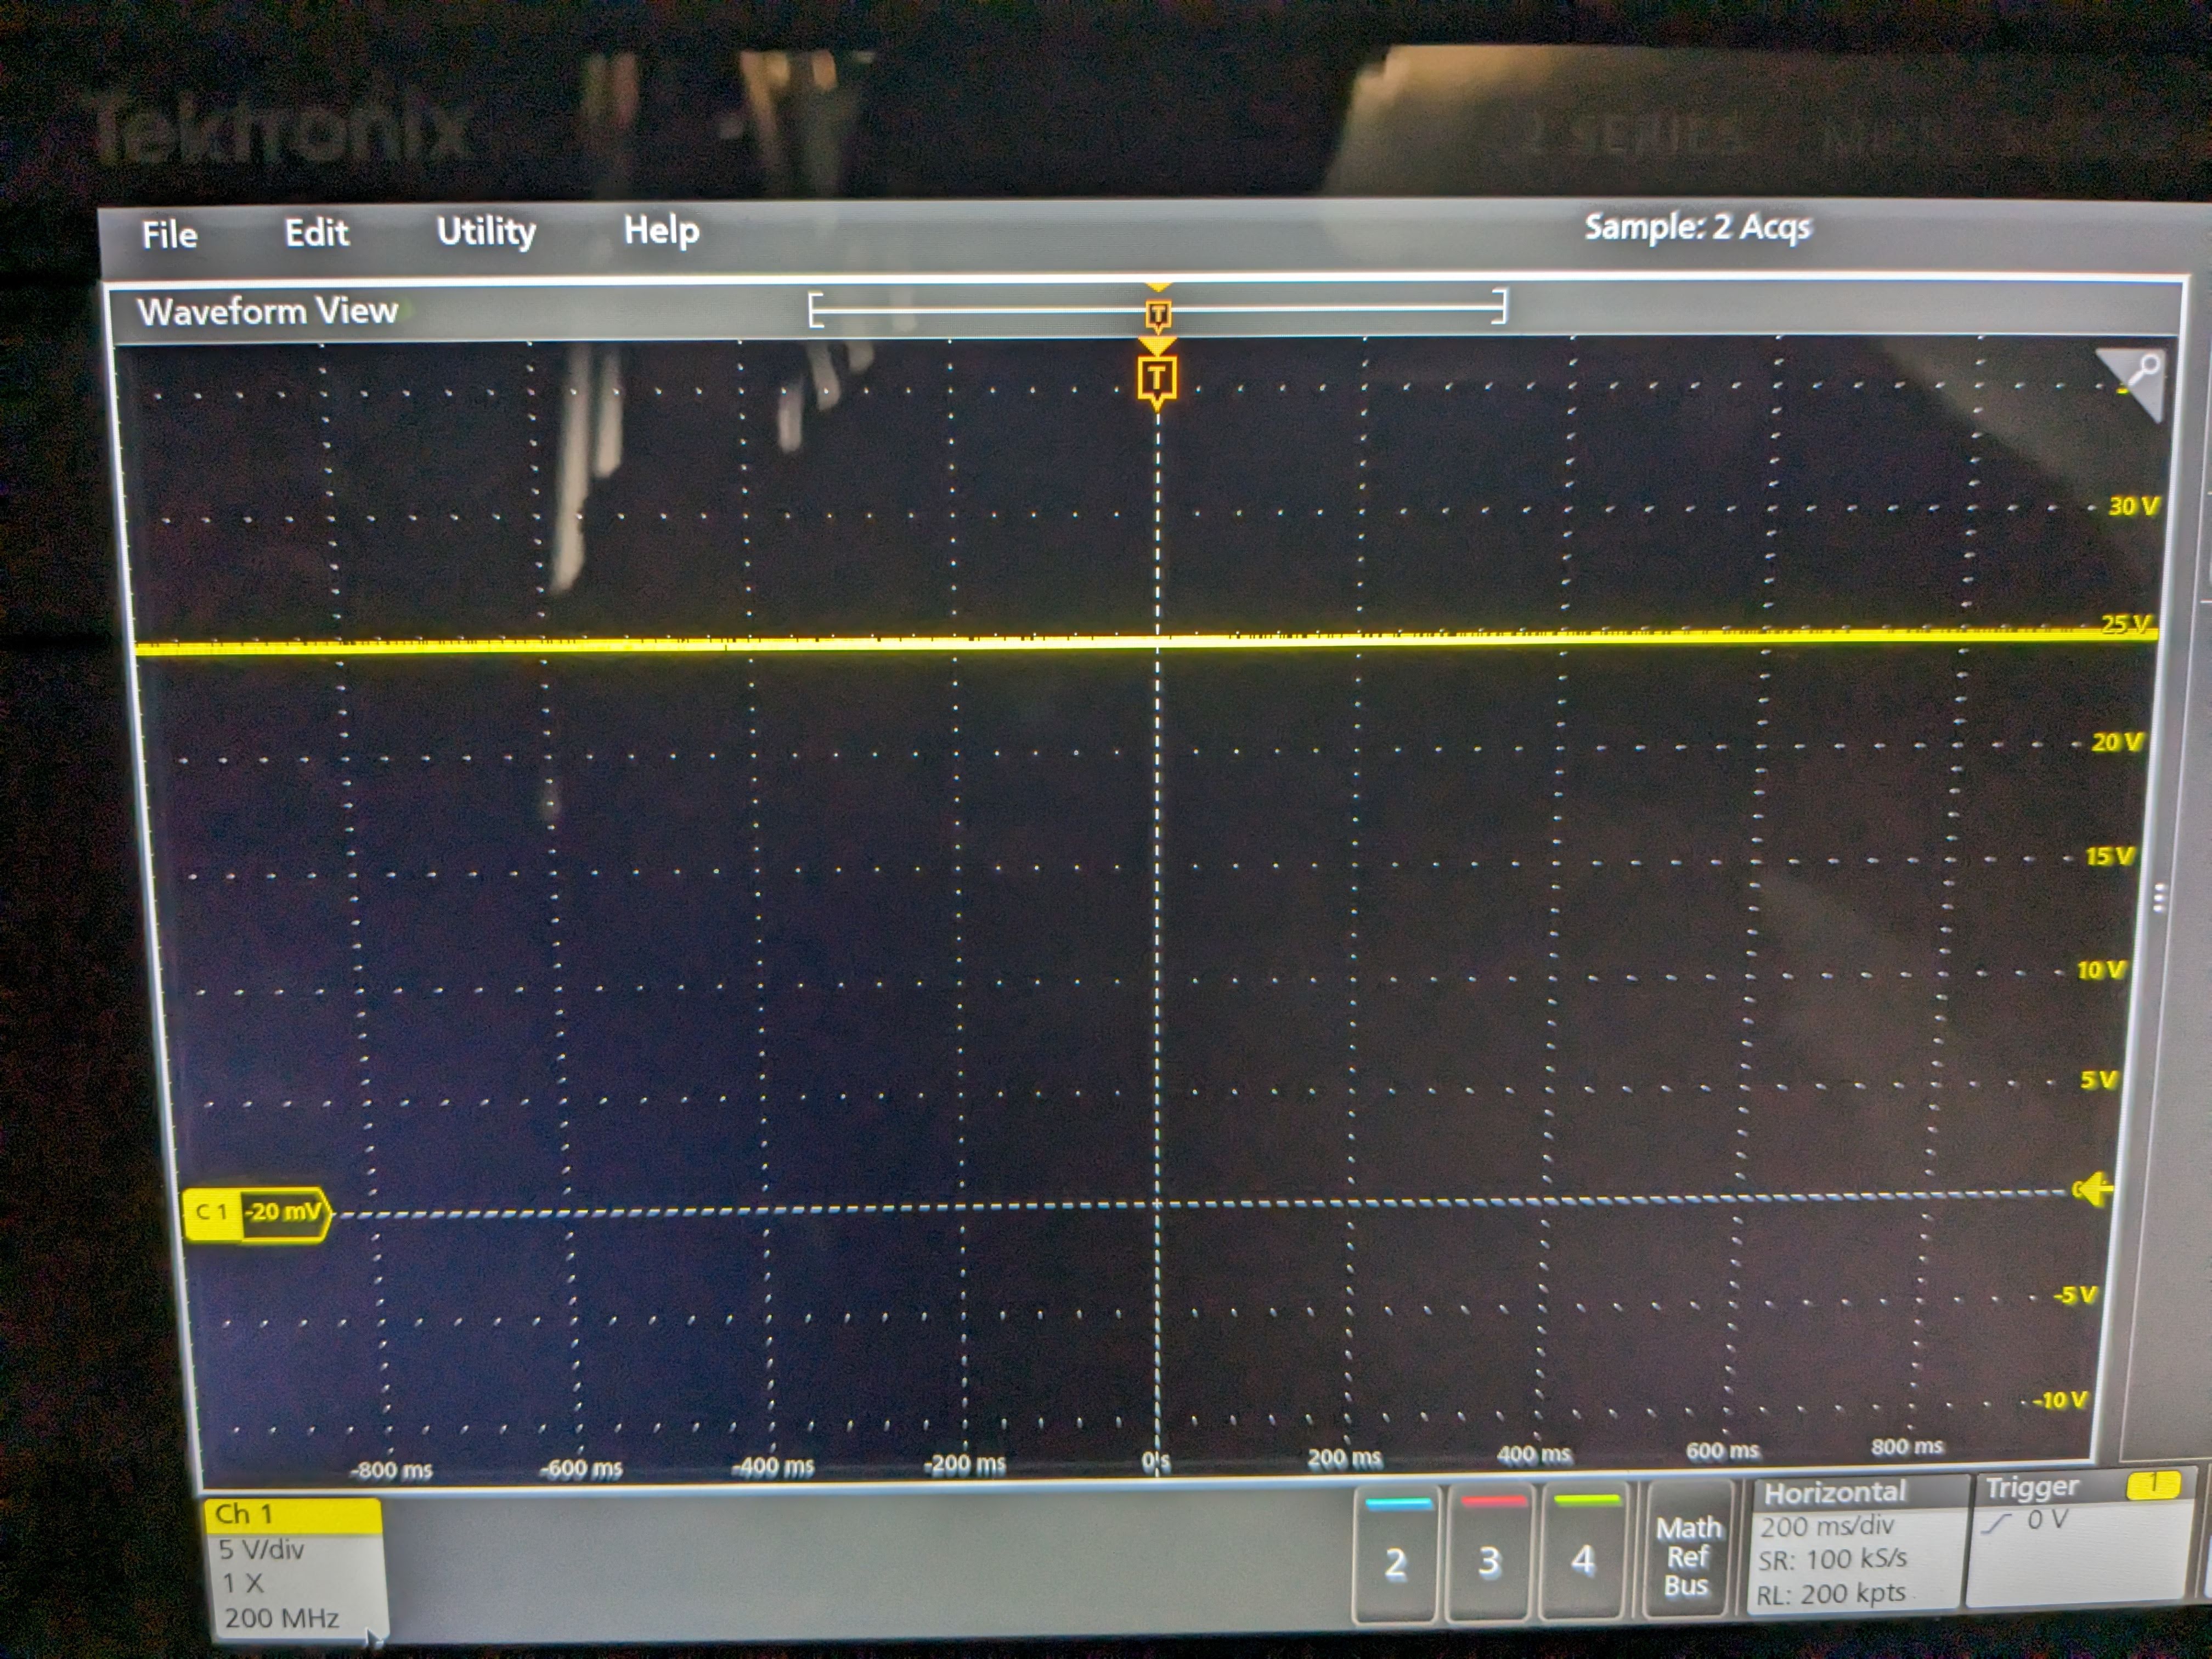
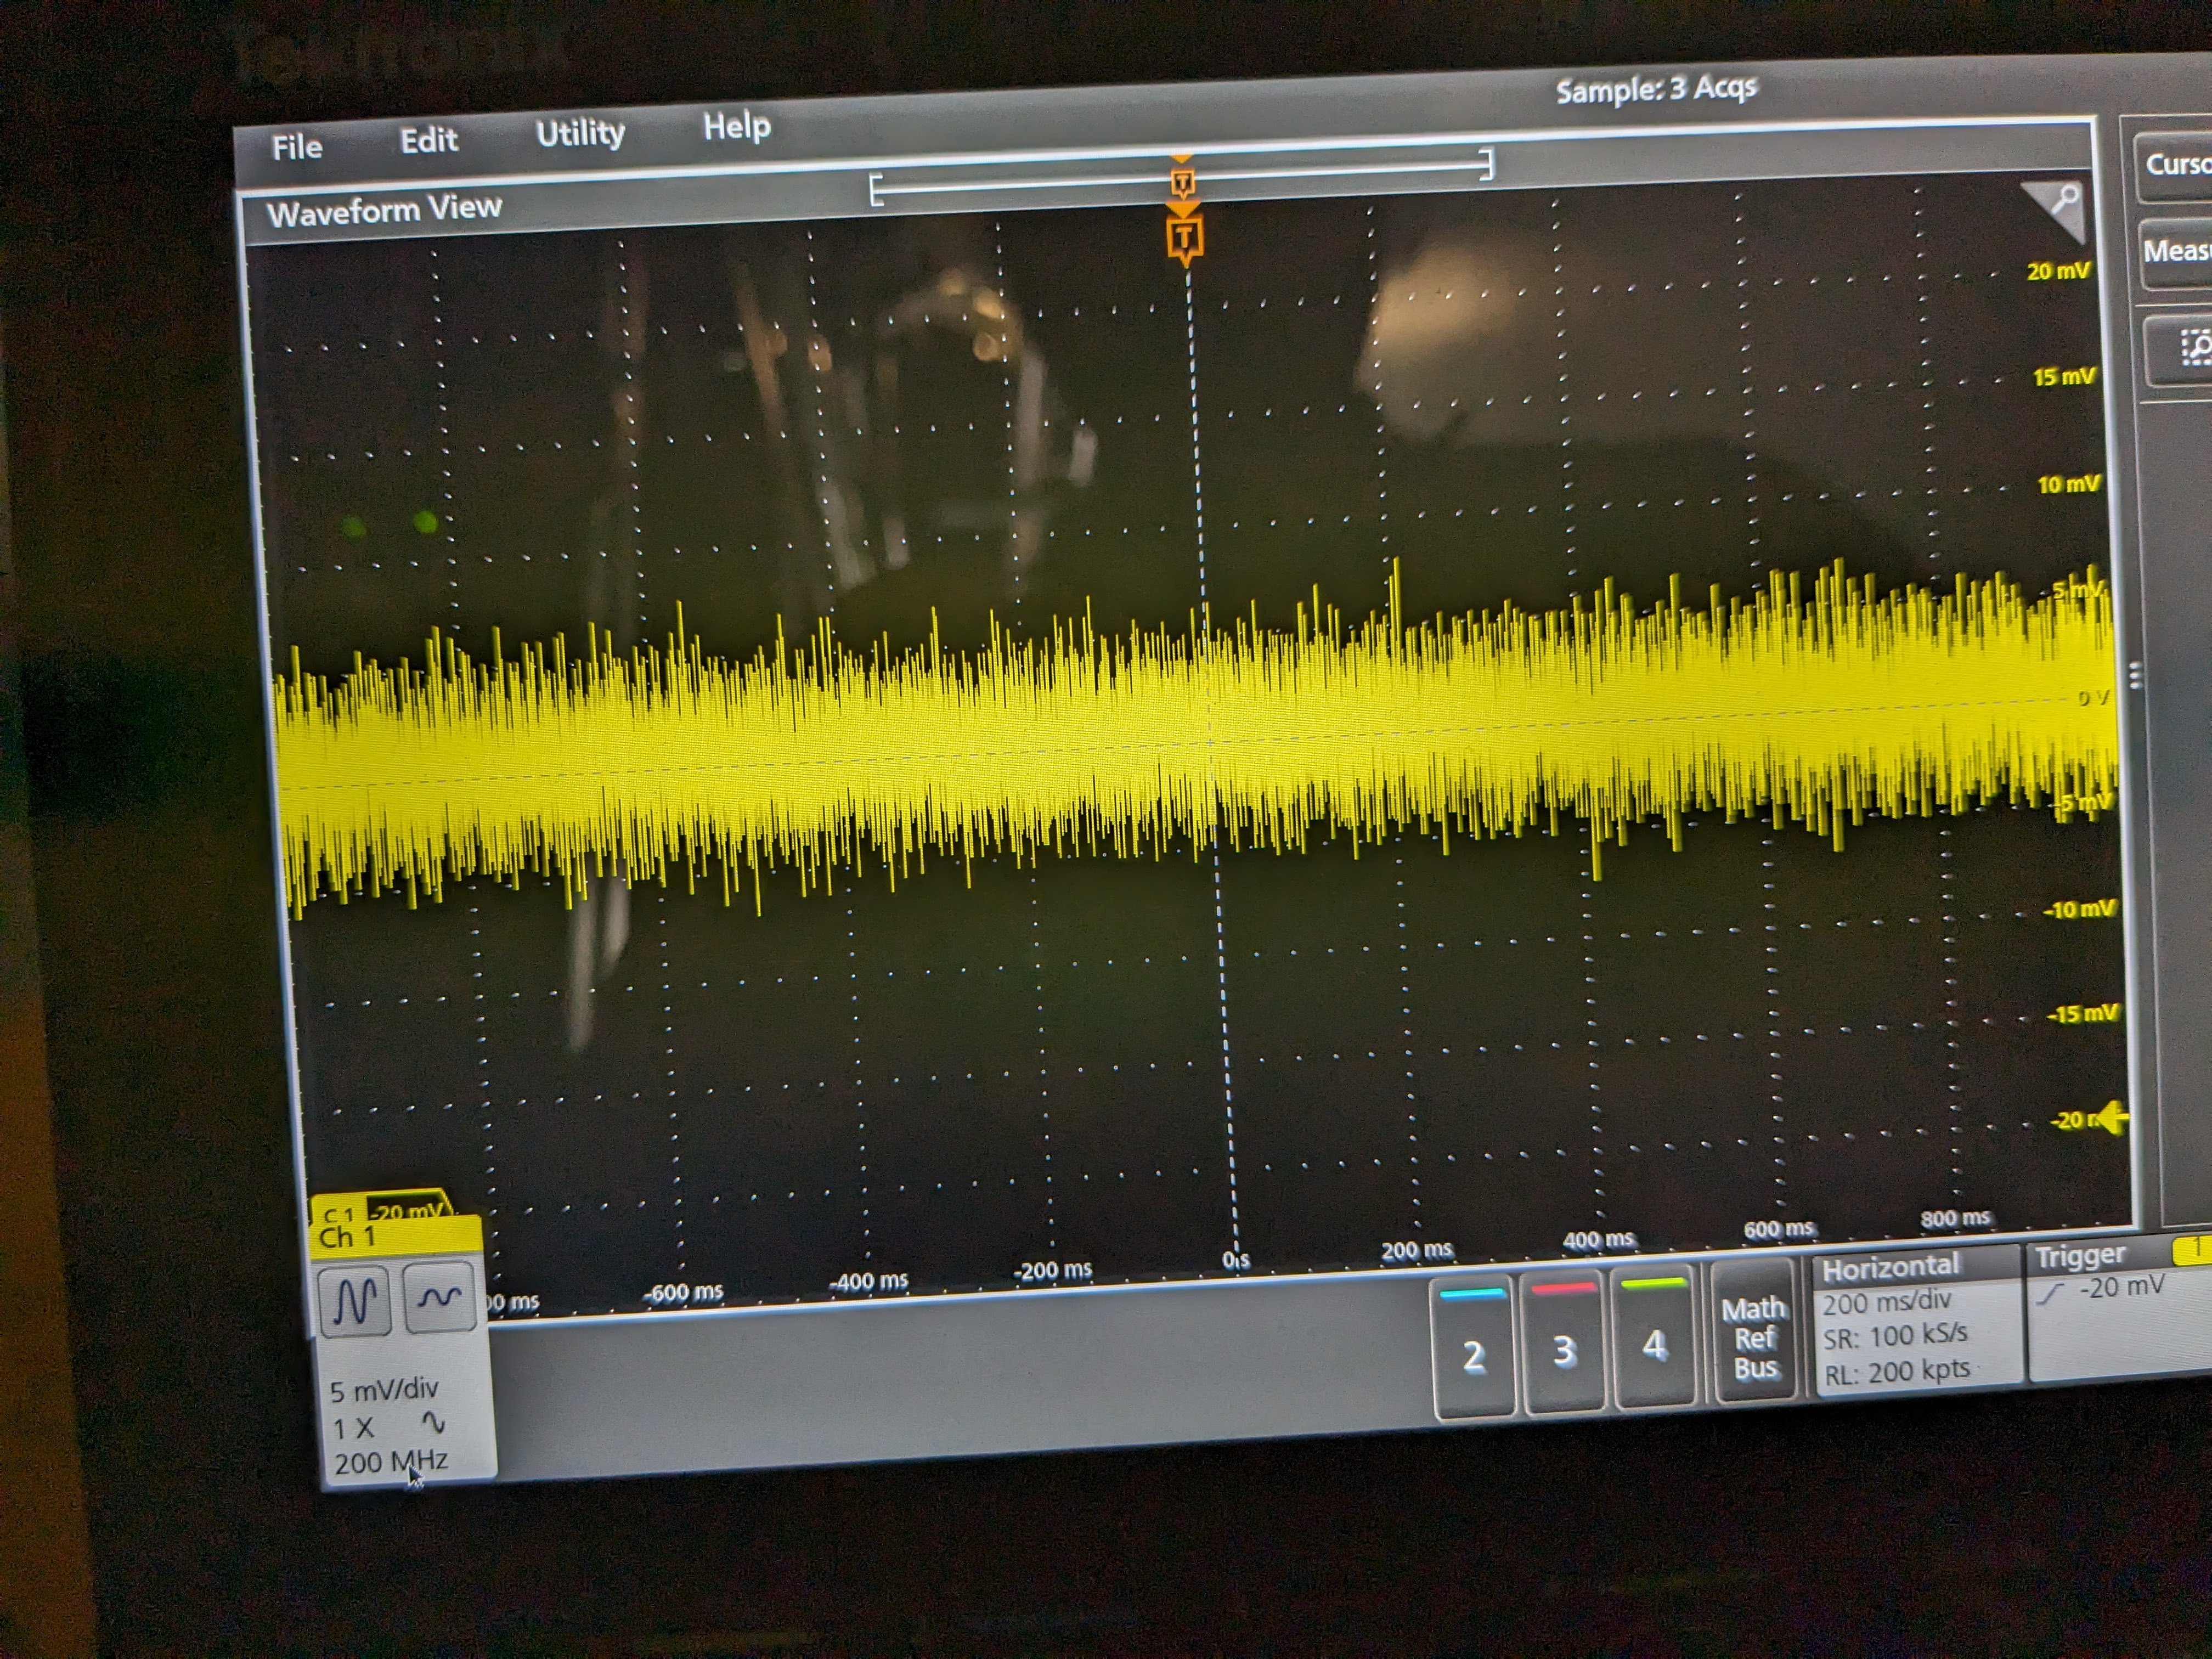
Turns out that all of these things share the same frequency but the voltage across thermistor pins was ~3 orders of magnitude larger than Beckhoff heater driver output pins (pin 9 and 19) (the latter were referenced from the driver board ground as it's common mode for both pins). I used a scope on battery and the thermistor voltage was like roughly 1Vpp 1.66Hz rectangular wave (1st pic). Yellow is the voltage across pin10 and 23 (across thermistor 1), blue is pin9 and 22 (thermistor 2) of the DB25 at the back of the driver chassis when the Beckhoff cable was still connected. Voltage difference seemed to have come from the temperature difference of the thermistors (I disconnected the Beckhoff cable and measured the thermistor 1 and 2 resistance incl. cables to be 7.41k and 4.08k, respectively). When I disconnected the cable from the chassis and just measured the pin10-23 and pin9-22 voltage coming from the cable (picture 2), they were both about 1.2V pp. This is supposed to be the source voltage for thermisters. The frequency slowed down by about a factor of 2 (832mHz) when the thermistors were disconnected.
For your convenience, below is a table of which pins are what (see e.g. E1100530 and D2000212). Note that thermistors themselves only have two pins, therefore supply and readback pins are bundled together in chamber as shown. Supply is presumably a reference voltage supplied through a reference resistor.
| which thermistor? | DB25 pin | Beckhoff | in chamber |
| 1 | 10 | Temperature Supply 1A+ | thermistor 1 pin 1 (10&12 bundled together in chamber) |
| 12 | Temperature Readback 1A+ | ||
| 23 | Temperature Supply 1A- | thermistor 1 pin 2 (23&25 bundled together in chamber) |
|
| 25 | Temperature Readback 1A- | ||
| 2 | 9 | Temperature Supply 2A+ | thermistor 2 pin 1 (9&11 bundled together in chamber) |
| 11 | Temperature Readback 2A+ | ||
| 22 | Temperature Supply 2A- | thermistor 2 pin 2 (22&24 bundled together in chamber) |
|
| 24 | Temperature Readback 2A- |
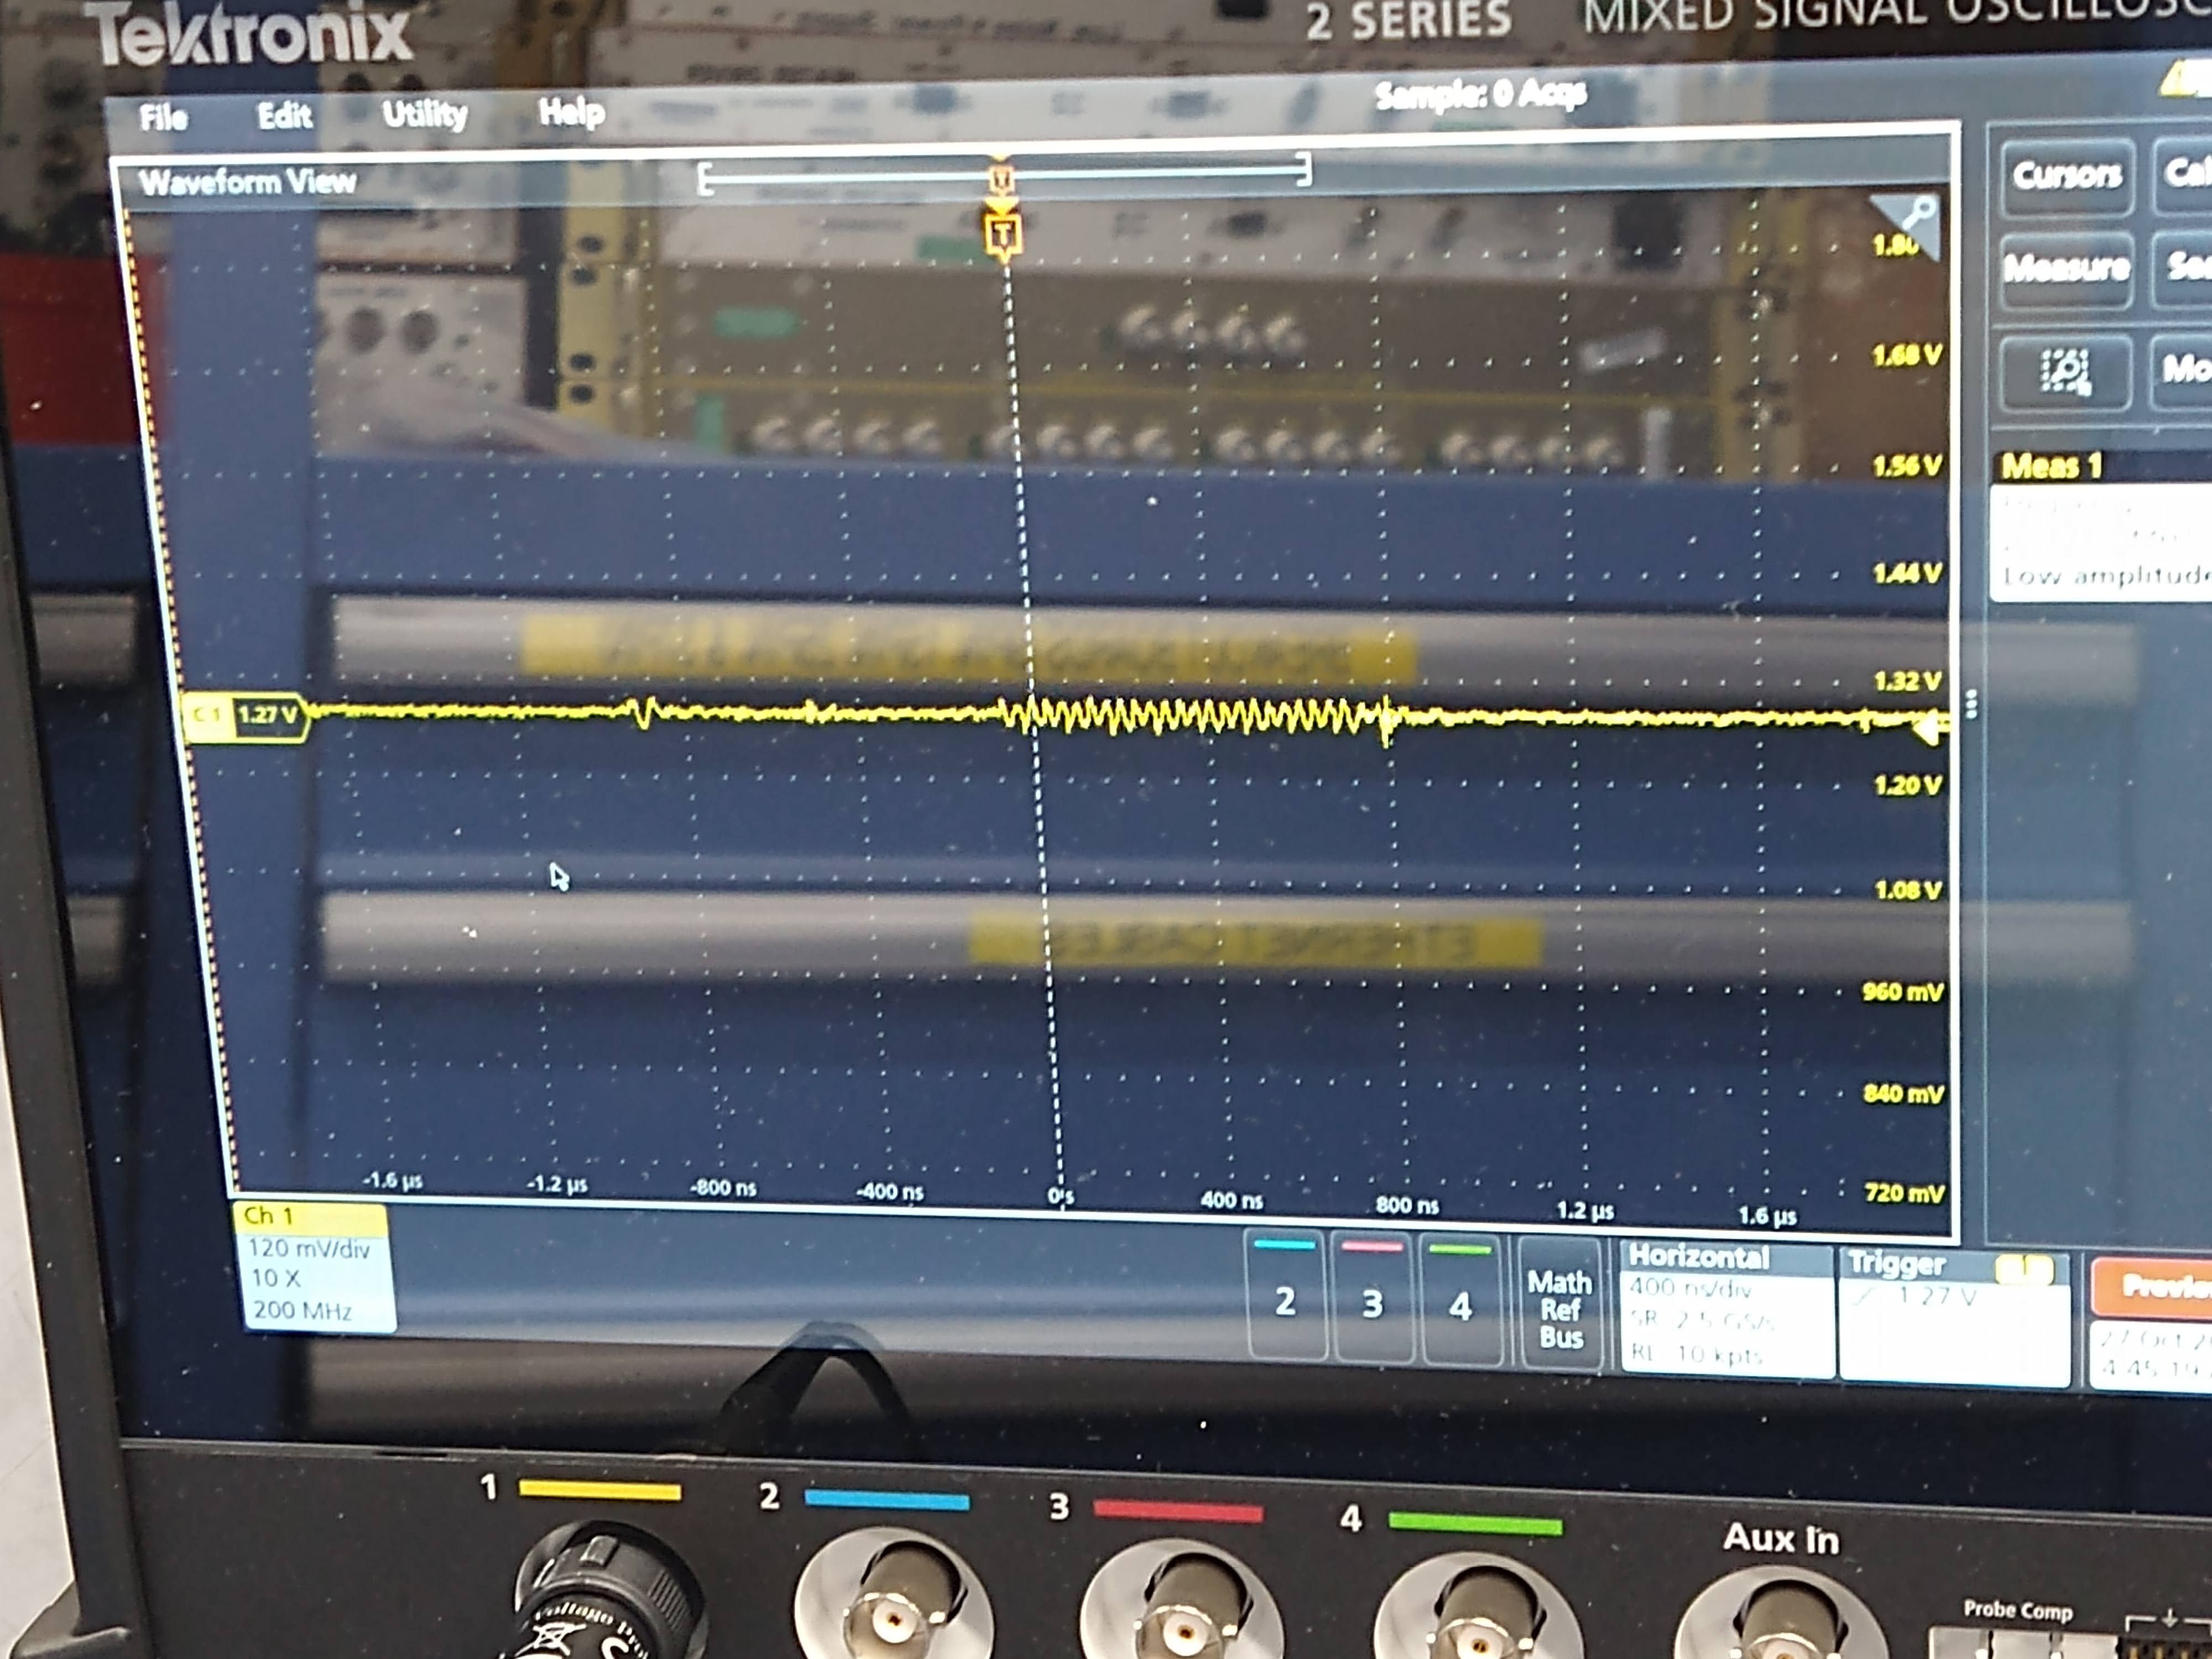
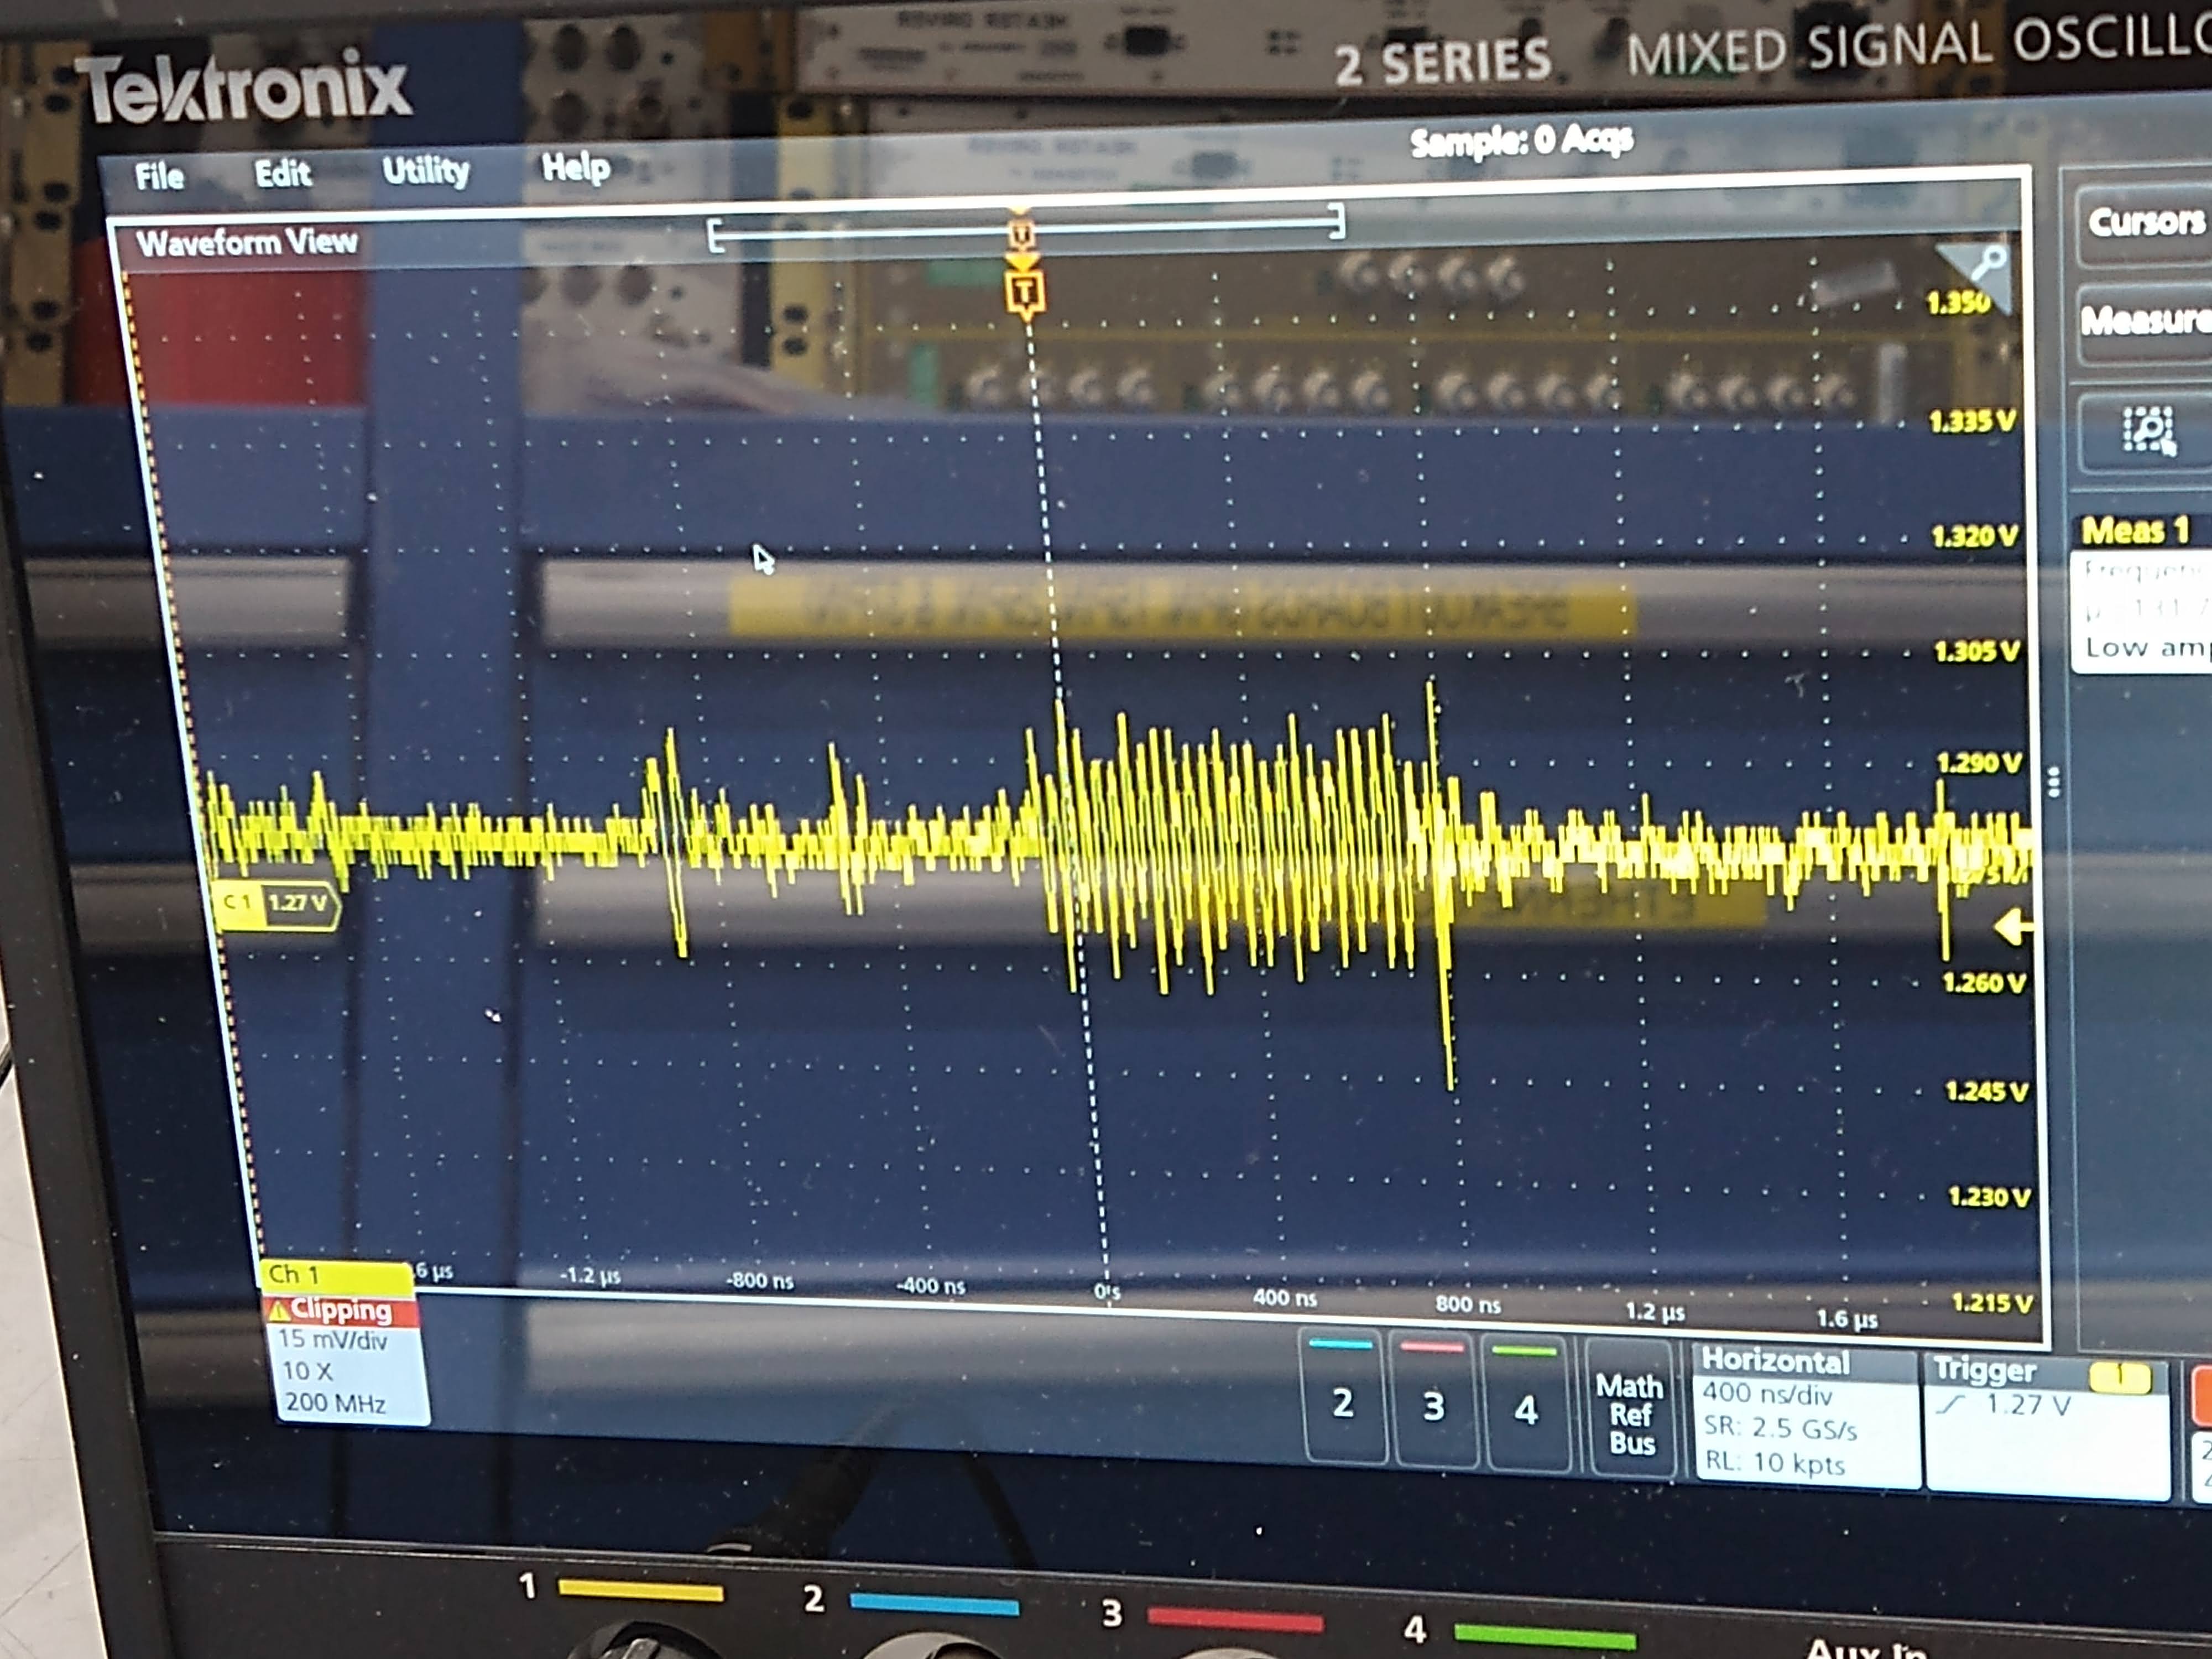
Went to the CER, disconnected the cable from the back of the Beckhoff chassis and did the same measurement. Frequency didn't change but the amplitude was much smaller (~280mVpp instead of 1.2Vpp) for a while, but suddenly the amplitude of the thermistor 1 supply changed back to 1.2V (pic 3). Nuts. When the beckhoff cable was reconnected (and the connection to in-chamber thermistor was restored) the frequency went back to 1.66Hz (picture 4).
Picture 5 shows pin 10-23 (thermistor 1 supply) and pin12-25 (thermistor 1 readback, which is not connected to anything). Picture 6 is the same thing but for the unused Beckhoff unit for the second T-SAMS. It's strange that the same thing is happening in two independent units. Picture 7 is the thermistor 1 supply and pin 6-19 (voltage output for the heater driver). It really seems that this is a problem of the supply voltage.
I checked the 24V power strip for the Beckhoff chassis but it was good (pic 8 and 9).
Fil and Fernando set up EL3692, which is the Beckhoff unit used for Thermistors. They didn't observe this oscillation behavior.
I wanted to do some injections into thermistors to see how this couples to DARM but didn't have time.
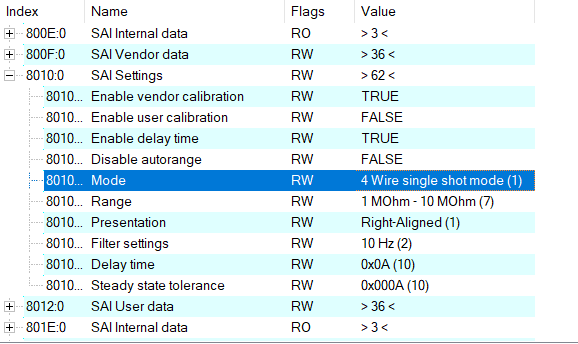
Well, this seems to be a feature! The EL3692 terminal has 2 measurement inputs for resistance but only one ADC and current source. In alternating mode it switches between the 2 channels continuously. From the scope traces, the measurement time per channel looks like about ~400 ms. This is consistent with the data sheet. We expect about ~0.16 mA of current in the range between 10 Ω and 10 kΩ.
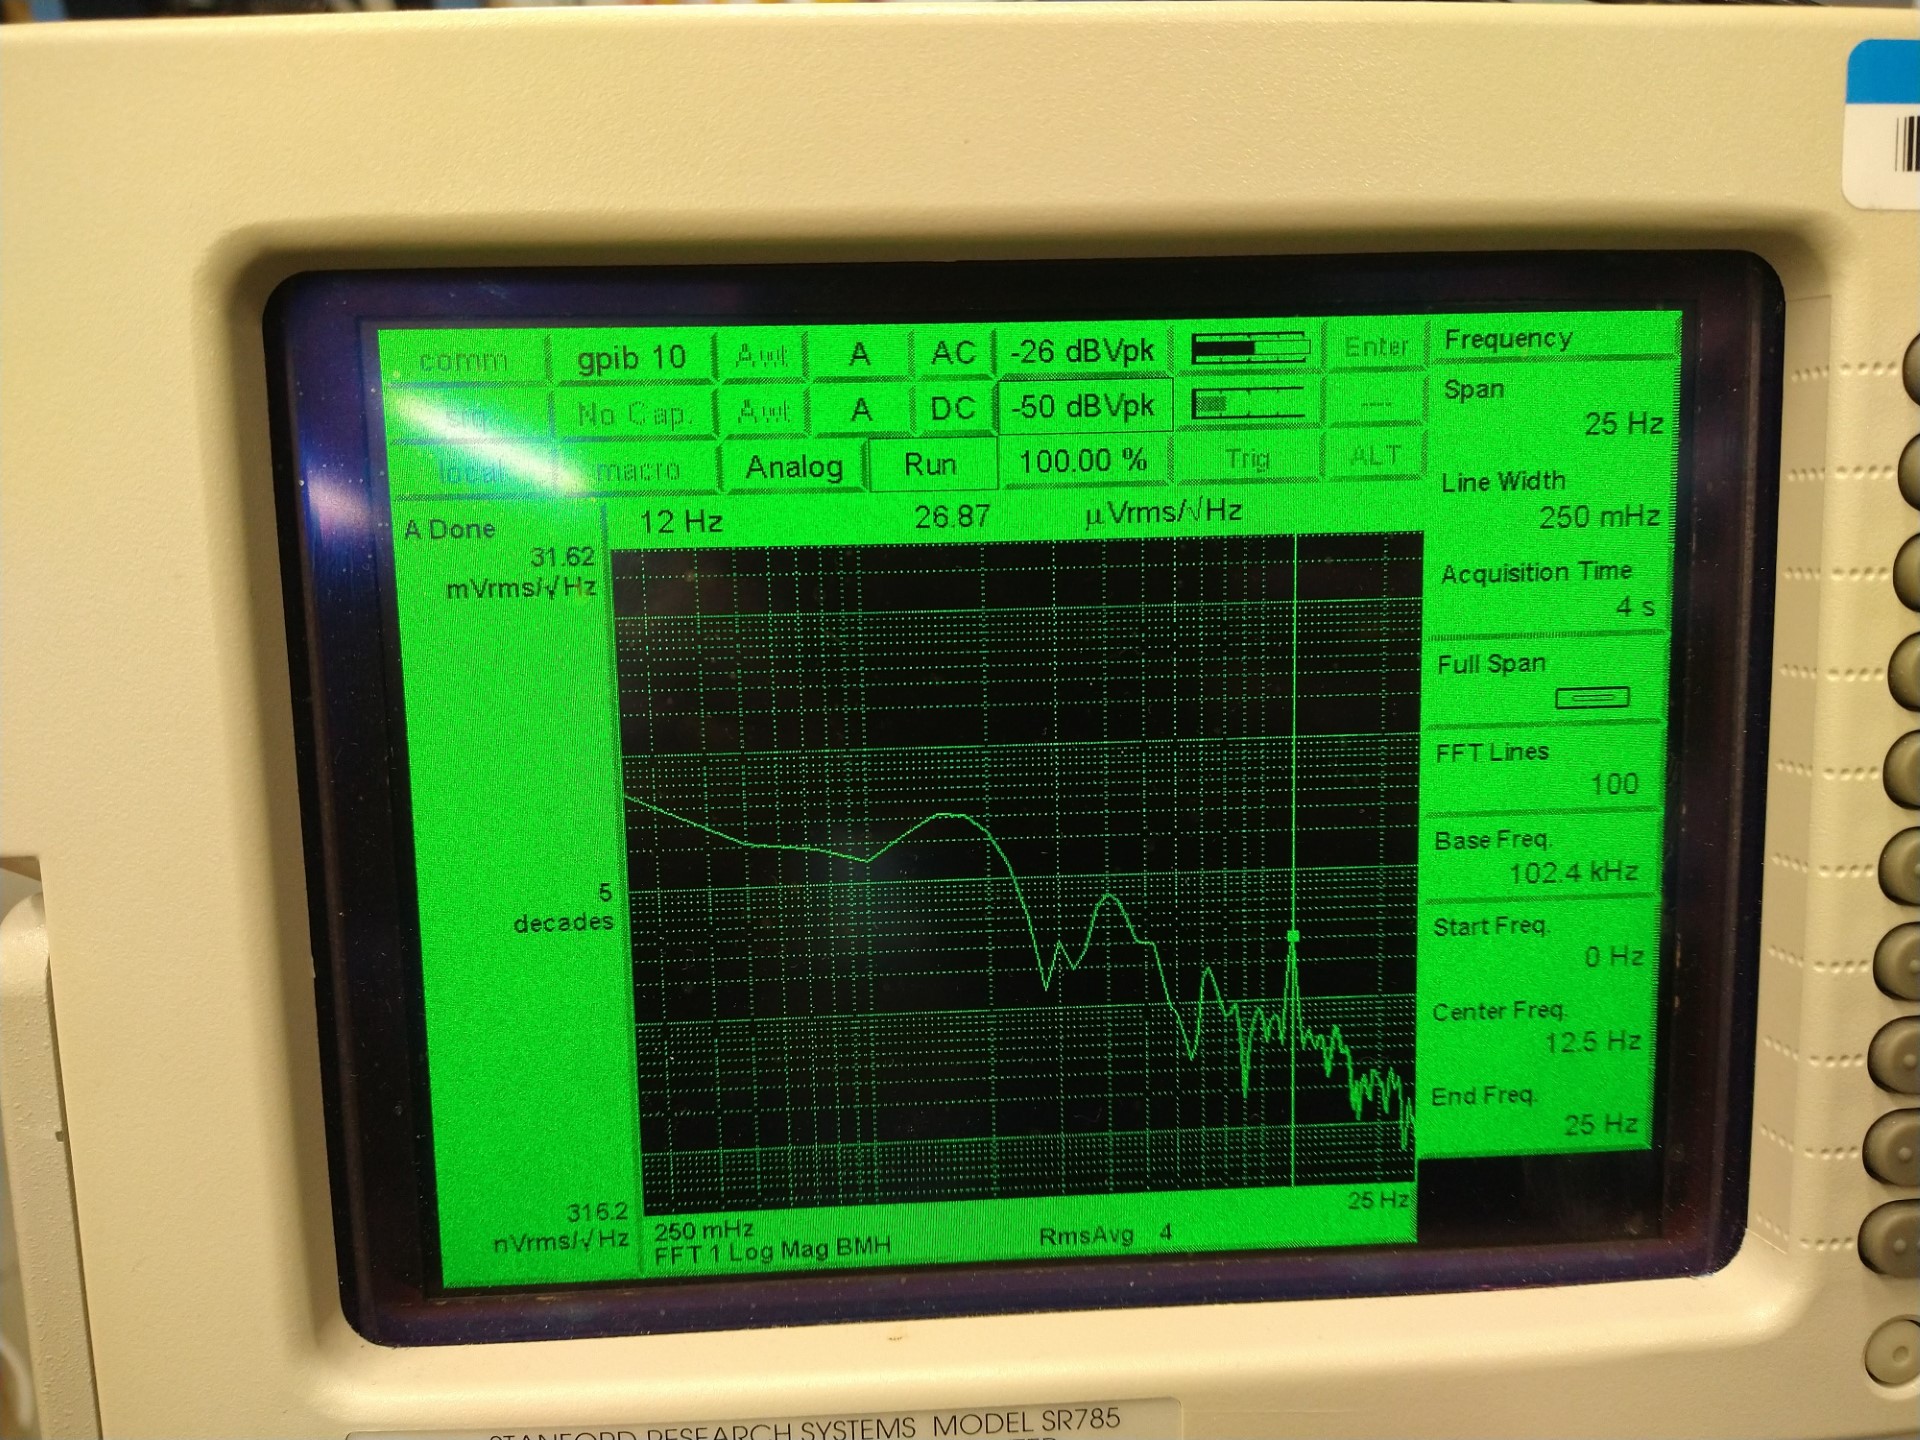
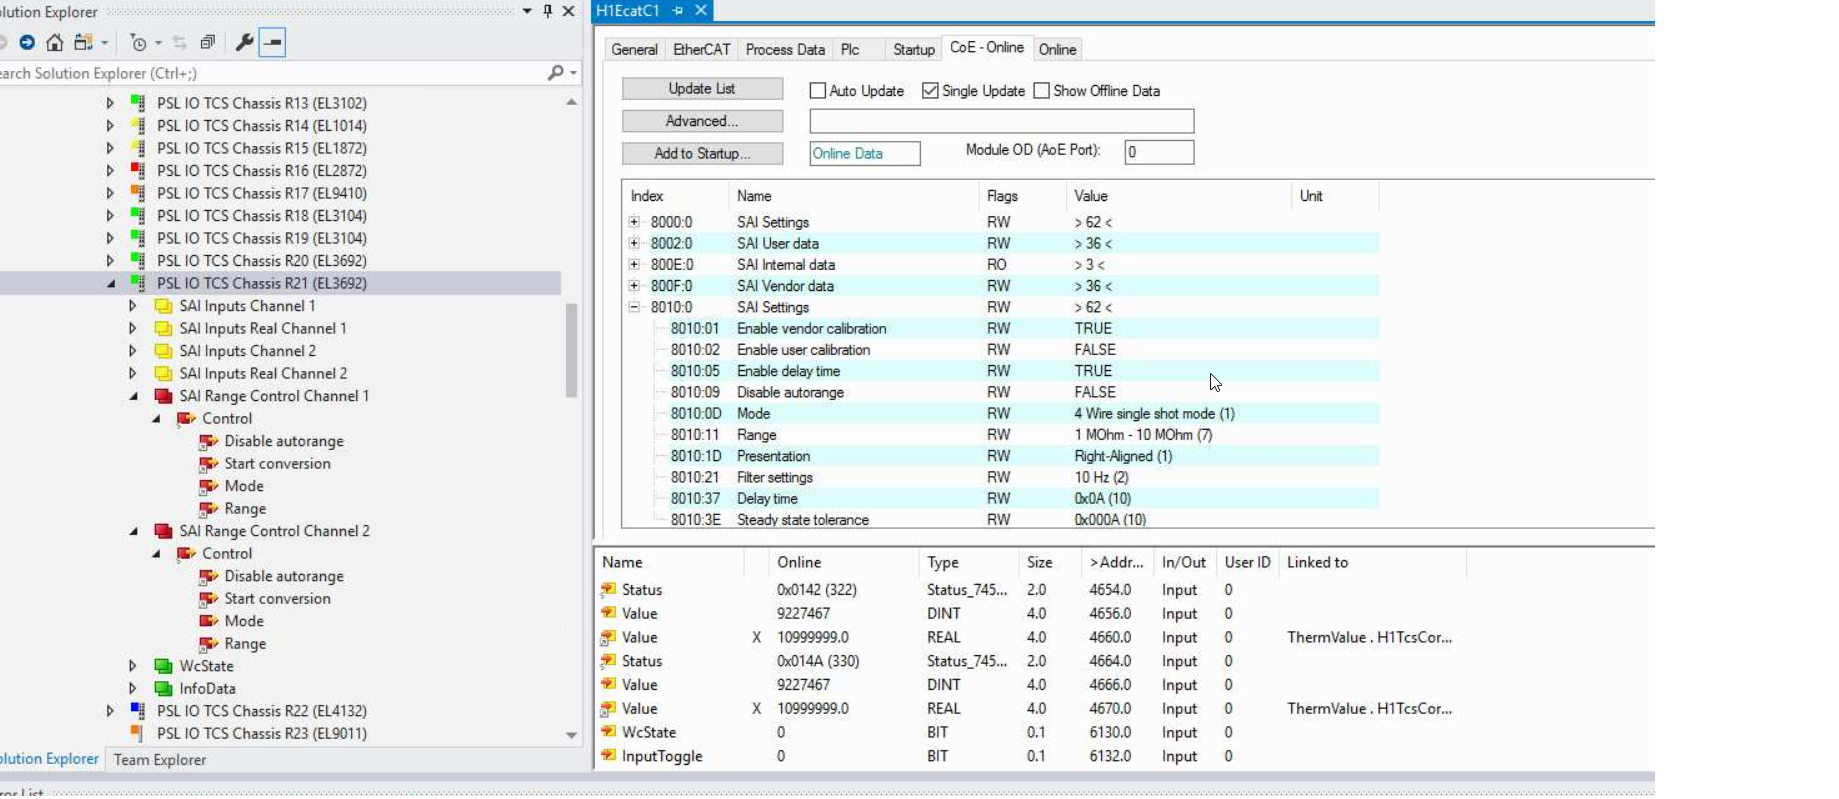
Fil, Marc, Keita, Daniel, Fernando Fil and I set a test bank in the lab and verified the square pulses found are part of the features of the EL3692 terminal when both channel reading is set. Then we implemented a configuration using a continuous reading over the channel 1 and one shot reading over the channel 2 (under request by a raising edge on the Start Conversion input in the module, that will be never used). Finally the scopes show the continuous signal in the channel 1 with some minor noise component that is still in analysis (basically 60Hz and 12Hz) however this virtually solves the main problem with the square pulses. One ECR should be open to double the quantity of EL3692 in the places where reading in both channels are necessary since just one channel provides continuous reading at this point. Note: the autorange feature was left intact so the new configuration will not cause any limitation in the resistor range to be measured and also will keep the same PDO to not break the Epics configuration. Attached: scopes and the EL3692, configuration applied to the EL3962 and spectral analysis for the noise signals.
WP 11501 Daniel Keita Fernando Today we configured the one channel reading on the two Beckhoff EL3692 modules for the PSL IO Chassis. After restarting the system Keita Daniel and I were to the rack to scope the thermistor channels we verified the absence of the square pulses reported initially. Finally the module R20 CH2 was rewired to R21 CH1 and configured in the system accordingly. Attached the picture including the R20 and R21 EL3692 modules for reference.
After having a solution for the issue duplicating the number of EL3692 modules, and ECR and FRS ticket have been created: ECR: https://dcc.ligo.org/E2300408-v1 FRS ticket: https://services1.ligo-la.caltech.edu/FRS/show_bug.cgi?id=29563
Daniel, Fernando
As part of the WP11506 a new configuration was loaded into the Beckhoff system which includes the 1-channel continuos reading for the EL3692 terminals. The change included the rewiring in the TCS Corner EtherCAT chassis TSAMS consisting of connecting the second channel in the EL3692 (R20) to the first channel in the terminal EL3692 (R21) to match the TwinCAT configuration added. The disconnected wires are not currently connected ot any thermistor on the floor.
Daniel, Fil, Marc, Erik, Dave:
Daniel has taken a closer look at the timing master issues and he says it appears more likely that the timing master will need to be replaced rather than an issue with the roof antenna or its cabling.
The attached 24 hour trend shows the timing master's GPS error count (blue) GPS locked status (orange) and number of tracked satellites (green).
The error burst on the left is 19:00 - 22:00 Thu night, which caused the two crashes. The smaller middle burst is 03:00 - 04:00 this morning. The larger right hand burst is 07:00 - 08:00 which was close to causing a crash.
Daniel further points out that the number of satellites remains good through out, and is sometimes too big (>60).
This all points to an internal error in the timing master and not an antenna issue.
We are readying the spare master chassis for a swap out.
In preparation for another potential timing error this weekend, I have pushed the current pitch/yaw offsets to SDF for the following suspensions: ETMX/Y, TMSX/Y, BS, PRM, SRM, SR2/3, PR2/3, MC1/2/3, IM1/4.
Daniel, Erik, Dave:
For a sanity check we verified that the DAQ's GPS time is correct.
Currently this is a hand calculation, Erik is writing code to automate it.
I checked two times:
14:00:00 Fri 03 Nov 2023 PDT (just a few minutes ago)
21:10:00 Thu 02 Nov 2023 PDT (between the first and second crash last night)
Decoding the CNS-II GPS receivers' IRIG-B channels recorded in the DAQ as H1:CAL-PCALX_IRIGB_DQ, H1:CAL-PCALY_IRIGB_DQ I get the UTC times:
21:00:18
04:10:18
PDT/UTC diff is +7hr. The GPS/UTC leap second diff is currently 18 seconds, so the DAQ timing is correct.
Austin's having pushed the slider values to the suspensions was extremely helpful in our recovery later in the afternoon. For the future, I suggest we also (a) Offload the IMC WFS (which I had forgotten to do on Tuesday, and forgetting caused a lot of difficulty) before doing this, and then (b) including *every* suspension just in case, and (c) Jeff reminds me that we should also include the IMC PZT when doing this. But, already having had most of them pushed was already a huge time saver!