TITLE: 05/11 Eve Shift: 23:00-07:00 UTC (16:00-00:00 PST), all times posted in UTC
STATE of H1: Aligning
CURRENT ENVIRONMENT:
SEI_ENV state: CALM
Wind: 7mph Gusts, 6mph 5min avg
Primary useism: 0.01 μm/s
Secondary useism: 0.25 μm/s
QUICK SUMMARY:
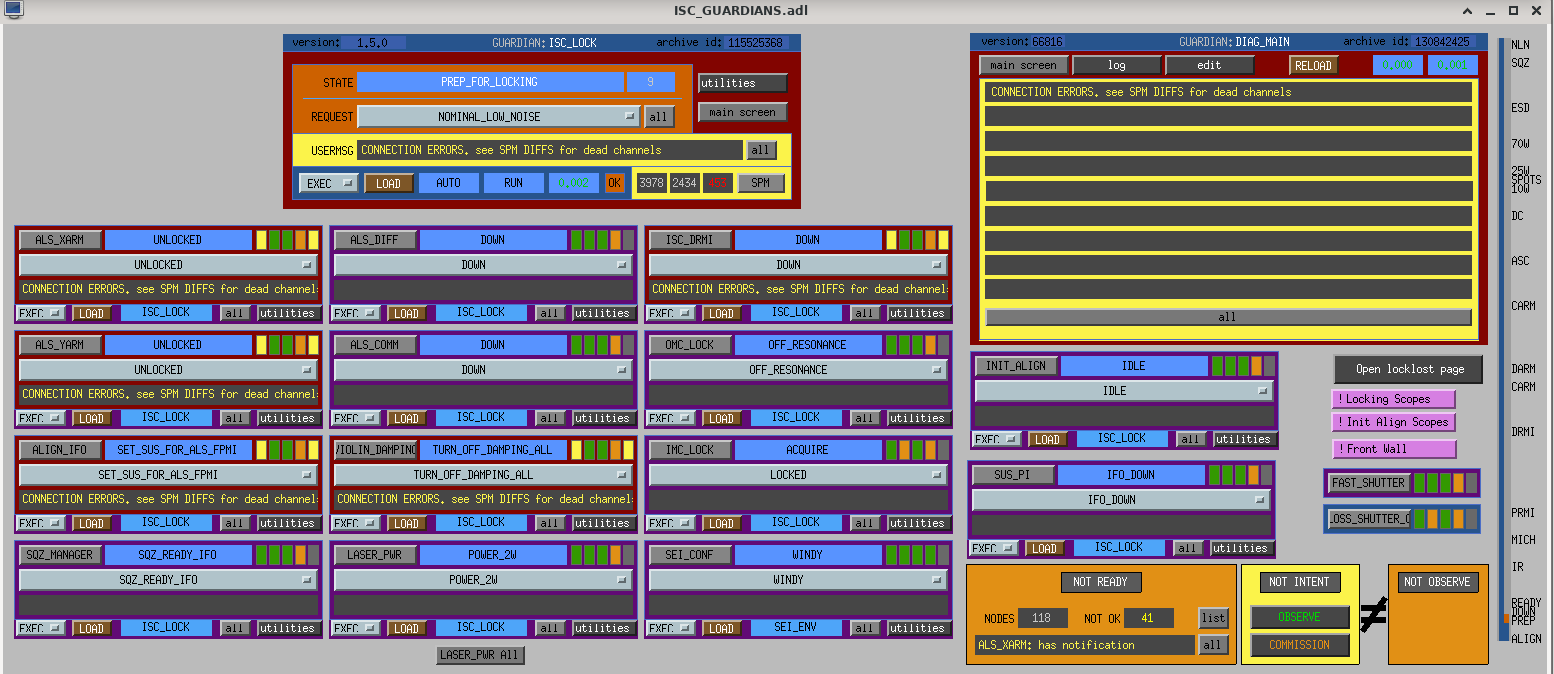
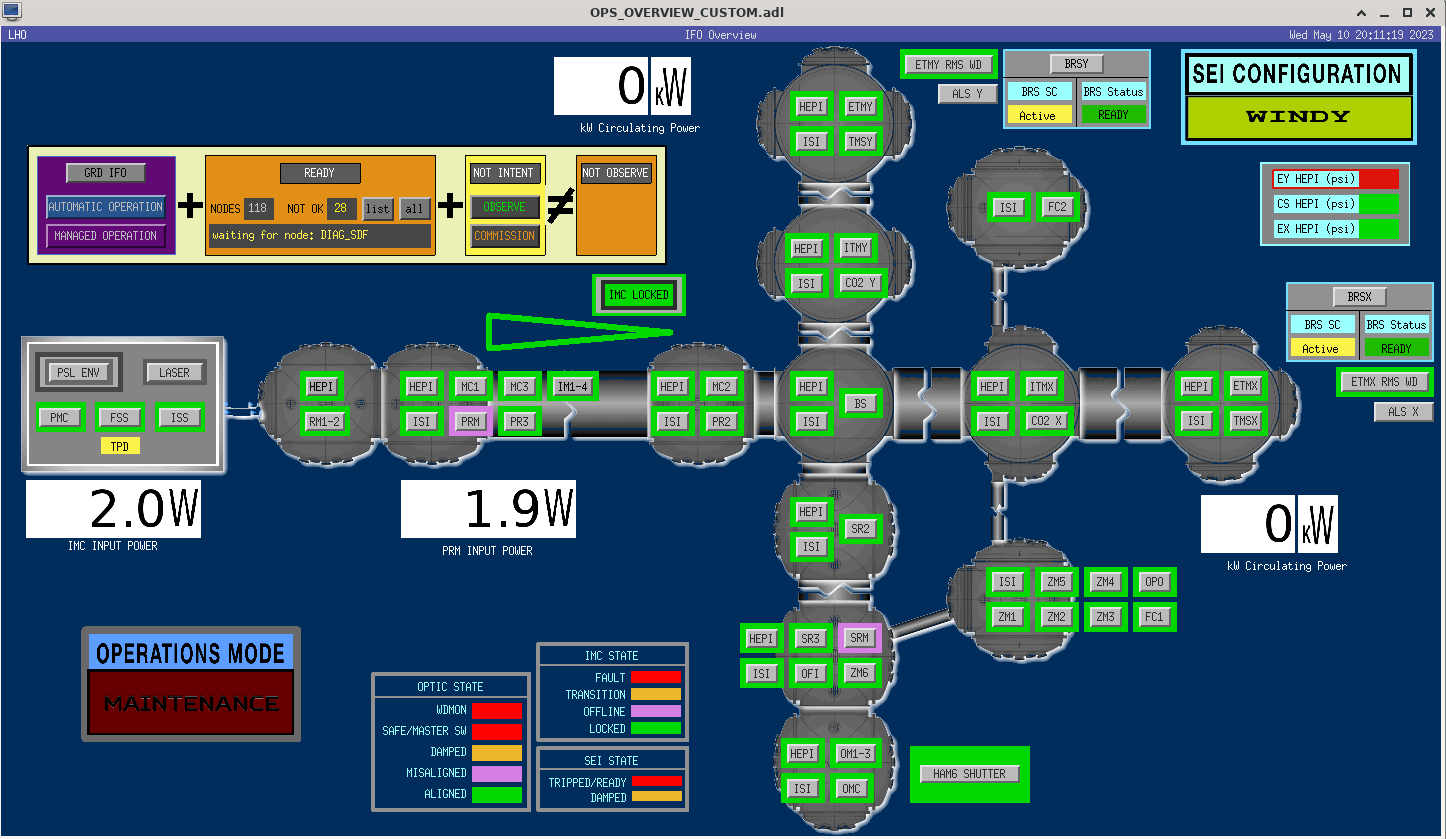
IFO'S Current Status: unlocked and misaligned.
Hear we go:
21 seconds into my shift there was a lockloss
https://ldas-jobs.ligo-wa.caltech.edu/~lockloss/index.cgi?event=1367794839
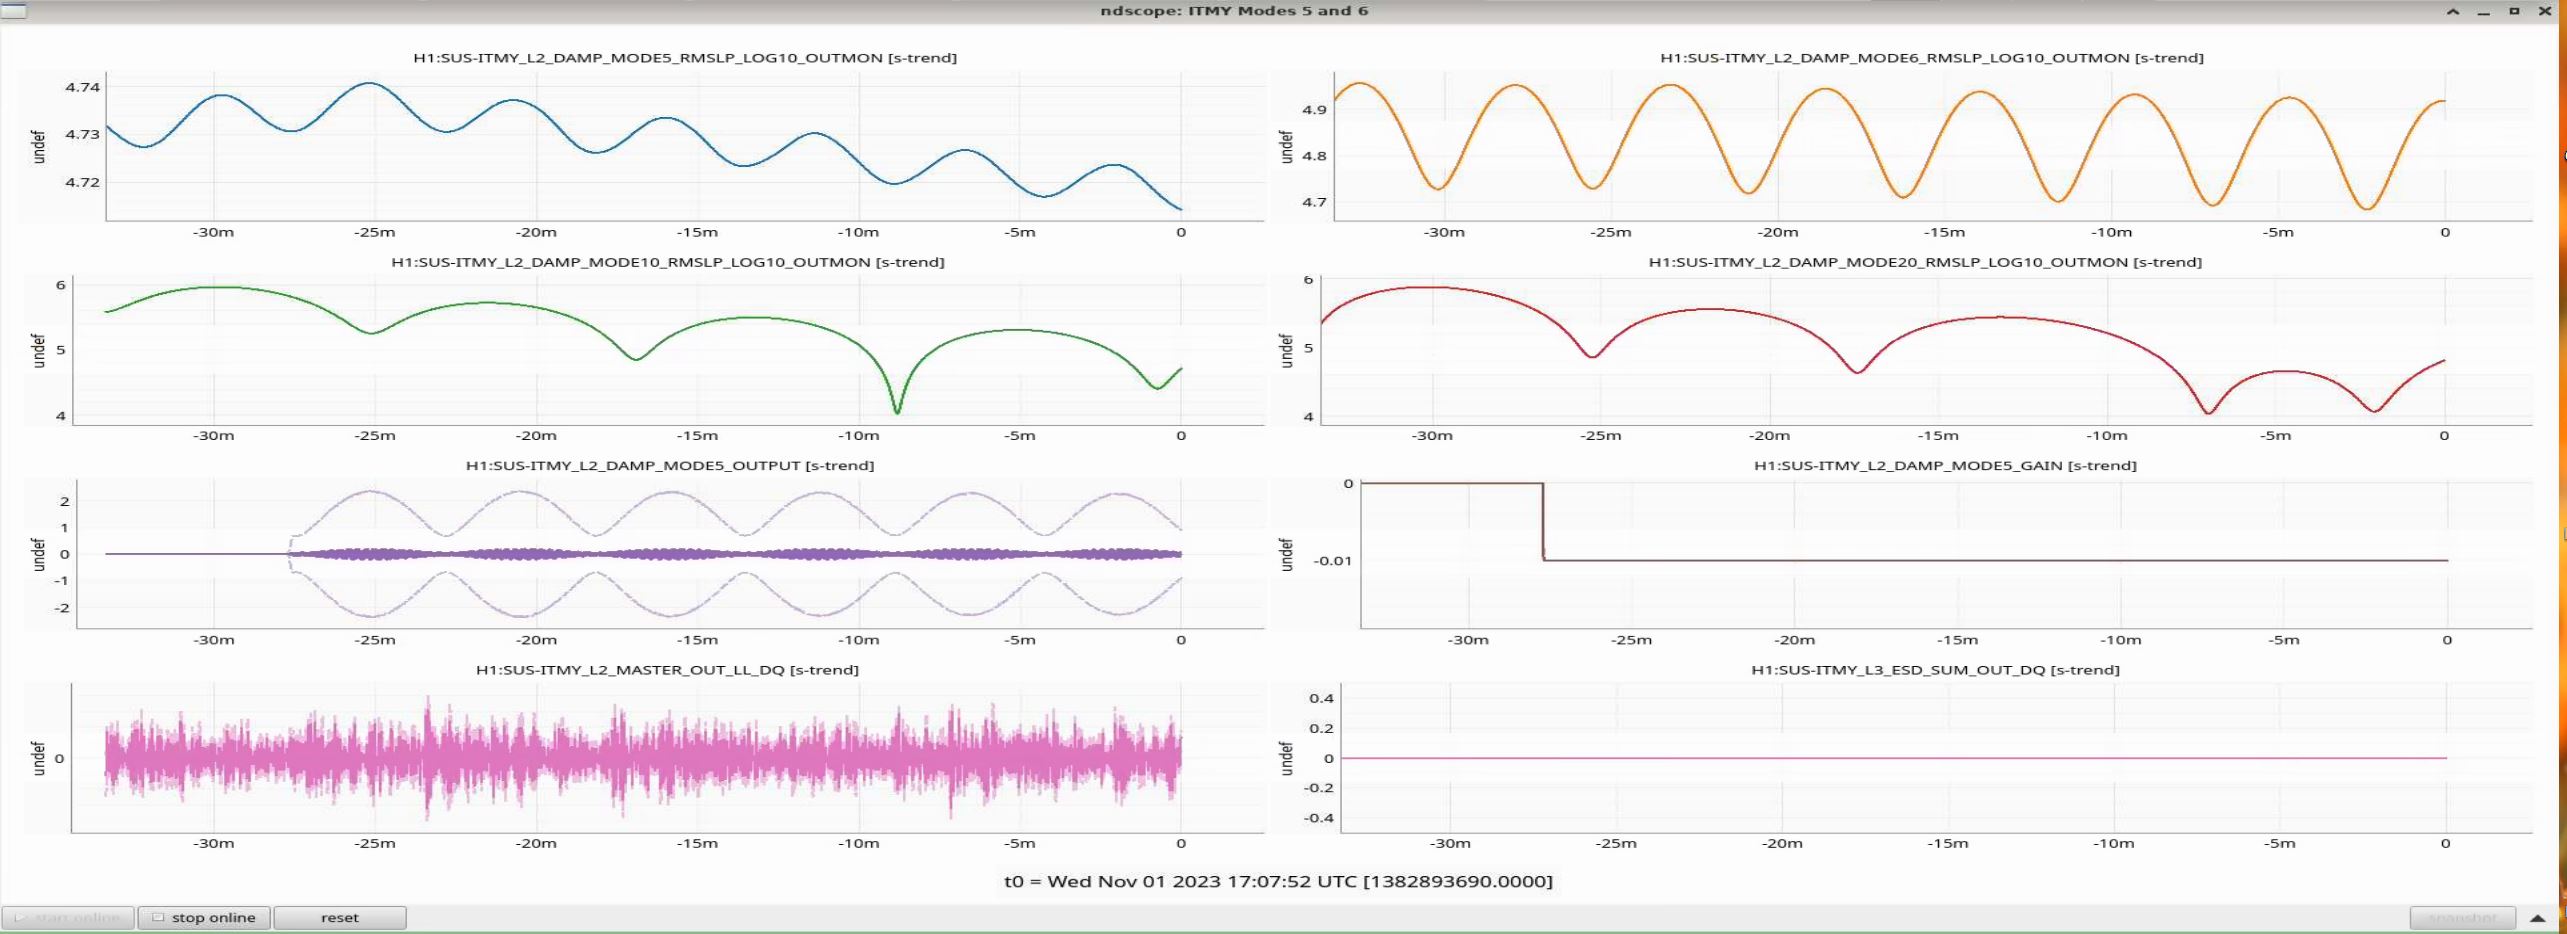
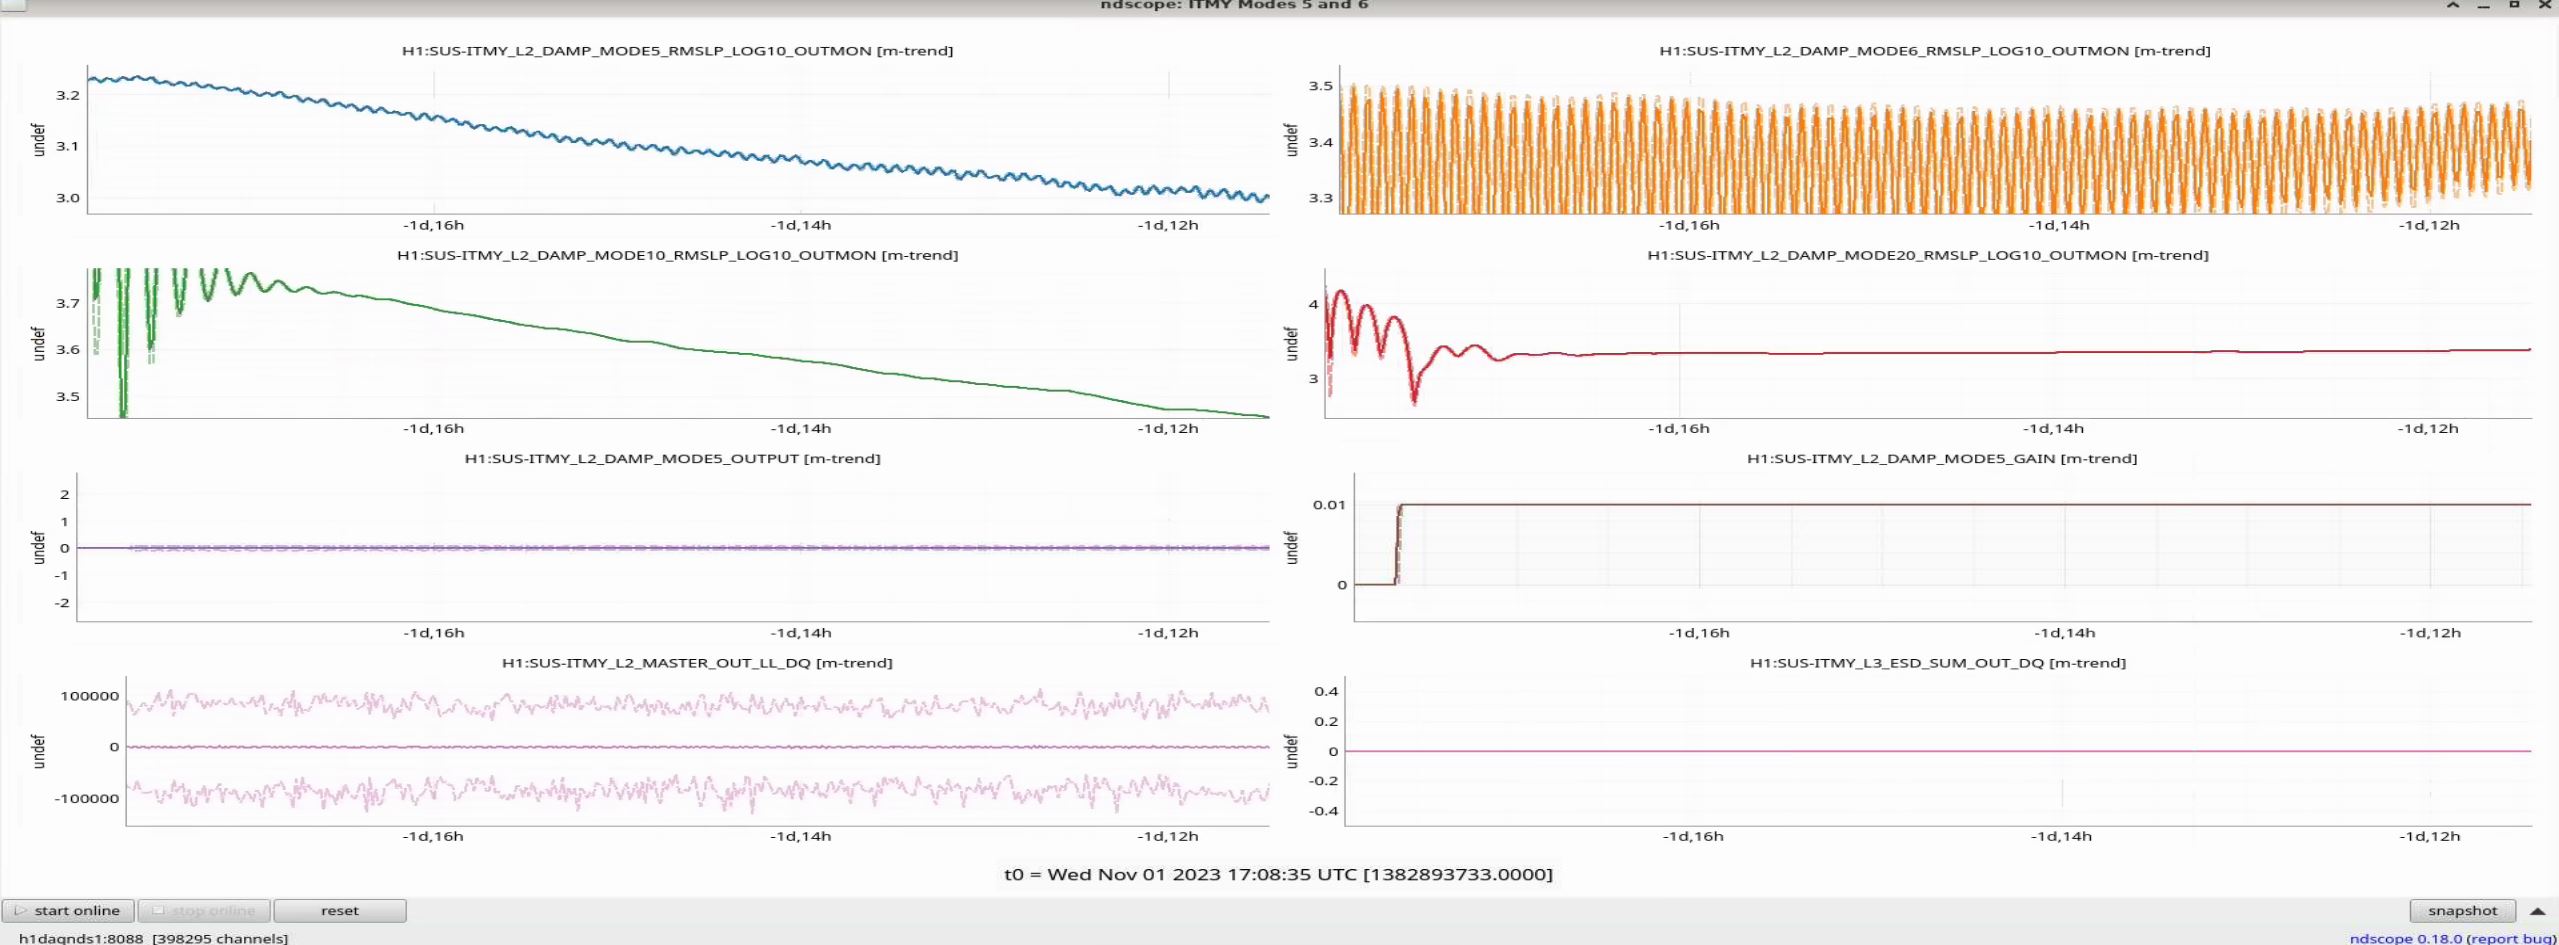
ITMY Mode 8 Violin is ringing up again. Changed the gain from -0.4 to 0 again, and I'll be watching it.
00:32 UTC Lockloss for an unknown reason
https://ldas-jobs.ligo-wa.caltech.edu/~lockloss/index.cgi?event=1367800386
Dolphin error cause a lockloss and the SUS models needed to be restarted.
https://ldas-jobs.ligo-wa.caltech.edu/~lockloss/index.cgi?event=1367803504
Everything on OPS Overview was Red and all the watch dogs had been tripped.
I Reset all suspension WDs, took all suspensions to safe, then reset all ISI's WDS, then Reset ALL HEPI WDs.
Finally got every thing back into what I thought was working order but relized that I don't have any light on the ALSX and ALSY cams.
I am now running the Dither scripts noted in alog 62024 for both X and Y arm.
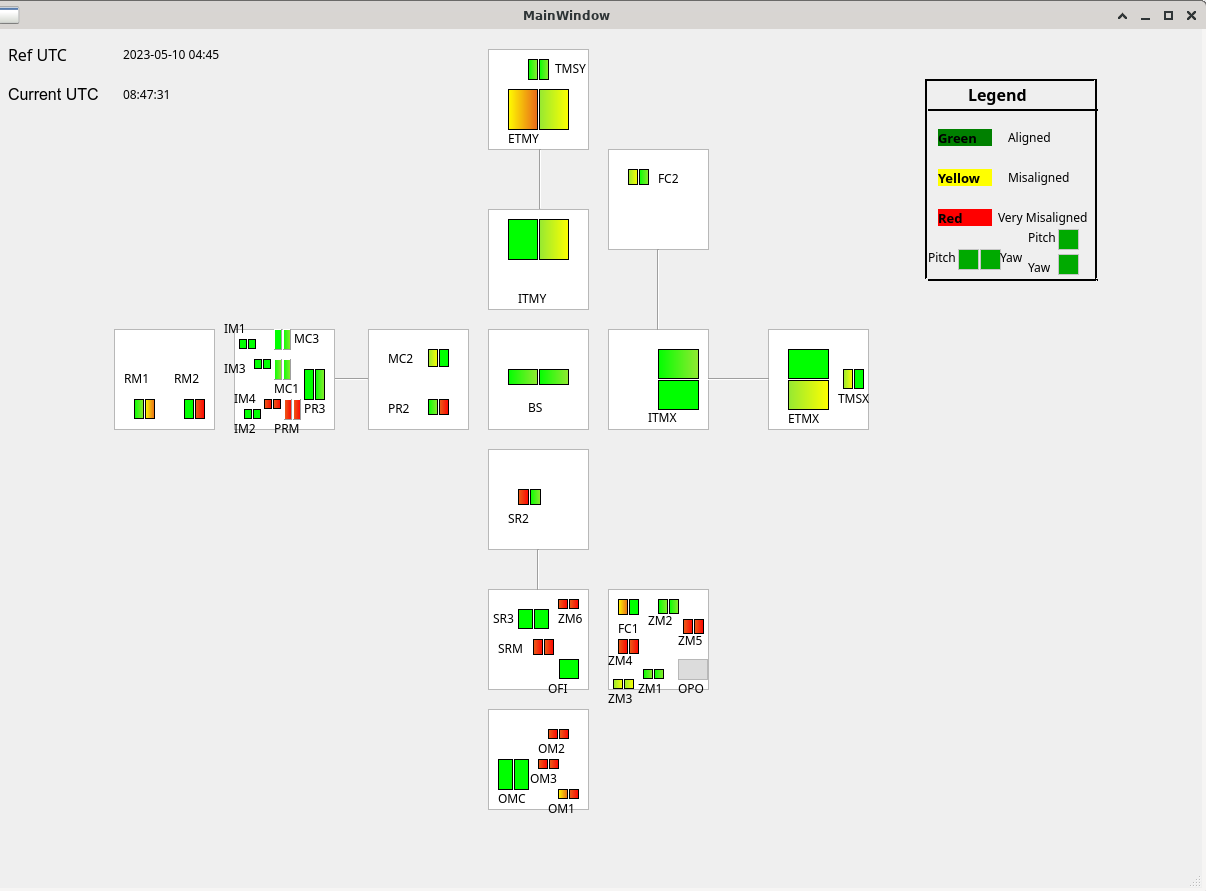
AS Air looks oddly center on the AS Air cam instead of it's natrual state of top right.
The dither scripts took AS air cam back to what I would consider it's natural state in the top left.
I now have light on both arms! Yay!
Me and Increase flashes became best of buds while we both tryed to get X arm above 0.50.
ETMX TMSX ITMX PRM and PRM3 all got moved whle trying to increase flashes.
I wasted a hour an hour trying to find information on adjusting the OPLEVS and never ended up finding them let alone touching them.
I eventually manage to get a good ALS X & Y alignment after time machining back to look at a number of sliders on the IFO_ALign screen and re-adjusting PRM and PR3.
Started an INIT_ALIGN and got stuck in ACQUIRE_XARM_IR, Then spend an hour or 2 searching through the troubleshooting Docs & alogs to try and find a way to get past this:
2023-05-11_07:33:31.707994Z ALIGN_IFO [ACQUIRE_XARM_IR.main] ezca: H1:LSC-XARM => ON: INPUT
2023-05-11_07:33:31.709570Z ALIGN_IFO [ACQUIRE_XARM_IR.main] timer['pause'] = 3
2023-05-11_07:33:31.785294Z ALIGN_IFO [ACQUIRE_XARM_IR.run] timer['pause'] = 0.5
I then tried to cancel out of INIT_ALIGN because I remember I heard there were some problems with getting through INIT_ALIGN a few days ago. Then my plan was to try and have ISC_LOCK's FIND_IR stage in the Locking sequece get me past that spot in the Alignment.
Would you be Surprised if I said that IR was not found? I had to touch both up COMM and DIFF.
I then got stuck in Check Mitch Fringes. And bumped the BS around until it got stuck in Aquire PRMI Again. The Troubleshooting document mentions MICH_Dark_LOCK but not Mitch fringes.
I then Spend an hour or 2 looking for information on that.
I then tried to restore ALL Sliders back to 24 hours ago when we were locked.
and tried the above process over again.
Then I tried restoring ALL Sliders back to a time where we were unlocked but had Good ASL X&Y flashes right before a lock and tried the process over again.
I believe I am missing some important nuggets of knowlege on how to get IFO locked from a misaligned state.
Things I wanted to do But couldn't figure out how: Check OSEMS and OPLEVS.
