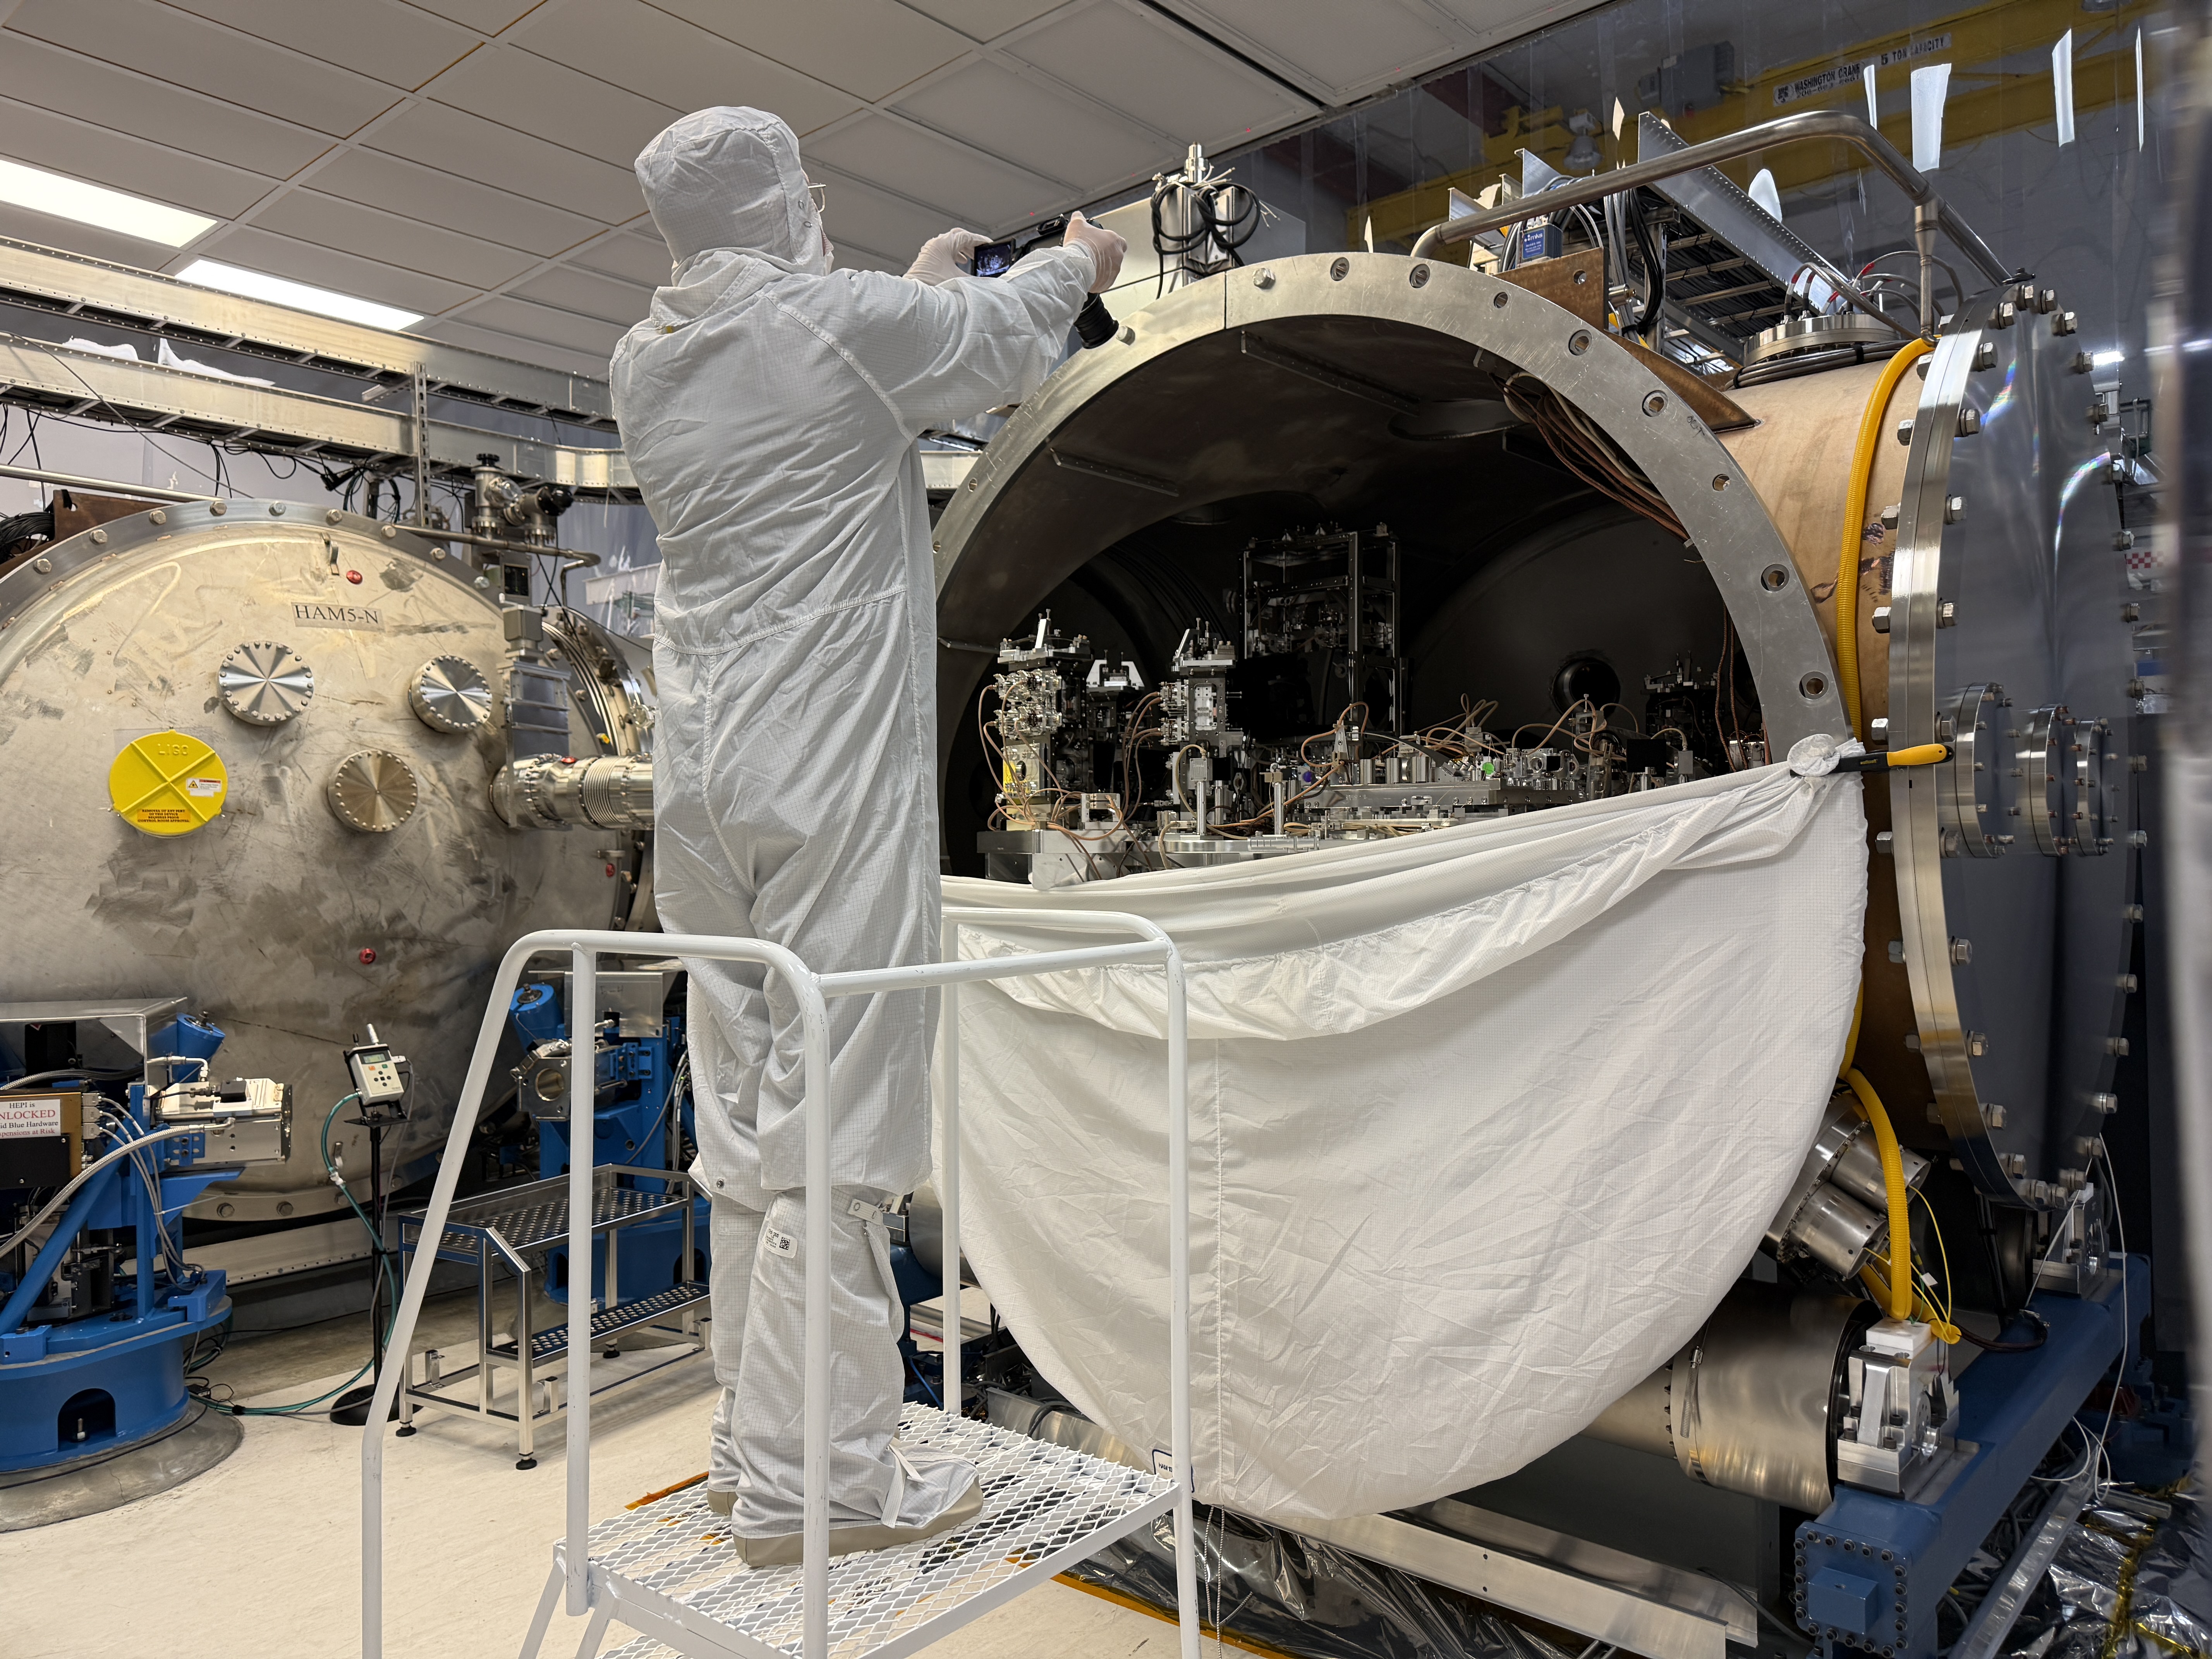
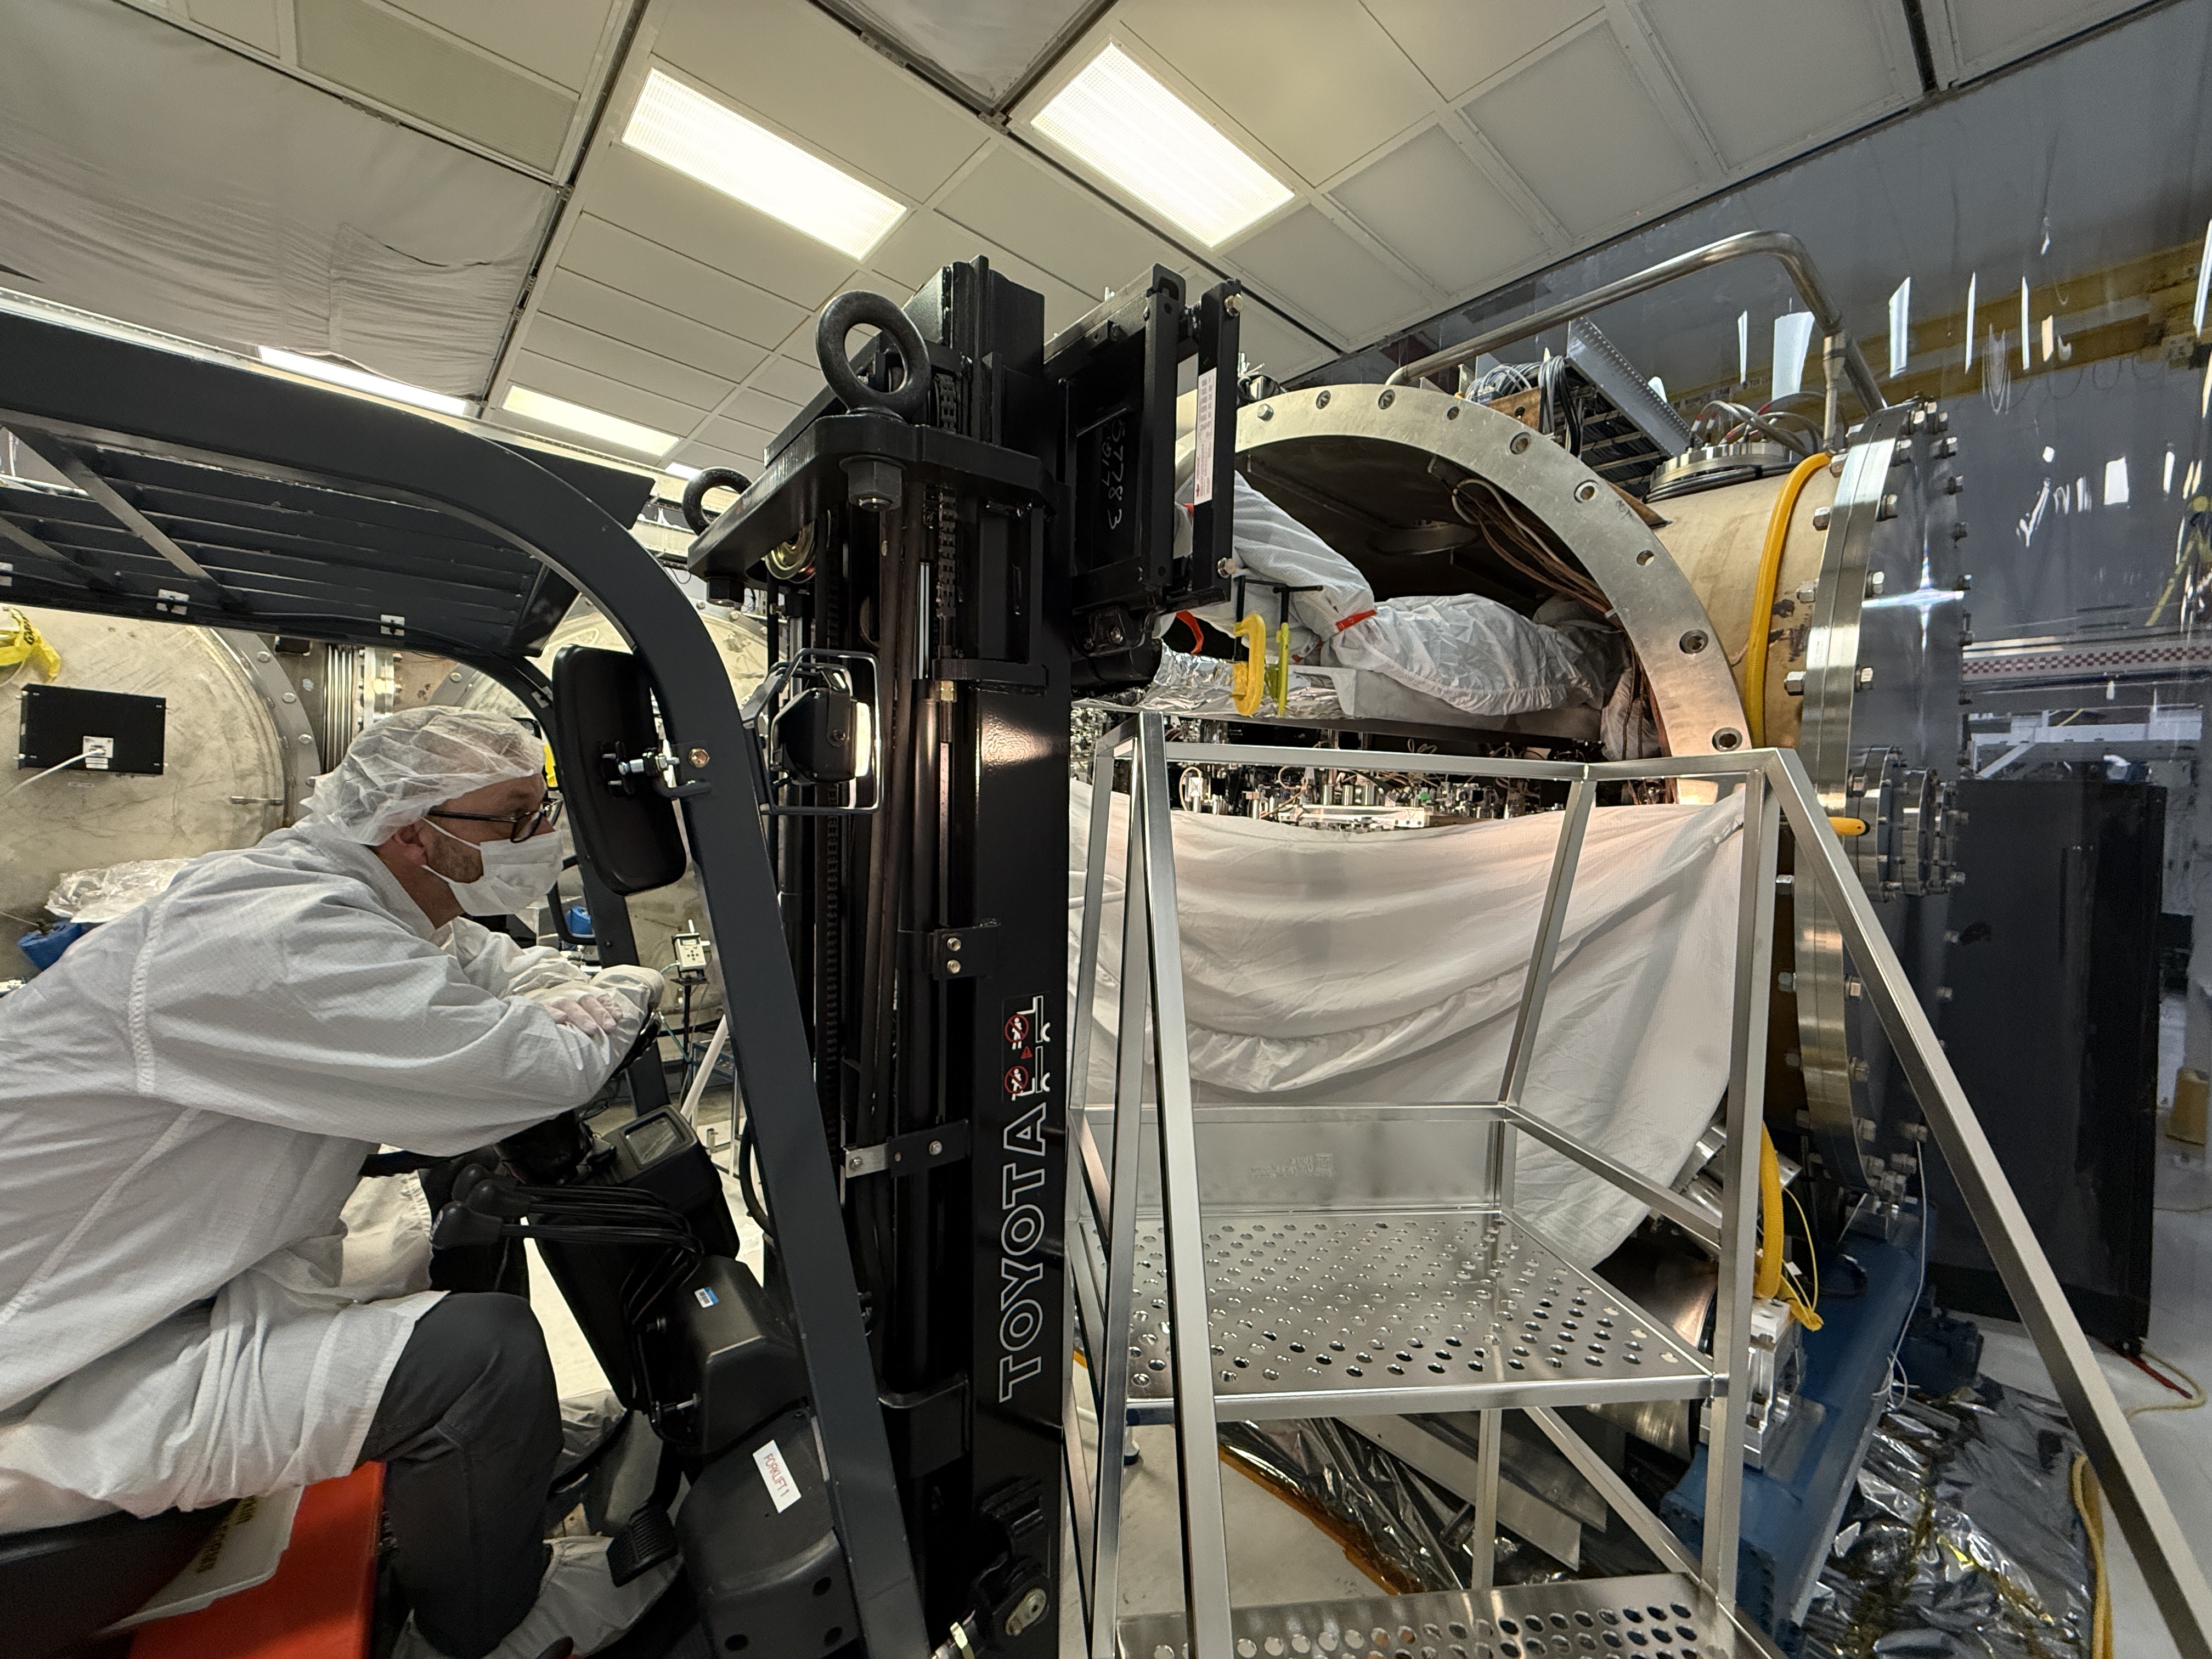
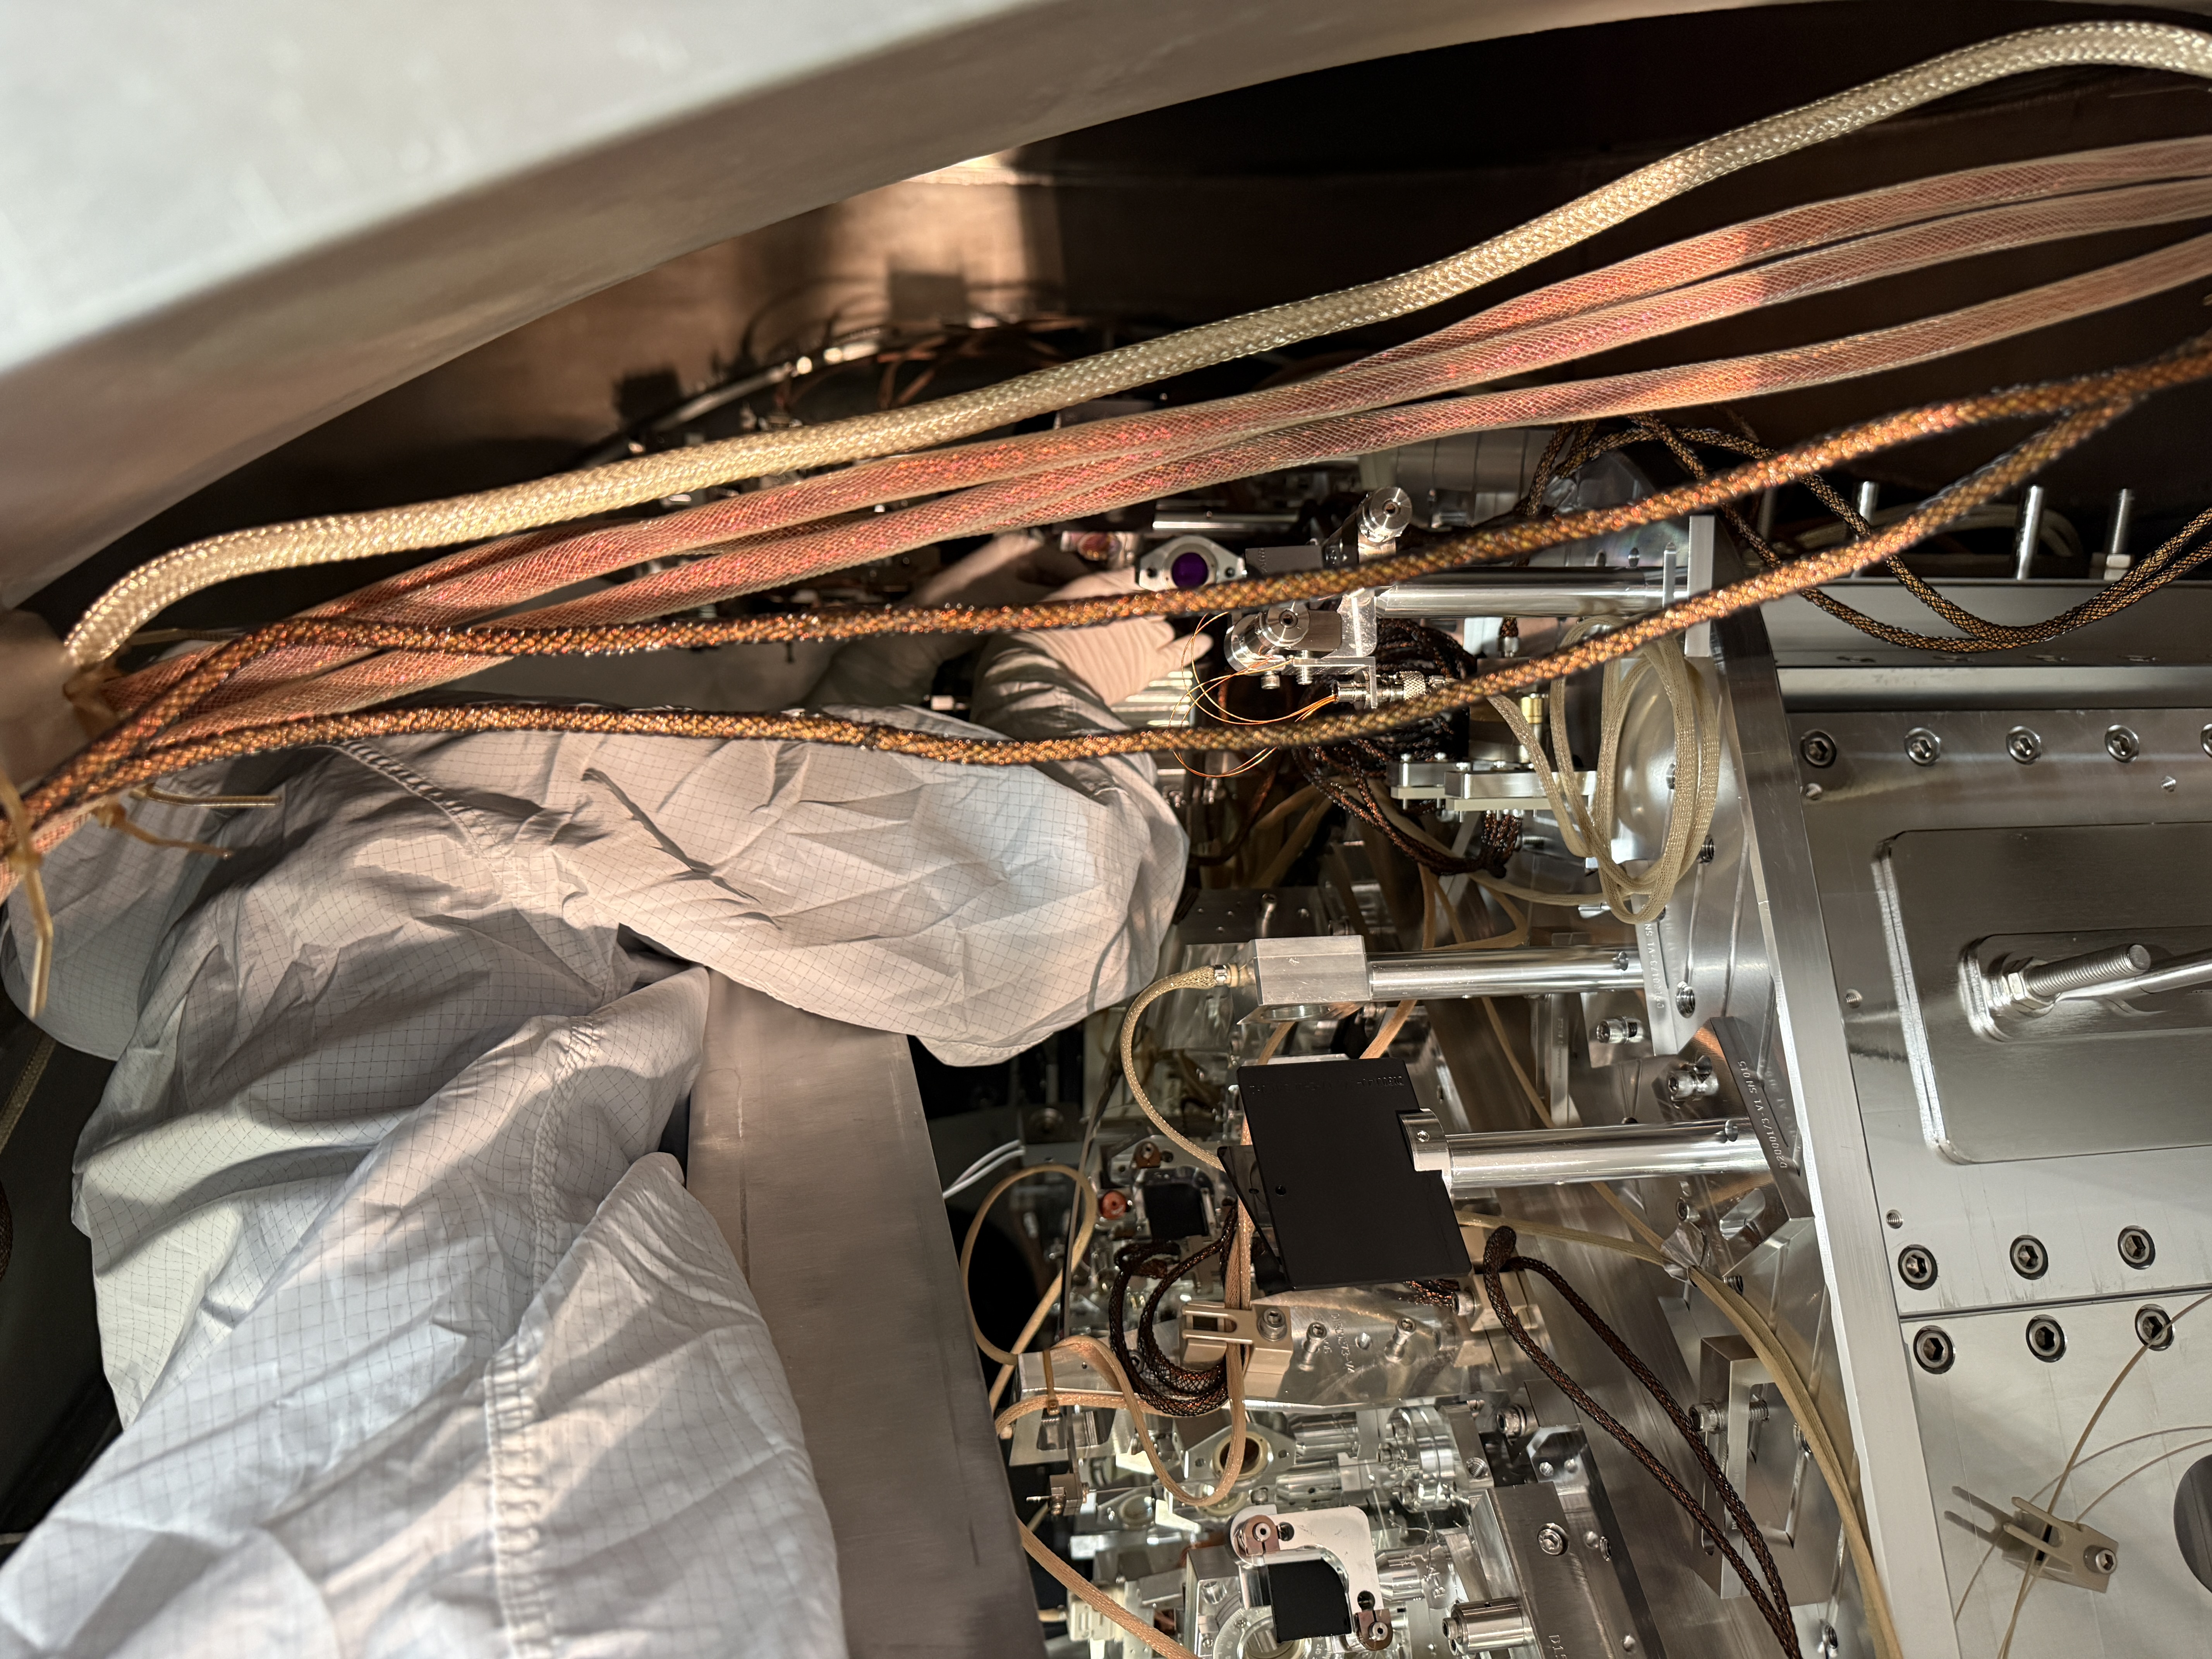
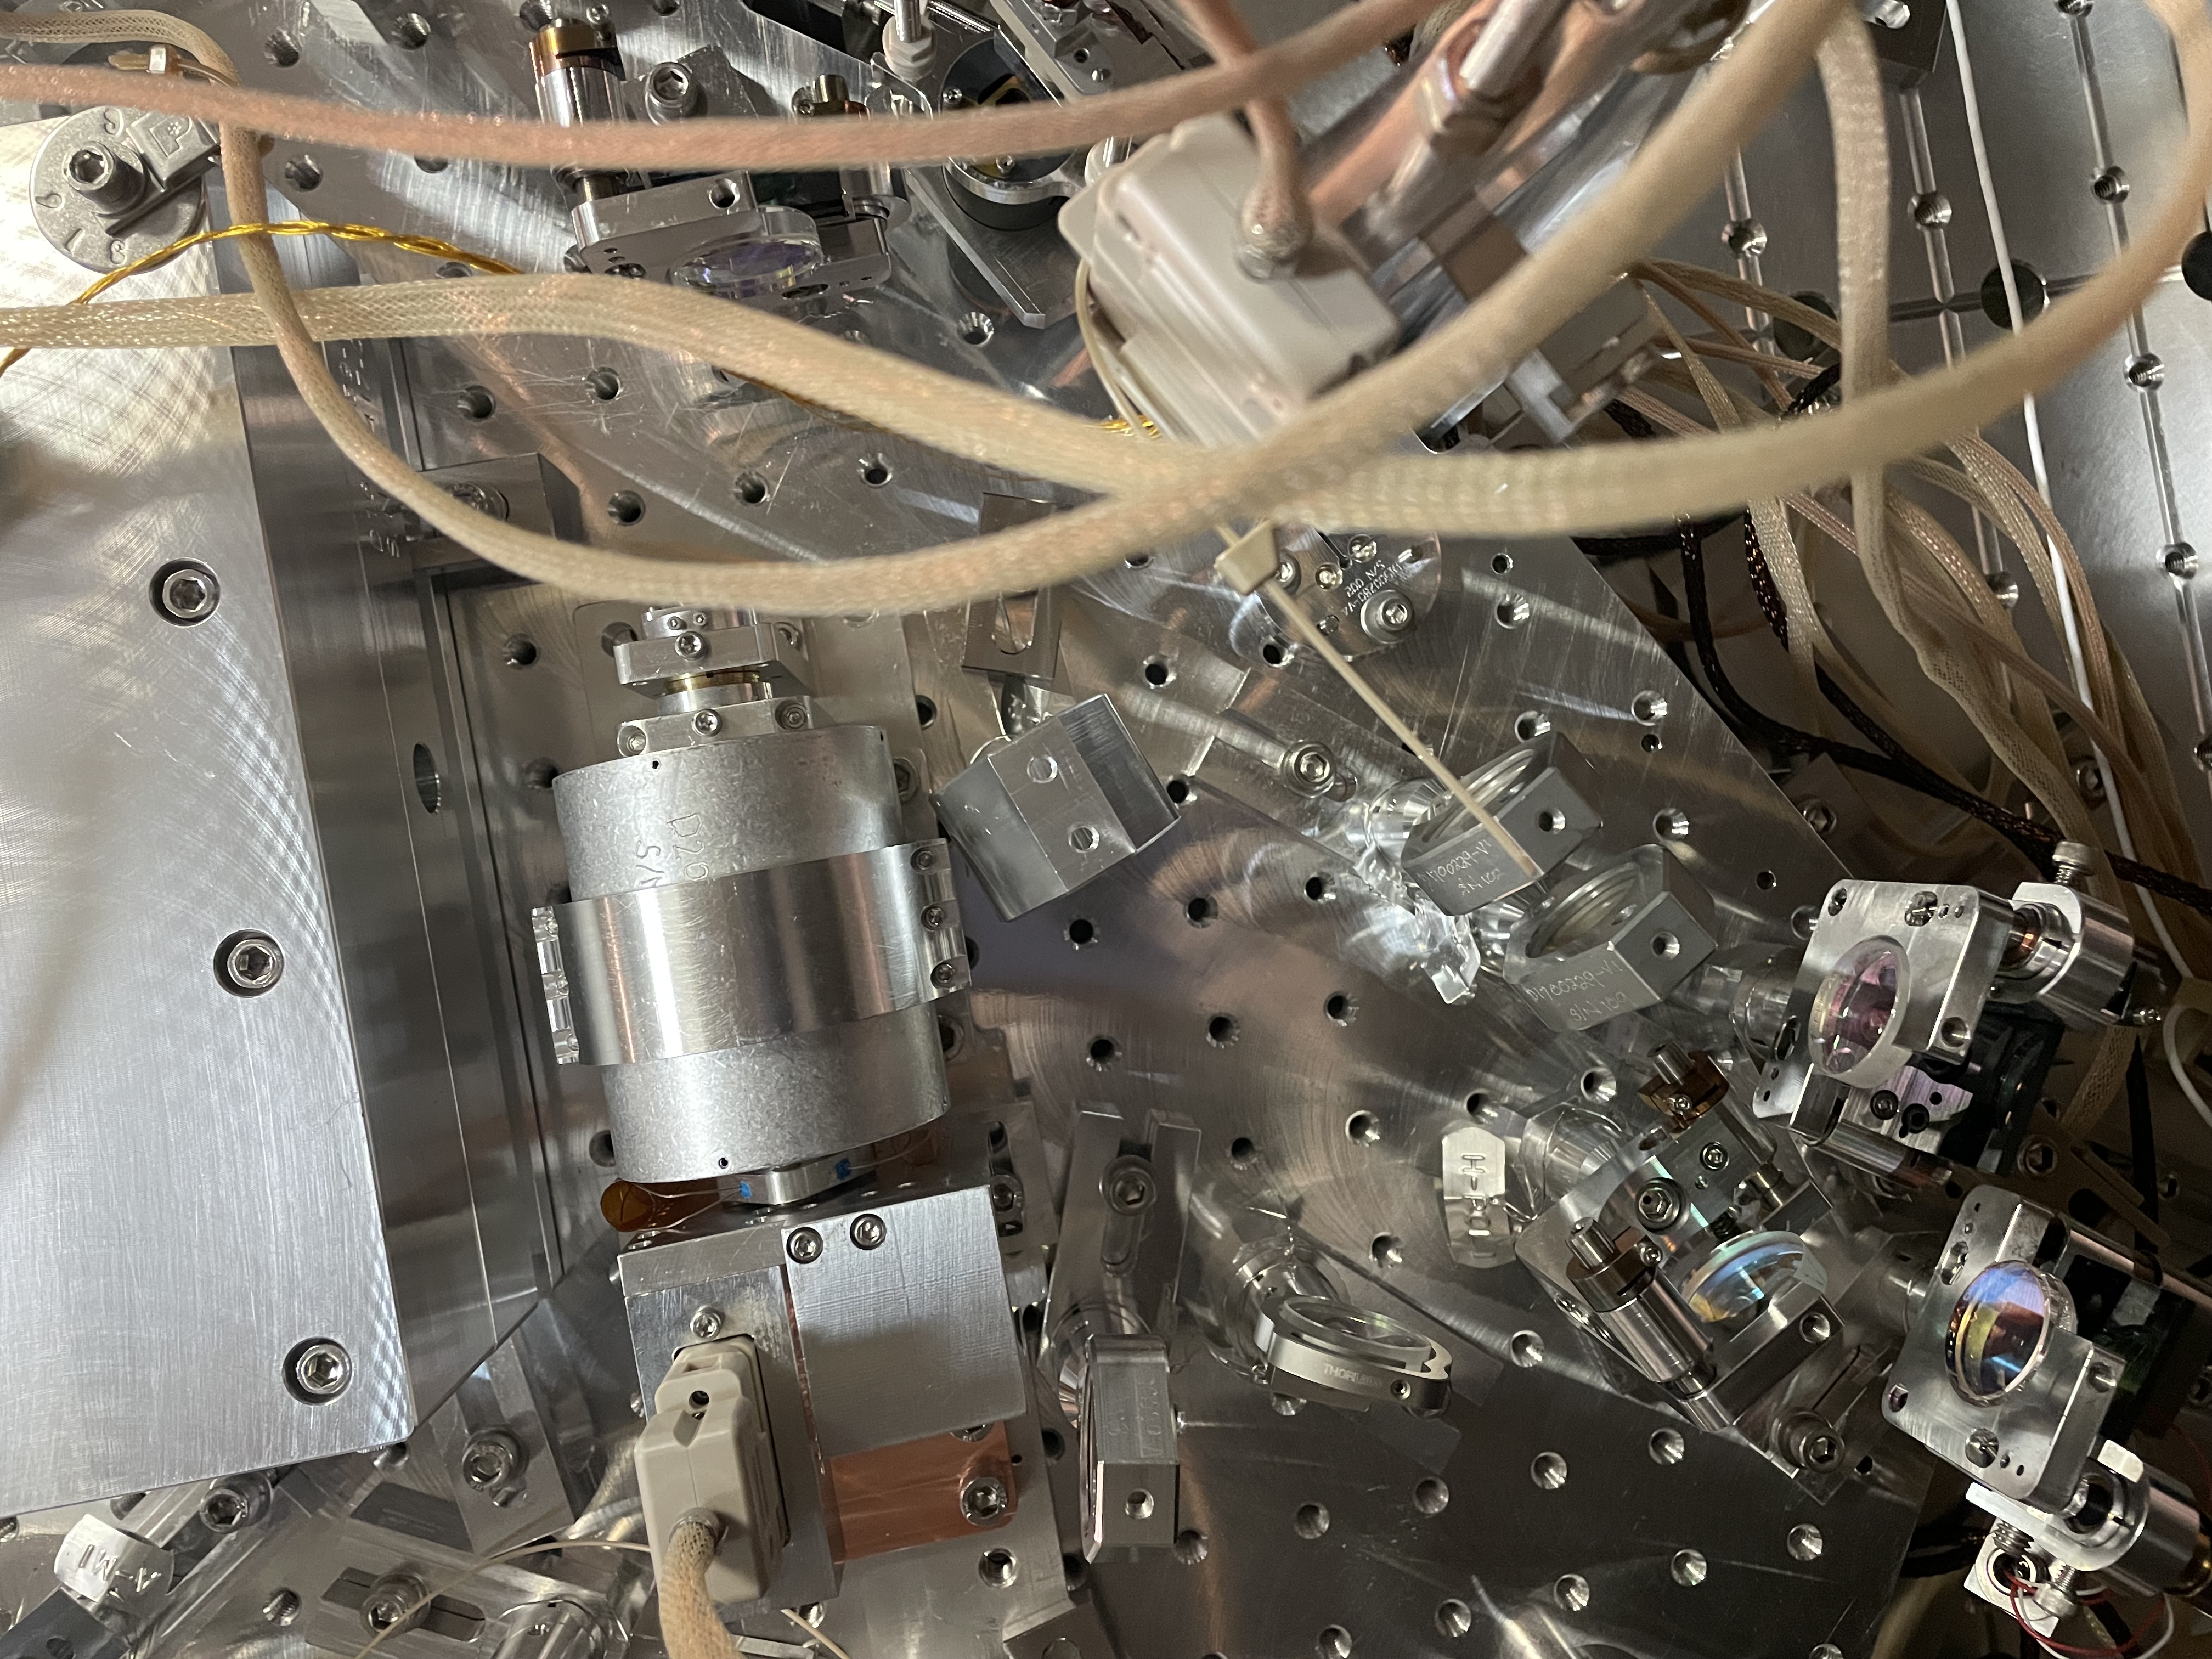
Dripta and I went to EY yesterday (Feb 3rd) to do both an ES and a TX module maintanence. We followed T1500062-v21 with out much deviation until the end when we started the TX module maint.
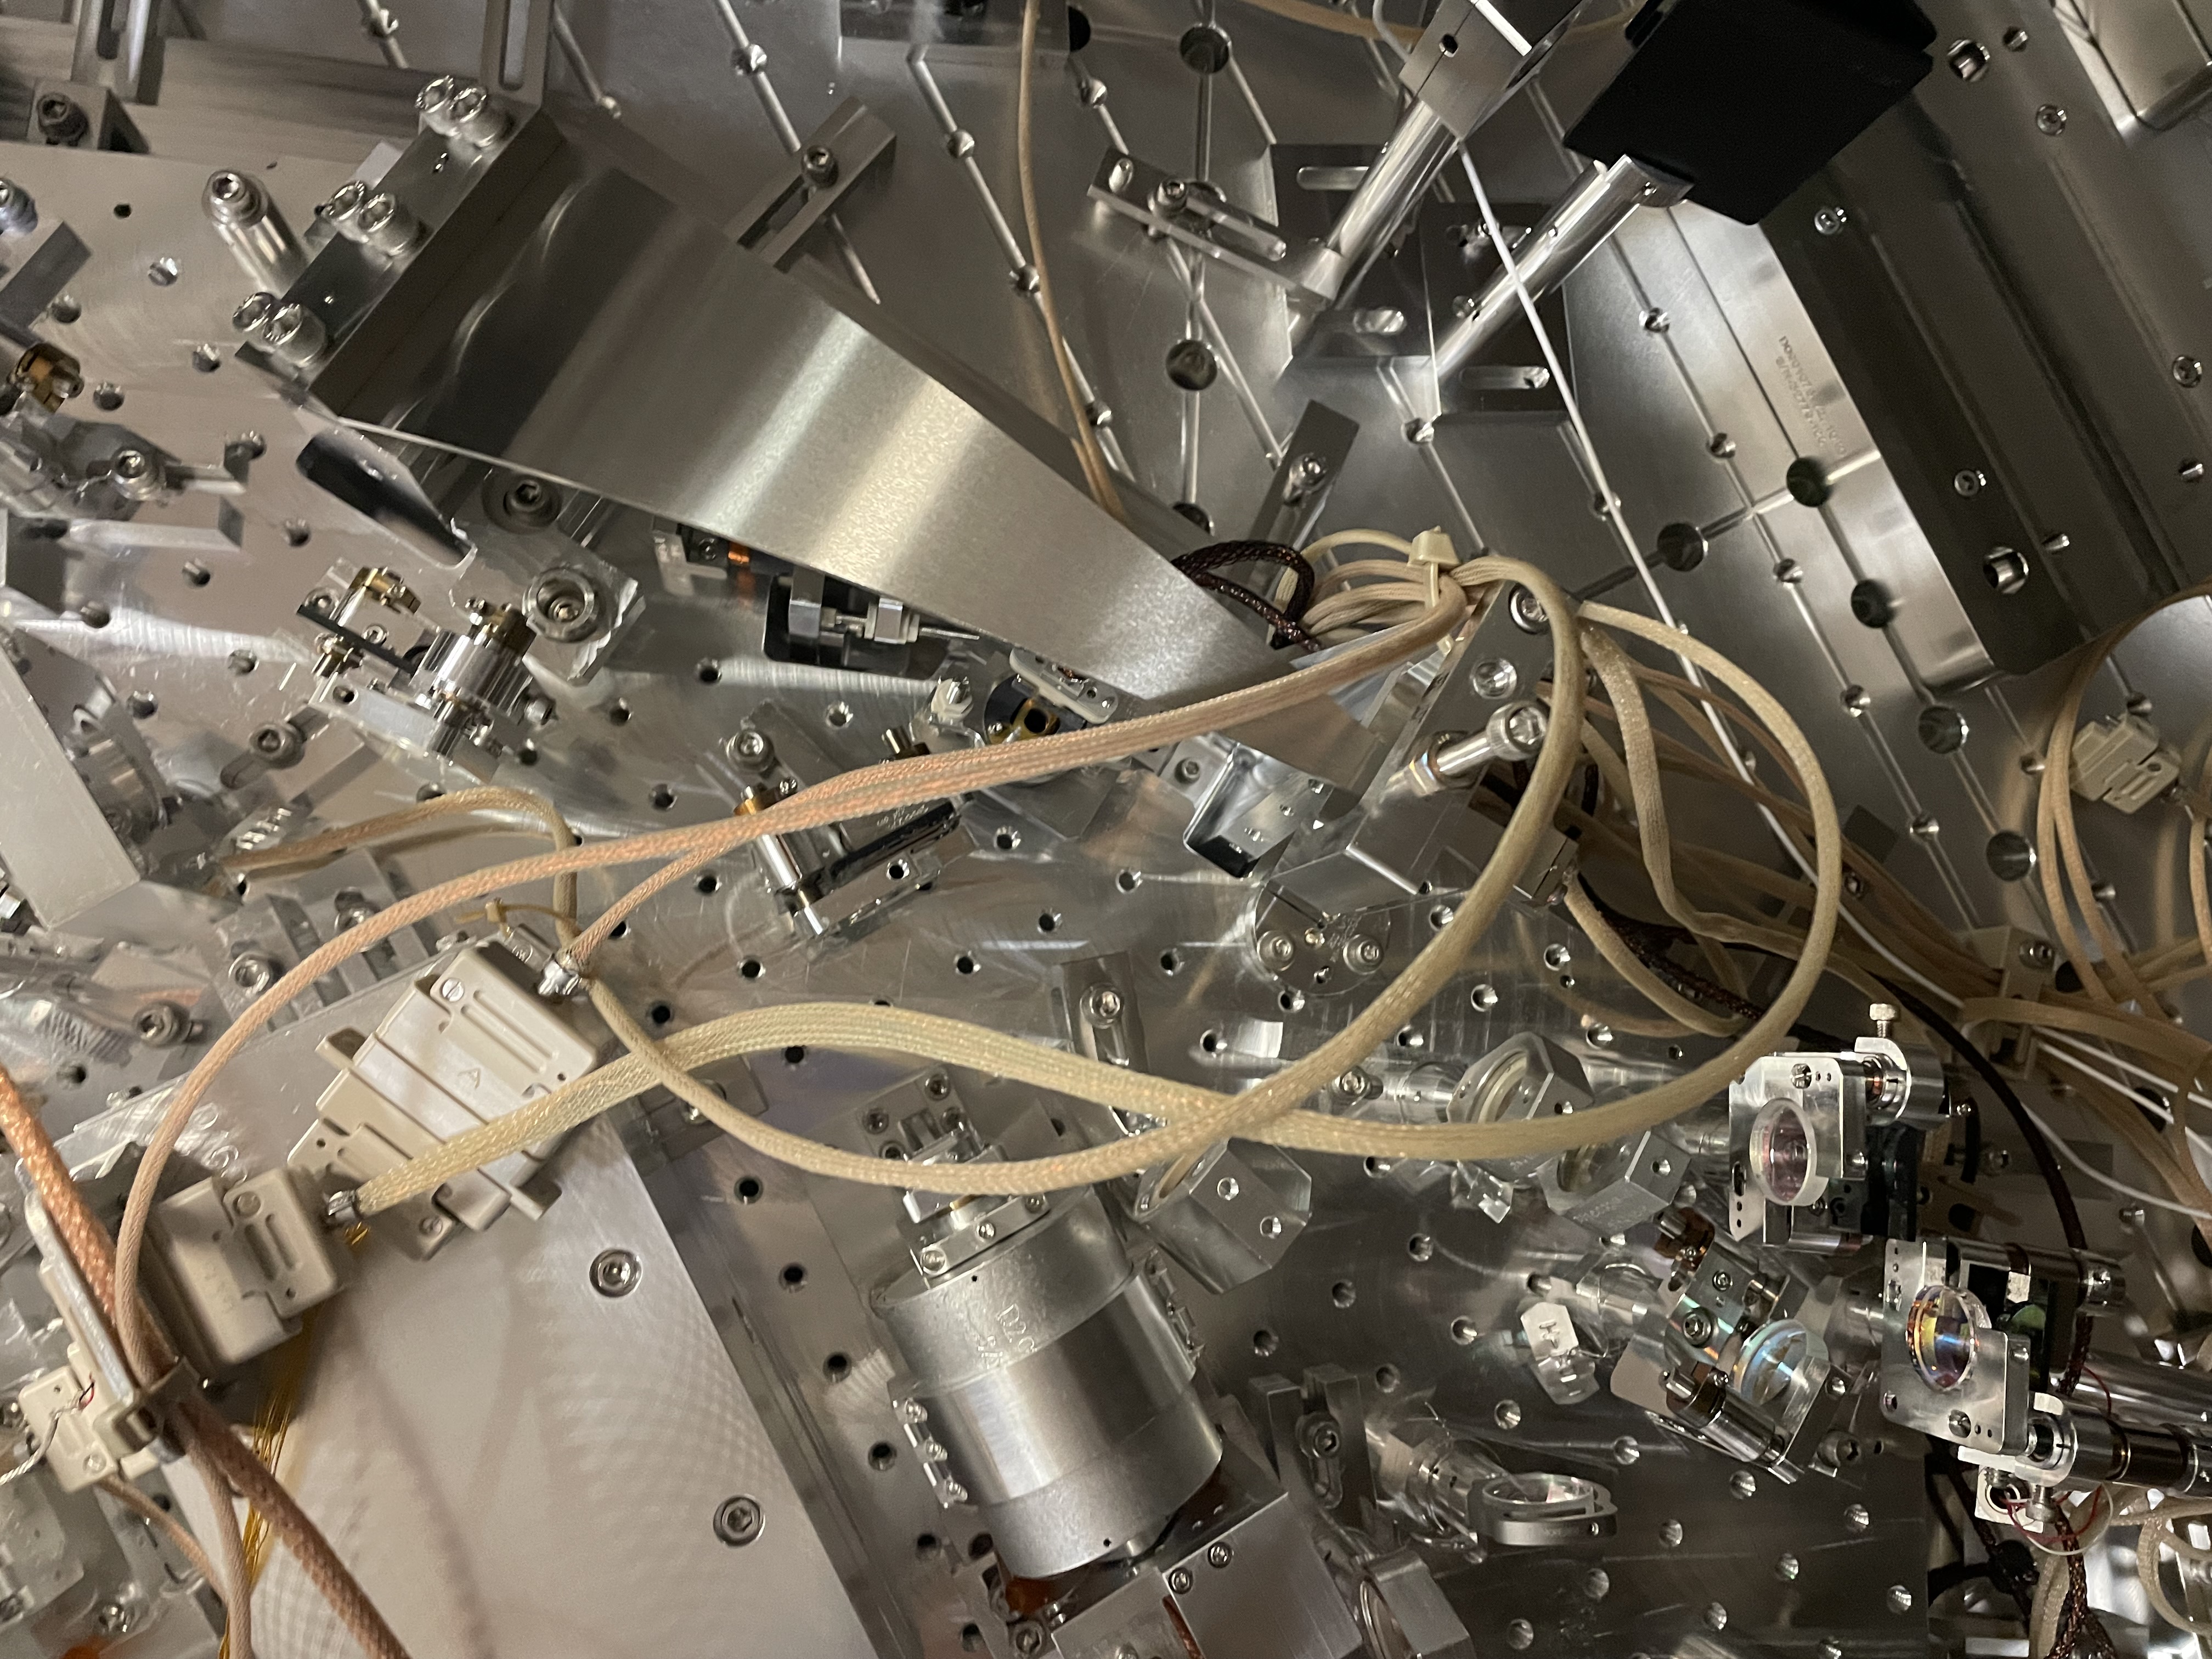
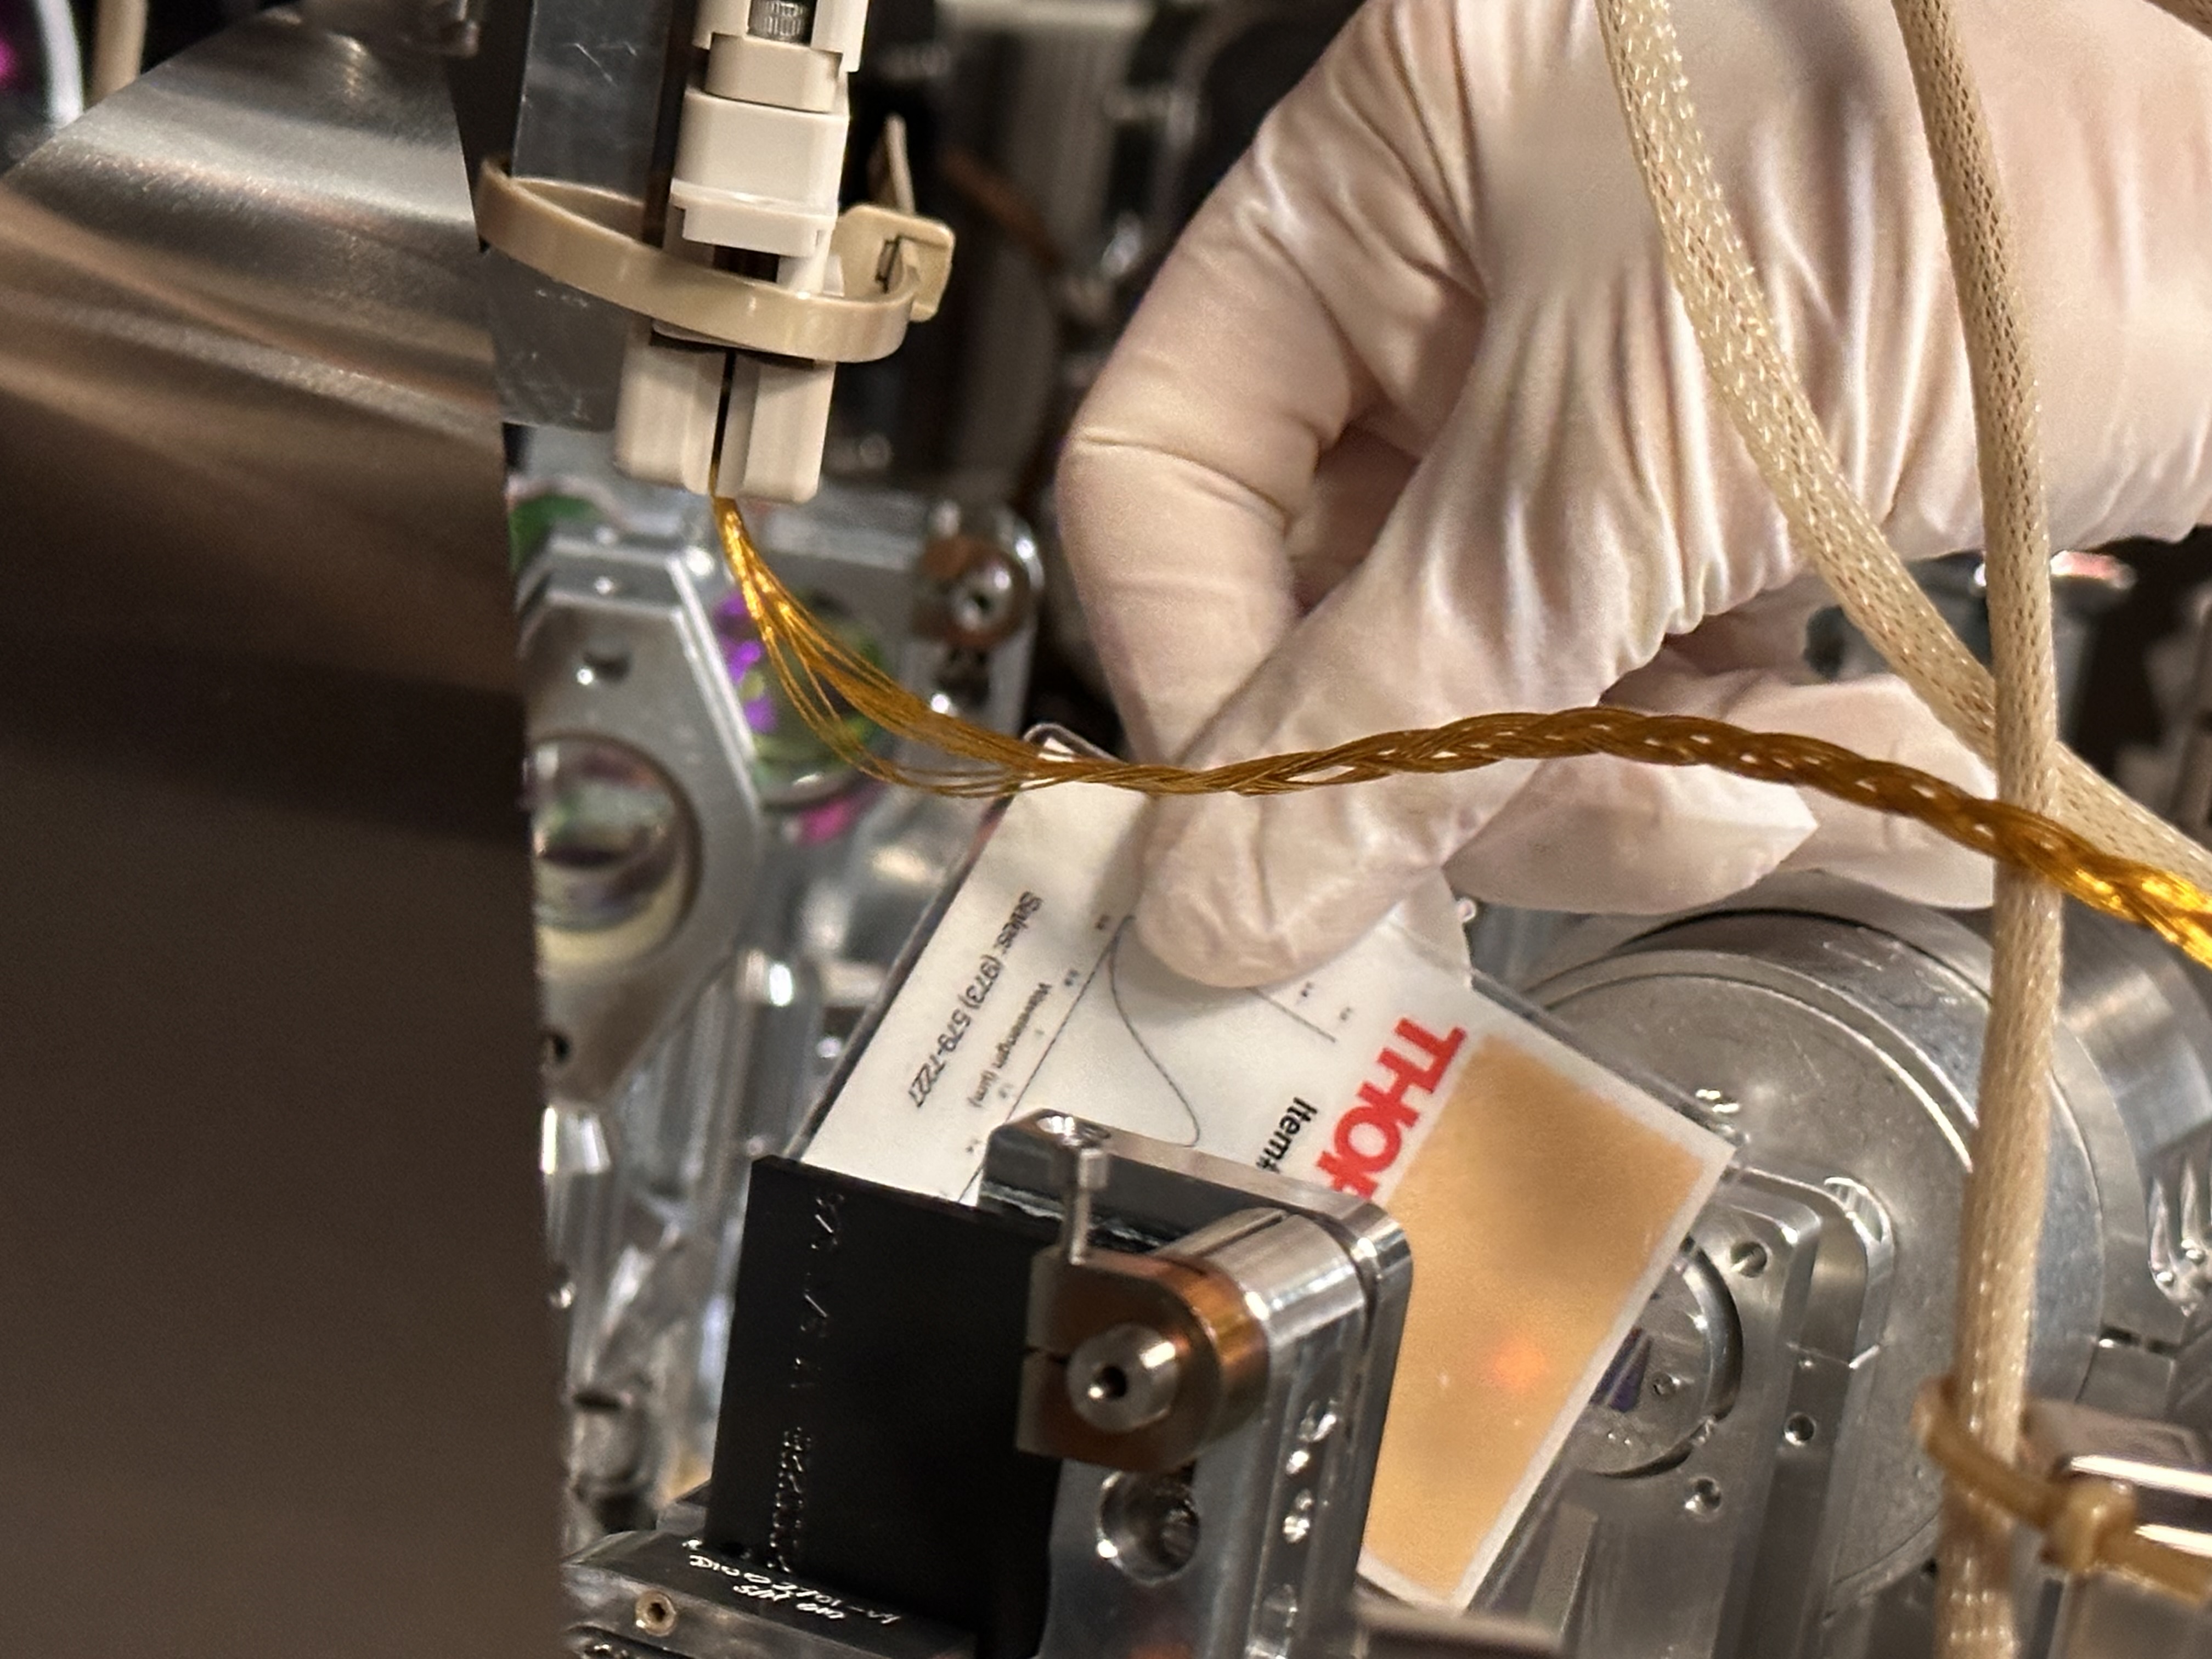
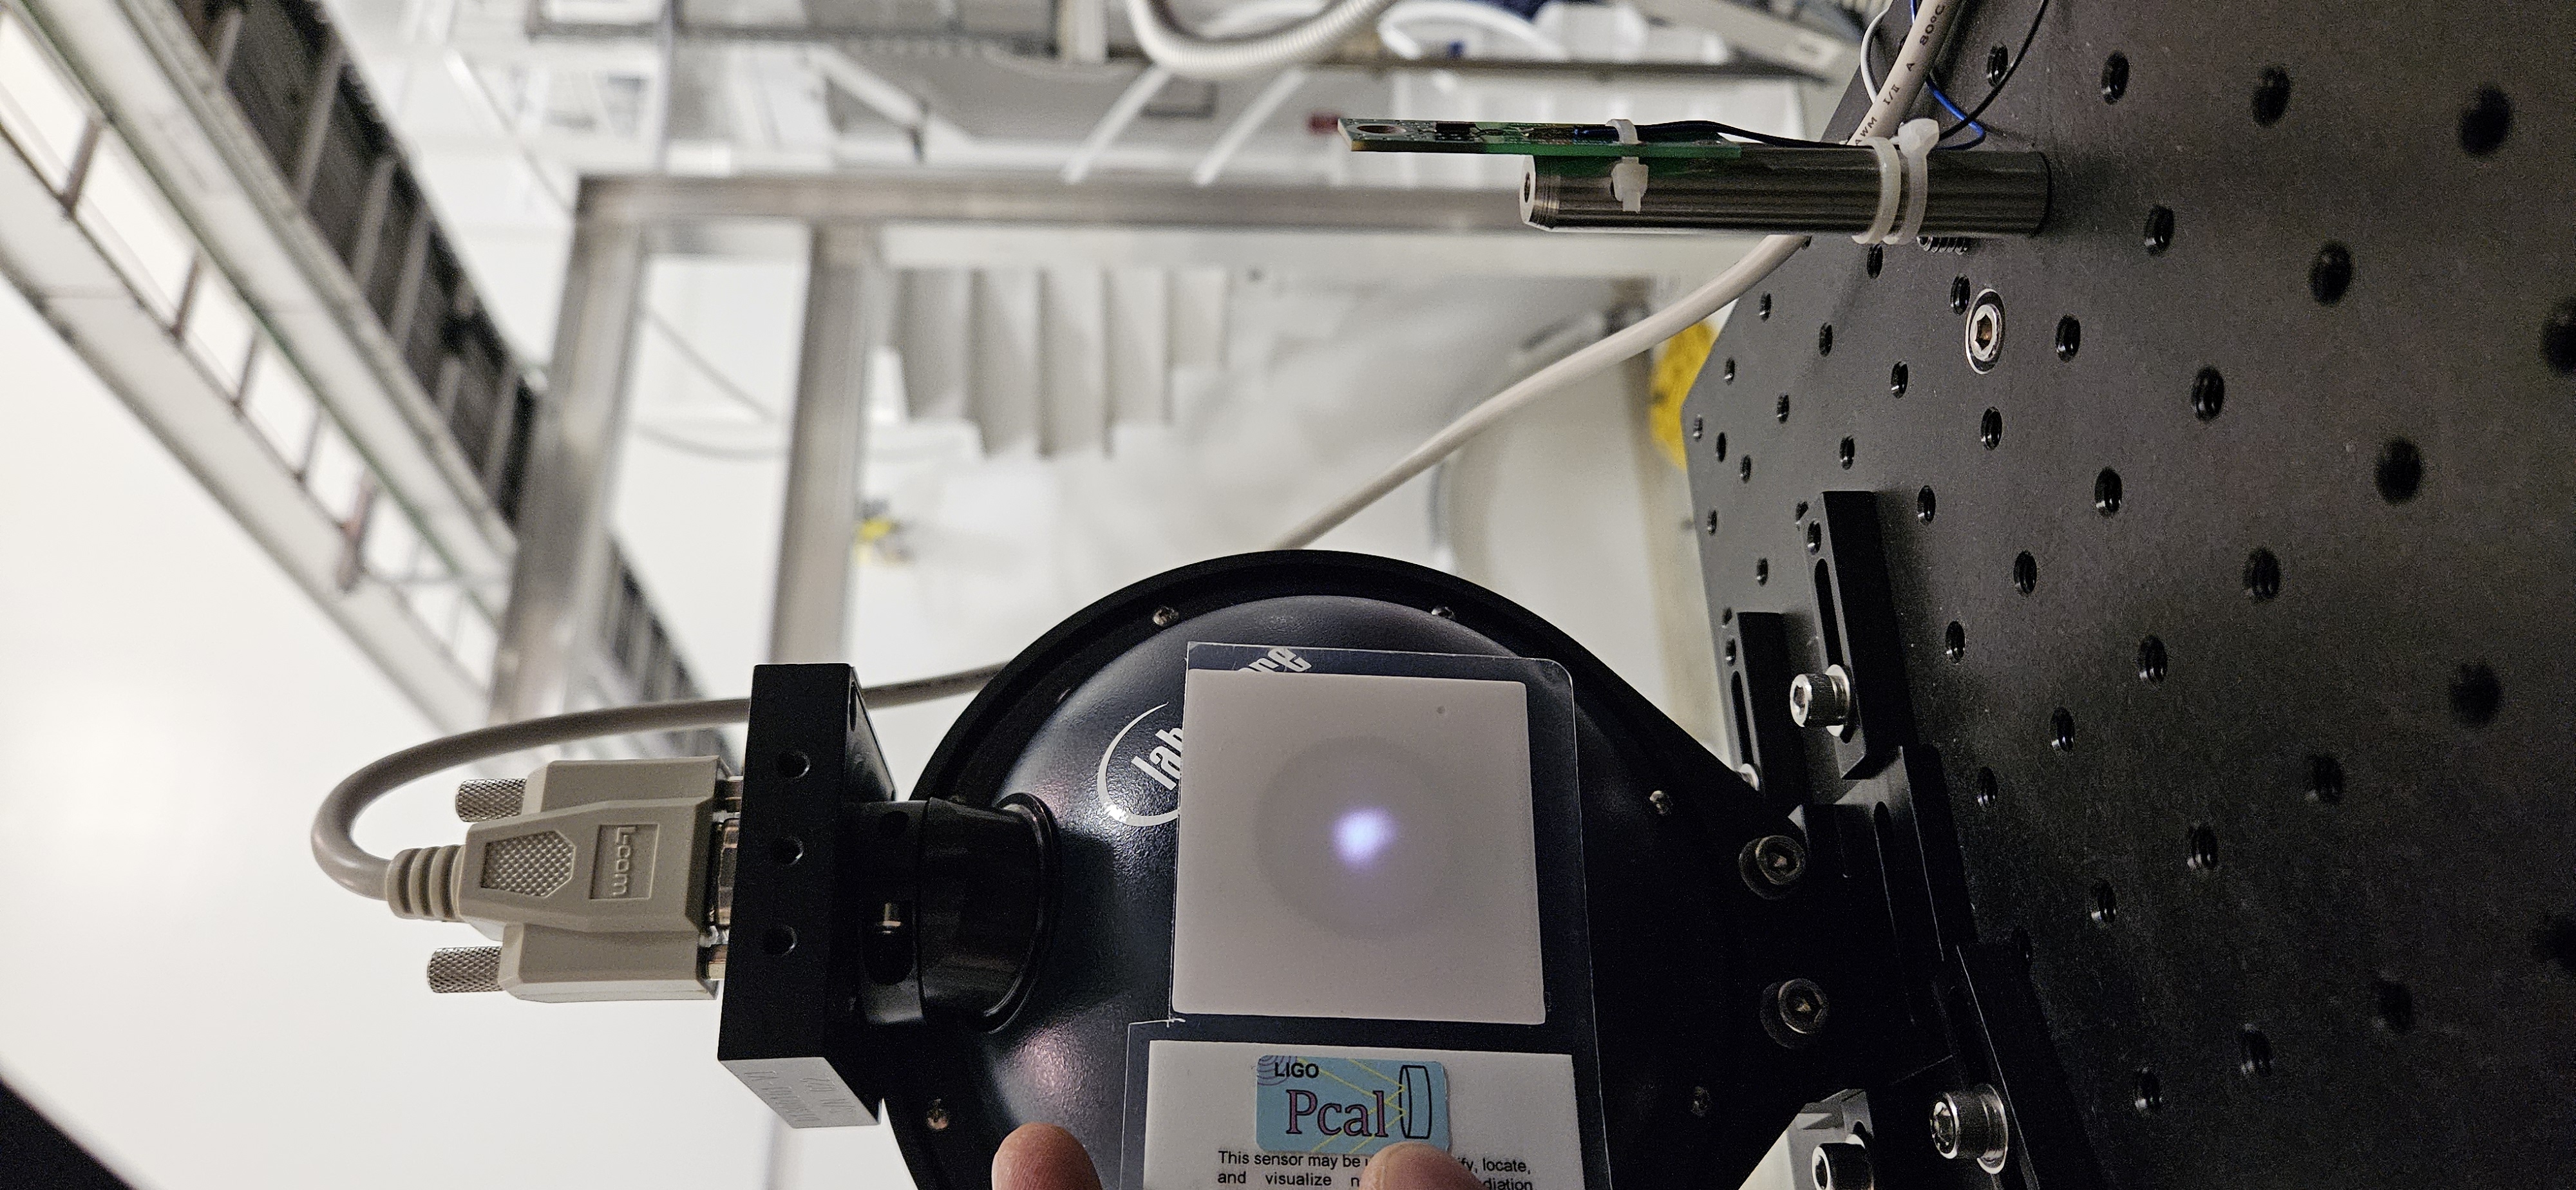
Obligitory Before and After beam spots on the apature of RX sphere.
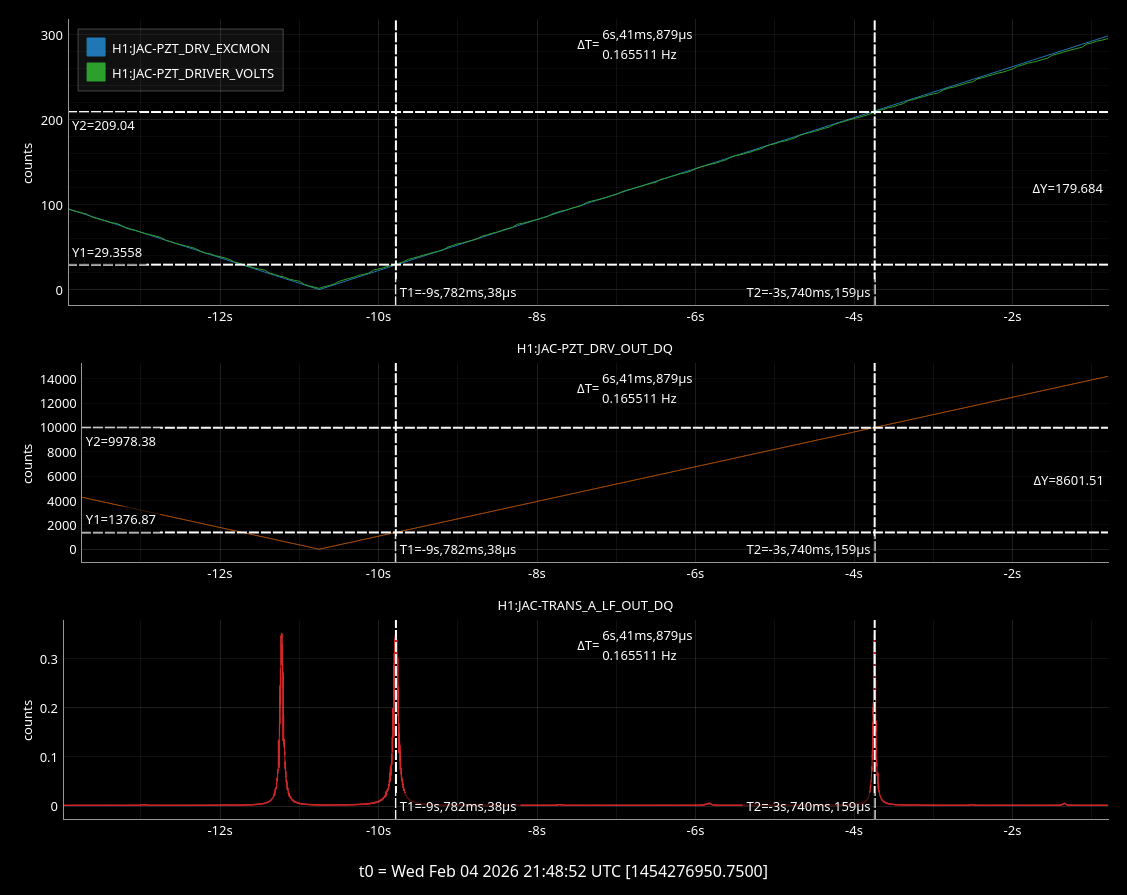
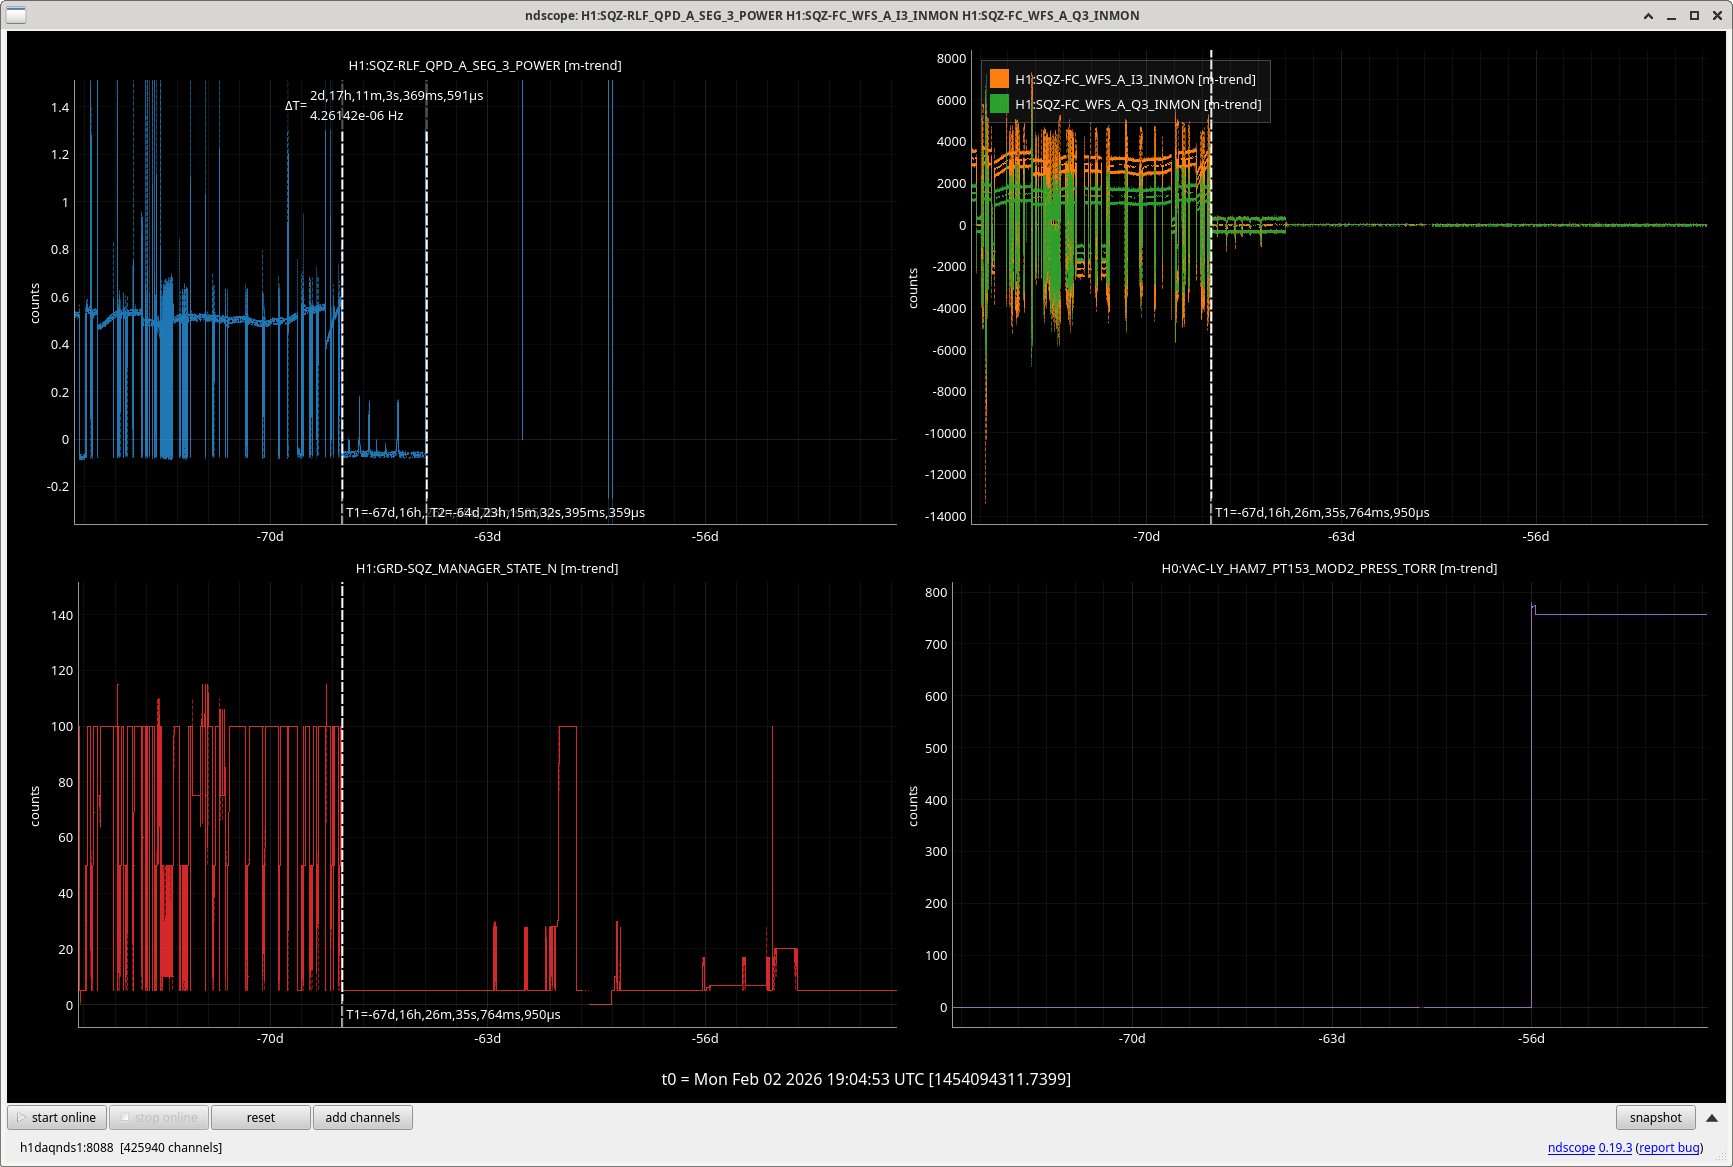
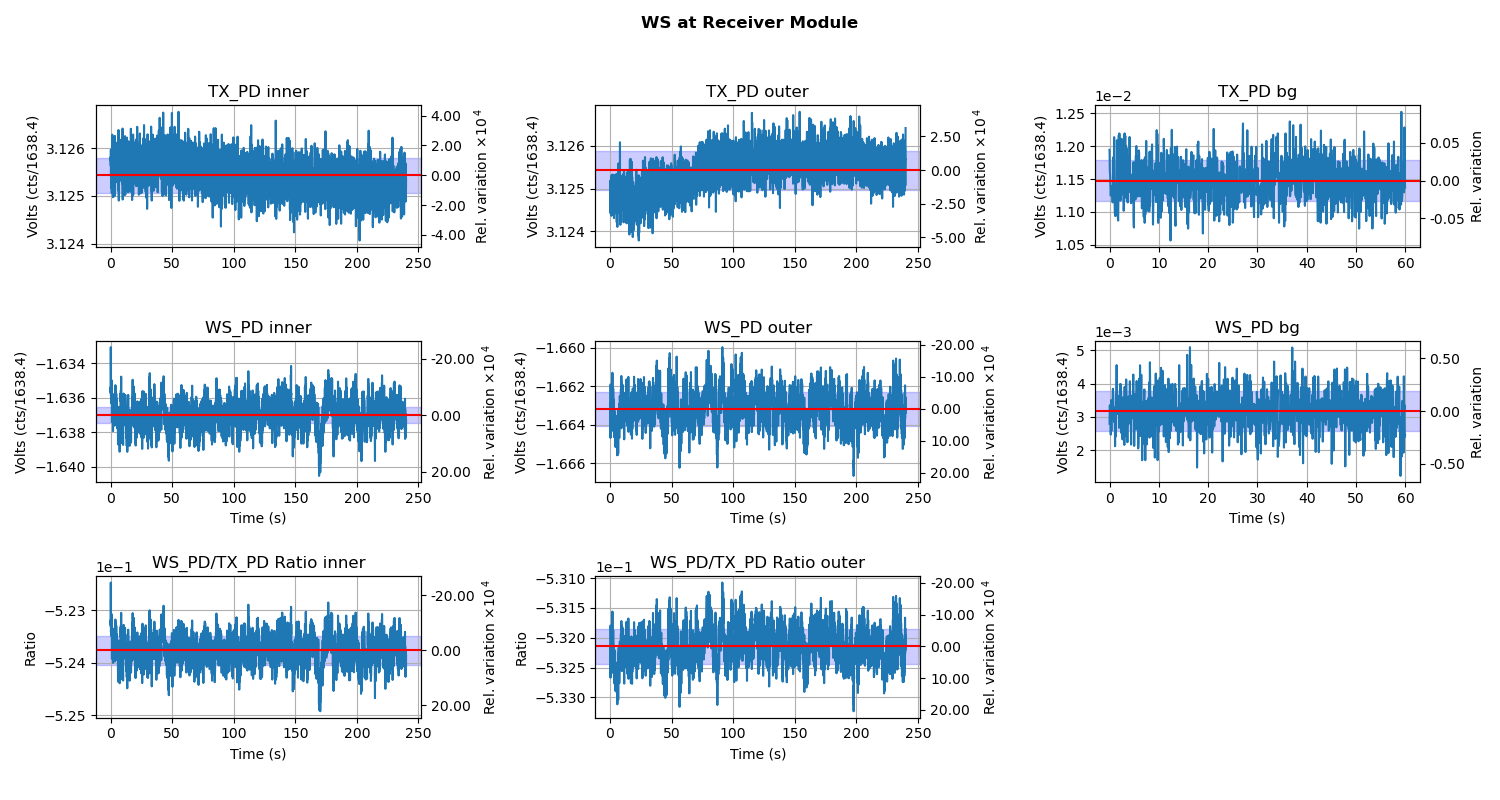
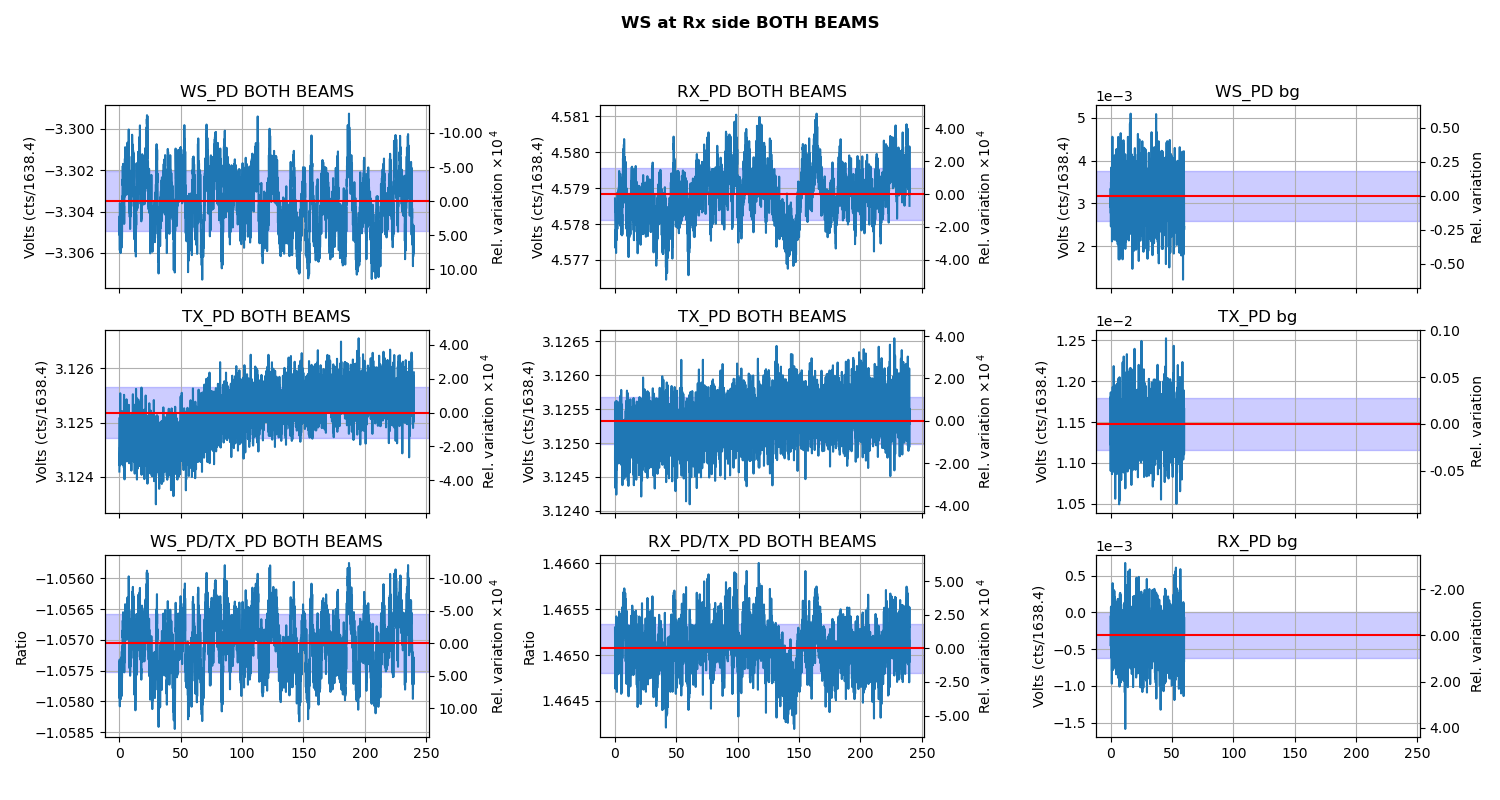
Data Analysis:
python3 generate_measurement_data.py --WS PS4 --date 2025-11-03
Reading in config file from python file in scripts
../../../Common/O4PSparams.yaml
PS4 rho, kappa, u_rel on 2025-11-03 corrected to ES temperature 299.4 K :
-4.701912257515925 -0.0002694340454223 2.686163396659873e-05
Copying the scripts into tD directory...
Connected to h1daqnds1
martel run
reading data at start_time: 1454177475
reading data at start_time: 1454177902
reading data at start_time: 1454178300
reading data at start_time: 1454179000
reading data at start_time: 1454179400
reading data at start_time: 1454179750
reading data at start_time: 1454179900
reading data at start_time: 1454180530
reading data at start_time: 1454180888
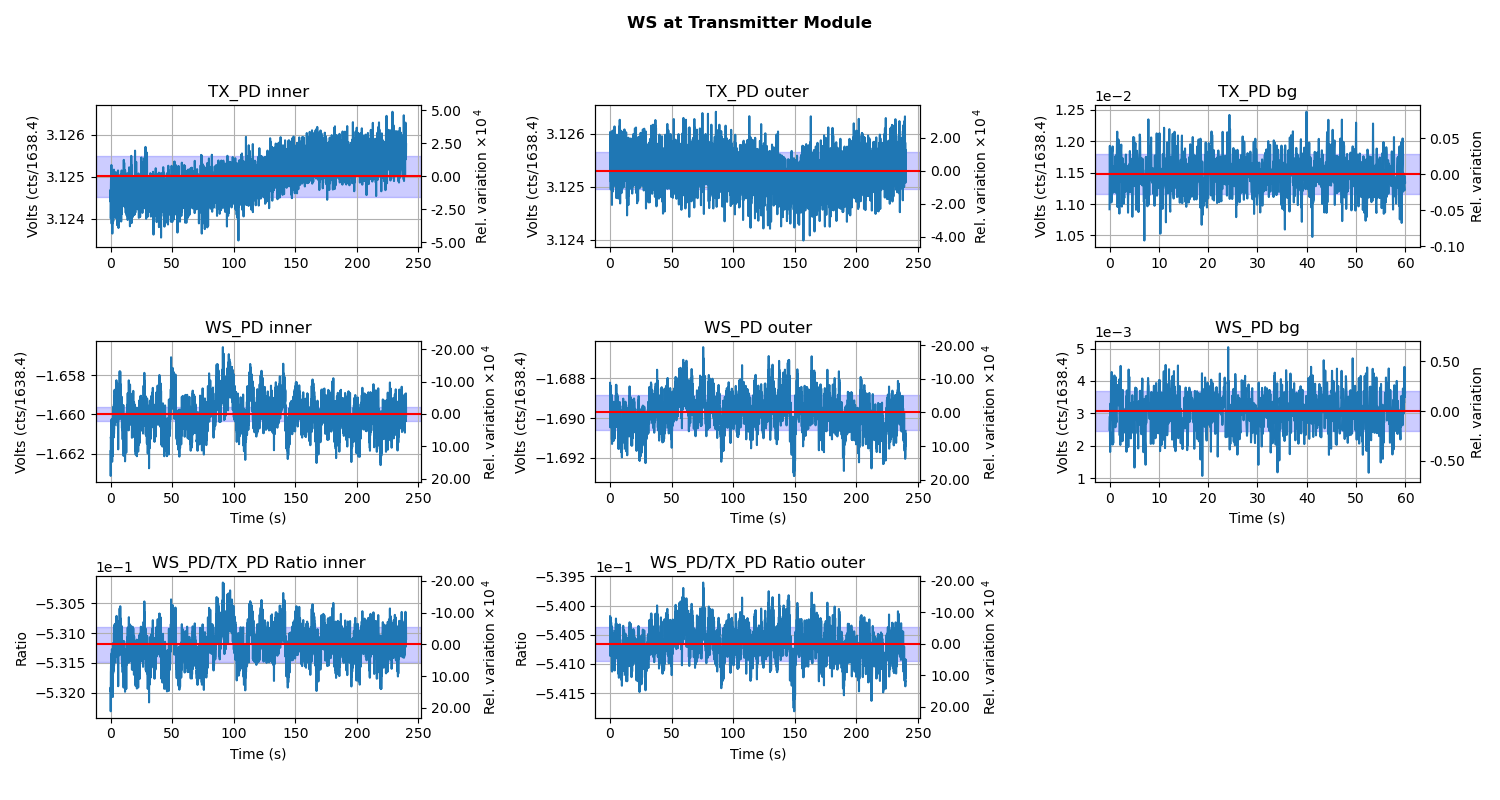
Ratios: -0.5341330662181019 -0.5436335114505099
writing nds2 data to files
finishing writing
Background Values:
bg1 = 18.796205; Background of TX when WS is at TX
bg2 = 5.033949; Background of WS when WS is at TX
bg3 = 18.801656; Background of TX when WS is at RX
bg4 = 5.198797; Background of WS when WS is at RX
bg5 = 18.803508; Background of TX
bg6 = -0.514446; Background of RX
The uncertainty reported below are Relative Standard Deviation in percent
Intermediate Ratios
RatioWS_TX_it = -0.534133;
RatioWS_TX_ot = -0.543634;
RatioWS_TX_ir = -0.526715;
RatioWS_TX_or = -0.535124;
RatioWS_TX_it_unc = 0.054072;
RatioWS_TX_ot_unc = 0.053357;
RatioWS_TX_ir_unc = 0.053158;
RatioWS_TX_or_unc = 0.054774;
Optical Efficiency
OE_Inner_beam = 0.986243;
OE_Outer_beam = 0.984385;
Weighted_Optical_Efficiency = 0.985314;
OE_Inner_beam_unc = 0.041515;
OE_Outer_beam_unc = 0.041813;
Weighted_Optical_Efficiency_unc = 0.058922;
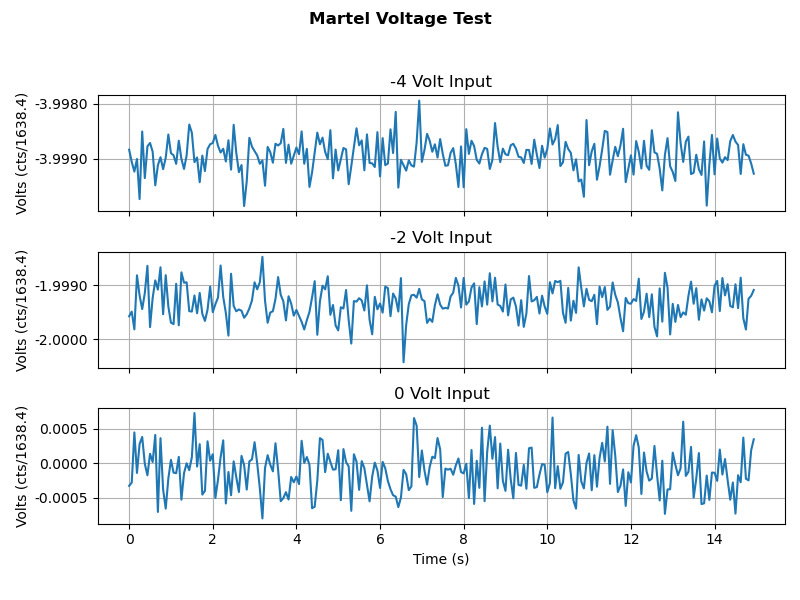
Martel Voltage fit:
Gradient = 1637.852893;
Intercept = 0.265584;
Power Imbalance = 0.982524;
Endstation Power sensors to WS ratios::
Ratio_WS_TX = -0.927845;
Ratio_WS_RX = -1.384820;
Ratio_WS_TX_unc = 0.044117;
Ratio_WS_RX_unc = 0.038945;
=============================================================
============= Values for Force Coefficients =================
=============================================================
Key Pcal Values :
GS = -5.135100; Gold Standard Value in (V/W)
WS = -4.701912; Working Standard Value
costheta = 0.988362; Angle of incidence
c = 299792458.000000; Speed of Light
End Station Values :
TXWS = -0.927845; Tx to WS Rel responsivity (V/V)
sigma_TXWS = 0.000409; Uncertainity of Tx to WS Rel responsivity (V/V)
RXWS = -1.384820; Rx to WS Rel responsivity (V/V)
sigma_RXWS = 0.000539; Uncertainity of Rx to WS Rel responsivity (V/V)
e = 0.985314; Optical Efficiency
sigma_e = 0.000581; Uncertainity in Optical Efficiency
Martel Voltage fit :
Martel_gradient = 1637.852893; Martel to output channel (C/V)
Martel_intercept = 0.265584; Intercept of fit of Martel to output (C/V)
Power Loss Apportion :
beta = 0.998844; Ratio between input and output (Beta)
E_T = 0.992056; TX Optical efficiency
sigma_E_T = 0.000292; Uncertainity in TX Optical efficiency
E_R = 0.993204; RX Optical Efficiency
sigma_E_R = 0.000293; Uncertainity in RX Optical efficiency
Force Coefficients :
FC_TxPD = 9.154540e-13; TxPD Force Coefficient
FC_RxPD = 6.225064e-13; RxPD Force Coefficient
sigma_FC_TxPD = 4.888564e-16; TxPD Force Coefficient
sigma_FC_RxPD = 3.063586e-16; RxPD Force Coefficient
data written to ../../measurements/LHO_EndY/tD20260203/


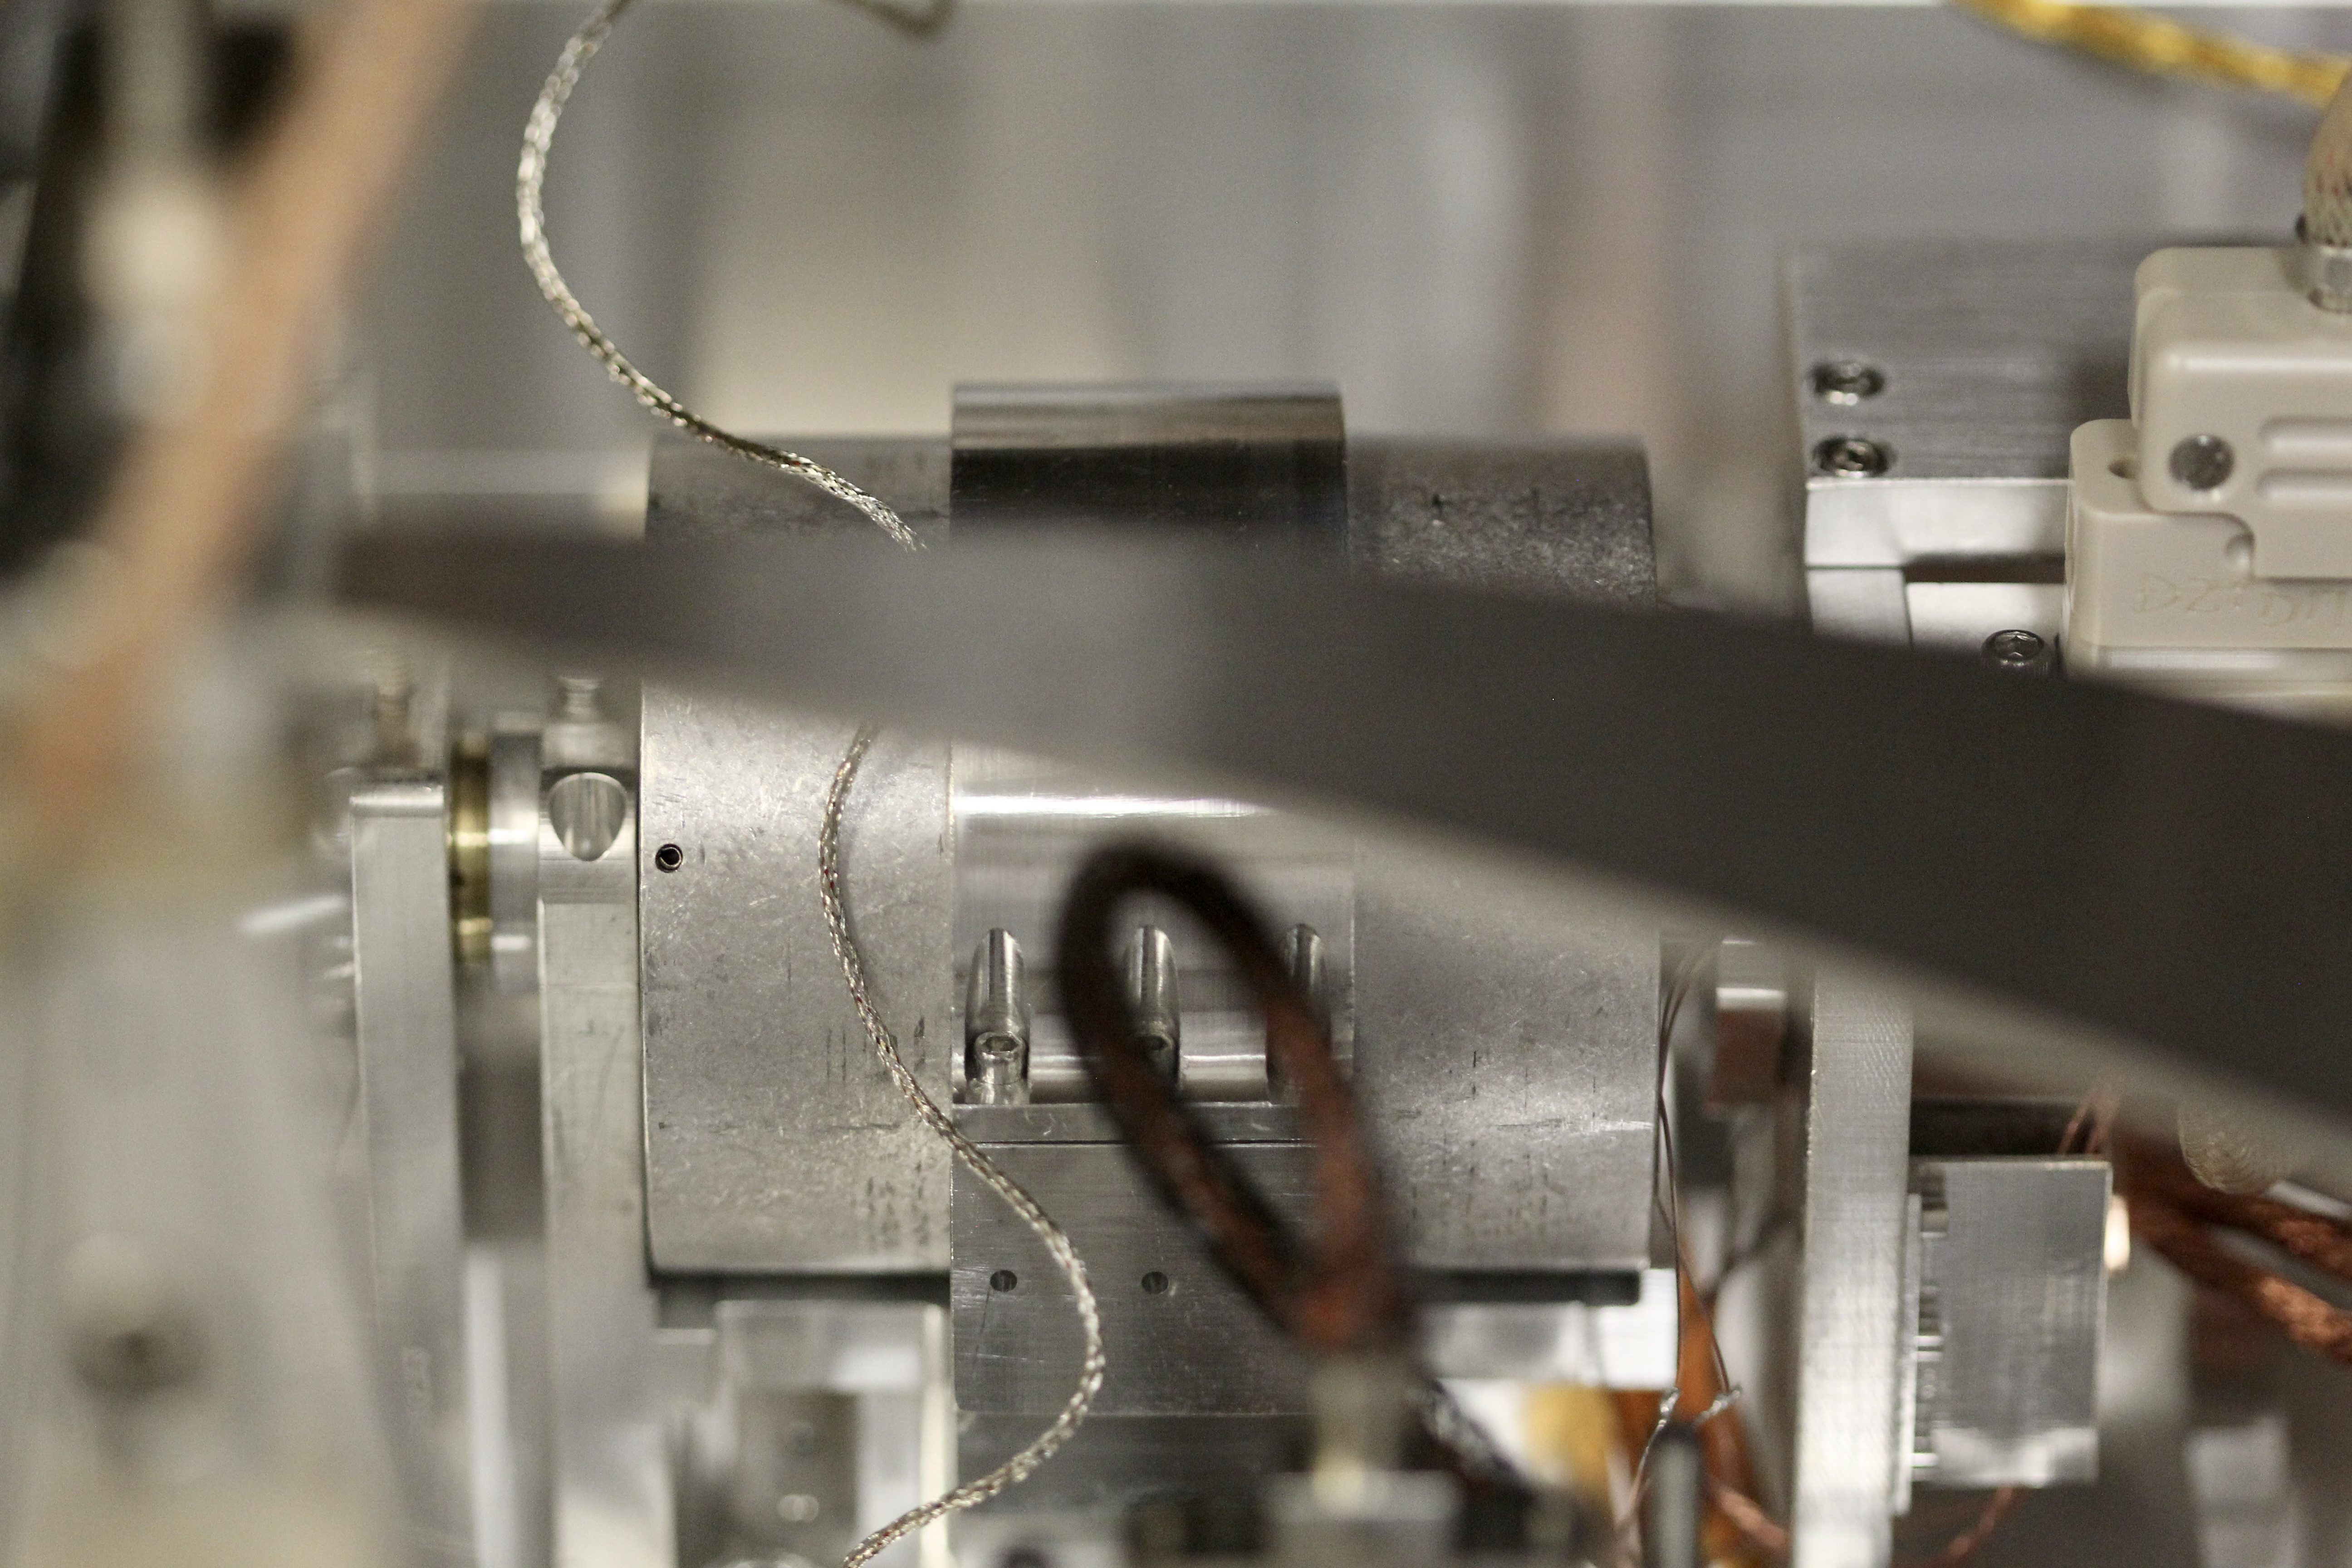
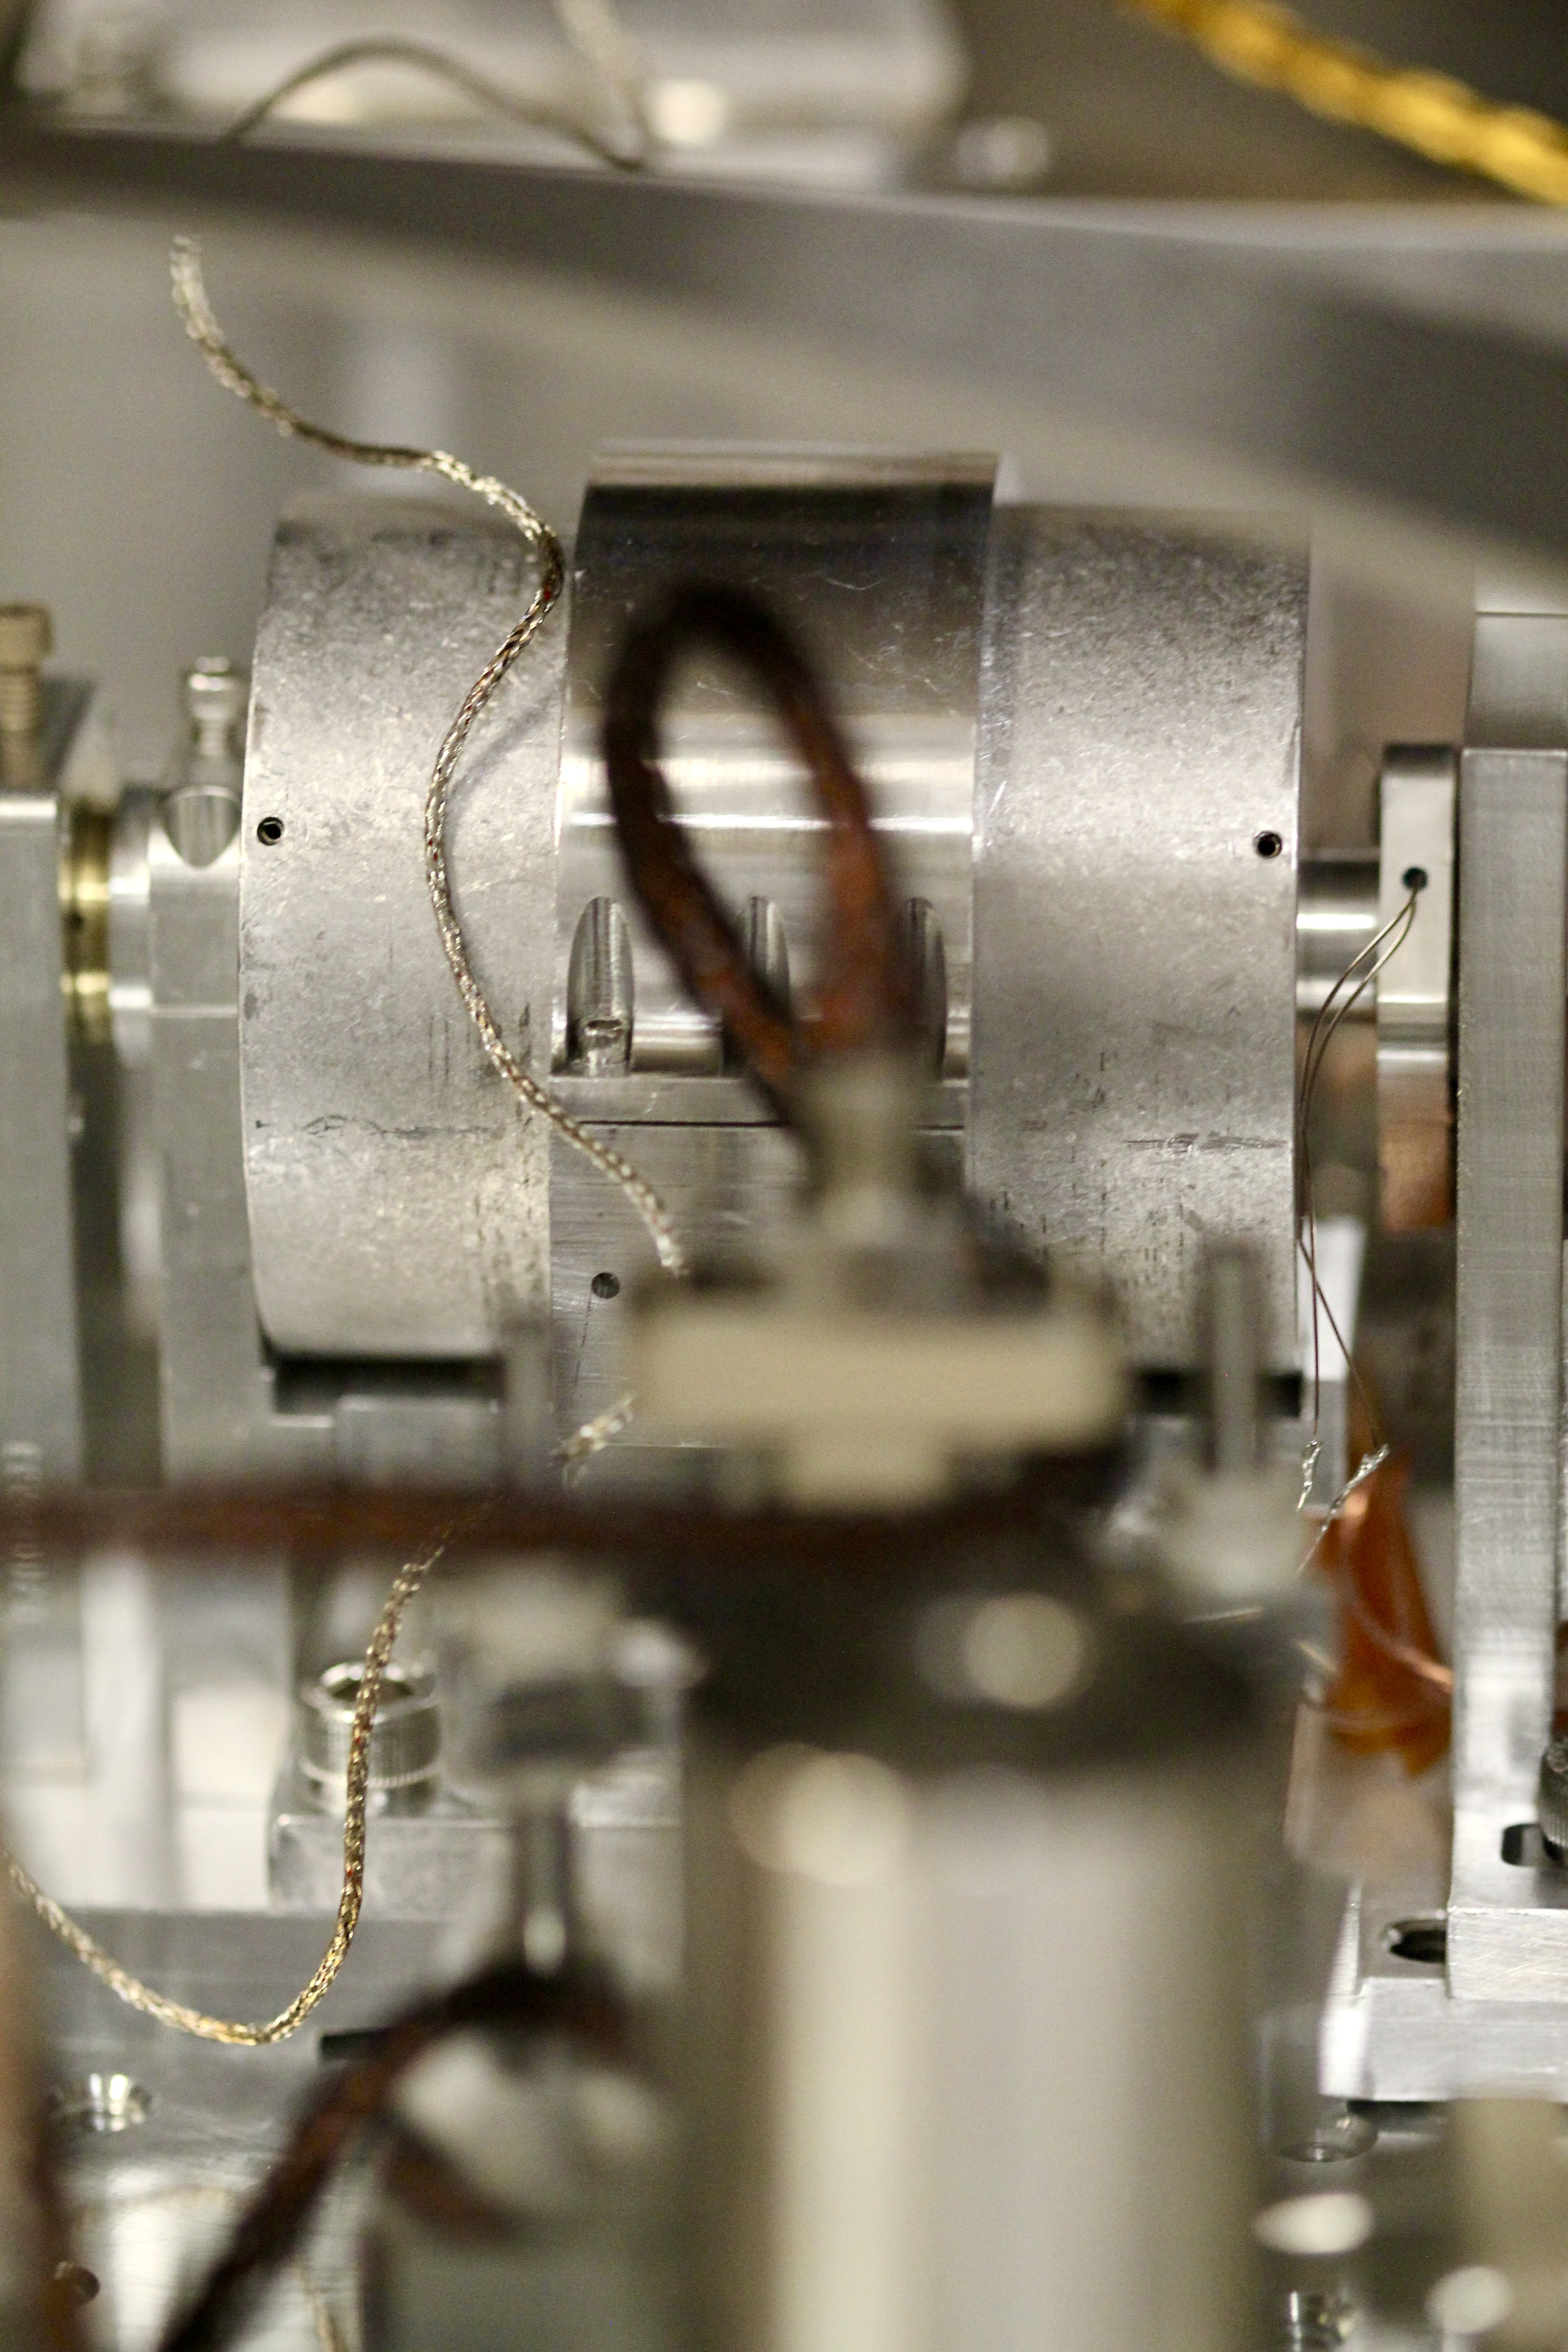
TX module maintenance of End Y was done with reference to T1600436-v12.
| Date | Feb 3rd 2026 | |
| Laser Shutter Check | Pass | |
| Max OFS Offset | 8 | |
| 95% OFS Offset | 7.6 | |
| Operating OFS Offset | 3.8 | |
| Laser Output Power | 1.94W | |
| After-Laser Rejected Power | 3.96mW | |
| AOM Input Power | 1.88W | |
| Max Diffracted Power | 1.58 W | |
| Un-Diffracted Power | 155mW | |
| AOM Diffraction Efficiency | 84.04% | |
| After-AOM Rejected Power | 13.9mW | |
| TxPD Power | 13.7mW | |
| OFSPD Power | 6.59mW | |
| Outer Beam Power | 0.747W | |
| Inner Beam Power | 0.744W | |
| Output Beam Power Ratio | 0.995 | |
| OFS Gain | 37.79 | |
| OFS Phase Margin | 57.6 |