Summary
Whatever happened to IM1, Rahul did make it better again. Reasons for improvement is unknown but we proceeded with the alignment and we're mostly done.
There is a mystery scattering or maybe clipping somewhere close to the IFI output but not on the output baffle nor DKDP baffle. It could be a scatter from the CWP surface, or a ghost beam somewhere, or something else. It will take a LONG time to diagnose this, and quite likely this existed for a long time. I'm tempted to leave it at this time. But I'll try to take some more pictures.
There's also something weird about the 1st pico mirror PIT actuator for ISS array.
We'd still like to take pictures/measurements here and there on Tuesday.
Done: ASC REFL centering
Following the morning work (alog 90525), REFL ASC censors were centered using RM1 and RM2. About ~30% of DAC range was used for RM2 (RMs_happy_again.png). FYI, using flash peak, [P,Y]=[-0.003, 0.015] for REFL_A and [-0.020, 0.001] for REFL_B. (Doesn't matter how close these are to zero as far as they're within +-0.1 or so and the SUM is decent, but it feels better to be able to get close to zero.)
Done: ISS array centering
Then we looked at the ISS array and the QPD was not centered. A quick adjustment of the second pico that is closer to the array was all it needed (keita_ISS_happy1.png). [P, Y]=[-0.03, 0.05].
Done: IFO REFL baffle (HA13) adjustment
We looked at the IFO REFL baffle (HA13) in front of the HAM2-HAM3 septum window and it was too high even though it was not clipping, so we lowered it by a couple mm. Before: lower edge height = 105.5mm; upper edge = 206.8mm. After: lower edge = 103.6mm; upper edge = 204.5mm.
This baffle was already moved by a couple mm in +Y direction last week (because the beam was closer to +Y edge). See IFOREFL_baffle_before_relocation.jpg and IFOREFL_baffle_after_relocation.jpg though it might be difficult to see the difference from this picture.
IFO REFL beam looked like IFOREFL_HA13_baffle_after.mov after the height adjustment.
Mystery flashes seen inside IFI output baffle aperture
We proceeded to check the IFI output baffle and I was bothered to find that something that looked like clipping was visible close to the left edge of the baffle using the IR camera. See IFI_OUT_clipped_720p.mov, this is a view from +Y door. But this was less frequent than the flashing itself. In a retrospect, this was probably the reflection from the PRM when the beam was swinging to the left of the video, but anyway we did various things:
- We got suspicious about PRM somehow misaligned, checked it on the retroreflection check iris but it was fine in YAW (it was off in PIT so changed PIT offset from -1185 to -1115, not sure if it was PRM that changed or something else, but the important thing was that it wasn't off in YAW and that this is not something that I worry about now that we have a decent headroom for RM2 DAC).
- We closed the HAM3 door cover (which did quiet down the beam motion a lot) as well as the HAM2 -Y door cover. I used IR viewer and thought that nothing changed at the time. The bright thing didn't disappear after blocking the beam between PRM and IM4, again using the IR viewer, I thought.
- However, revieweing videos shot later, I haven't found anything to the left of the output baffle after the beam motion was reduced by closing unnecessary open door covers. But that revealed the next issue.
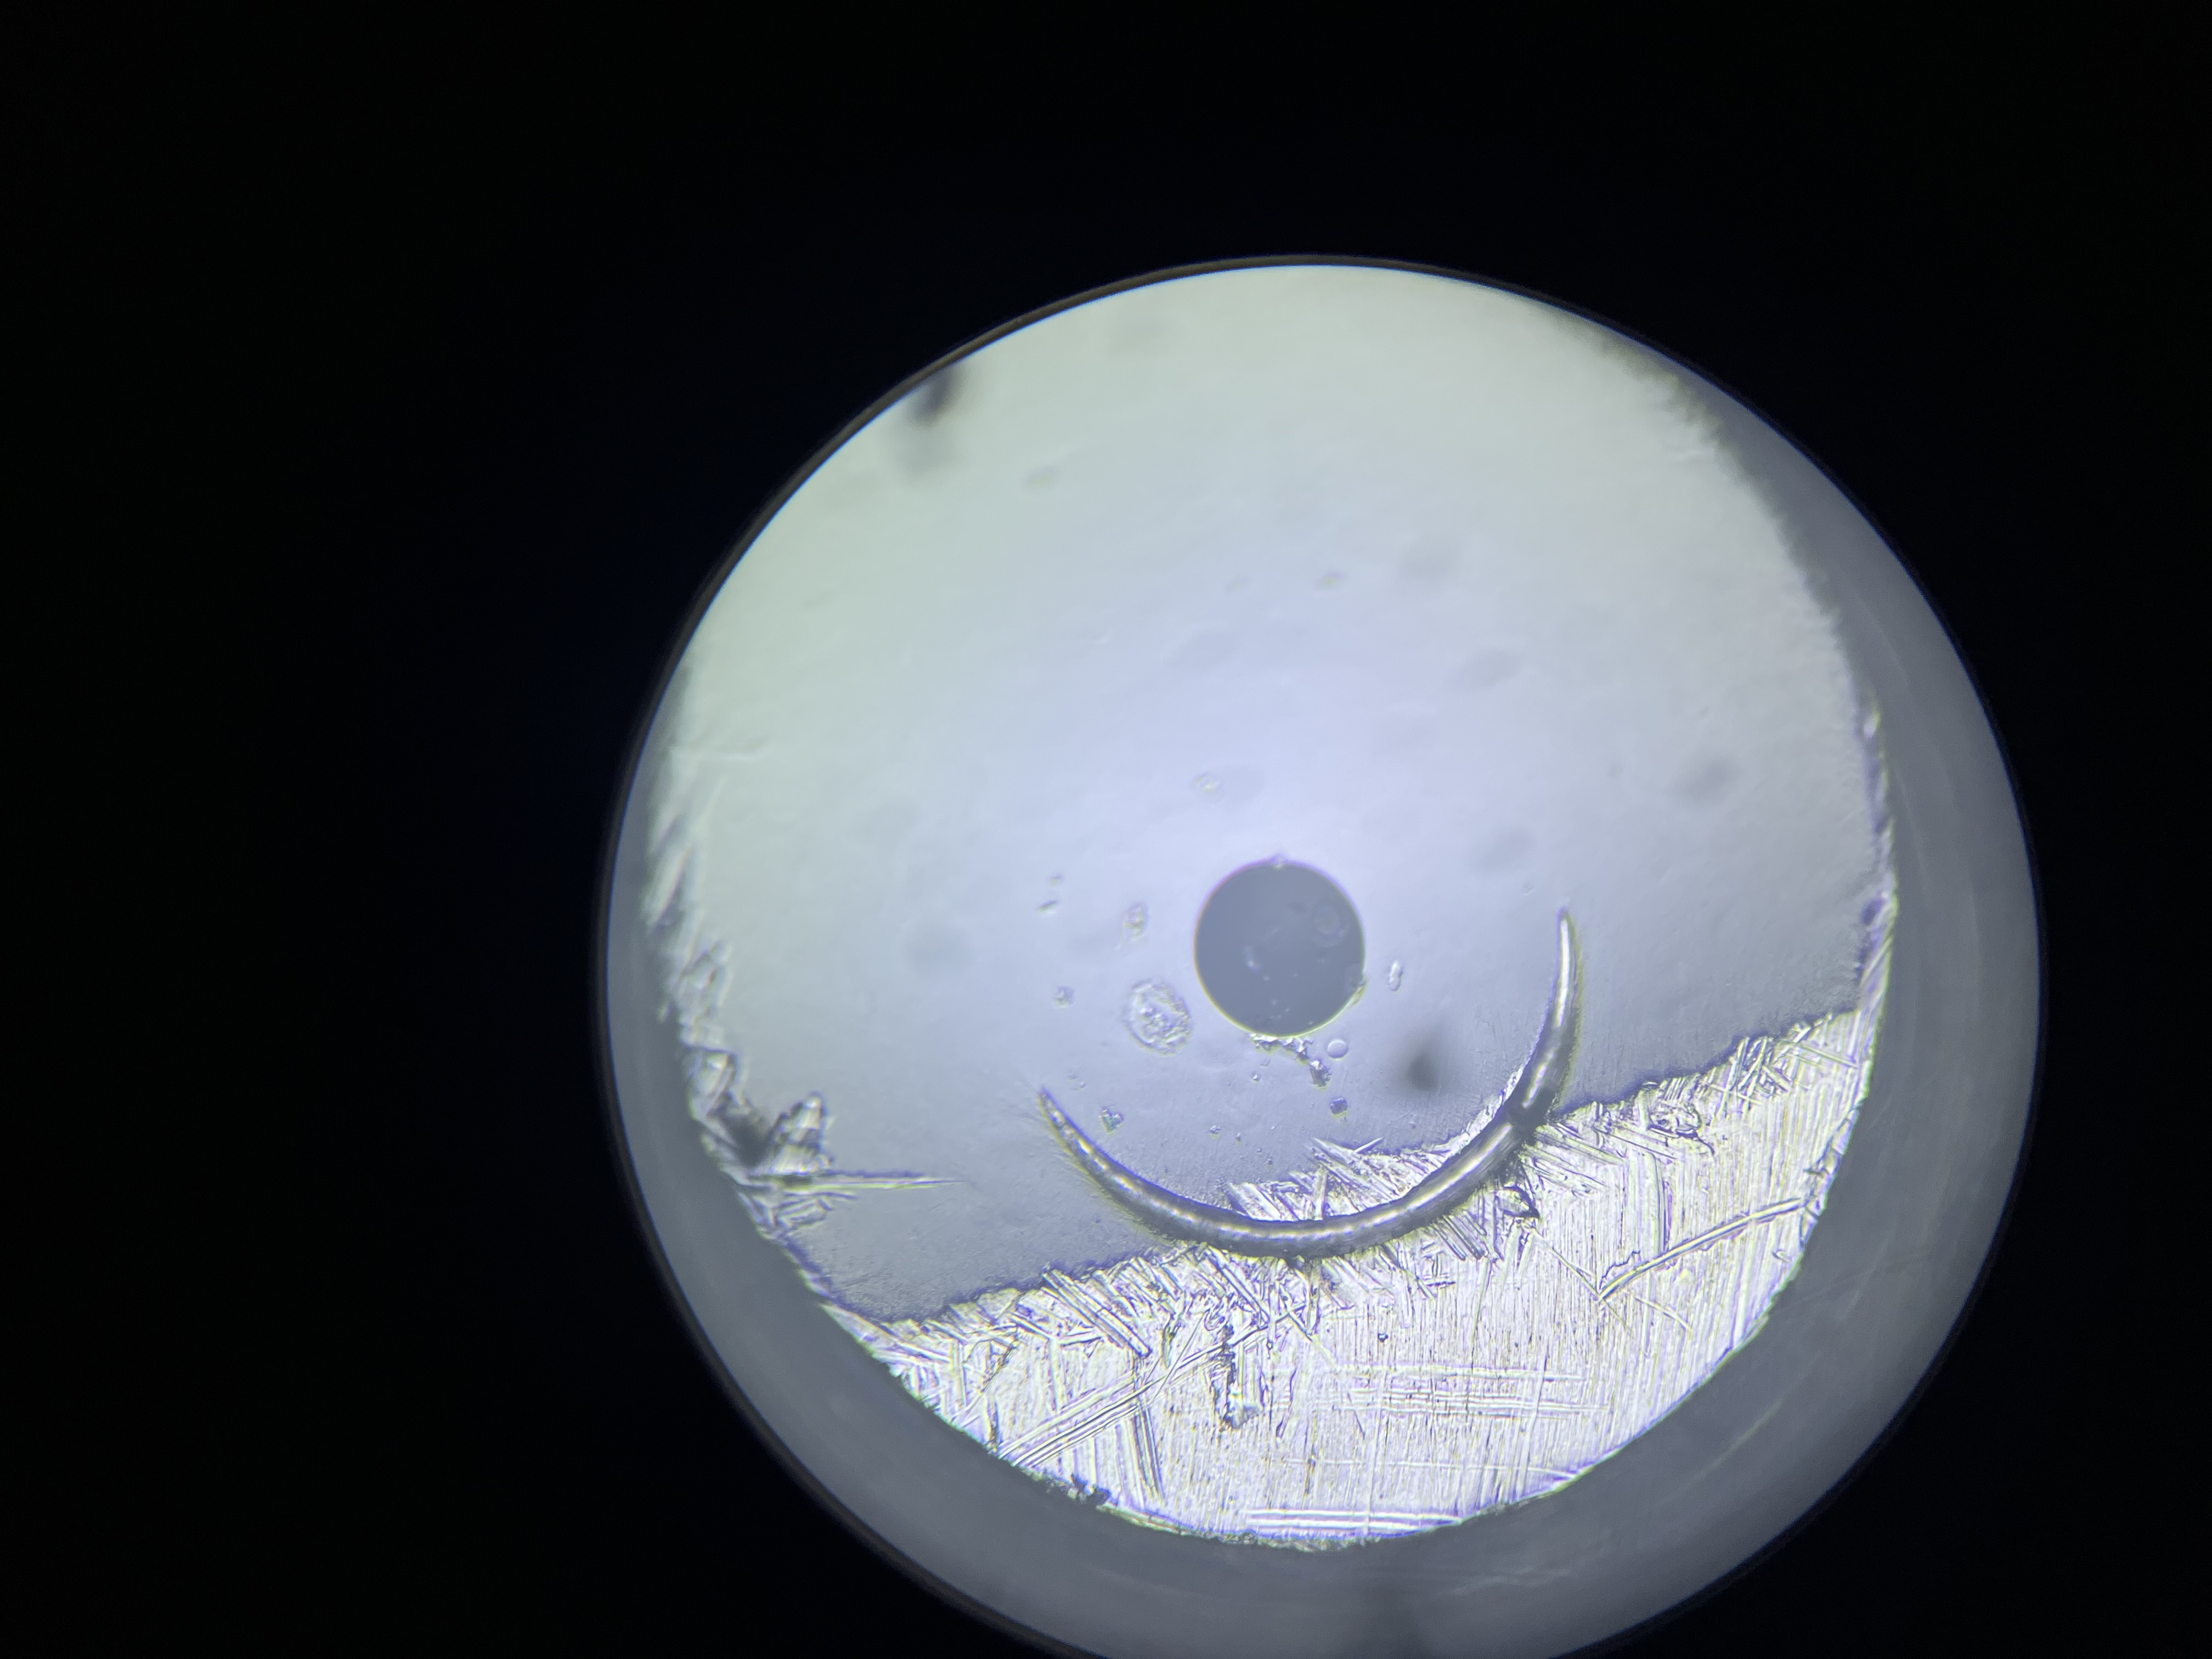
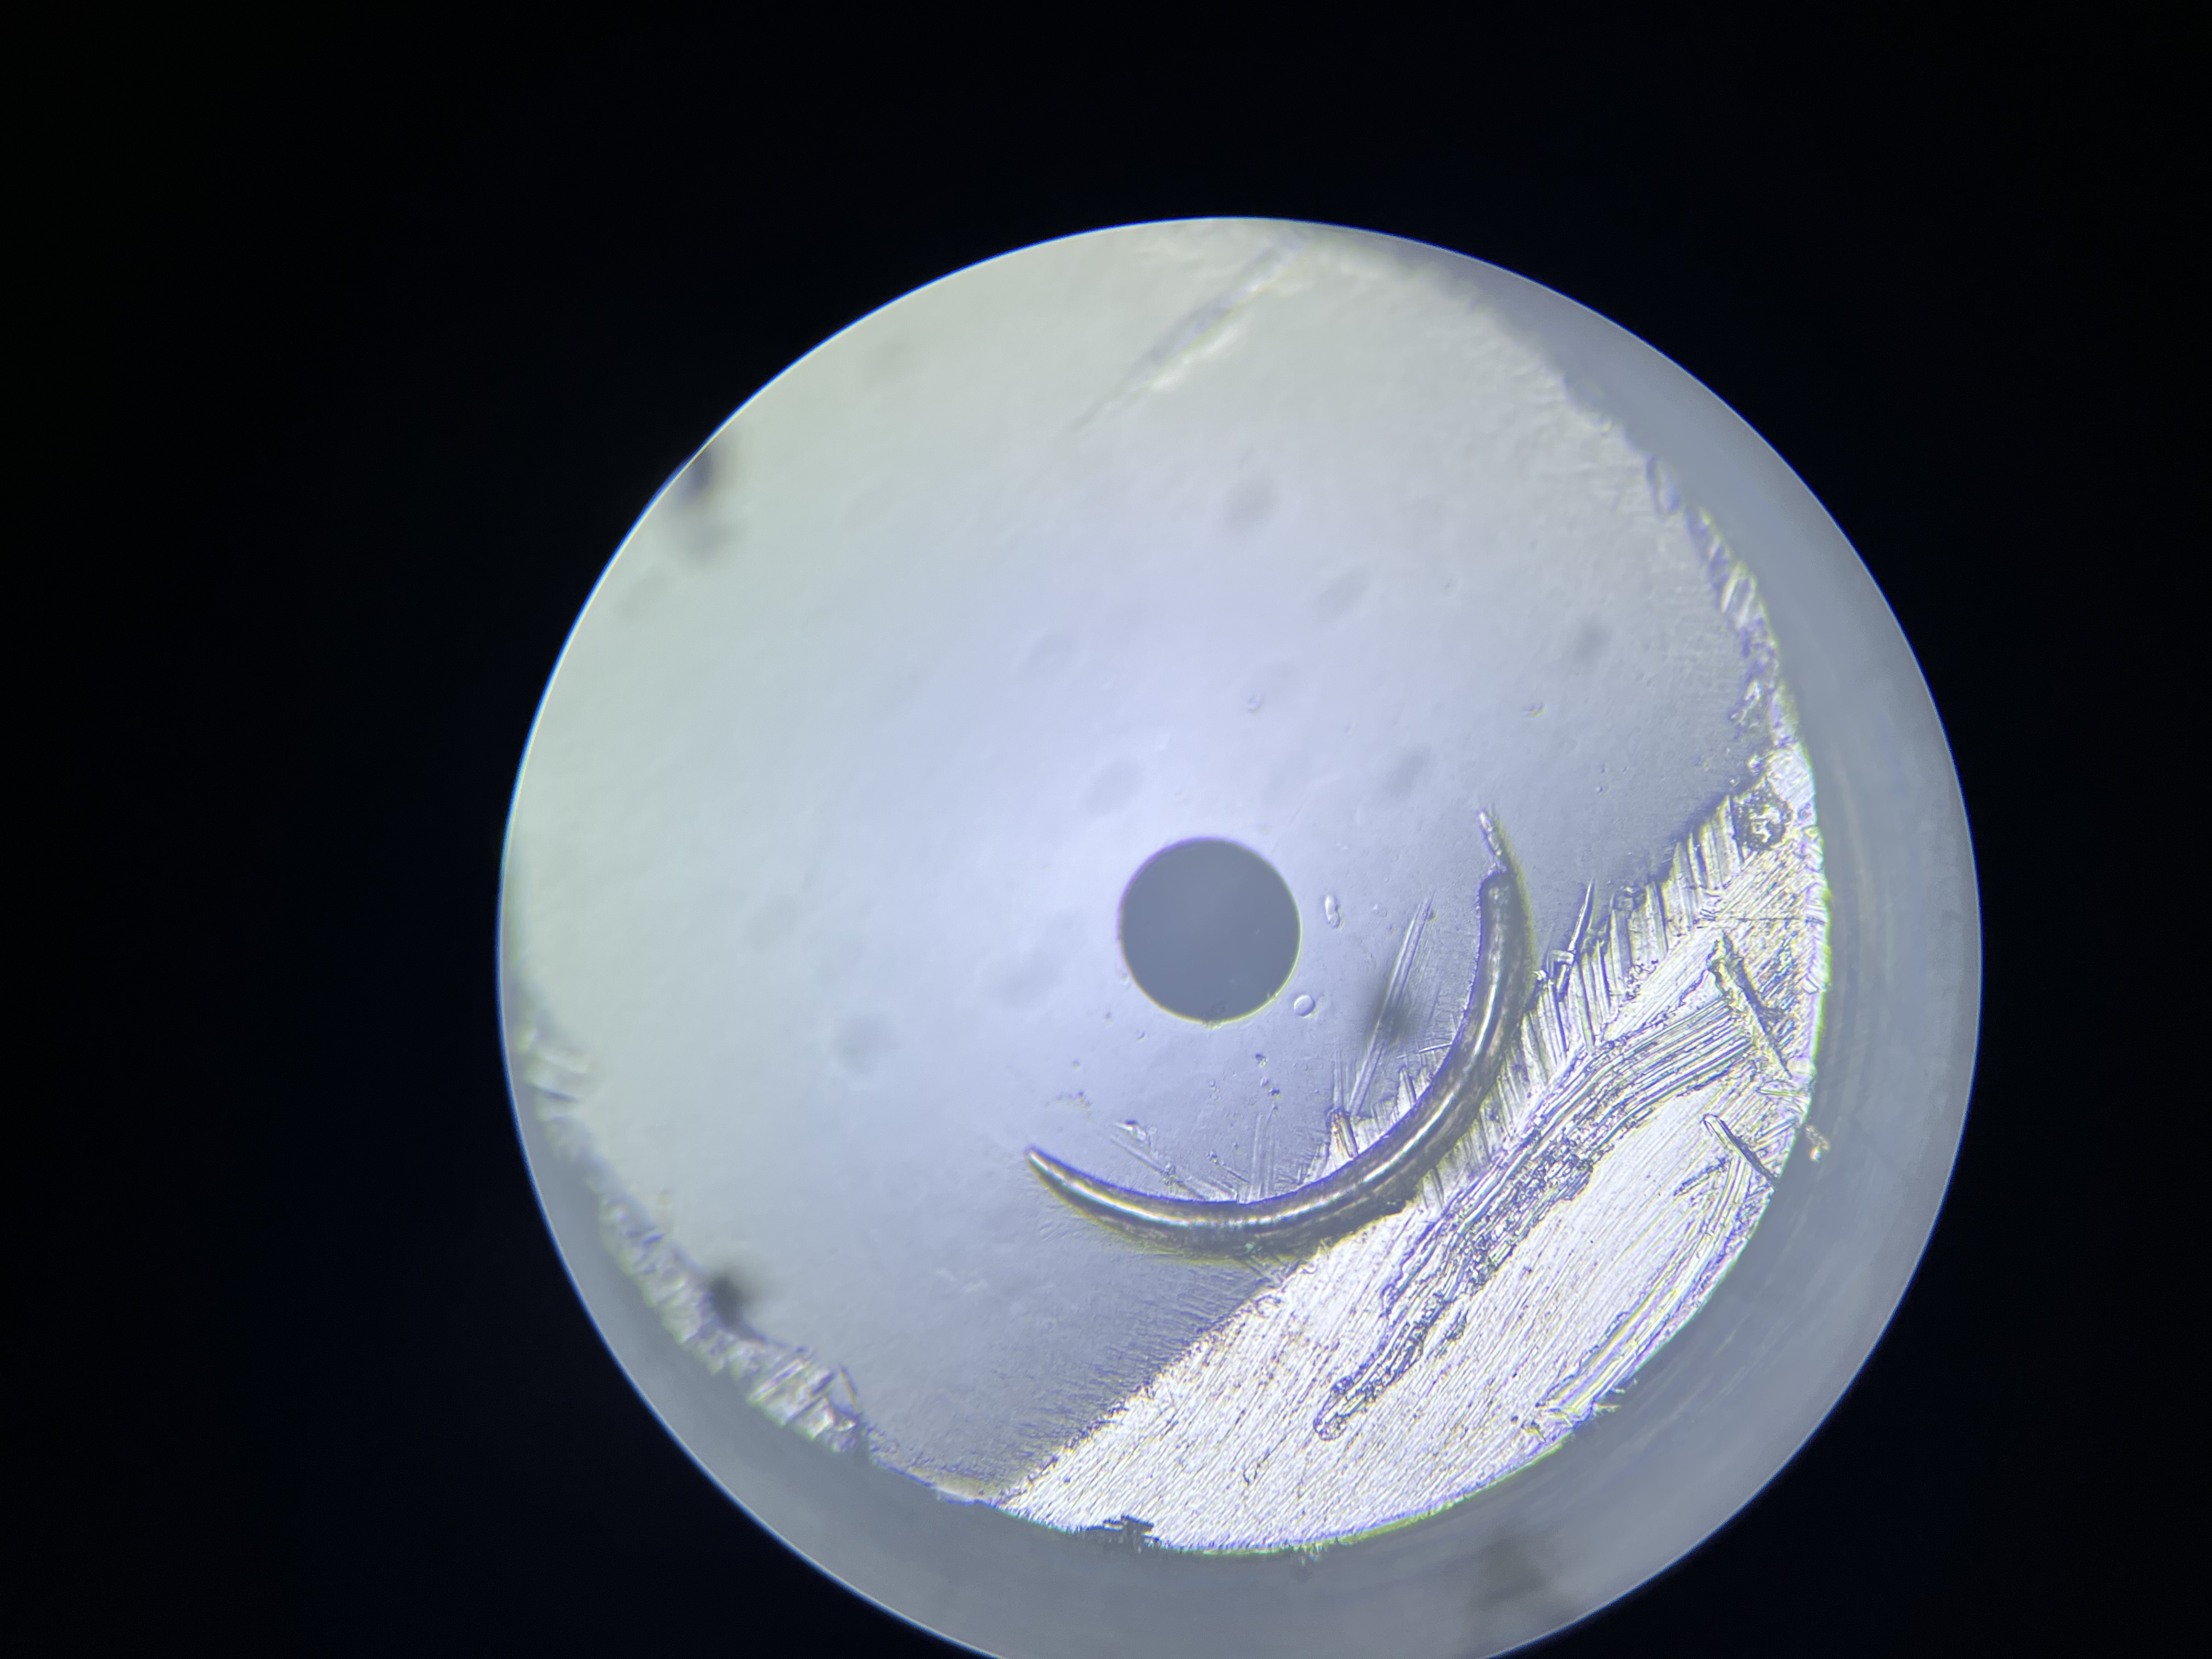
See IFI_out_another_view.mov, this is after the beam quieted down enough and after PRM PIT was changed. The bright thing at the left side of the baffle hole is not visible any more, but you can still see bright-ish scattering of some sort inside the baffle aperture which was there even when Rahul blocked the beam between PRM and IM4. IFI_out_another_view.jpg shows the same thing but with more useful exposure. This is concerning.
DKDP baffle behind the IFI output cwp baffle looked OK (IFI_DKDP_baffle.mp4). BTW, as was reported before, it looked to us that the IFI output baffle has an offset in -X+Y direction relative to DKDP. In the video, the beam on DKDP is slightly biased to the right on average because we tried to split the difference between two baffles.
We moved IM1 in YAW by +-200urad while observing the IFI output by IR viewer to see if there is a better beam position on IFI output. It seemed to me that actually we don't have much space here.
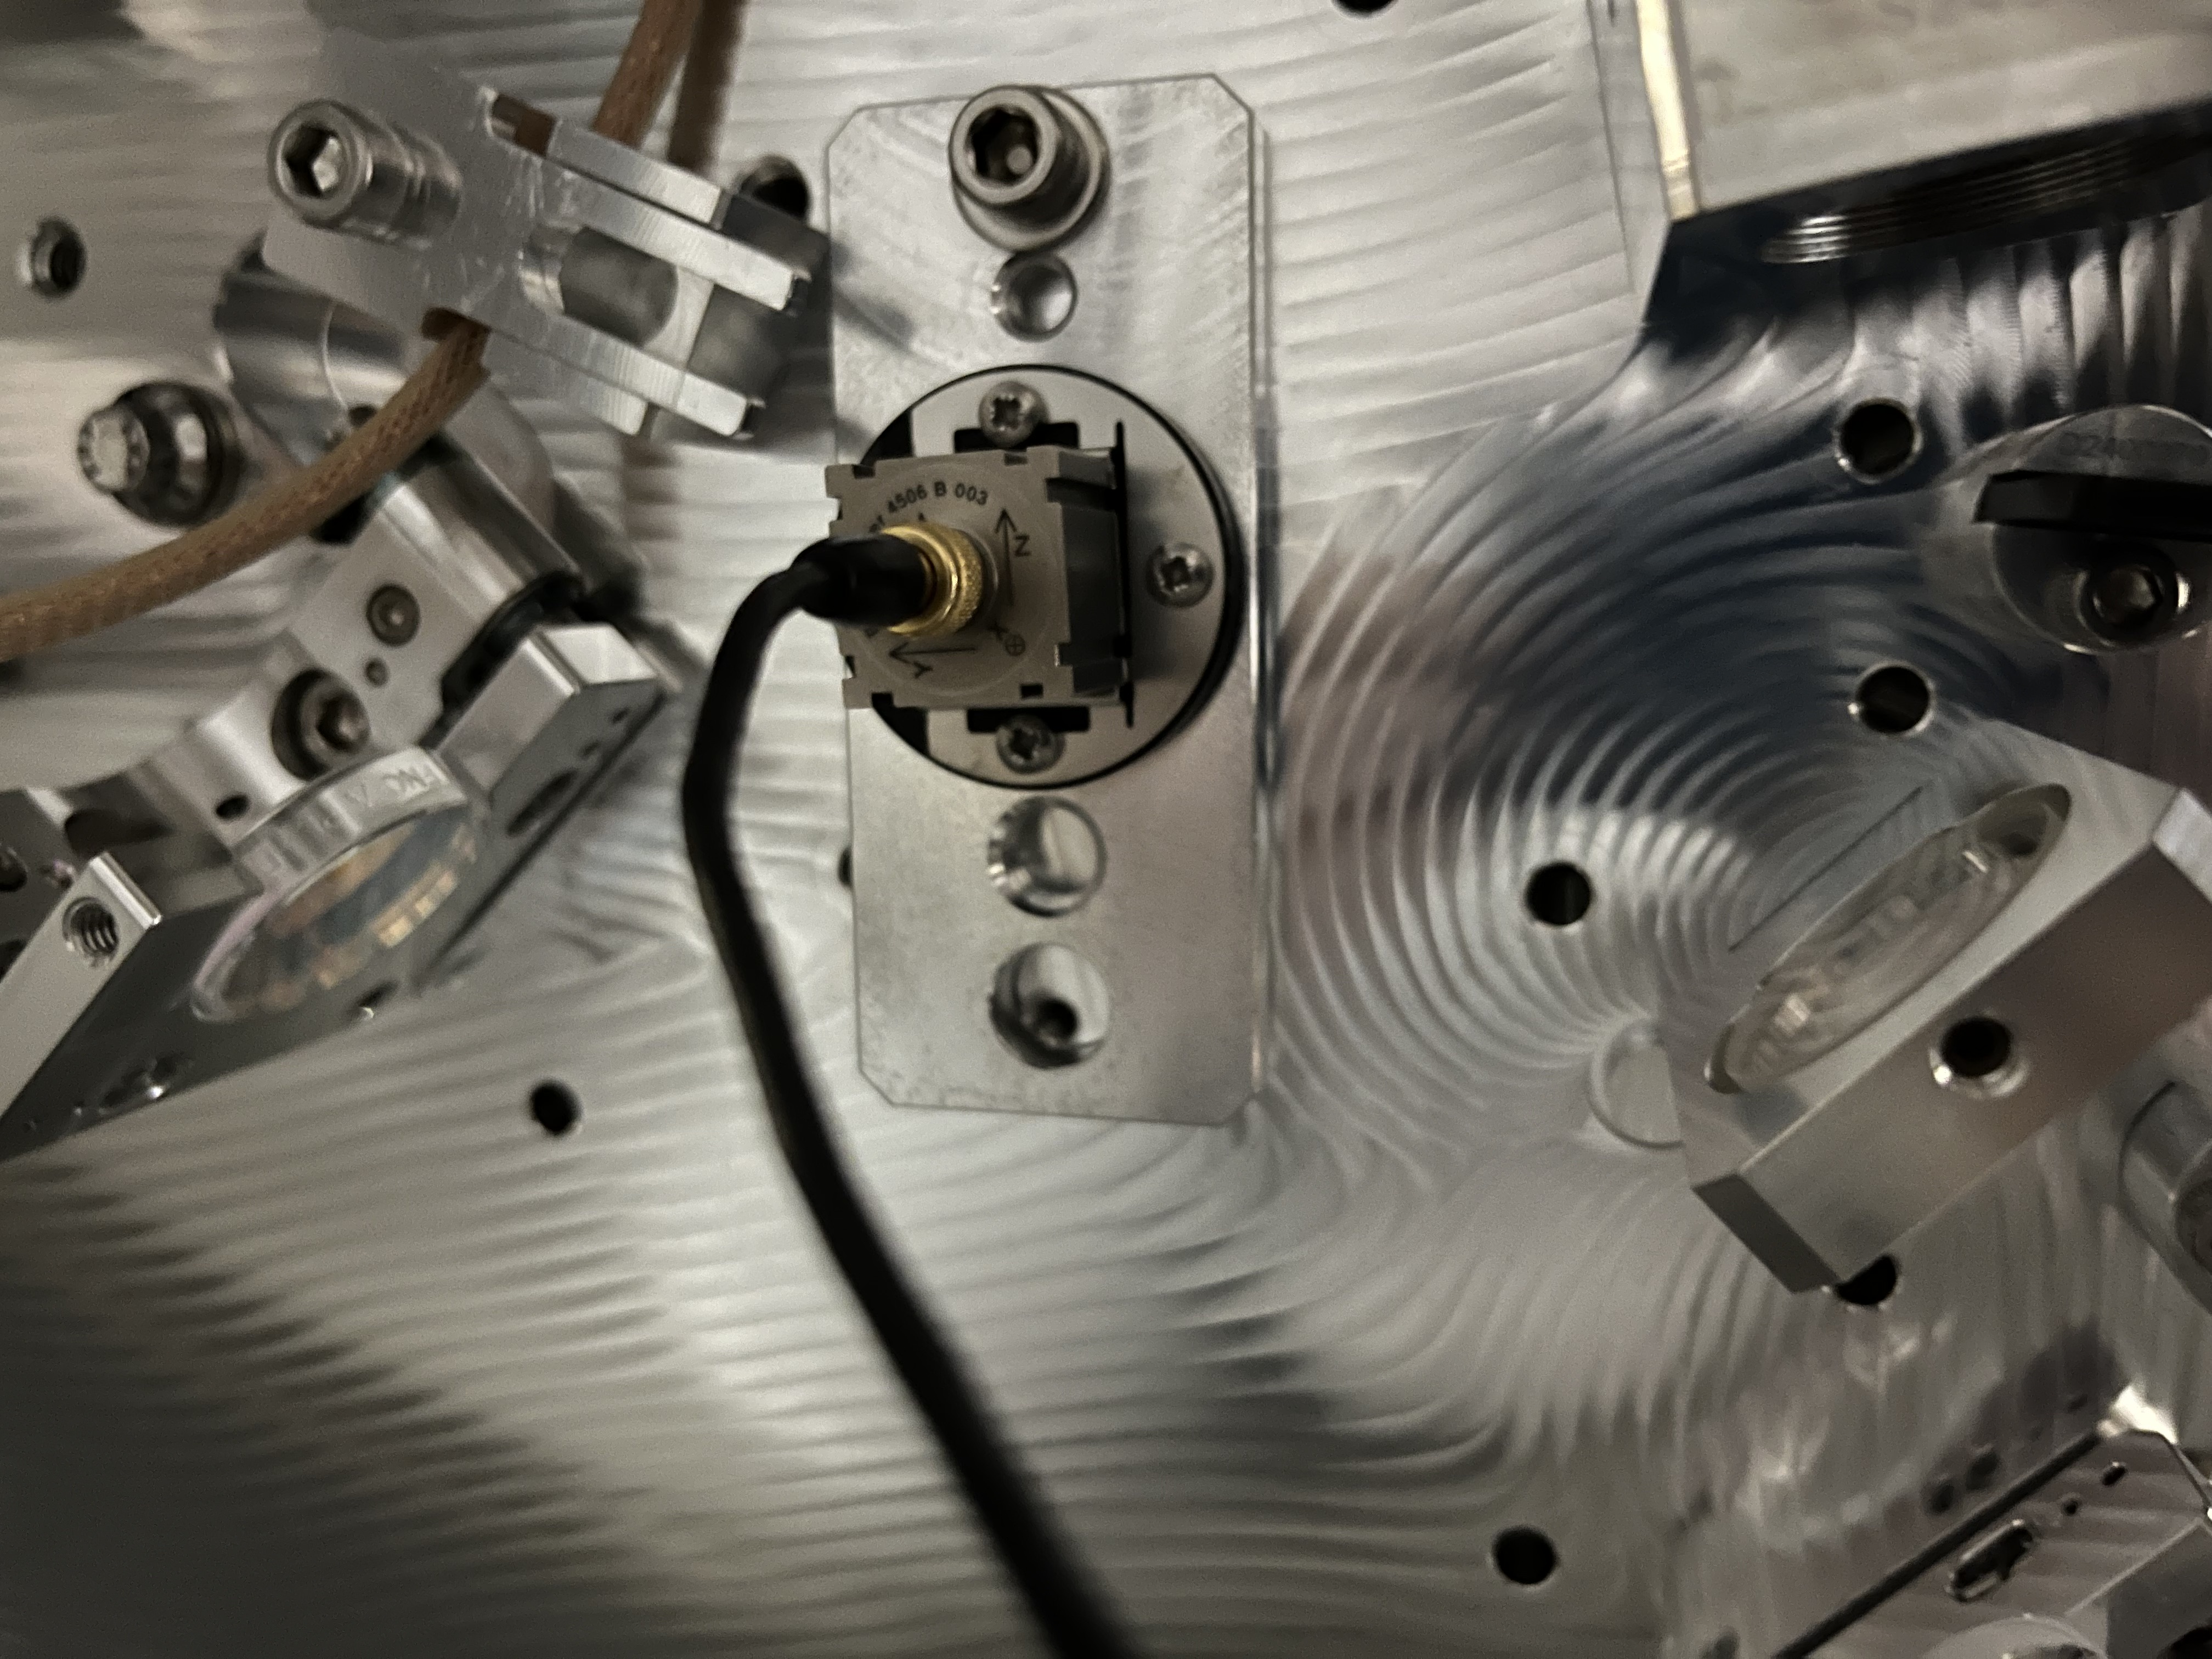
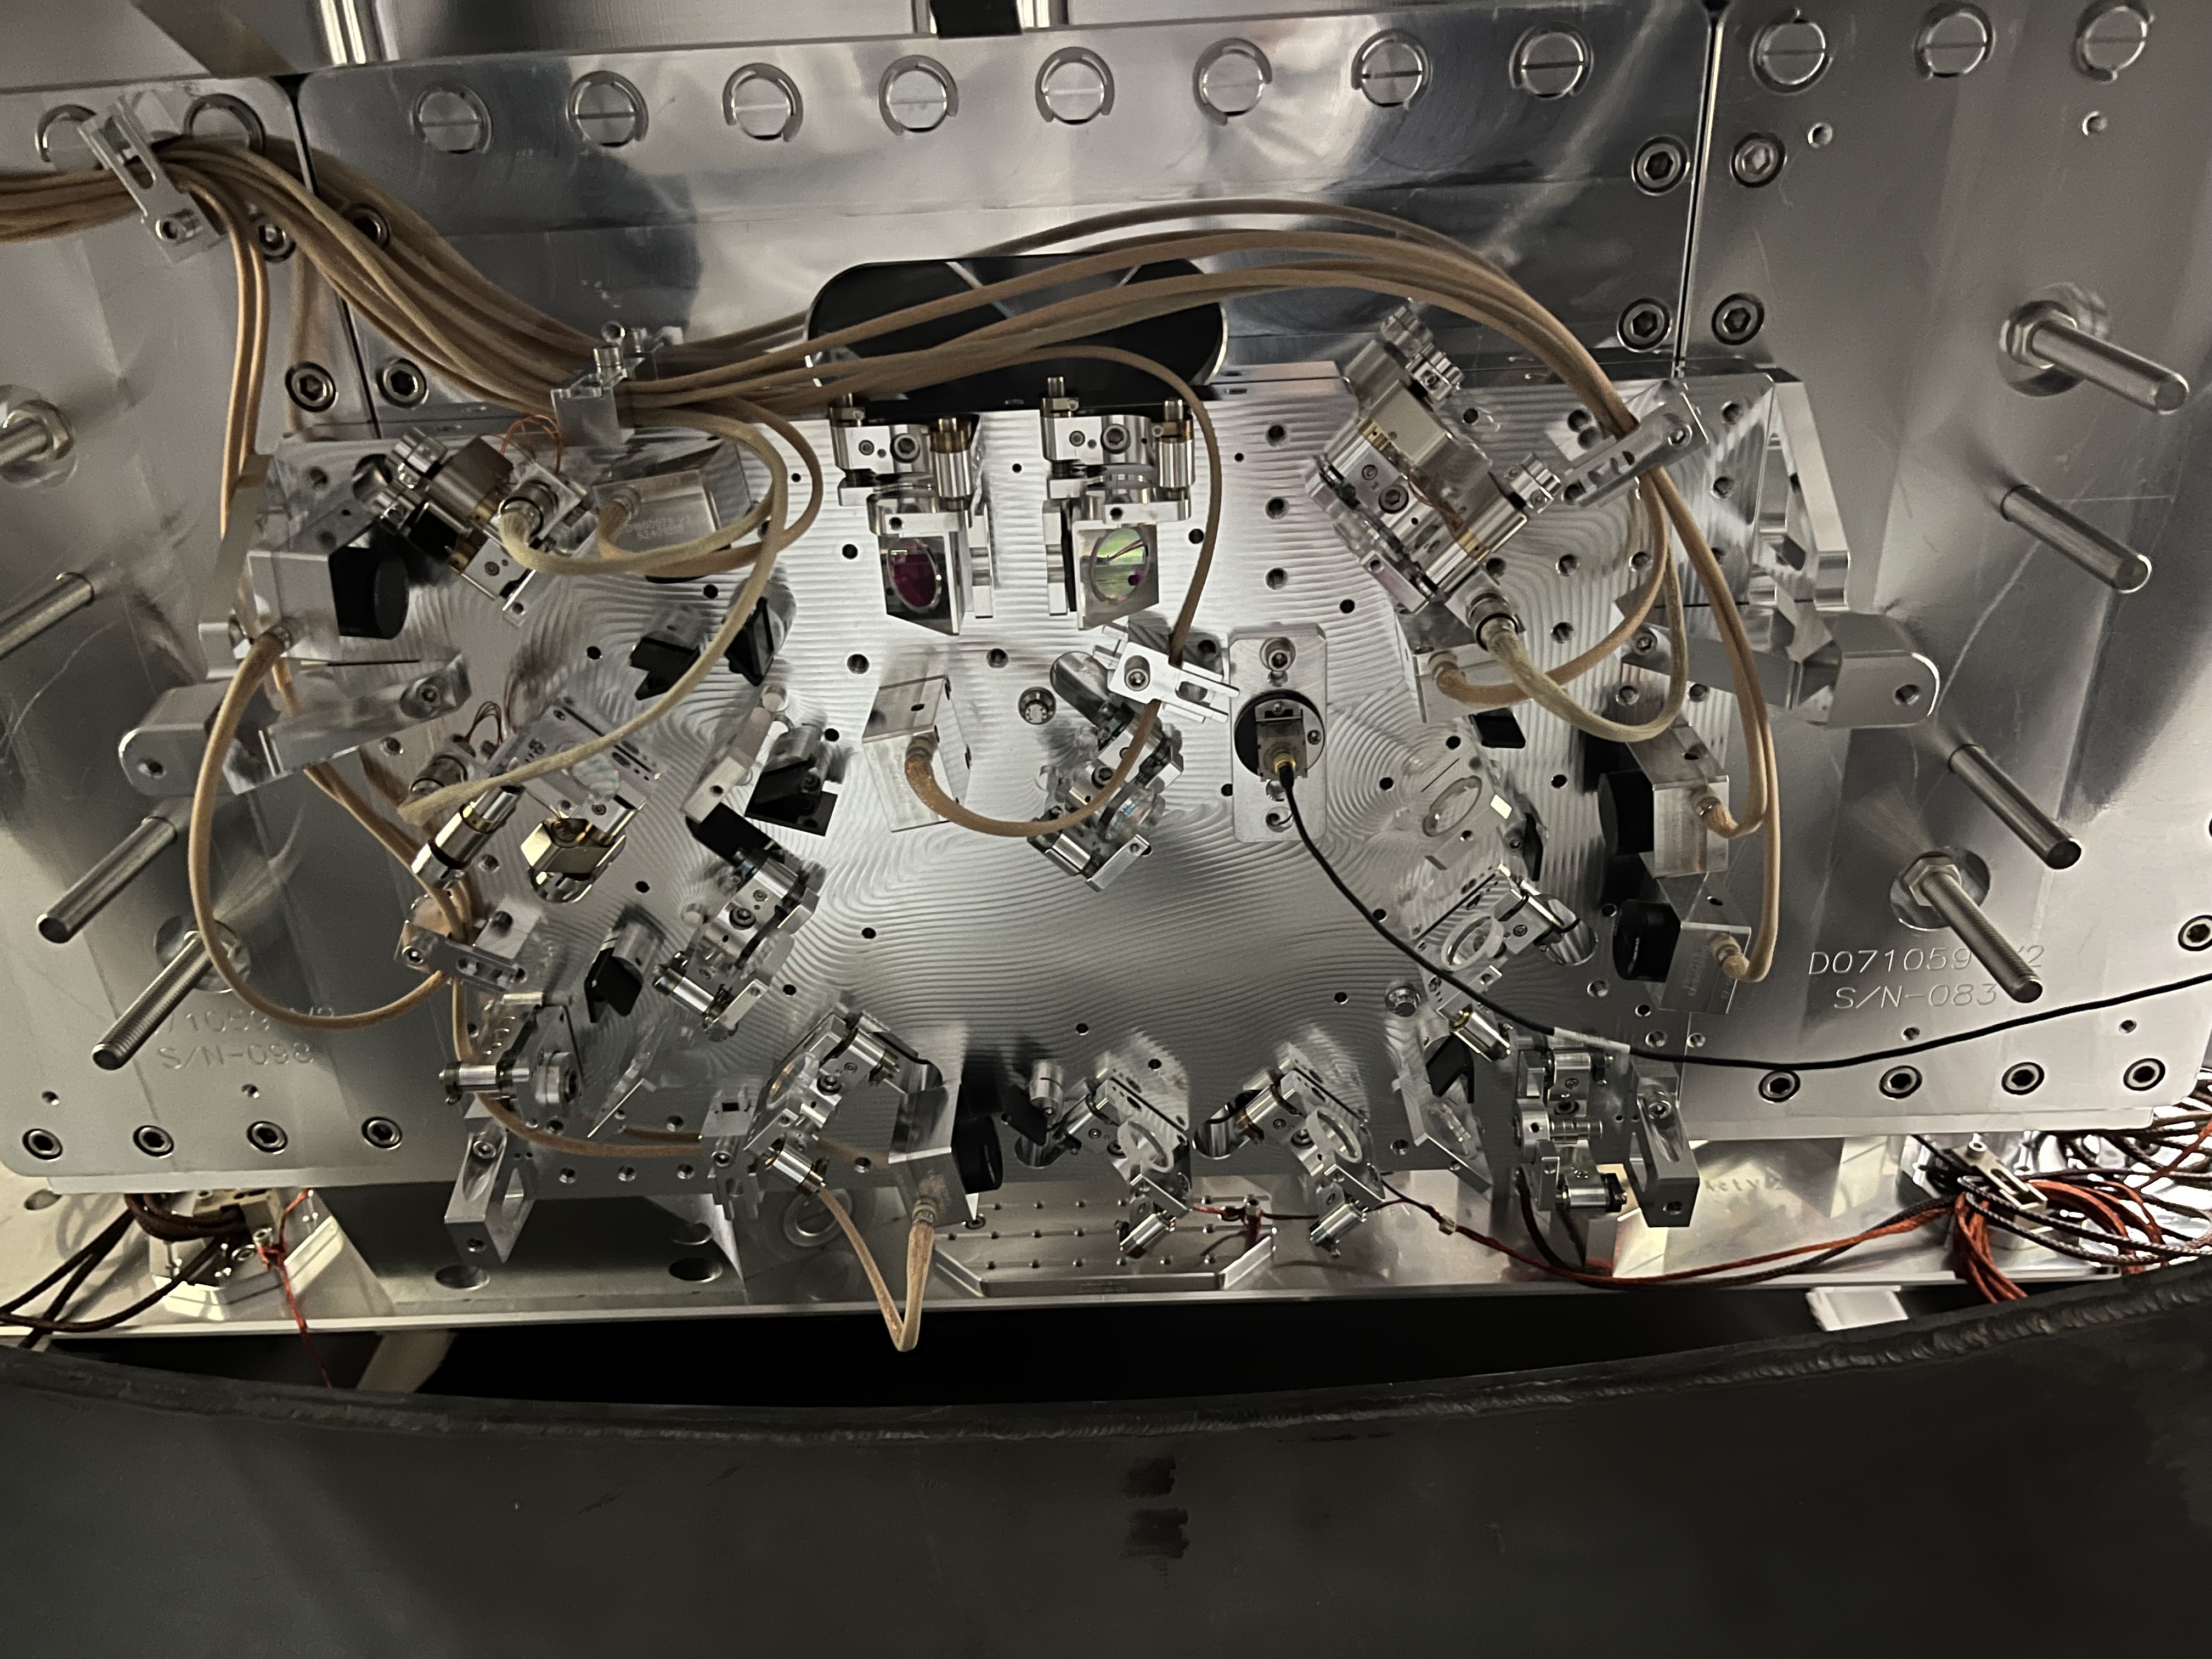
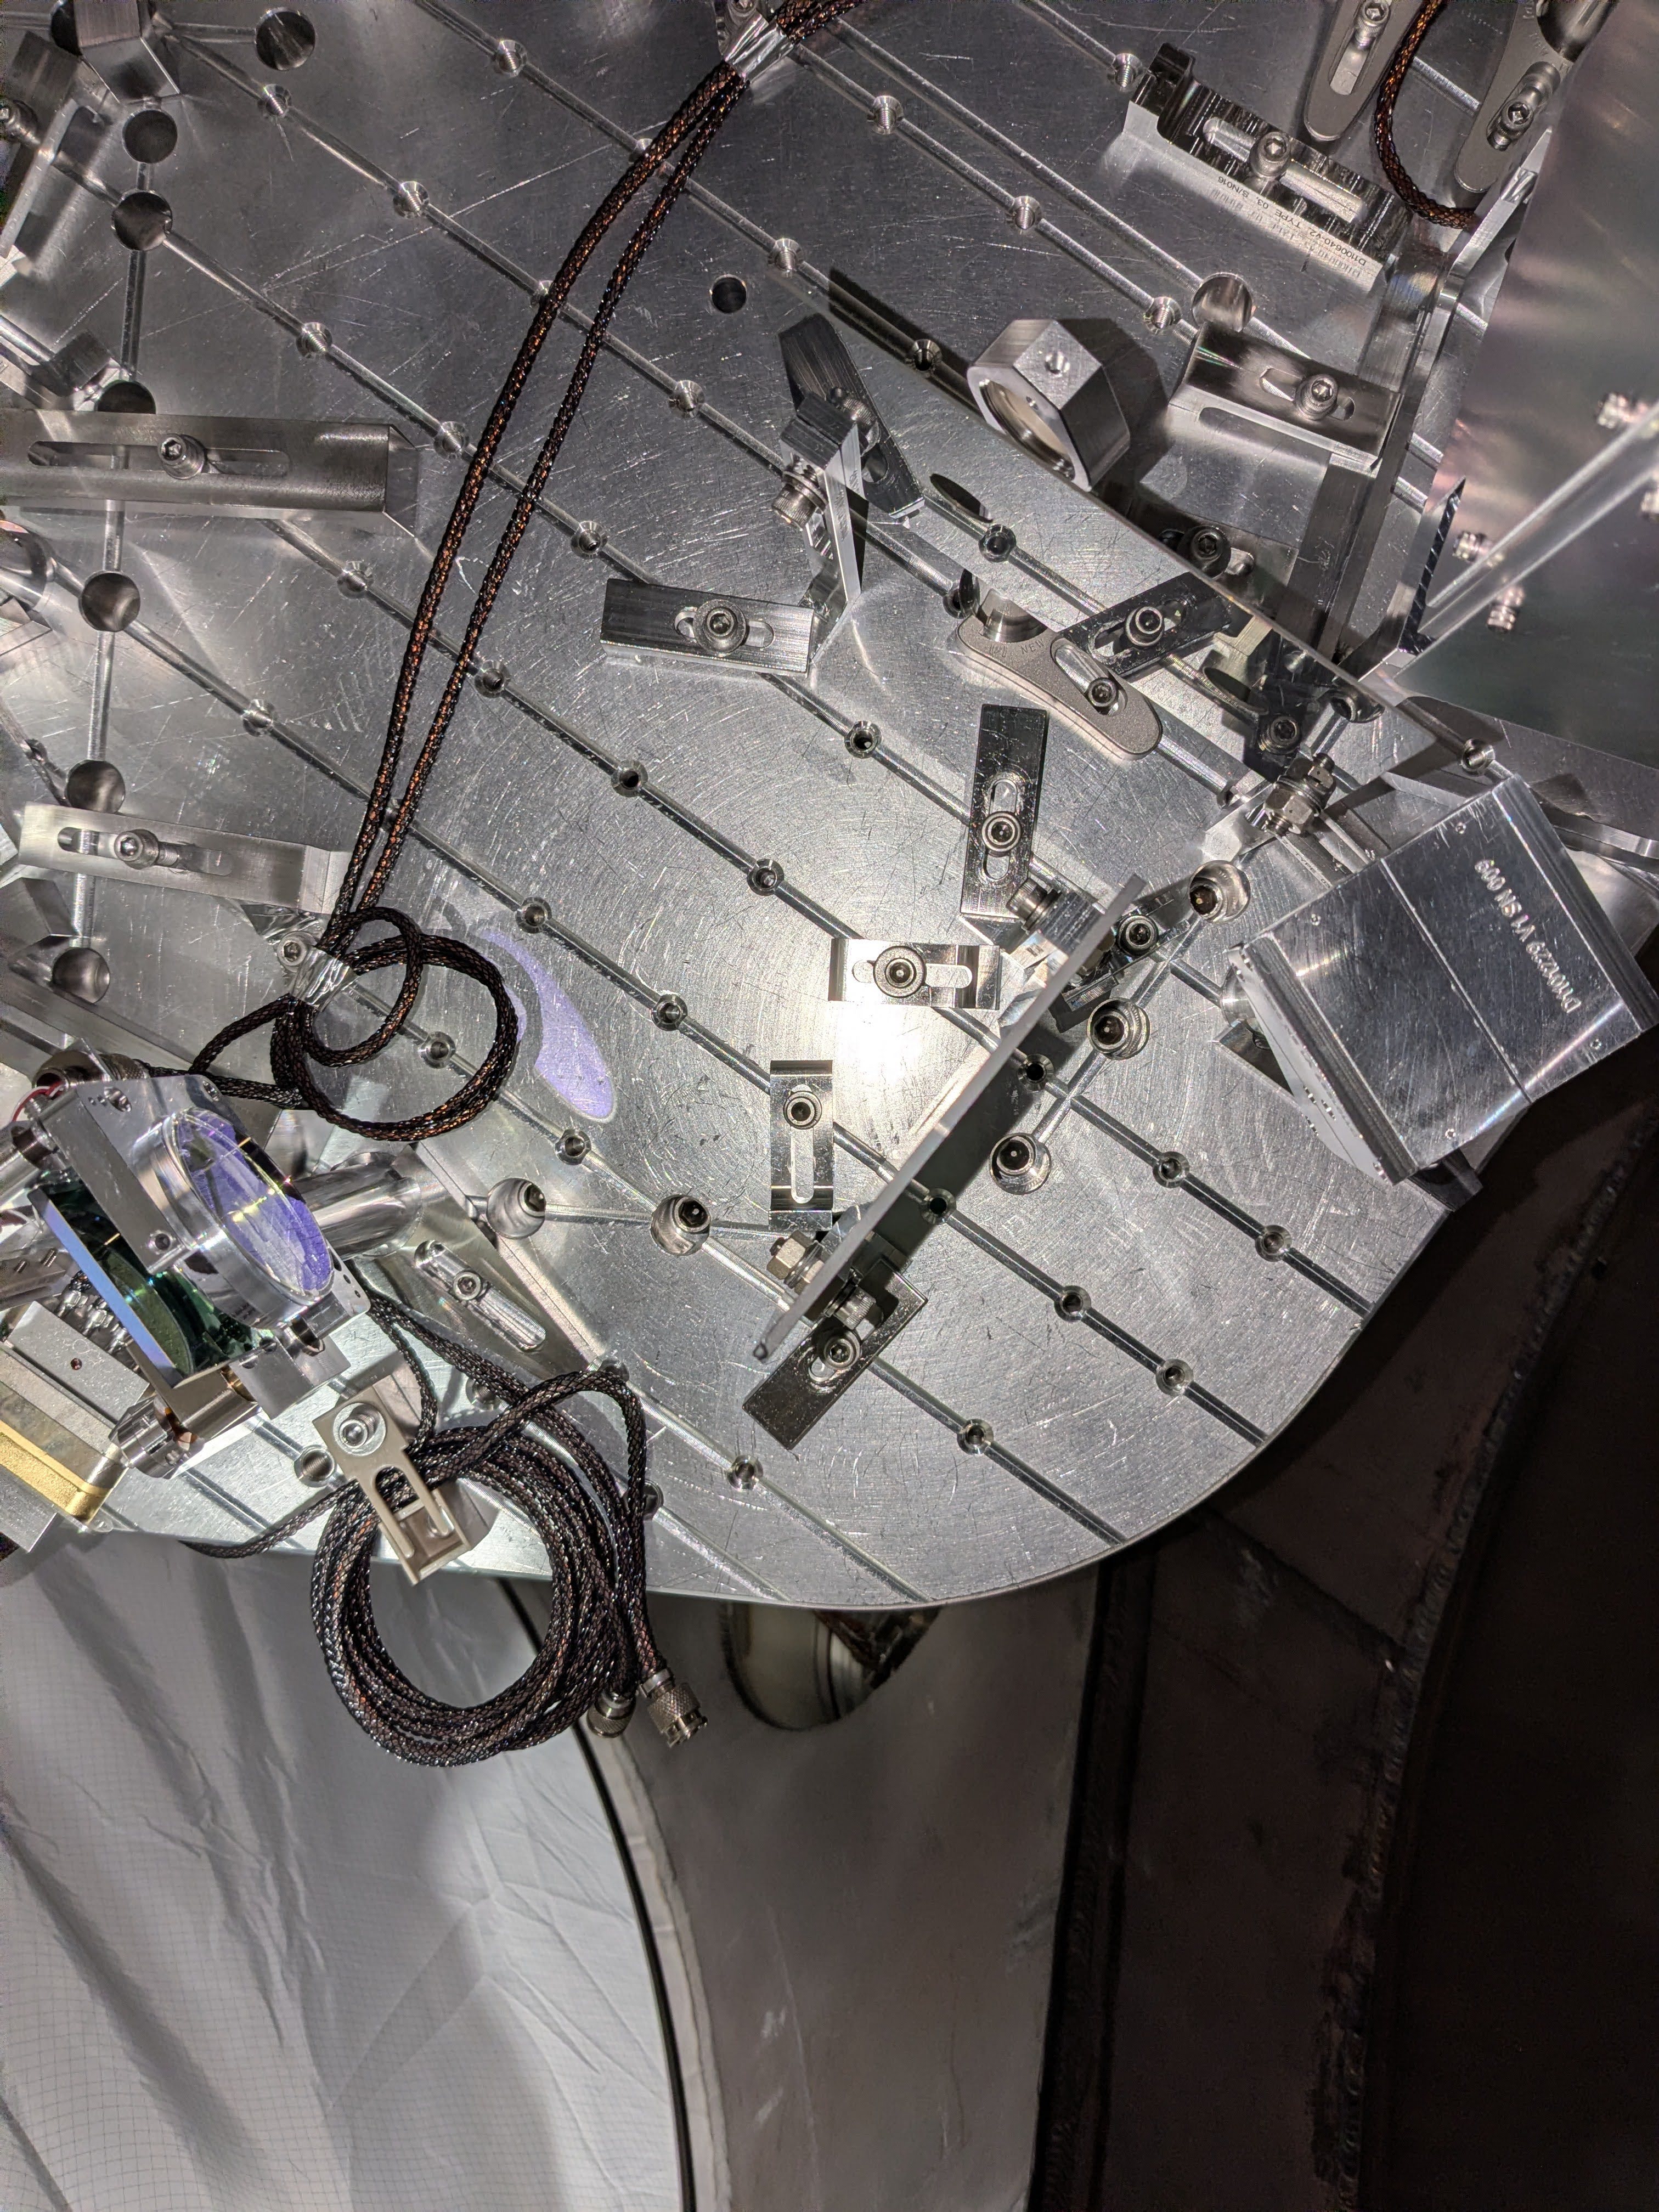
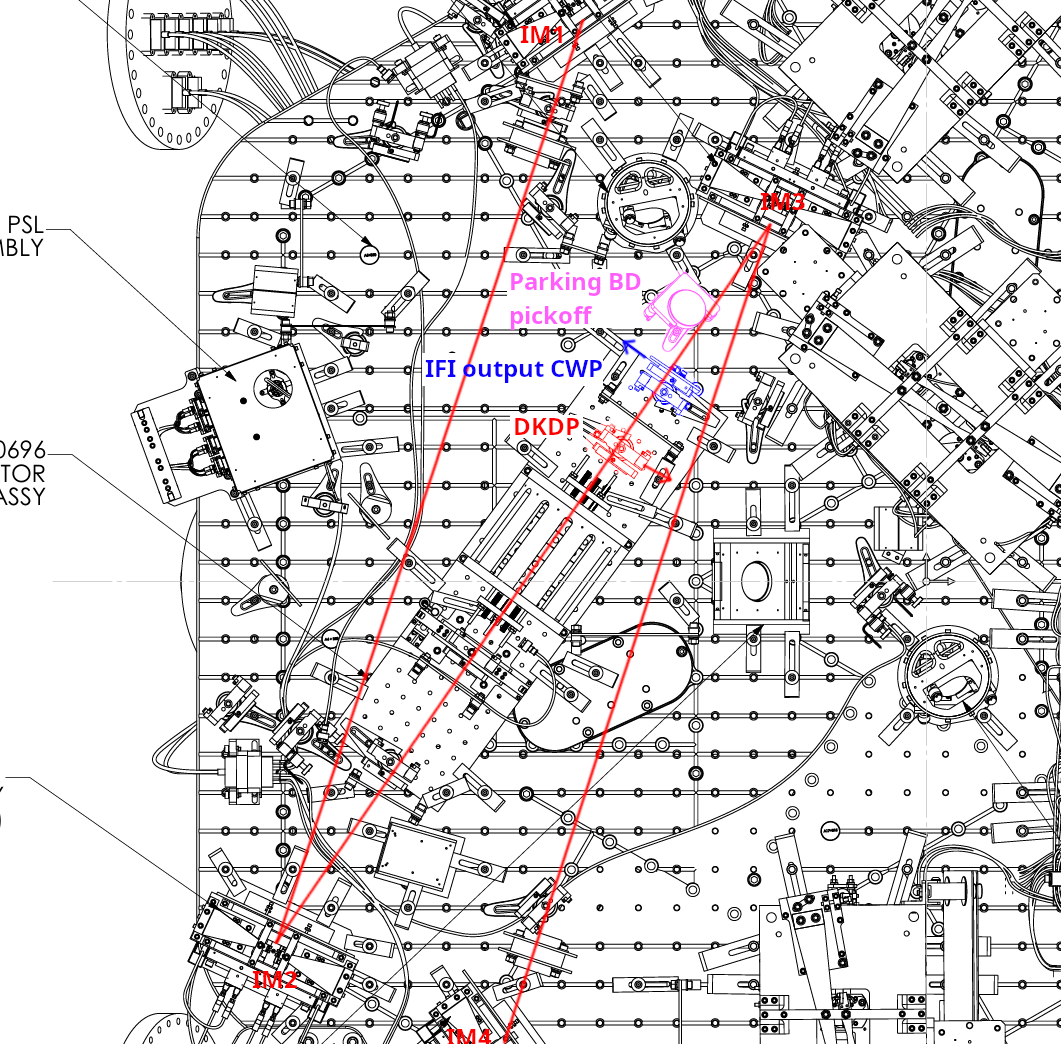
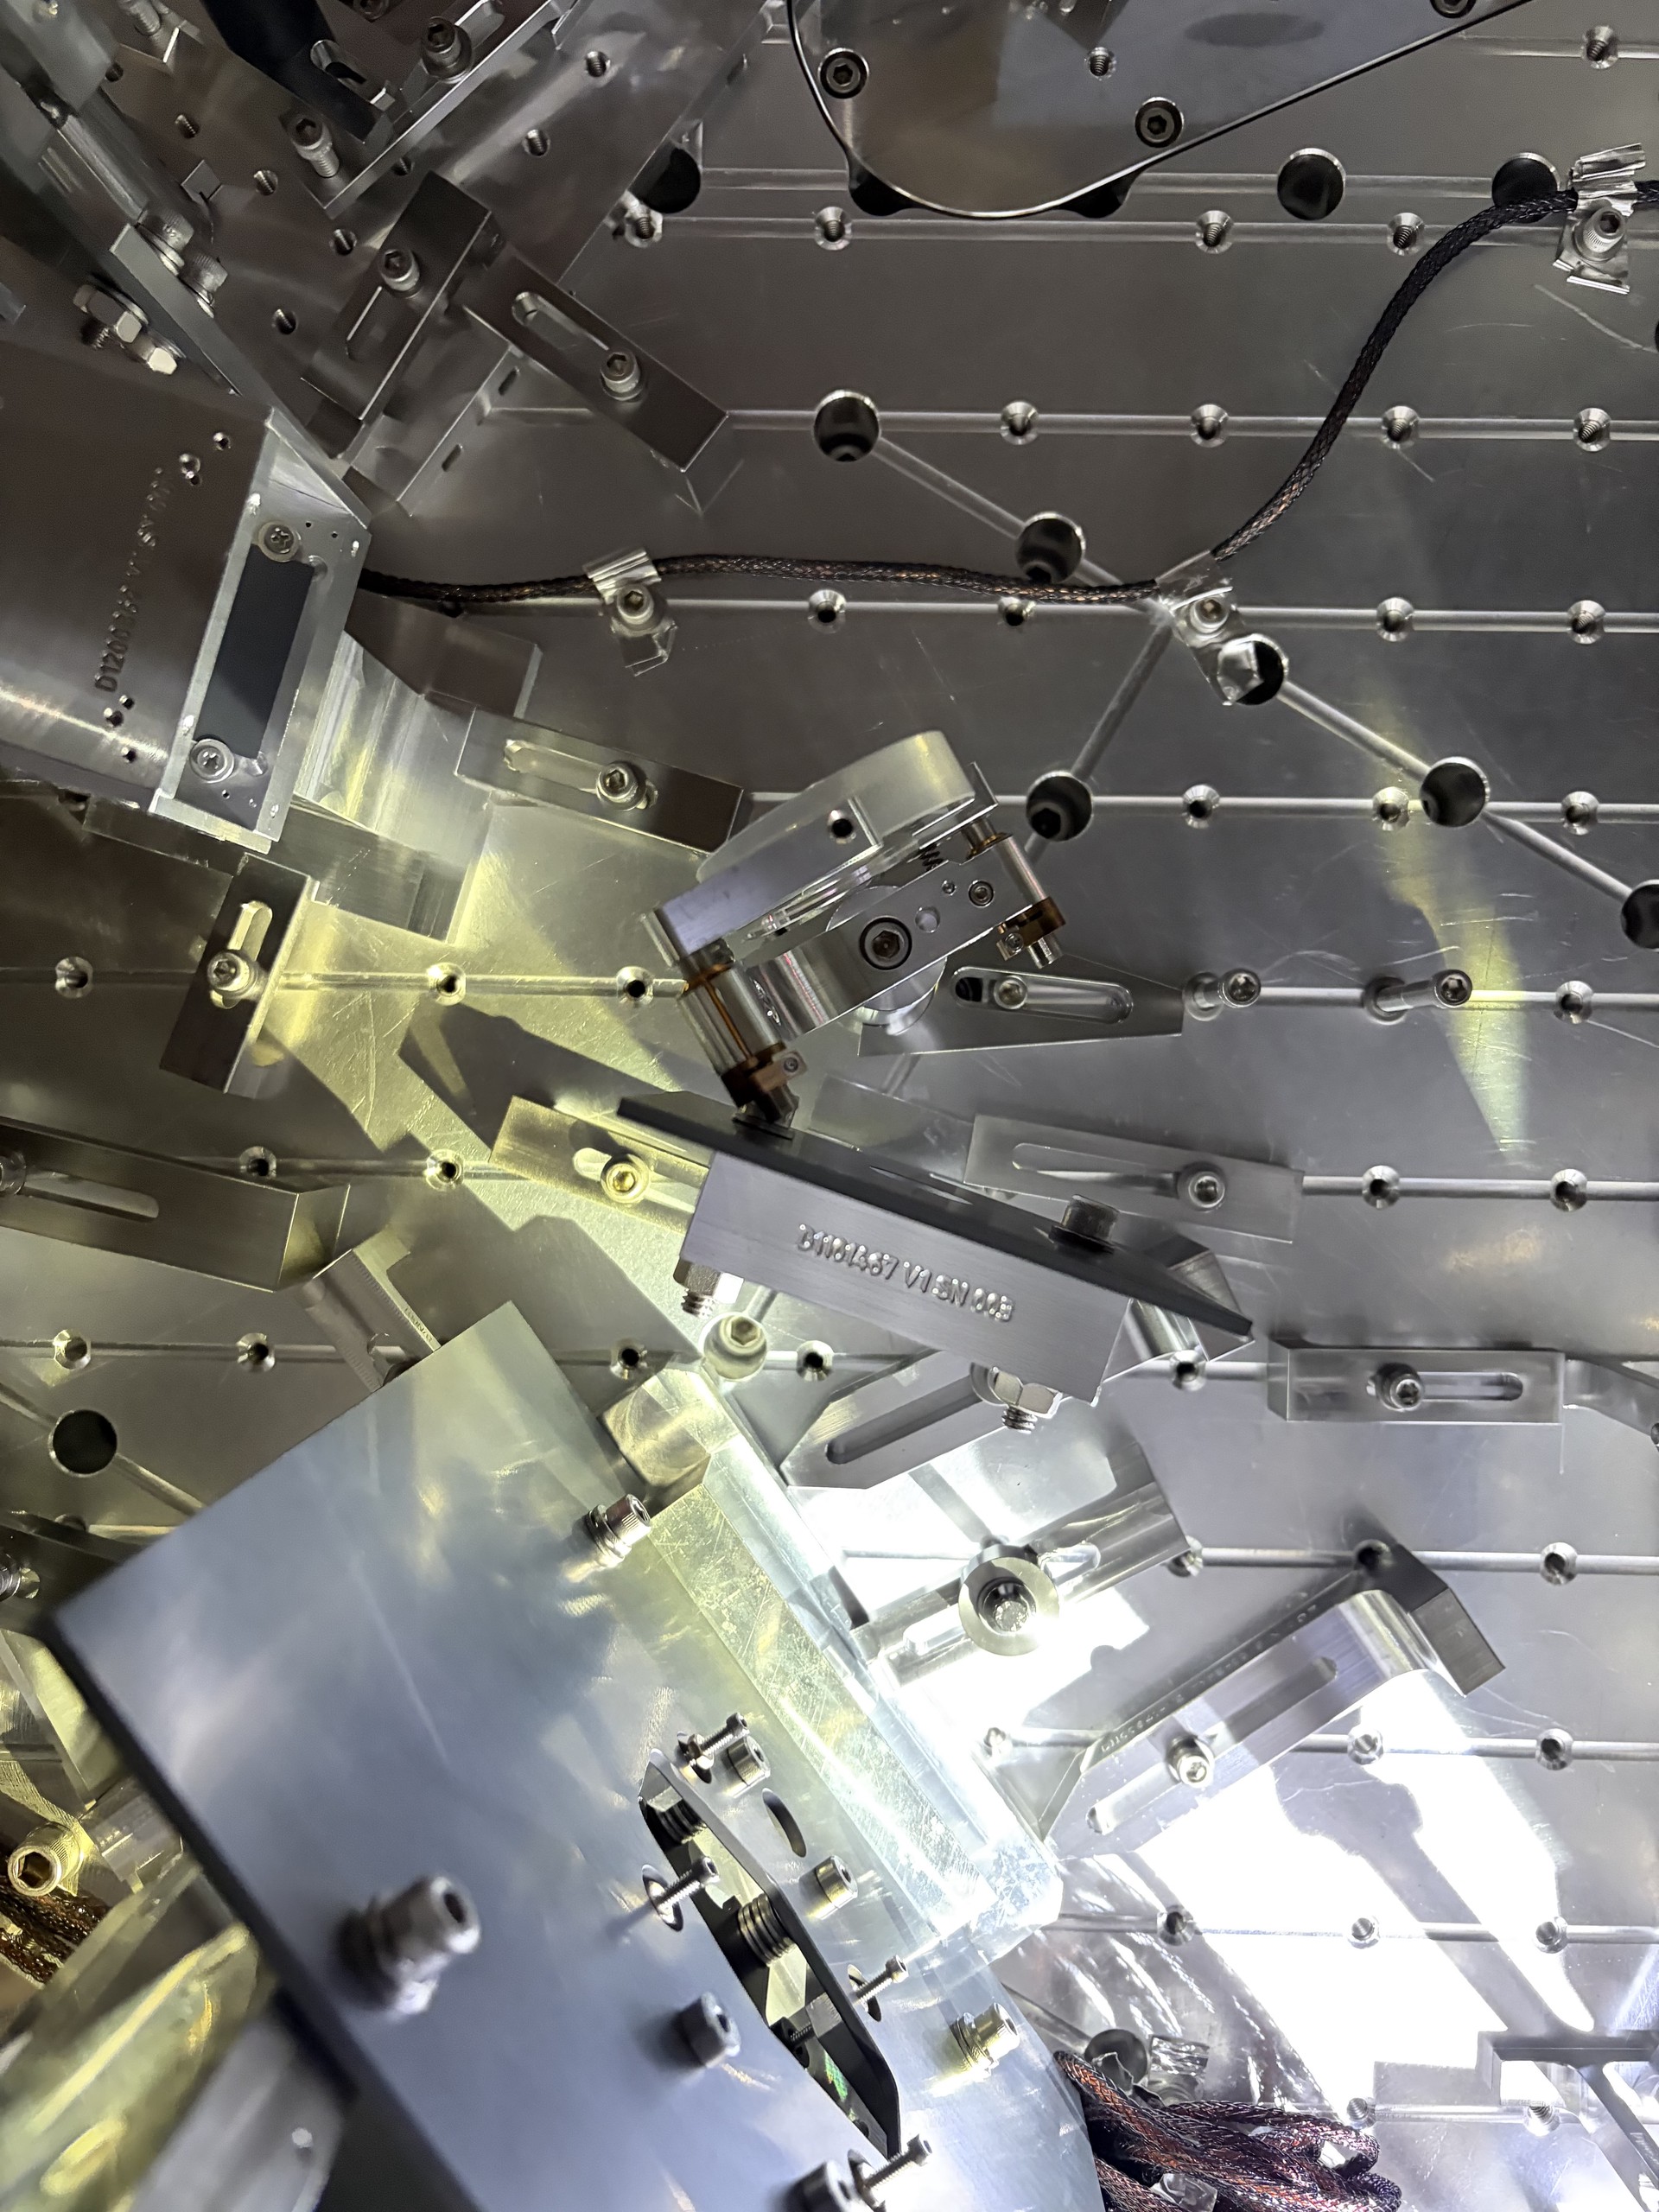
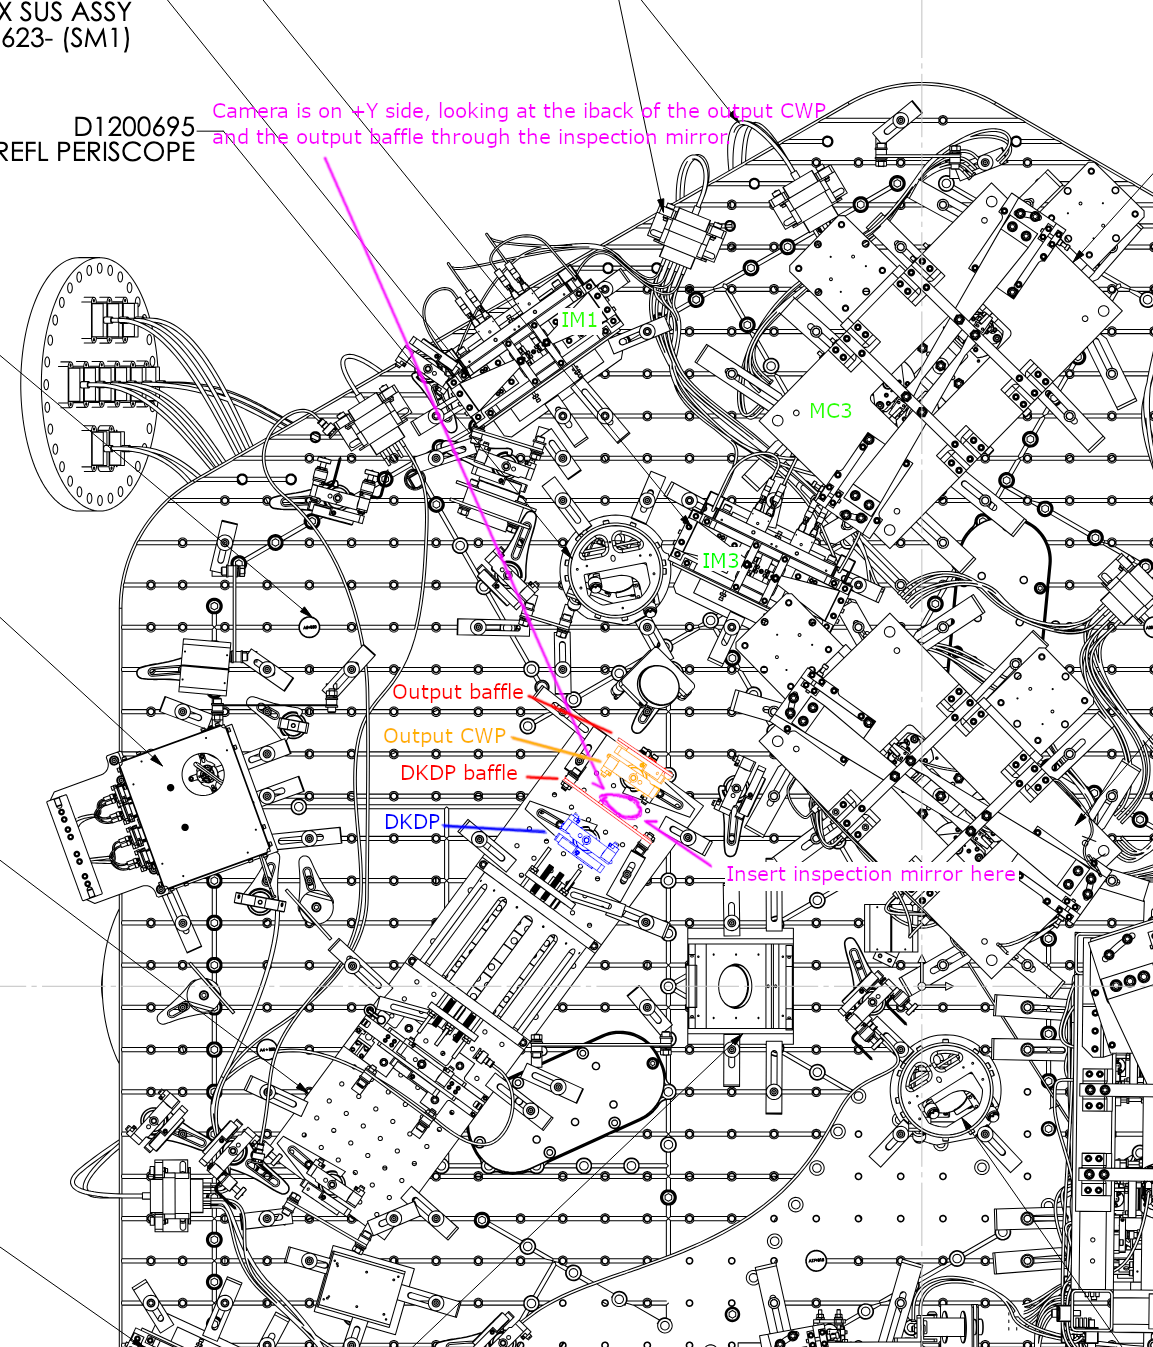
Look at IFI.png to see how the beam is routed through DKDP, output CWP and then passes by the parking beam dump pick-off.
- If we give negative 200urad for IM1 YAW, the forward-going beam starts to interfere with the parking beam dump pick-off once in a while and the frosted barrel of that pick-off becomes bright. This is despite that the beam looks perfectly fine when IM1 is at the now-nominal position (see parkingBD_pickoff.mov, negative 200urad IM1 rotation would mean that the beam will be like 1mm to the right in this video).
- If we give positive 200urad for IM1 YAW, I thought that +X side of the IFI output cwp baffle starts to get brighter once in a while (my theory is that this is the same thing as shown in IFI_OUT_clipped_720p.mov where the edge of the baffle clips the back-propagating beam when the beam moves too much).
We'll be better once we're in vacuum because things will be quieter and the MC alignment will be better, so no beam motion and no HOM transmission, but I have to say that the clearance here looks to be unnecessarily narrow. I will NOT touch IFI itself so the only option for mitigation will be to move the parking BD pickoff, but it will be tedious to align that pickoff to steer the beam into the beam dump on top of HAM2. Given the limited time available I'll leave it as is.
We don't know what this scattering is, maybe it's the AR reflection of CWP or DKDP hitting something, maybe it's the surface scatter of CWP. I'll try to take the video from the back of the IFI output beamdump/CWP using a big inspection mirror.
Done: IM4 TRANS centering.
Rahul used pico mirror to roughly center IM4 TRANS while I was monitoring individual segments. IM4TRANS_ROUGHLY_BALANCED.png
Done: IM4 baffle (HA12) moved
As planned. The beam originally was offset in +X direction (IM4_HA12_before.jpeg shows the original location, IM4_baffle_HA12_before.mov shows the beam position), IM4 baffle was moved a bit in -X direction (IM4_HA12_after.jpg, IM4_baffle_HA12_after.mov).
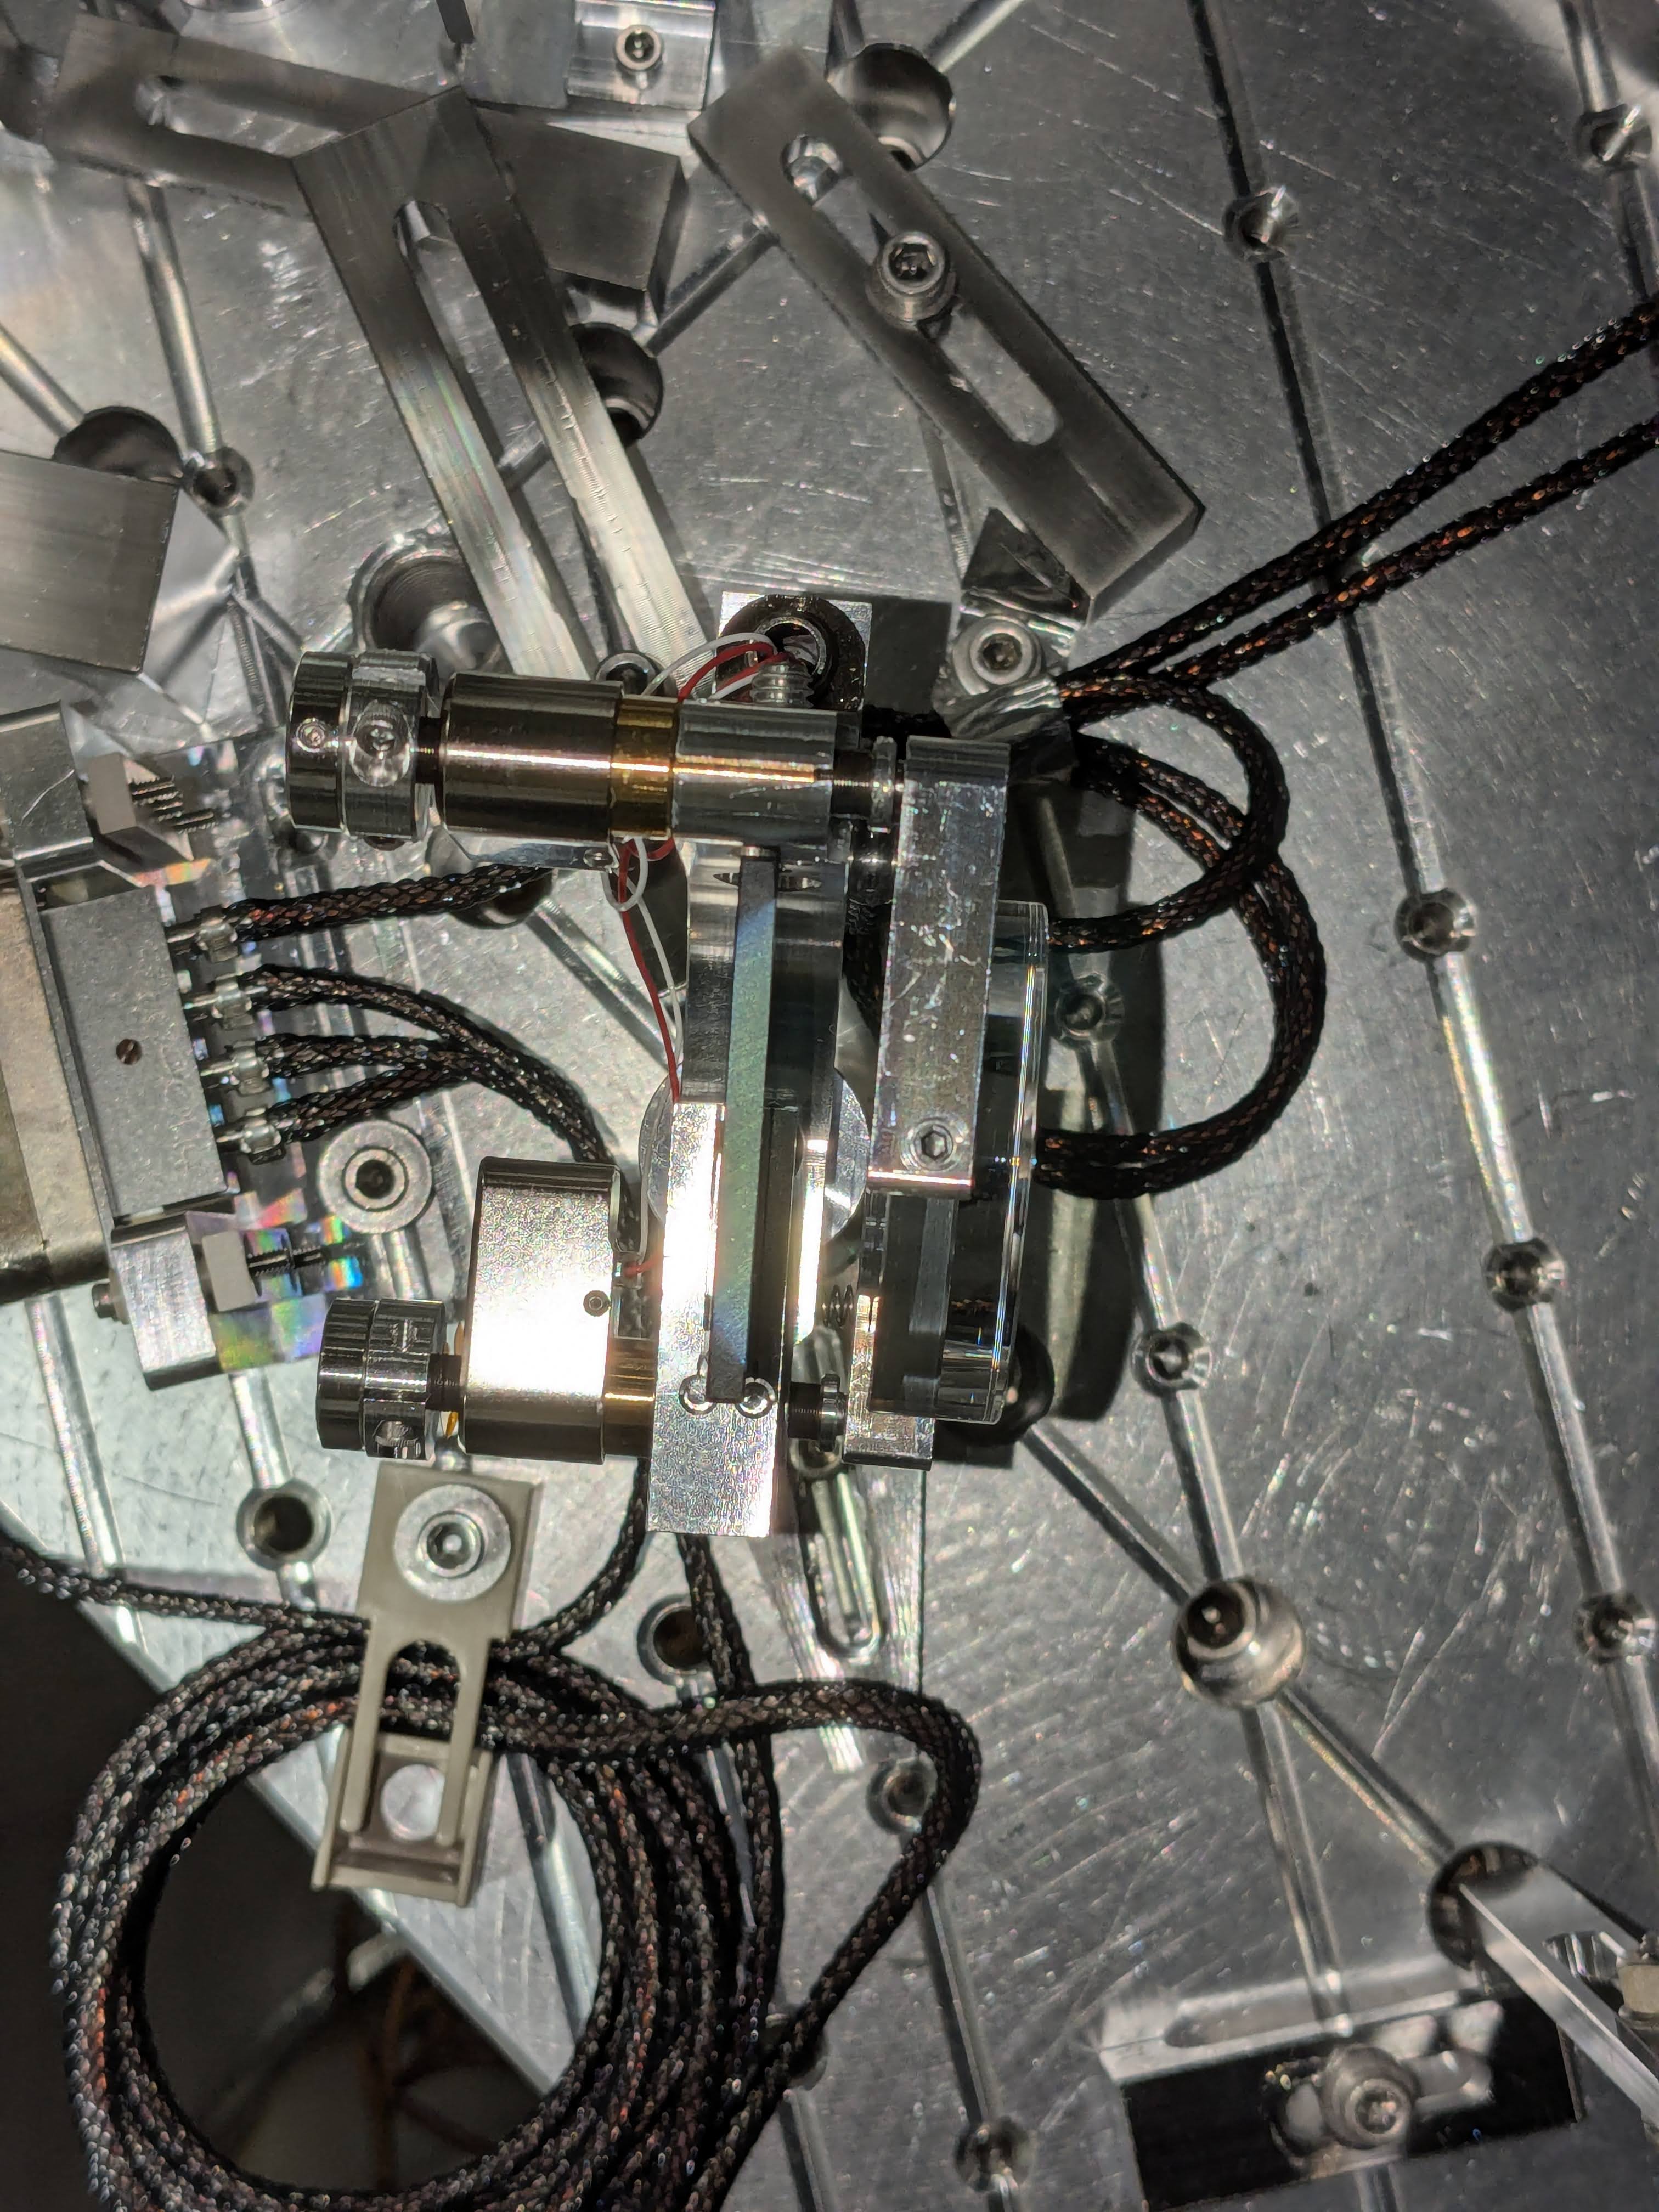
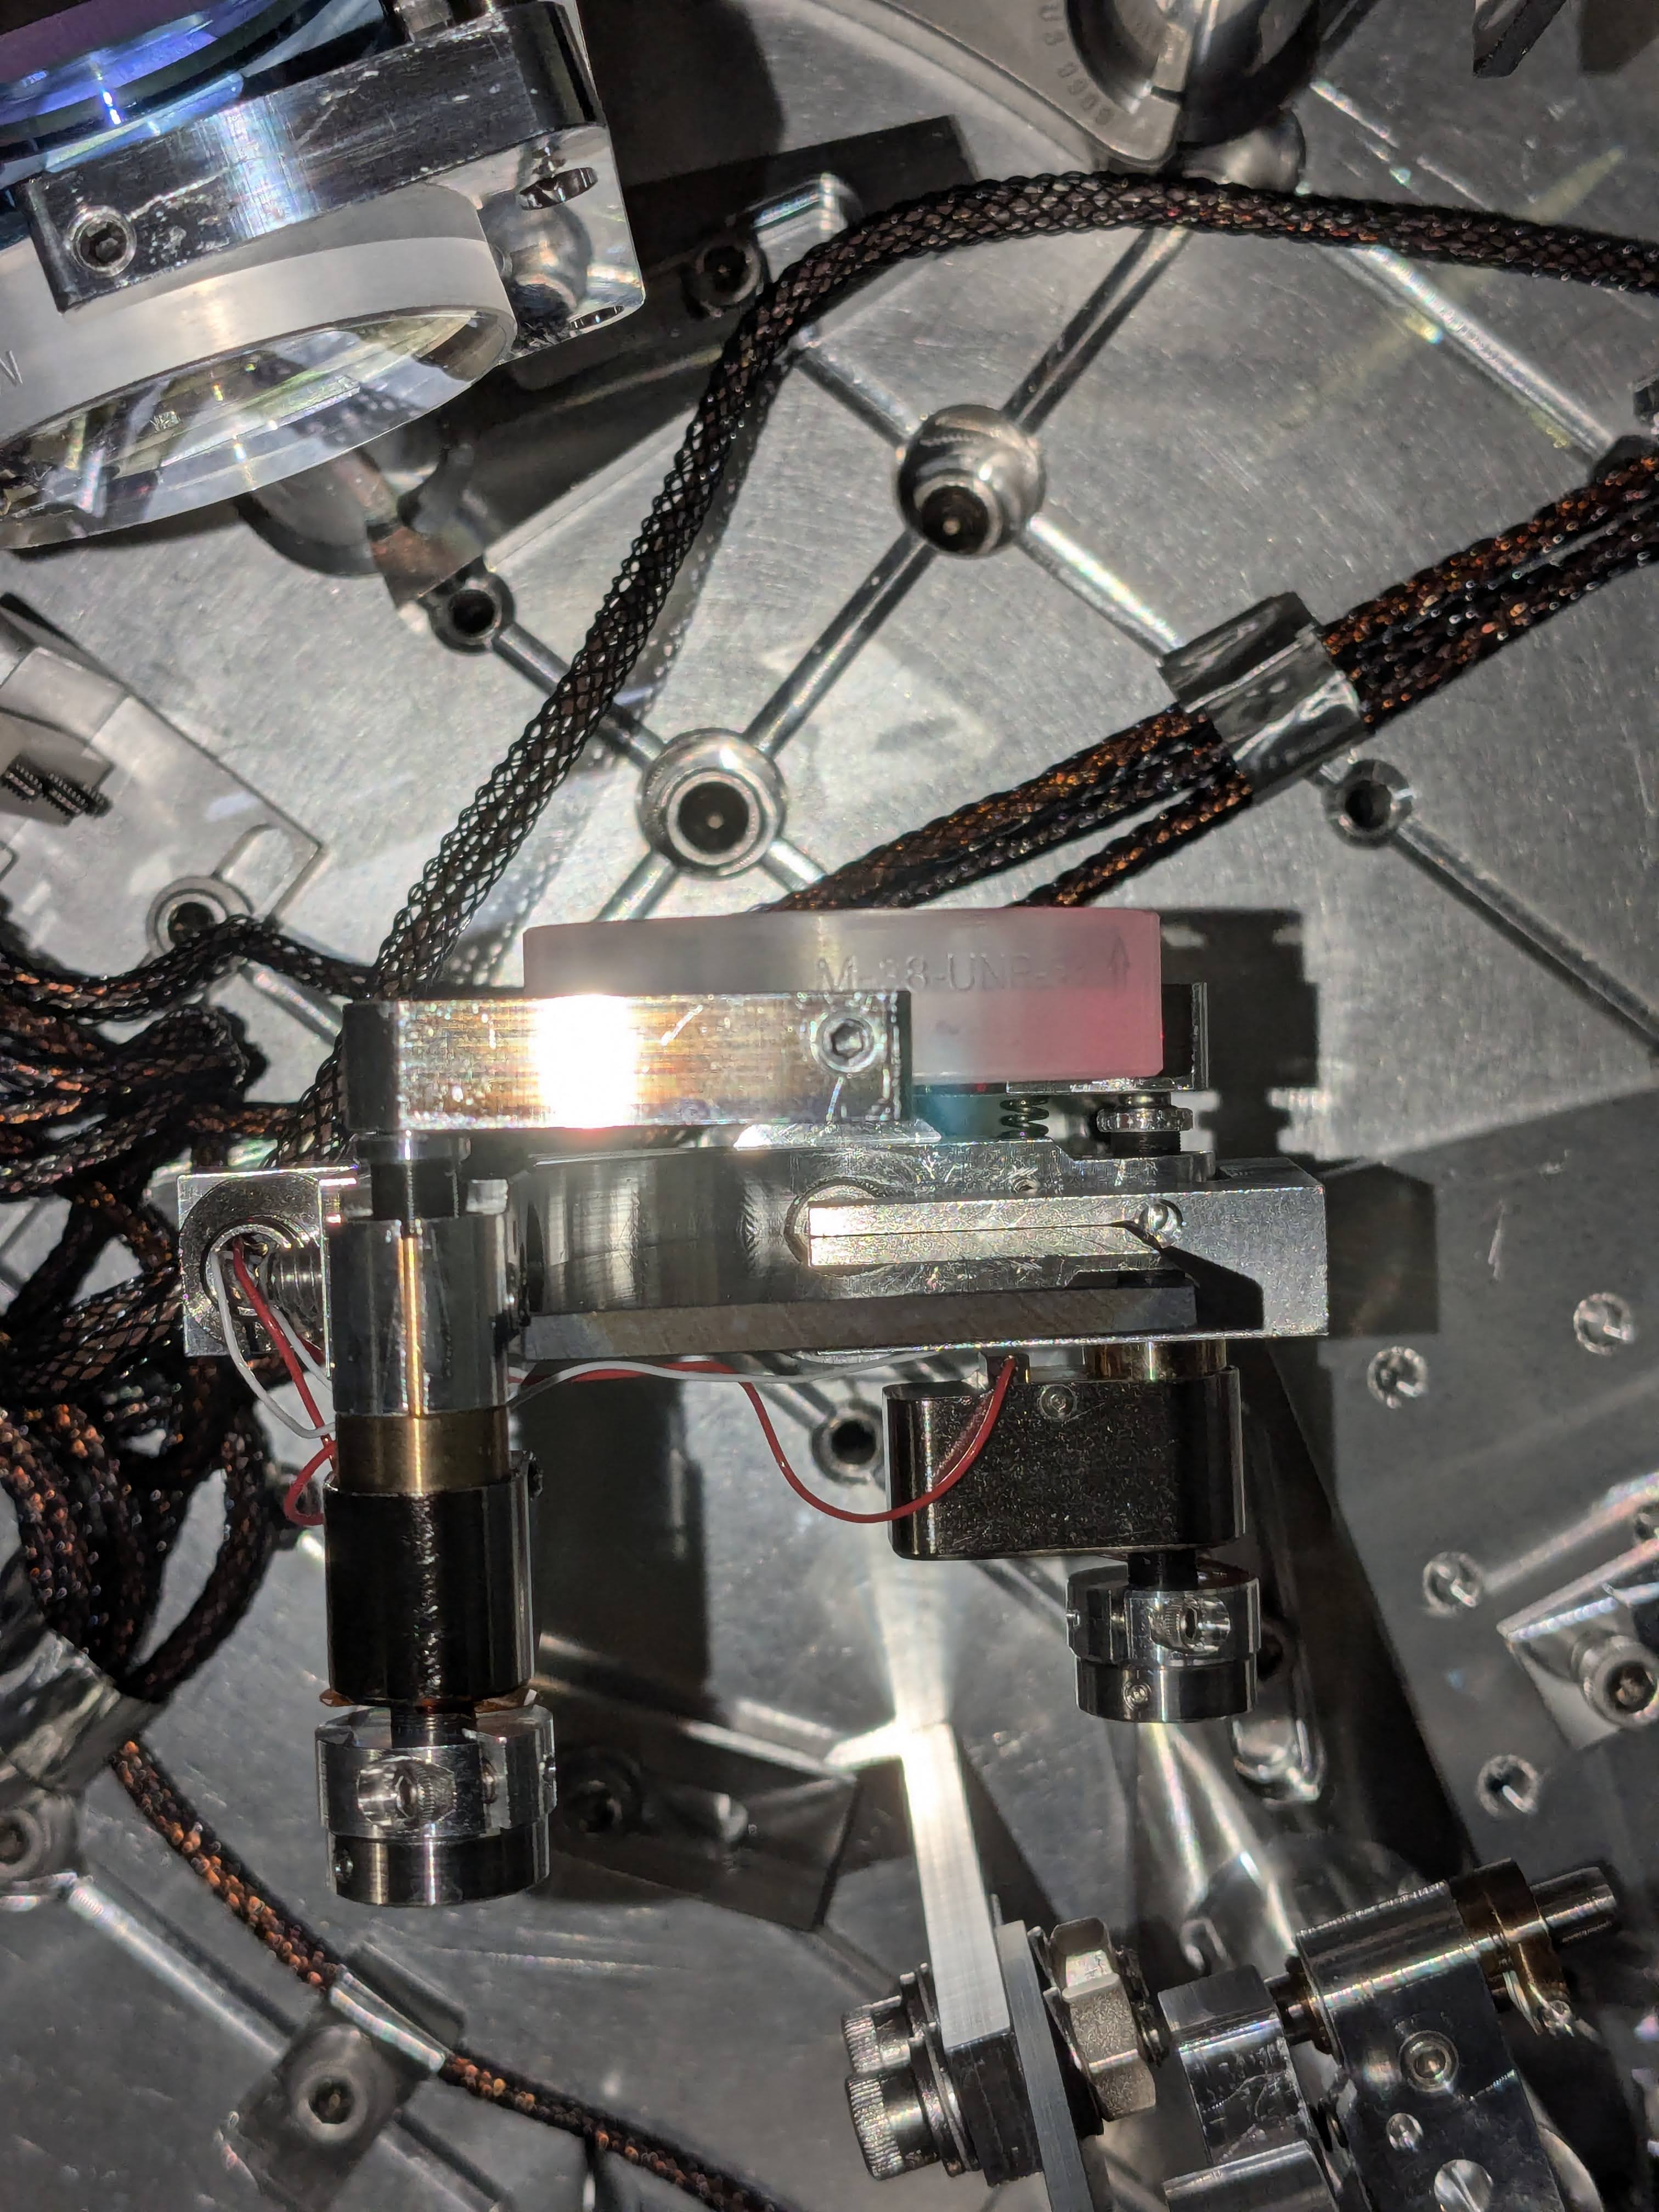
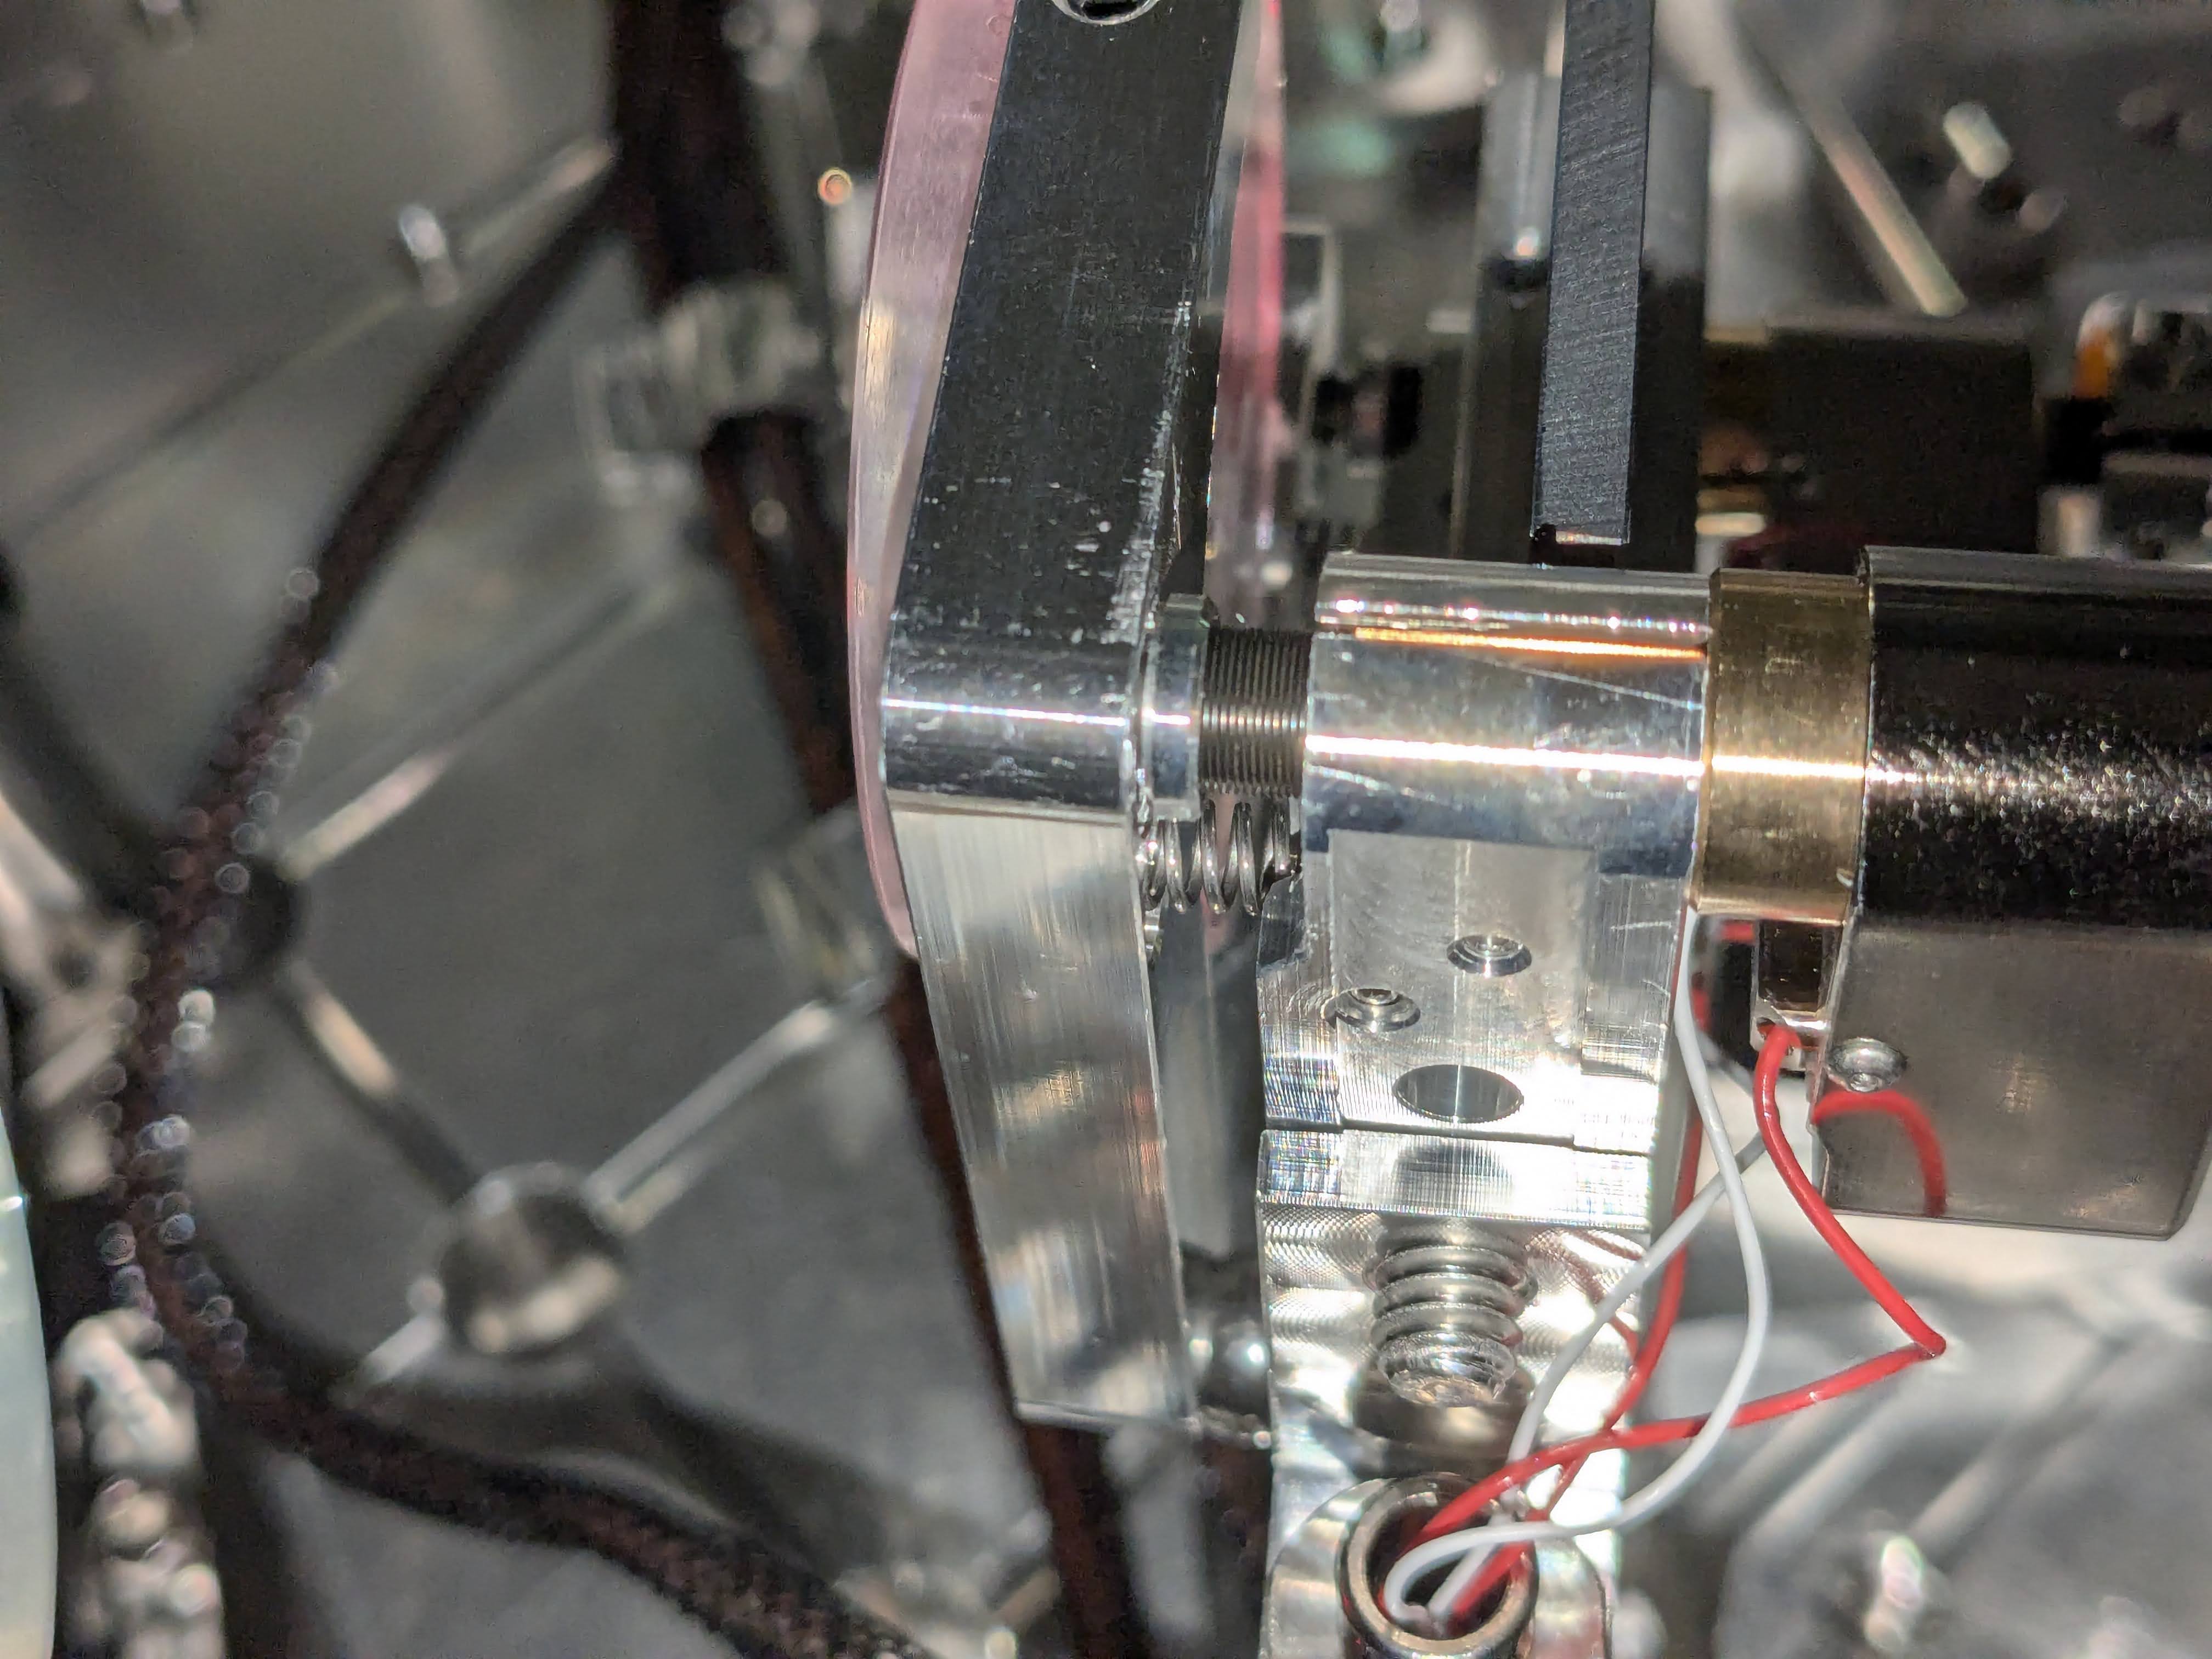
Done but not really: Picturing the picos, one concern for the first ISS pico actuator.
The 1st ISS pico is concerning in that the PIT actuator might have lost the ball tip or the stop ring got loose. Will investigate further tomorrow.