jeffrey.garcia@LIGO.ORG - posted 16:18, Wednesday 19 October 2011 (1583)
FMY Vibration Absorber effectiveness tests
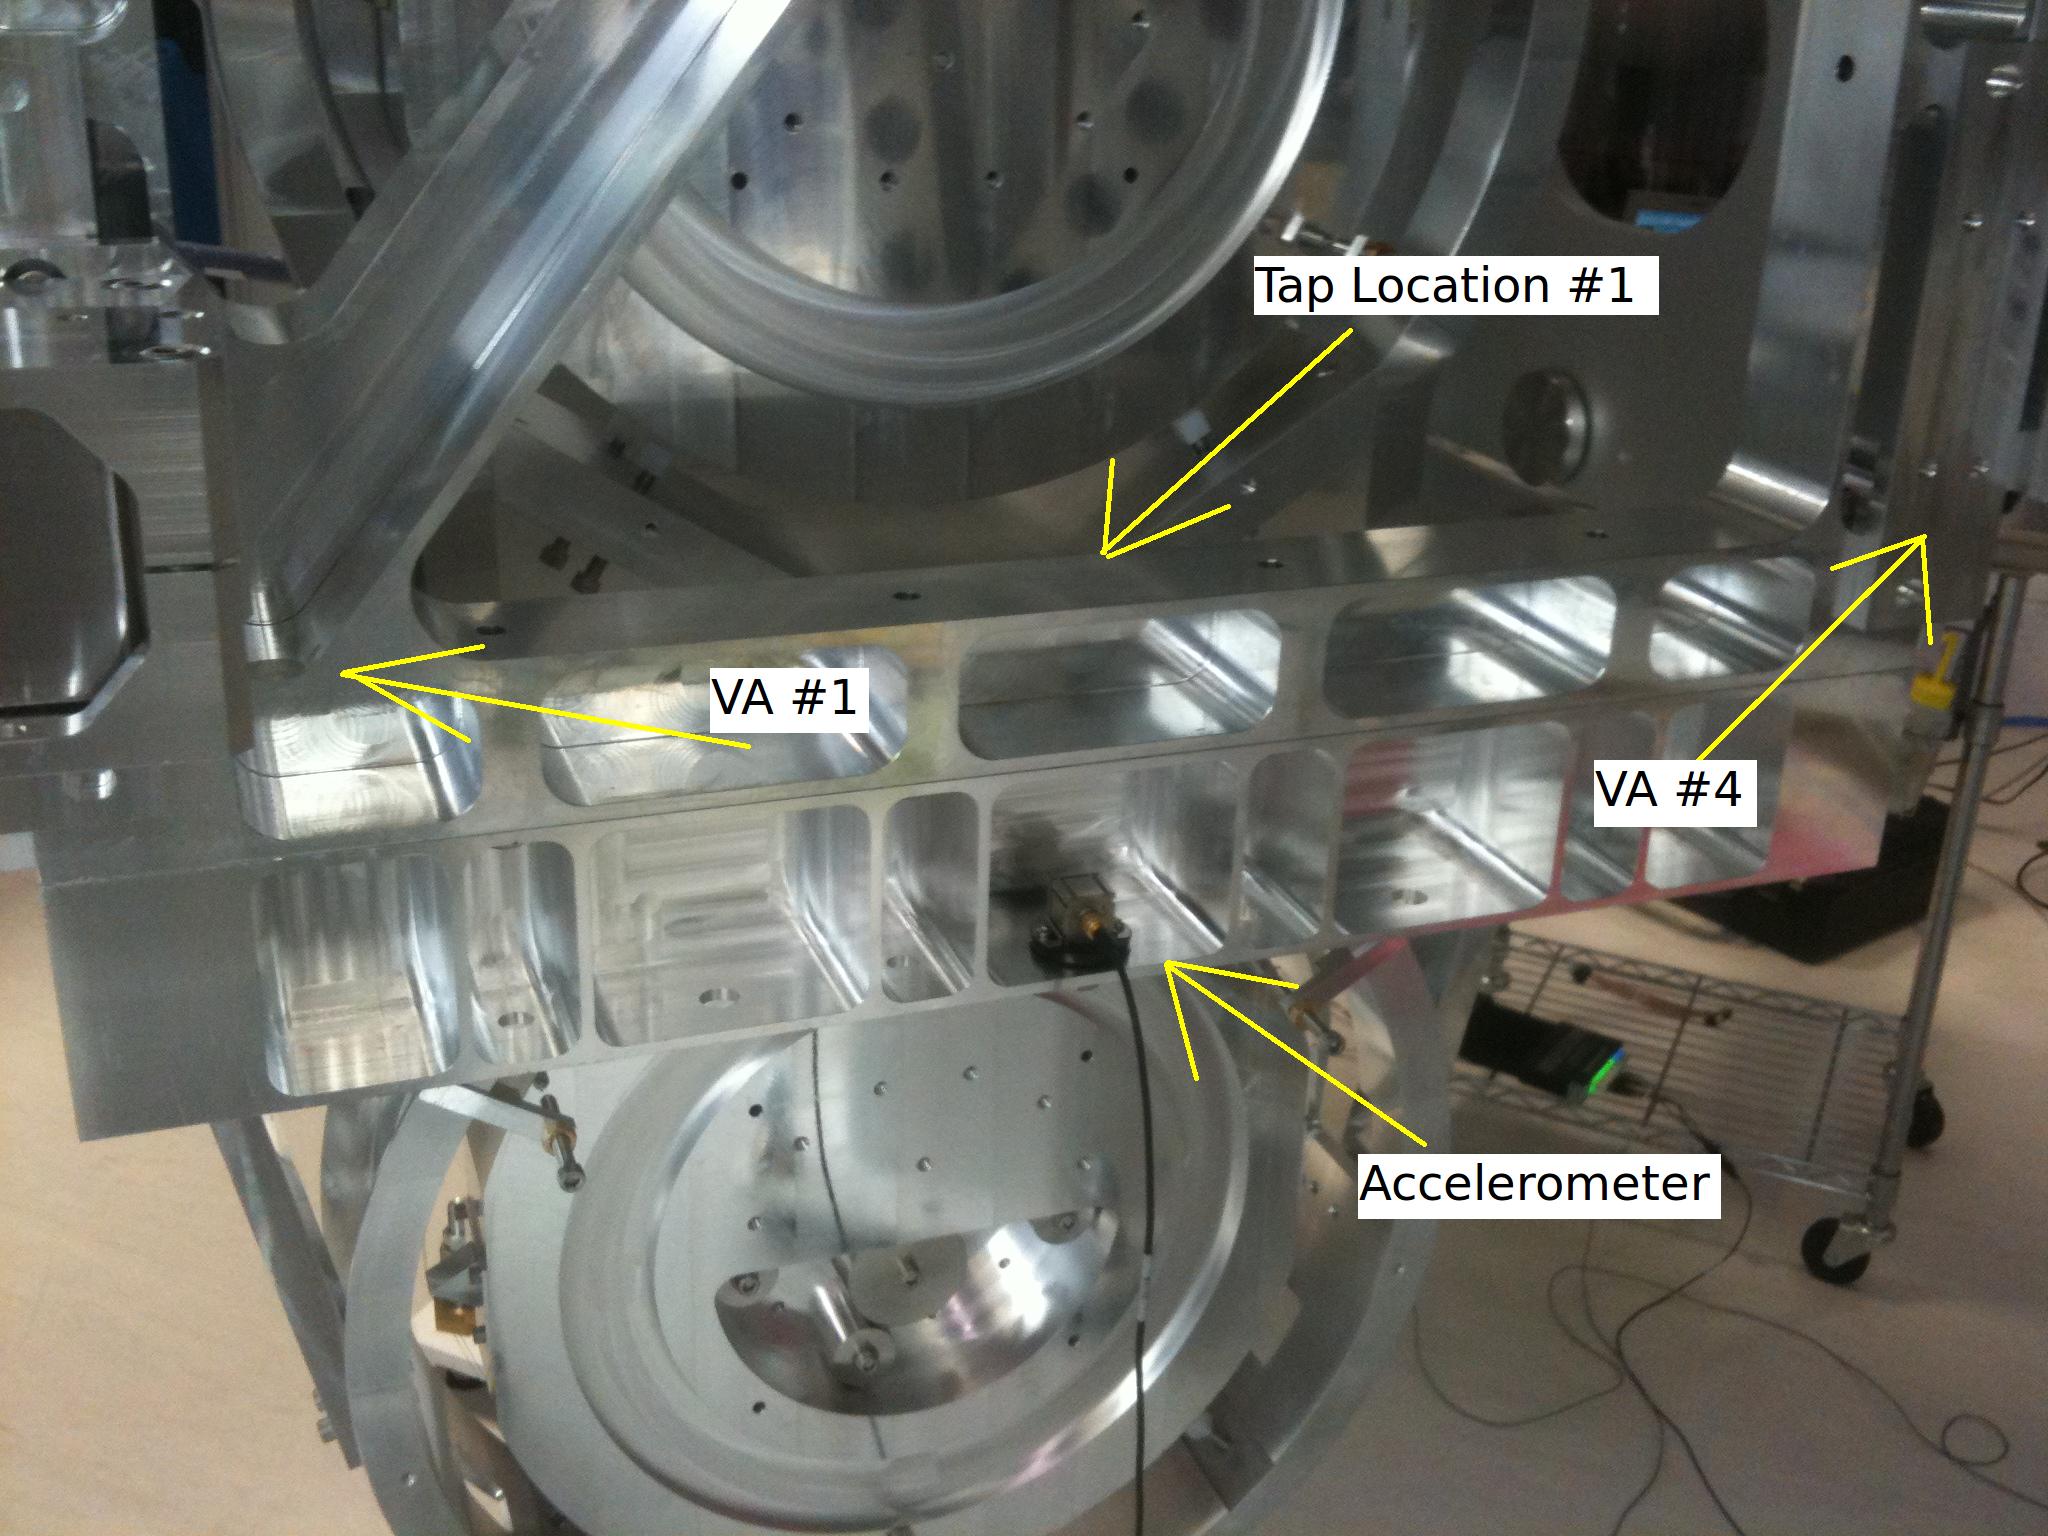
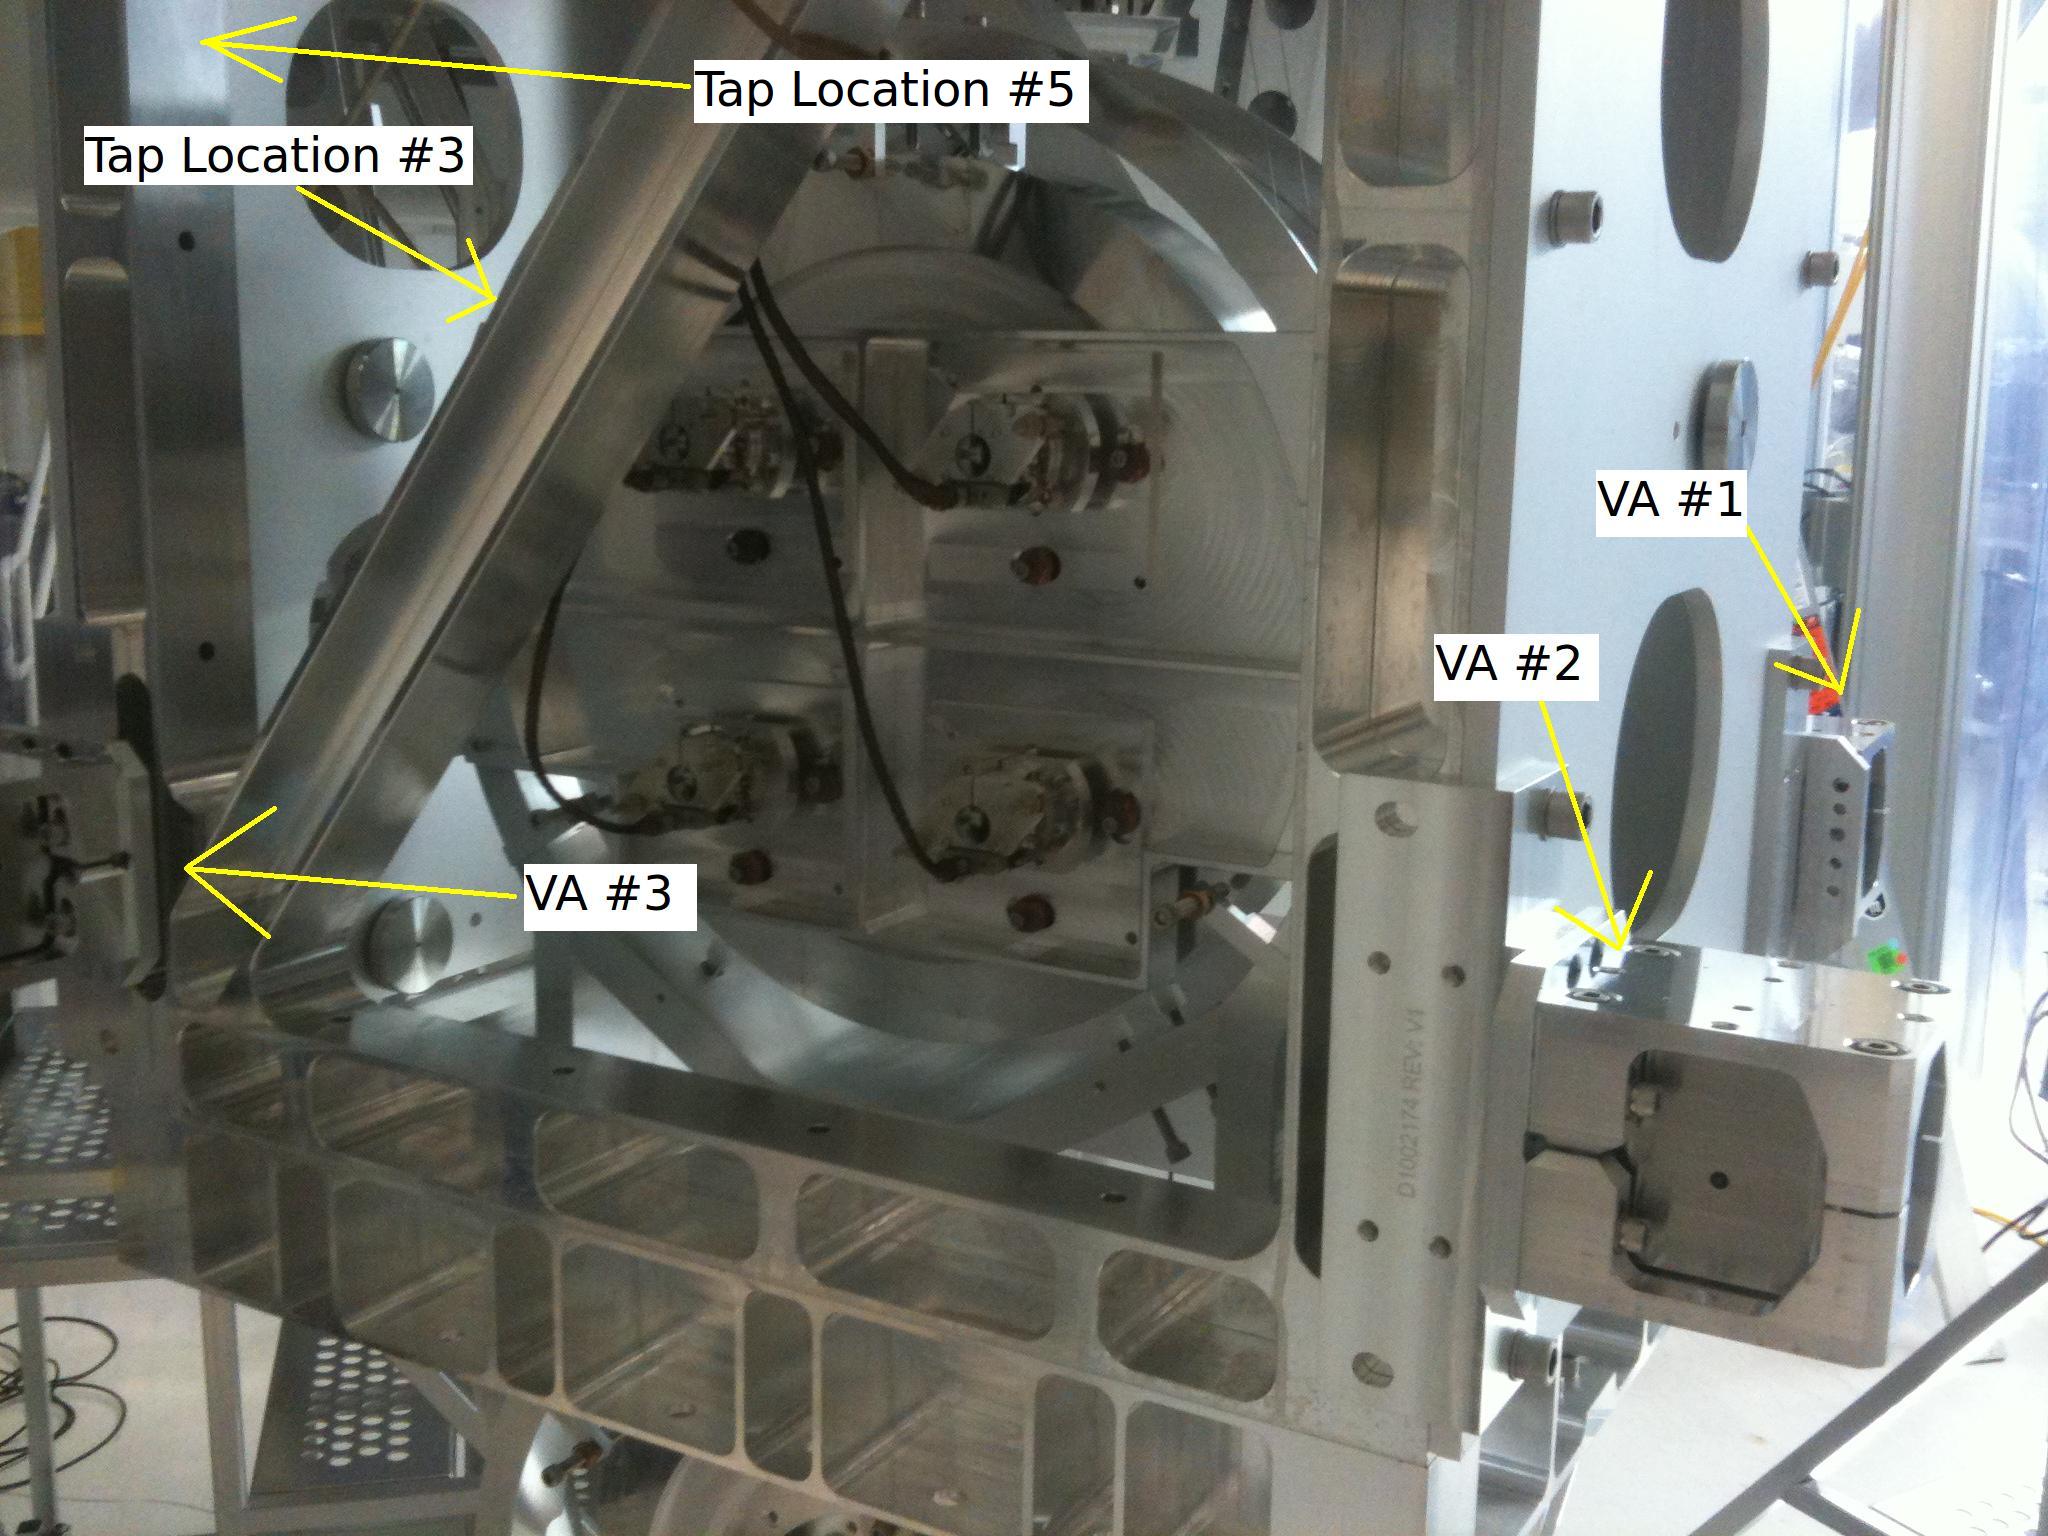
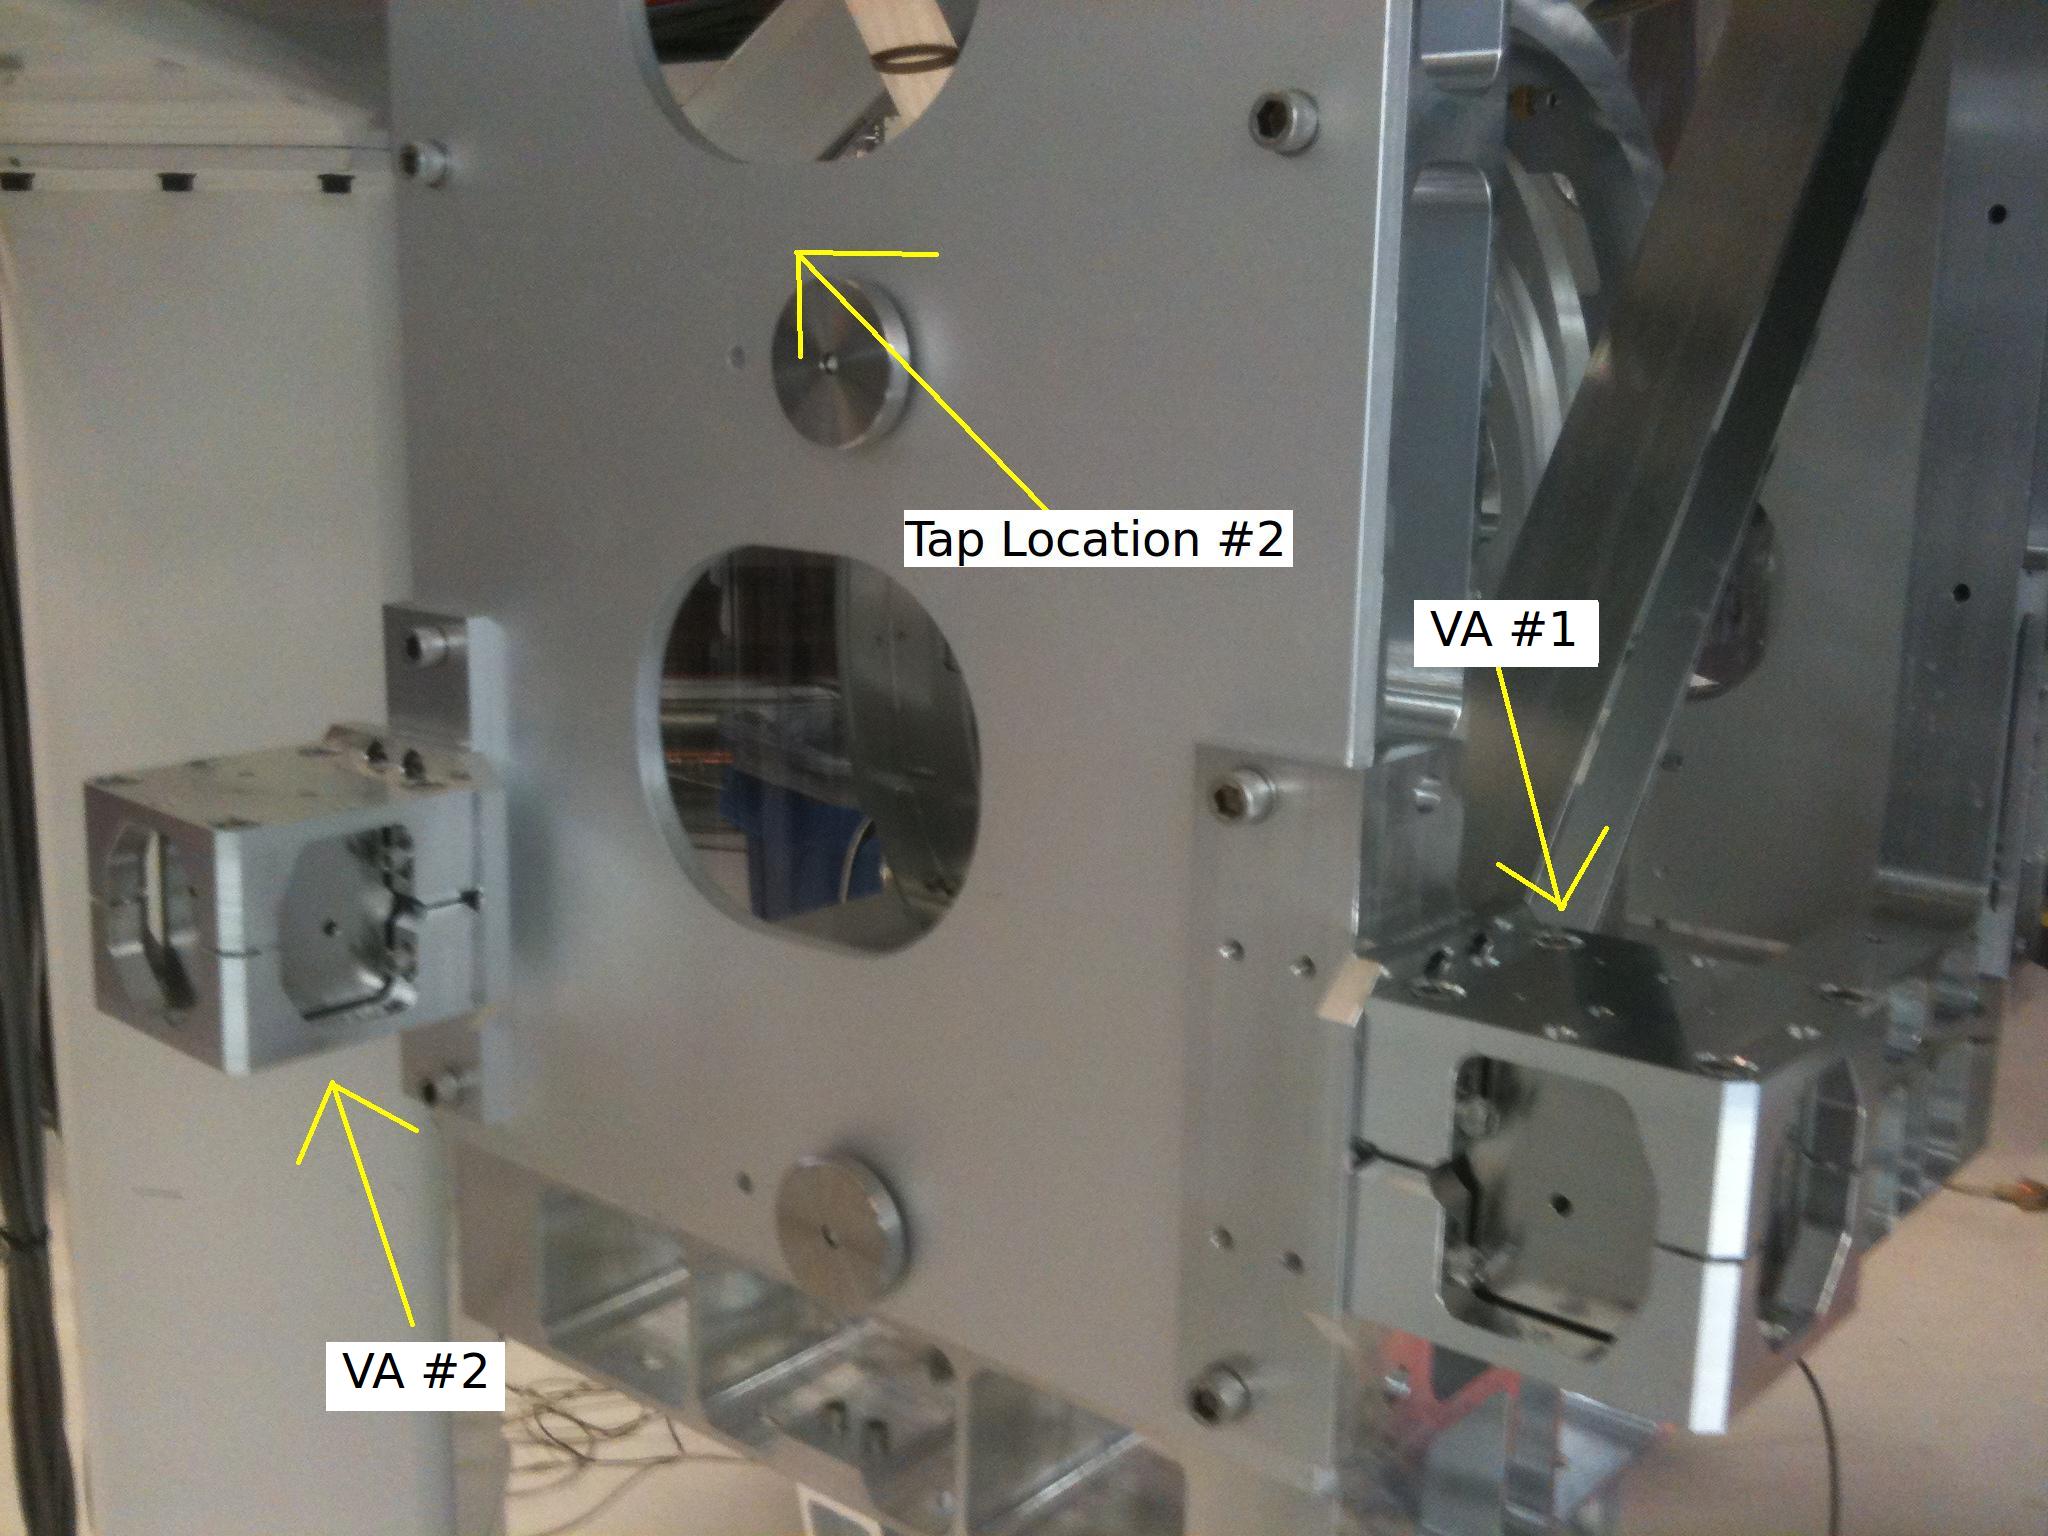
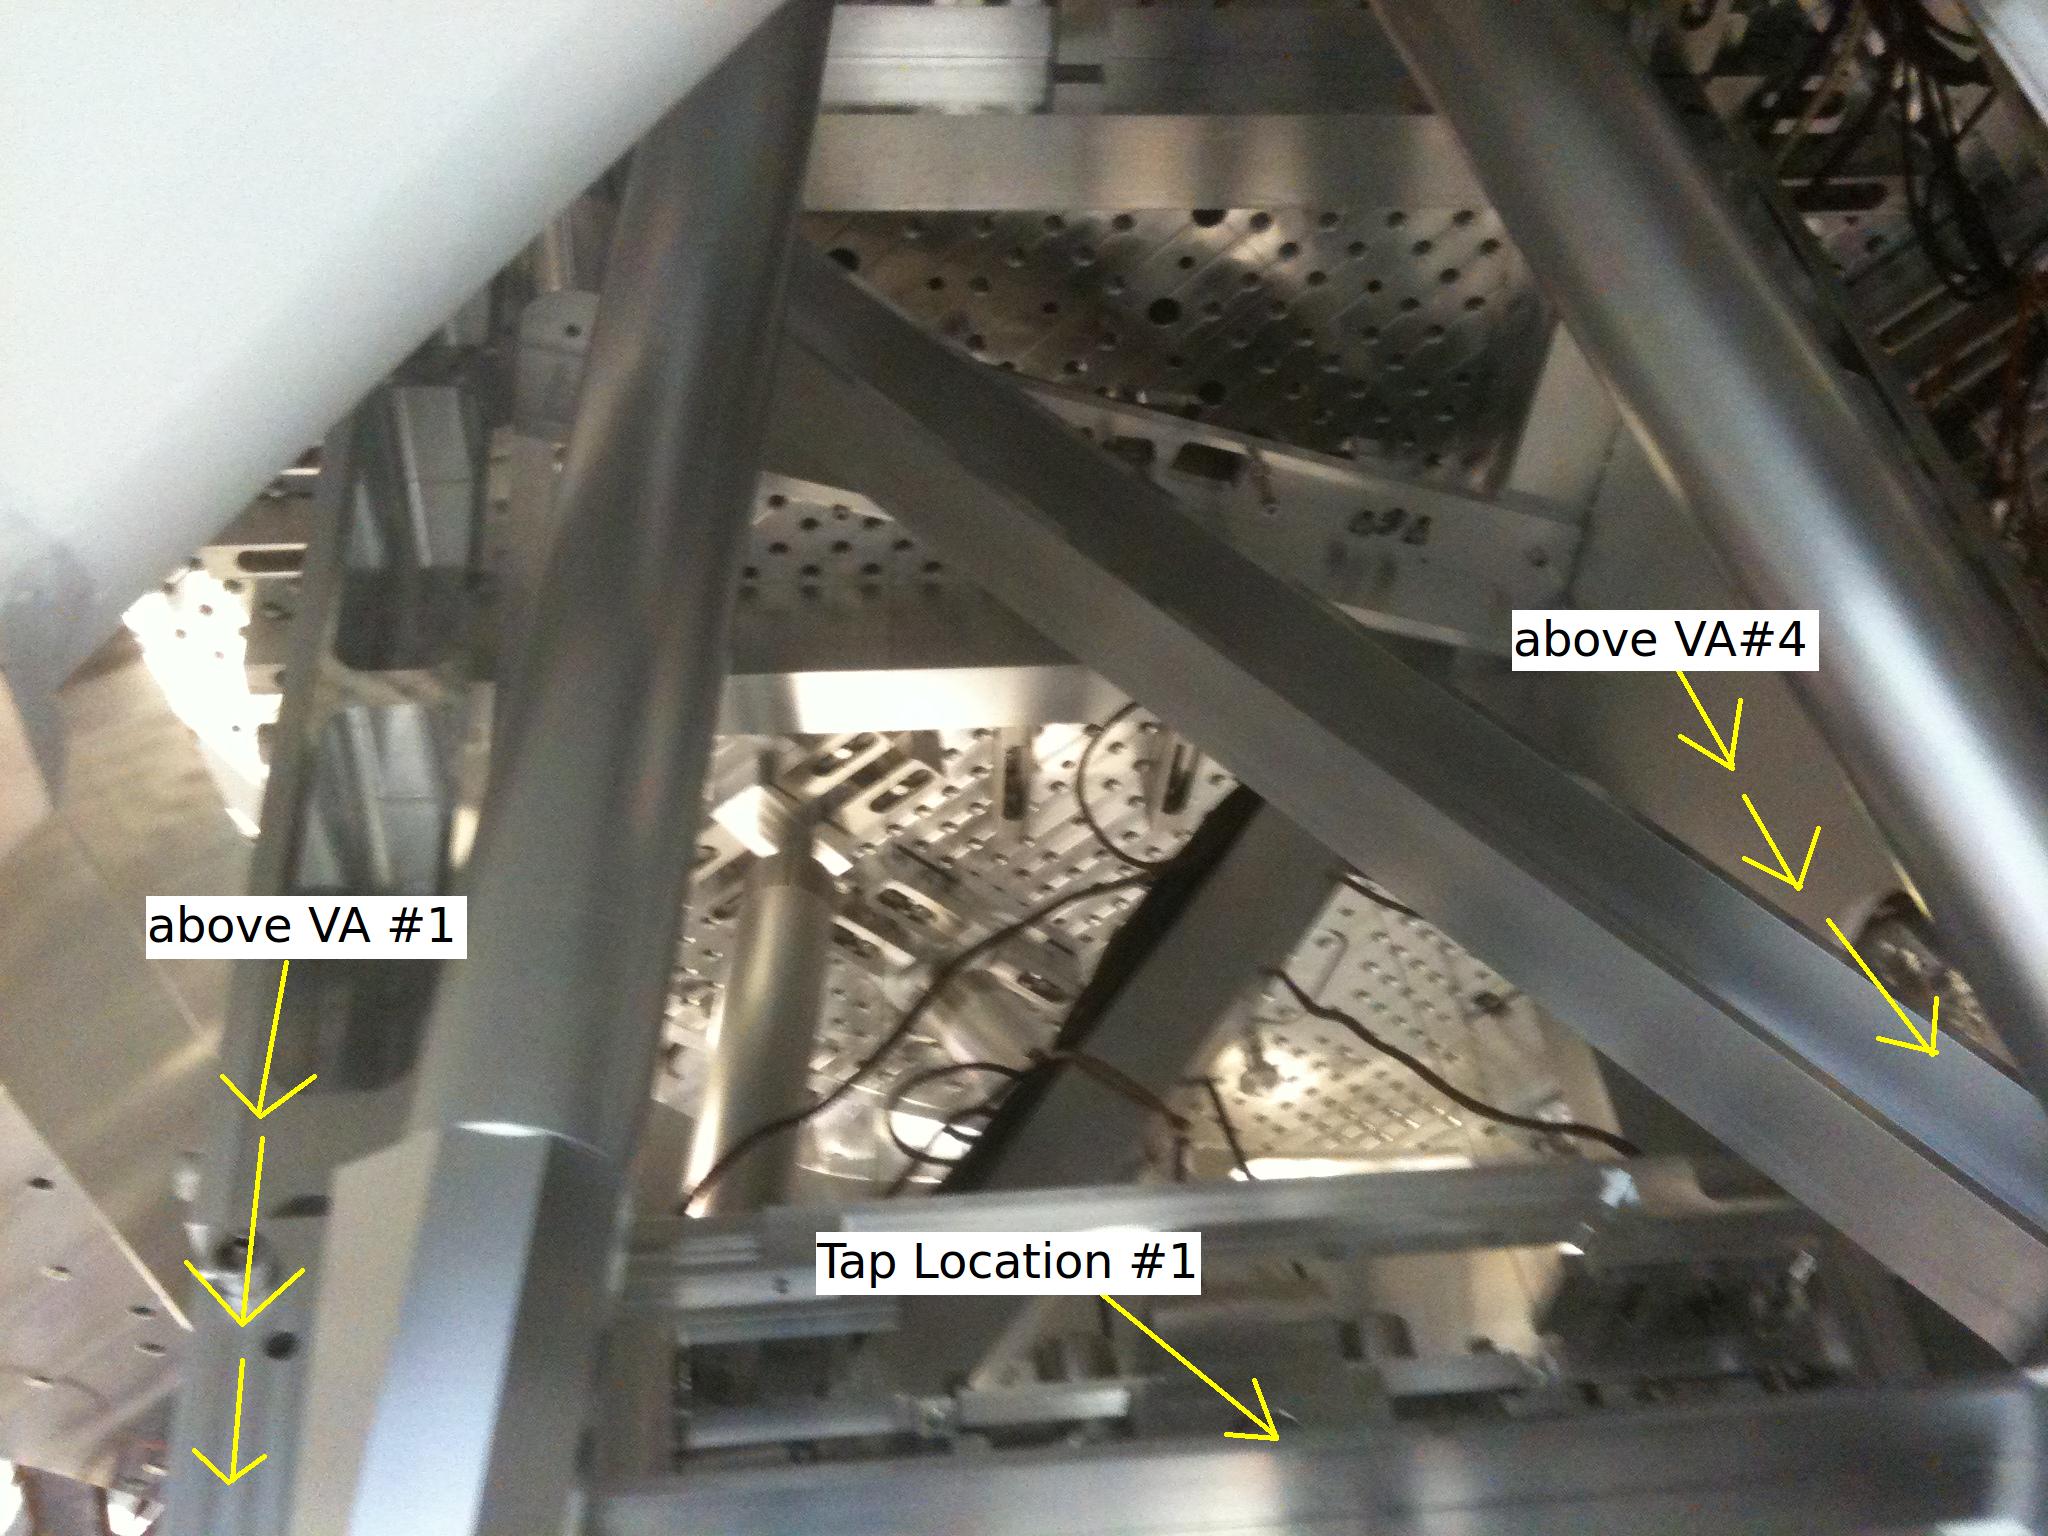
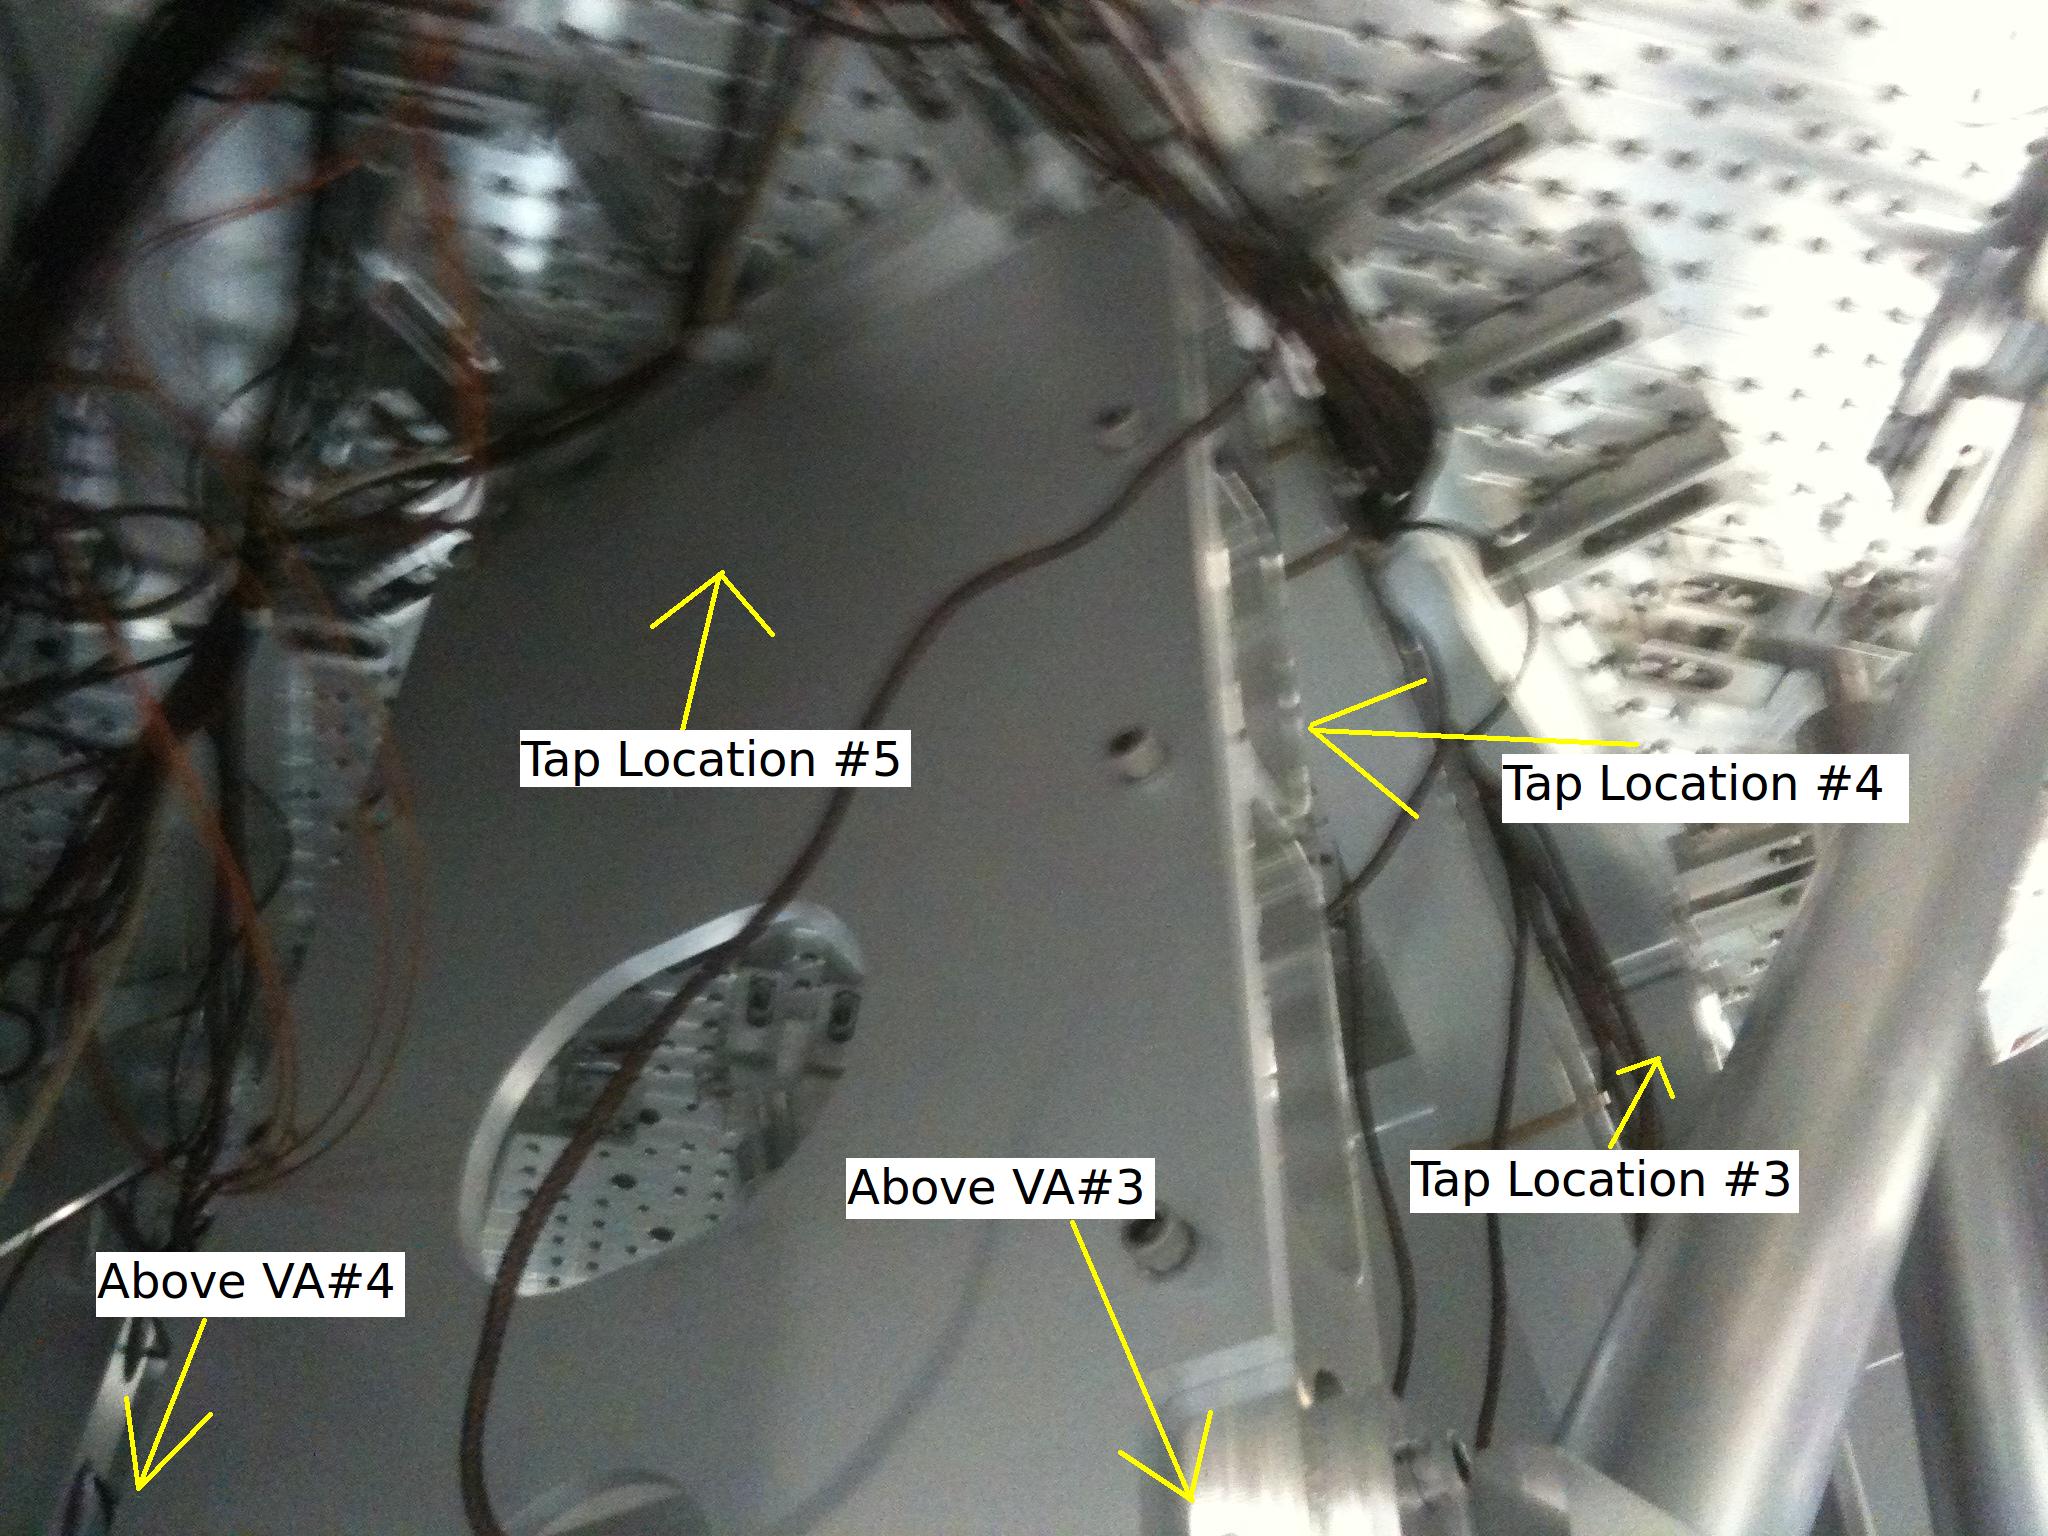
On Monday, impulse response tap tests using the B&K hammer and accelerometer were conducted on the FMY in the LVEA. The structure was attached to a BSC-ISI that was NOT floating i.e. it's springs were locked to prevent free motion of the payload. These tests therefore do not provide information on the full effectiveness of the vibration absorbers in their intended configuration until we can make these measurements with the BSC-ISI floating. Nonetheless, this data can provide useful before/after reference traces. There were 10 locations chosen for these tests - 5 on the lower and 5 on the upper sections of the structure.

Location descriptions:
Lower Structure:
 Location 1 - downward on the cross brace just above the accelerometer
 Location 2 - side of structure between VA 1 & 2 tapping towards the beam tube
 Location 3 - downward on the diagonal brace on opposite face of the accelerometer
 Location 4 - on the cross brace that supports the test mass housing, tapping towards accelerometer but from behind
 Location 5 - above VA 3 on the upper part of the lower structure, tapping on inside of structure

 Upper Structure:
 Location 1 - downward on middle cross brace dividing upper and lower structures just above the accelerometer
 Location 2 - sideways between 1&2 towards beam tube
 Location 3 - upper inside away from beam tube on opposite side of accelerometer
 Location 4 - upper inside towards beam tube about middle way up above VA 3
 Location 5 - on the side of structure between VA 3 & 4 up top of upper

The attached pictures indicate the tap locations and designate an arbitrary Vibration Absorber number.for reference.  The first three are for the Lower Structure locations, and the last two are for the Upper Structure.

Plots:
The first pdf has plots of all five locations on the Lower half of the FMY structure with each plot having each of the X,Y, & Z accelerometer DoFs plotted.

The second pdf has plots of all five locations on the Upper half of the FMY with the same information.

Each data set is from 0-800Hz with 0.5Hz resolution and 5 averages. Plots can be found in the SUS SVN in:
"~svn/sus/trunk/BSFM/H2/FMY/Common/Vibration_Absorber_tap_tests/"
Images attached to this report
Non-image files attached to this report
