jeffrey.kissel@LIGO.ORG - posted 12:48, Thursday 11 January 2018 - last comment - 12:56, Thursday 11 January 2018(40098)
New H1 SUS ITM QUAD's V4 ('Bounce') and R4 ('Roll') Mode Frequencies and Qs Post BRD Install
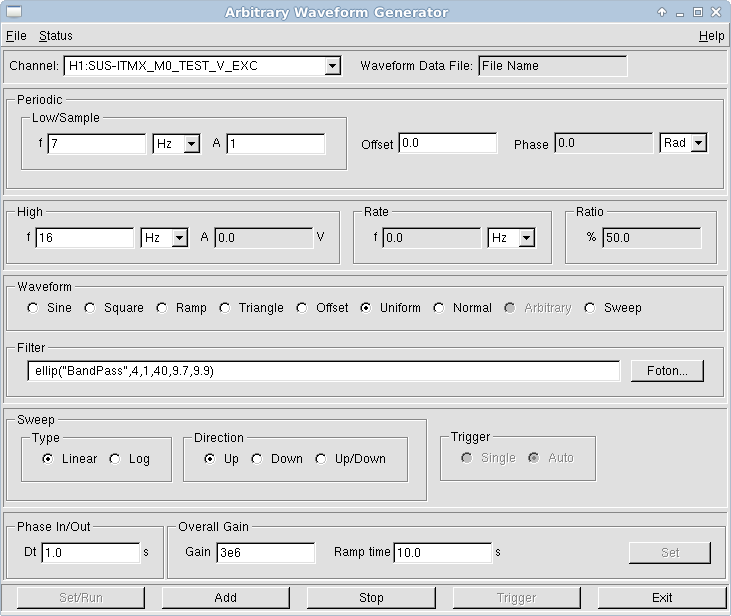
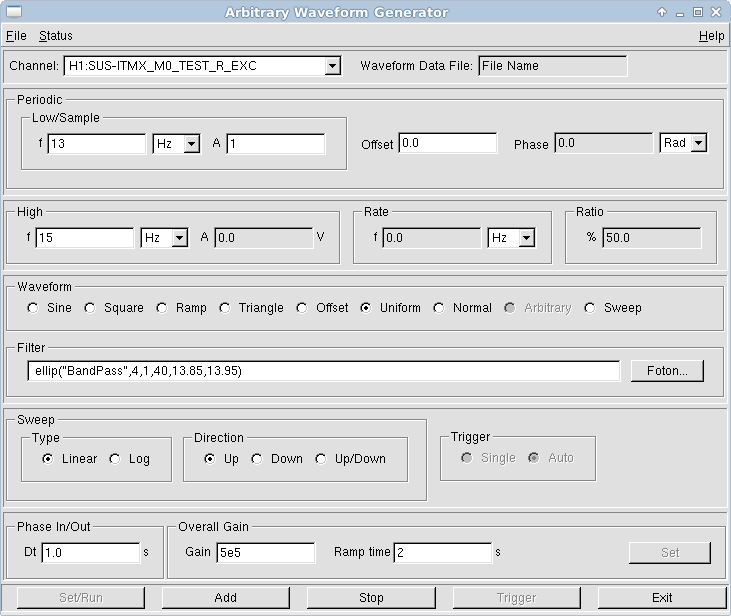
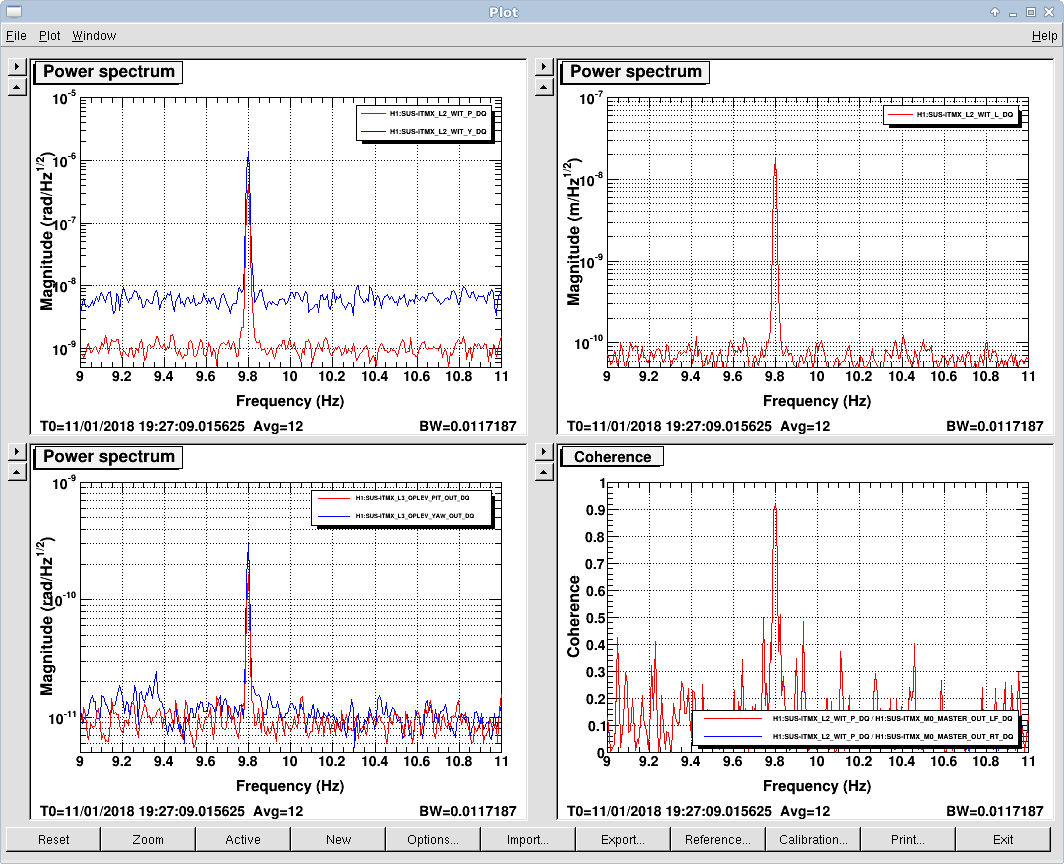
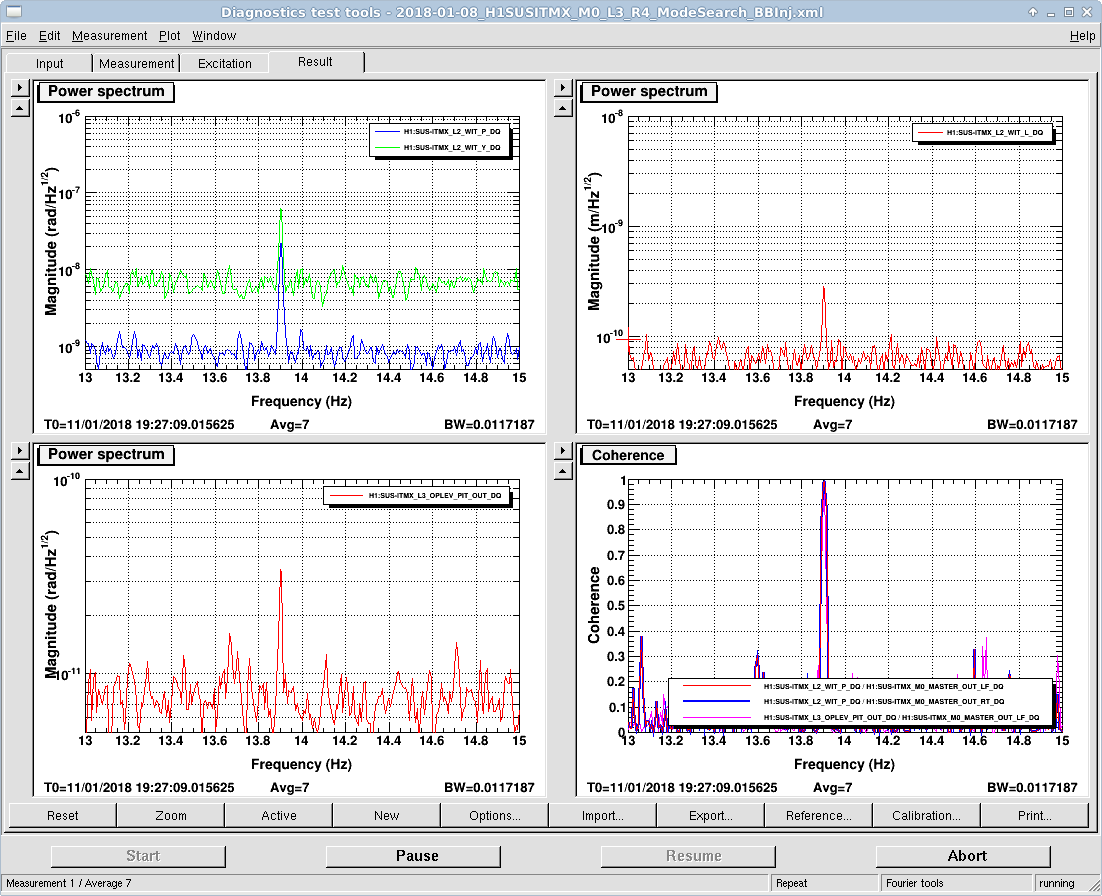
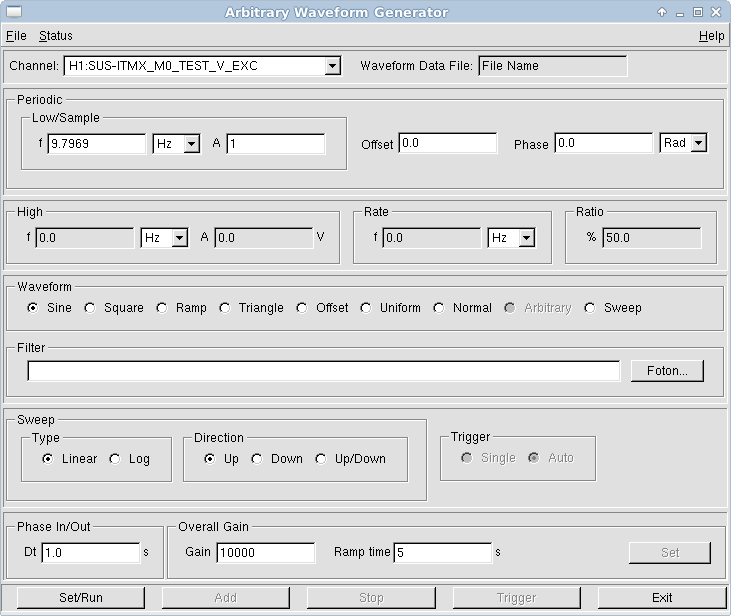
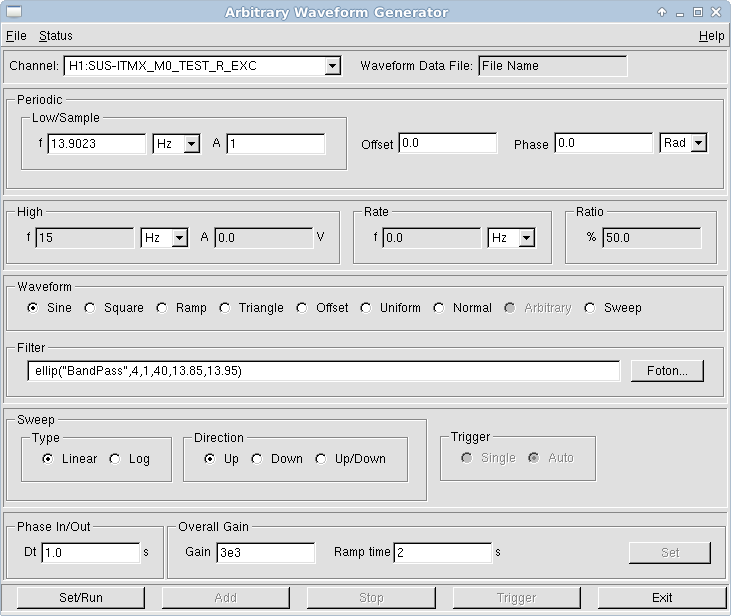
J. Kissel

Using similar techniques as described in LLO aLOG 28503, I've characterized the ITMs new highest bounce and roll (V4 and R4) -- namely the new frequencies for ITMX, and the Quality Factors of modes after installation of the Bounce Roll Mode Dampers (BRDs). The results are tabulated below.

                                ITMX               ITMY

    V4 Frequency / Hz      9.797  (0.001)      9.816 (0.001)

    V4 Q / dim.less        4770   (15)         1237 (0.88)

    R4 Freq / Hz           13.902 (0.001)      13.898 (0.001)

    R4 Q / dim.less        2840   (11)         1406 (3.2)

(The uncertainties quoted for the Q are the 68% C.I., 1-sigma [sqrt of the] weighted sample variance resulting from 3 measurement trials on each mode; the value reported is the weighted mean of the three trails. See more details below. The uncertainty on the frequency is simply the requested binwidth of the ASD used after finding the mode frequency.)

Remember, the goal for these BRDs was to reduce the Q of the V4 and R4 modes from ~10^6 to "one to several thousand" (see pg 6 of G1600371, and thermal noise impact discussion in T1500271).
These Q results are consistent (if not a little lower) than LLO's values, and are within the desired specification.

A successful implementation of the BRDs!

%%%%%%%%
Details
%%%%%%%%

Measurement Technique:
    (1) explore the expected V4 / R4 frequency range to find the mode frequencies.
        - Drive M0 Main Chain Top Mass in Vertical and Roll (I drove out the TEST bank using AWGGUI), using broad-band uniform noise, with a 200 mHz 4th order elliptic band-pass surrounding the expected frequency. You may have to shift the band-pass filter around a bit in the search.
        - Measure the response in L2 OSEMs (in L, P, and Y), L3 Optical levers (in and Y), while watching for digital saturation of the DAC on the M0 LF and RT OSEM chains.
        - Attached are the successful awggui settings during this mode search phase
    (2) Drive up the found V4 / R4 frequencies with pure sine-wave, stop the drive suddenly, and record GPS time
        - Use the maximum DAC range on the M0 drive (which means you can't drive V and R at the same time)
        - Attached is the raw DTT ASD of the above mentioned sensors during the Sine Exc, using the attached awggui settings. The drive level shown is just below DAC saturation.
    (3) Wait for ~1-2 hours for the mode to ring down (not because the Q is that high, but because you want 1-2 hours of excitation-free data for high resolution ASDs during later analysis)
    (4) Rinse and repeat steps 2 and 3 to have several measurement trials (I used three trials)
    (5) Use /ligo/svncommon/SusSVN/sus/trunk/Common/MatlabTools/BandR_damping_plot_Q.m to analysis each trial's ring down
        - The Q is determined by fitting the decay of RMS of the displacement ASD at the mode frequency to an exponential, A*exp(-t/Tau), and extrapolating the Q as Q = pi*f0*Tau.
        - The FFT, bandpass filter, and RMS parameters/settings play an important roll in the resulting RMS data, so one must play around with these a bit for each mode to find the right settings for all trials of a given mode. For example, if your band-pass is too narrow (say 1 mHz), then the resulting RMS will include some of the non-excited data / impulse response of the filter, which confuses the resulting RMS making it look like a really large Q. However, once you're happy (namely, when the RMS time series remains roughly the same for small changes in analysis settings -- and the same settings give consistent results for all trials), the settings should remain fixed, if possible, for all trials of a given mode.
        - The initial guess of the amplitude A also affects the fit, simply because it is arbitrary when your ~1.5 hour data set starts w.r.t. where the ring-down begins.
        - The value and its uncertainty is reported by the Matlab built-in "fit" function, and the 68% confidence intervals are reported on the fit object using confint.
    (6) The results are averaged for each mode in /ligo/svncommon/SusSVN/sus/trunk/Common/MatlabTools/BandR_trials_comp_Q.m, which takes the weighted mean, and weighted sample variance (as well as the standard error on the mean).

The .pdfs attached cover the results of all the data analysis.
Images attached to this report
Non-image files attached to this report

Comments related to this report
That's great news. Well done all involved.