jeffrey.kissel@LIGO.ORG - posted 13:00, Wednesday 10 May 2023 (69478)
More Results Mapping SRC Detuning in the DARM Response (Sensing Function, Systematic Error) vs. Time
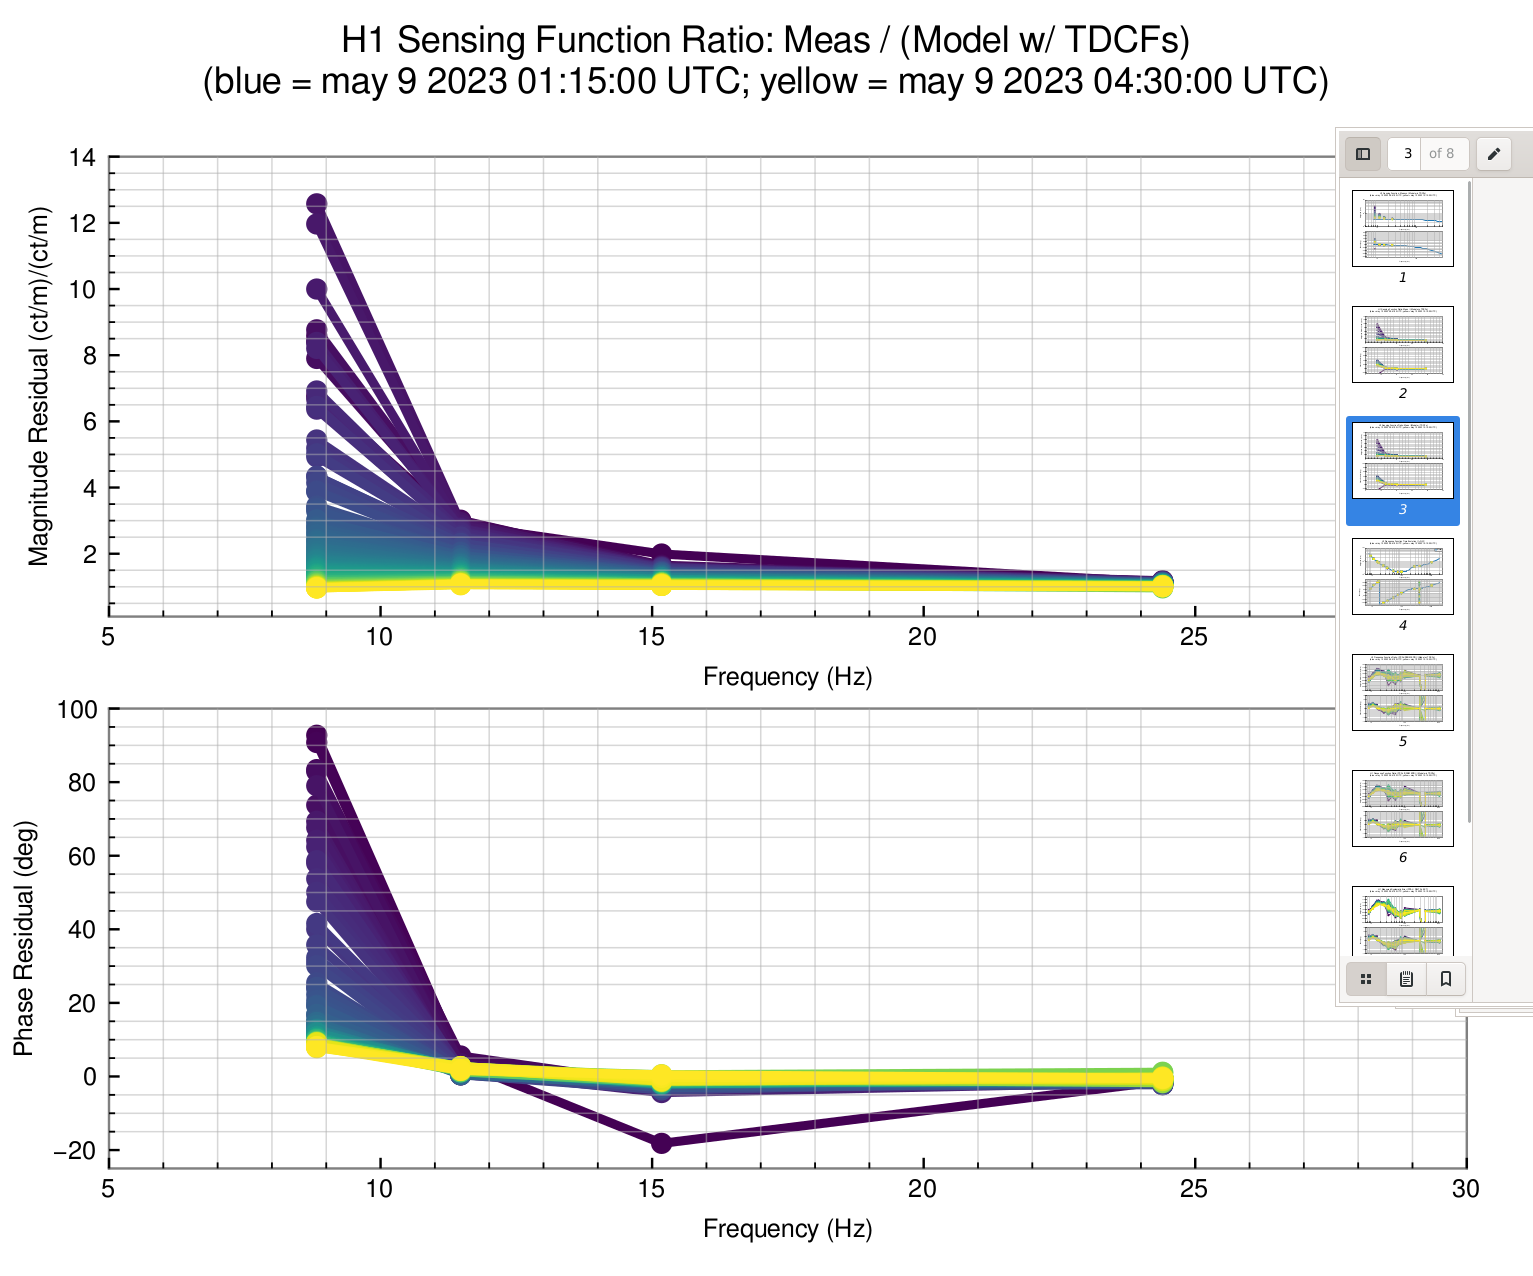
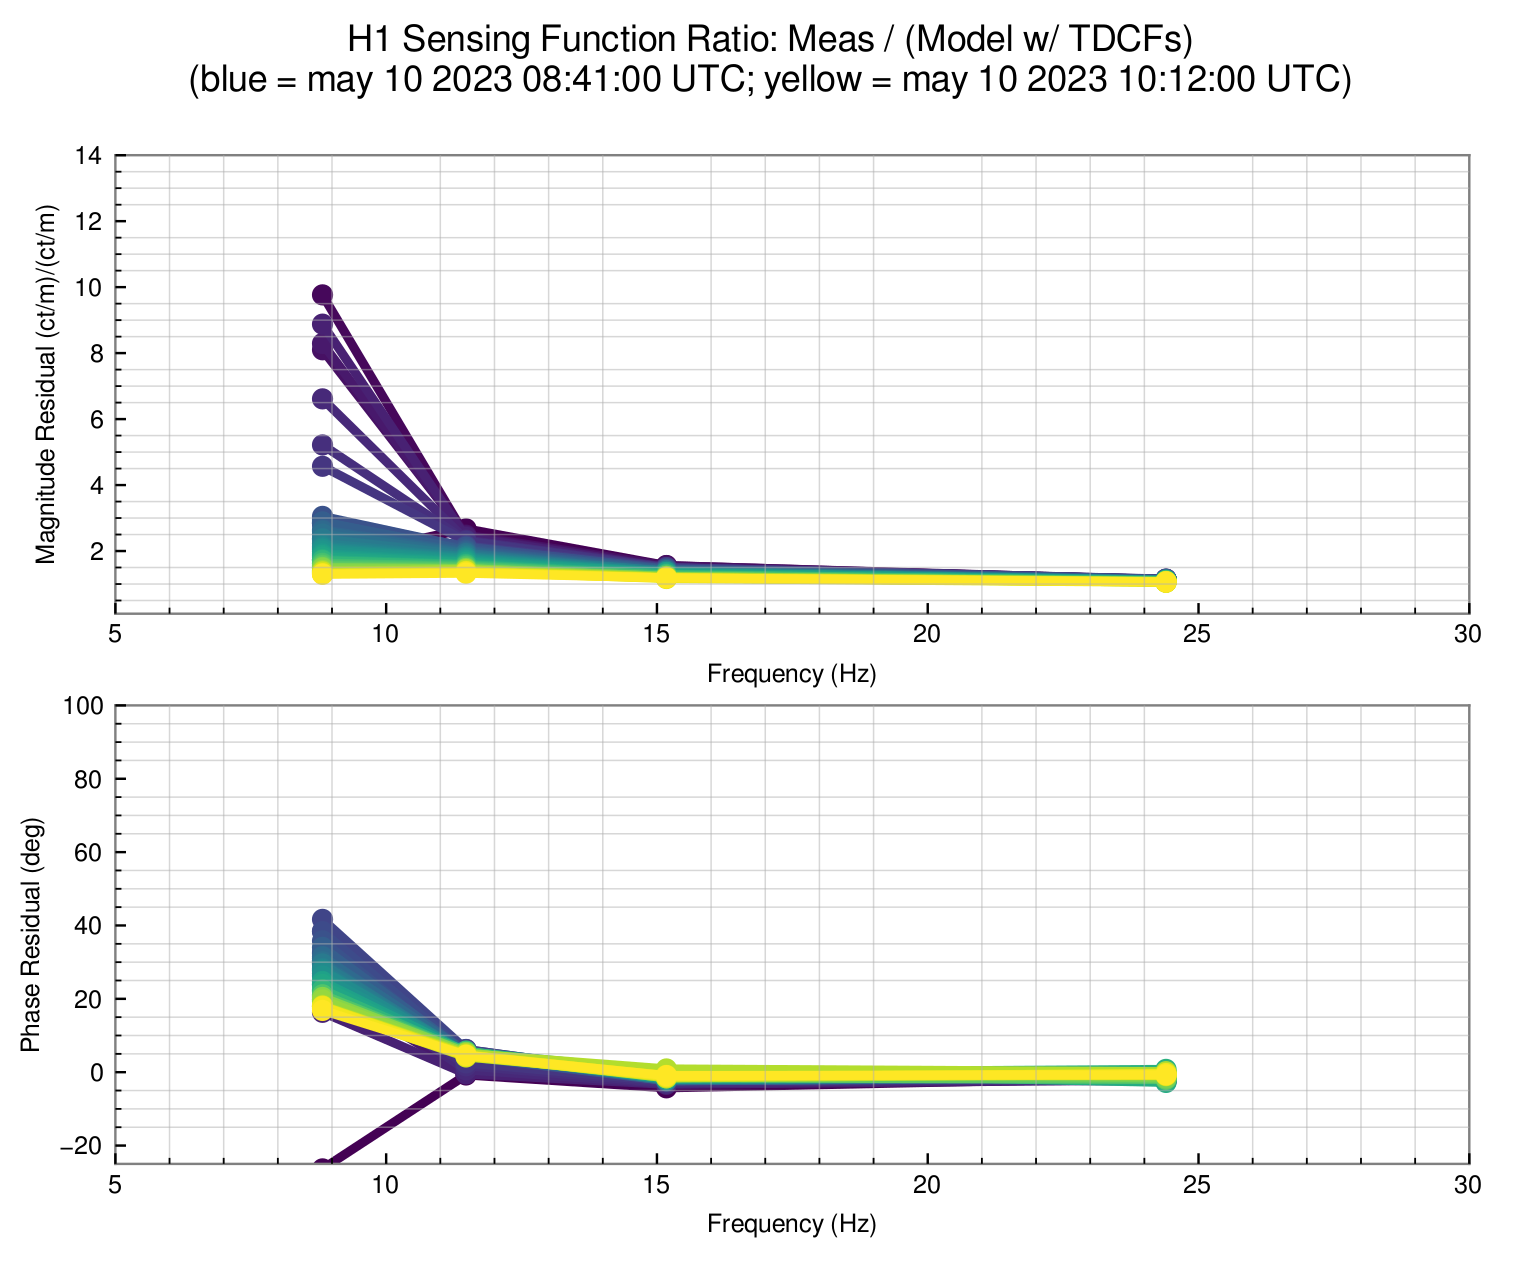
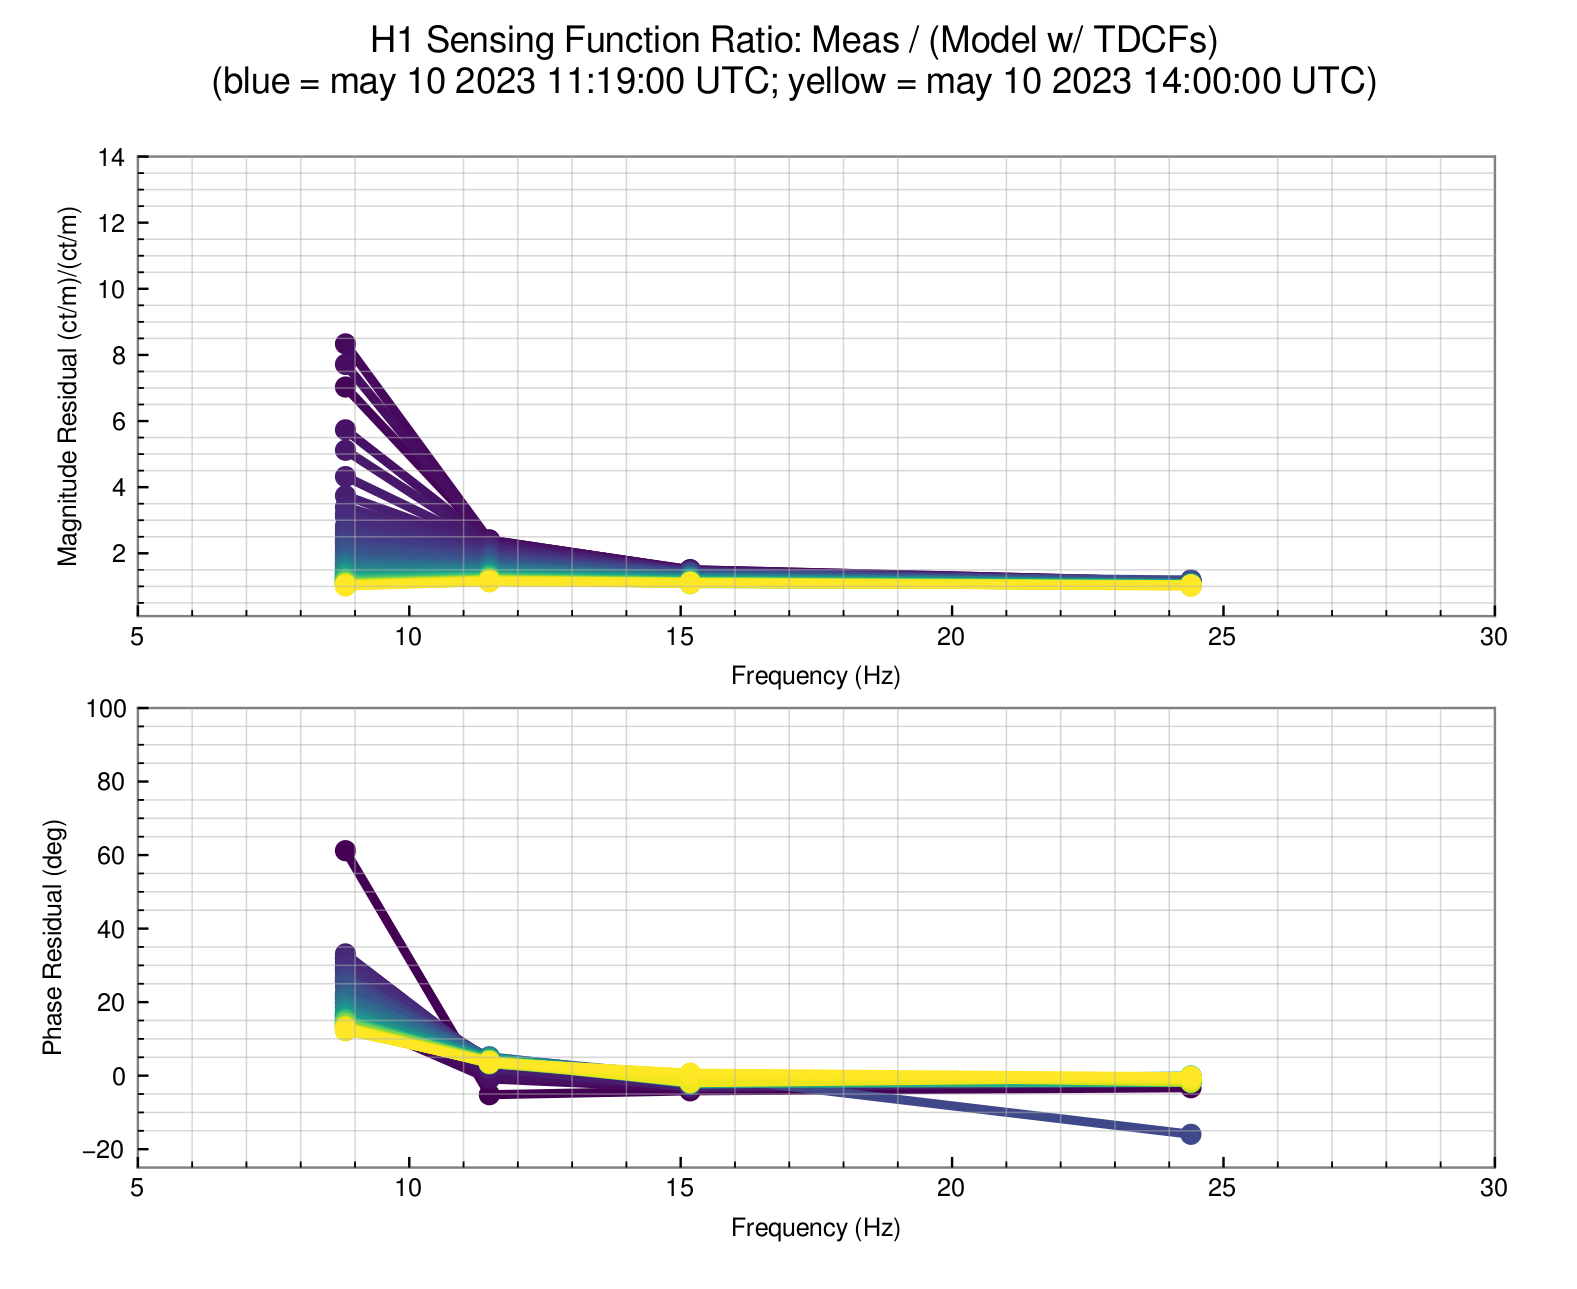
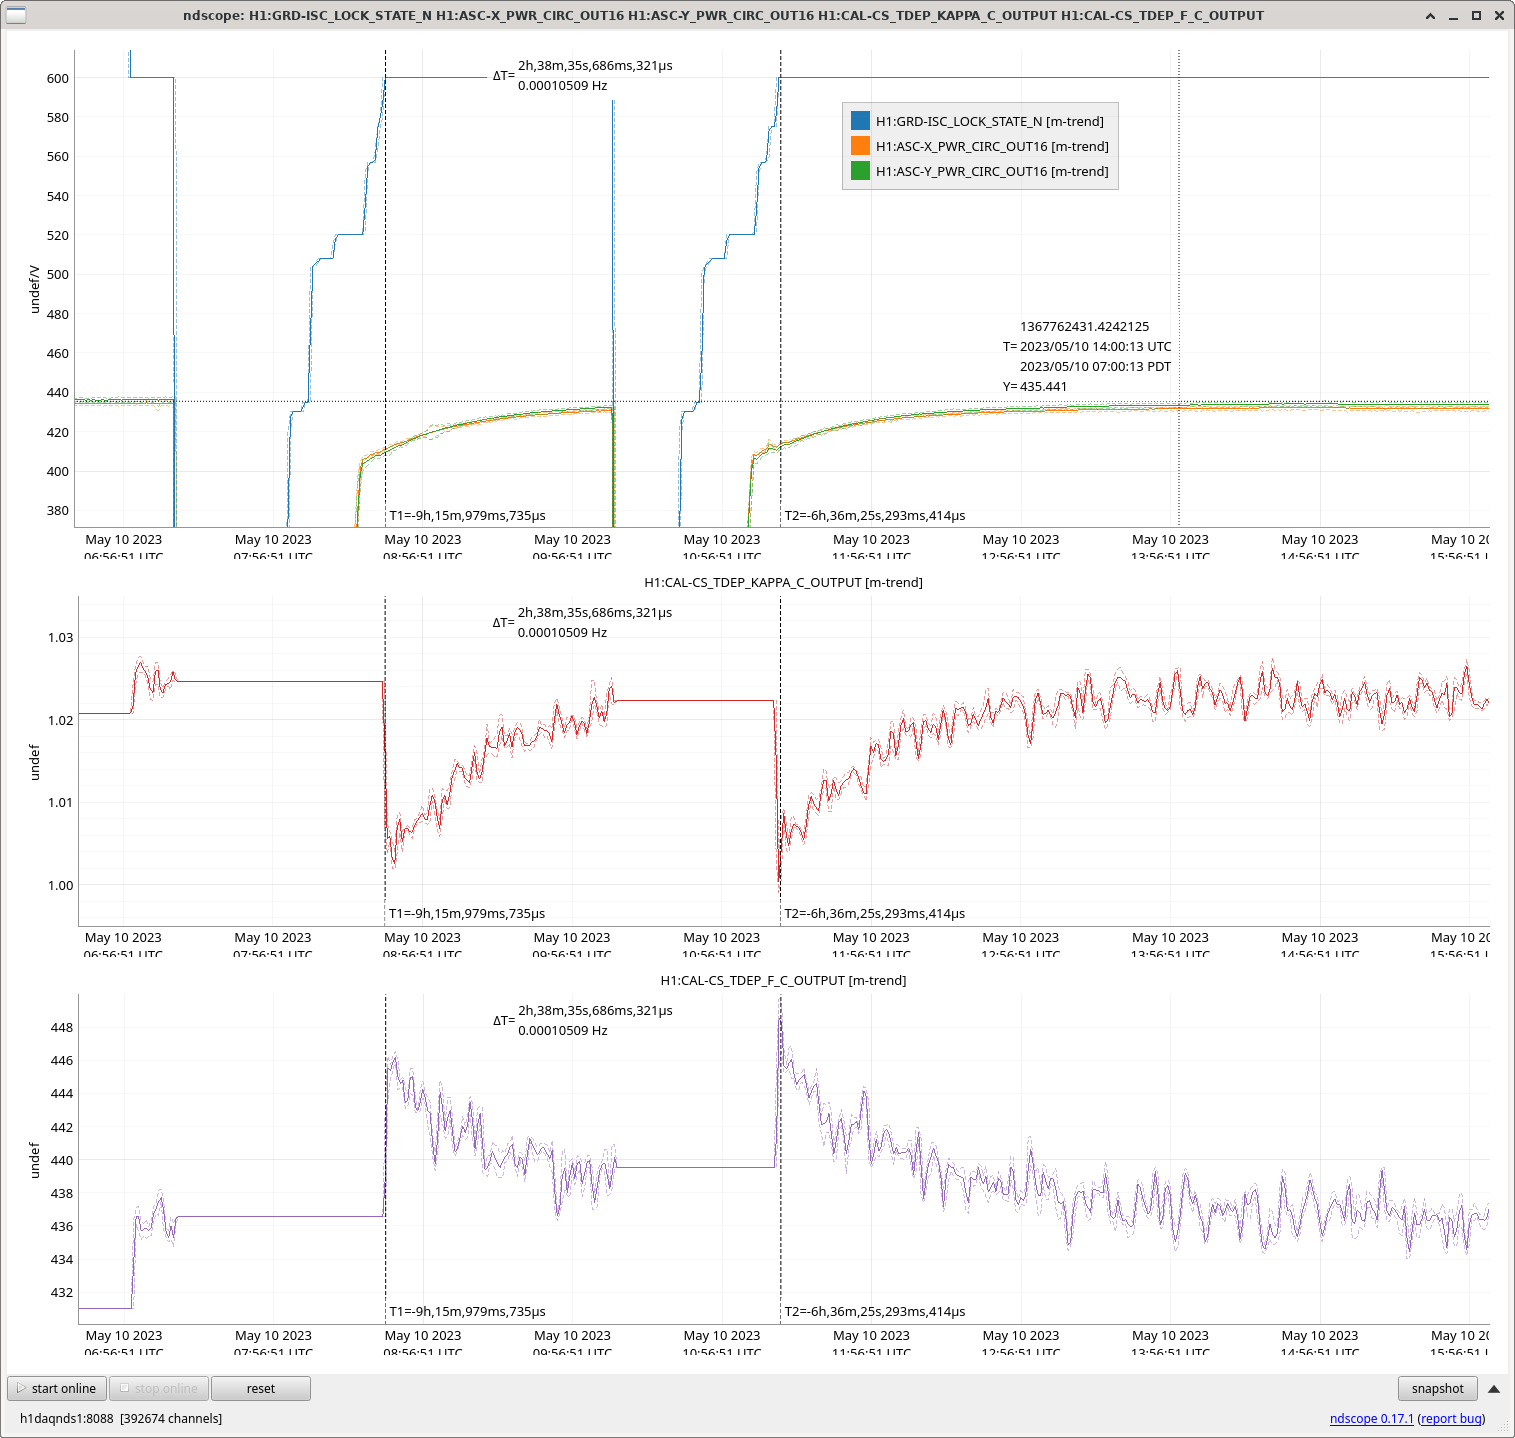
J. Kissel

Now that we've settled on a SRCL offset of -290 ct (-2.8 nm = -1 deg) LHO:69402 and DARM offset of 9.7 ct (~6 pm = 40 mA on the DCPDs) LHO:69358, I've used Evan's code from LHO:69301 (which now lives in the Calibration group's git repo common scripts project under process_sensing_darm_comb.py) to process three thermalization periods over the past few day's worth of lock acquisitions, whose times and duration are listed below.

Period  UTC Start             UTC Stop    GPS Start      GPS Stop     Segment             Feature Plot                   Plot collection
        YYYY-MM-DD                                                    Duration (hours)
(A)     2023-05-09 01:15:00   04:30:00    1367630118     1367641818   3.25 (3h 15m)       2023-05-09_0115-0430UTC        plots-1367630118-1367641818.pdf

(B)     2023-05-10 08:41:00   10:12:00    1367743278     1367748738   1.51 (1h 30m)       2023-05-10_0841-1012UTC        plots-1367743278-1367748738.pdf

(C)     2023-05-10 11:19:00   14:00:00    1367762418     1367752758   2.68 (2h 40m)       2023-05-10_1119-1400UTC        plots-1367752758-1367762418.pdf

To get a big picture feel for what's happening, first open up the 2023-05-10_0700-1600UTC_IFOStatus_trend.png which shows the following metrics of IFO status during periods (B) and (C):
    - the ISC_LOCK guardian state. Recall that 600 is nominal low noise.
    - the power in the arm cavities, show our best (most sensitive, and consistently available) metric for thermalization, where "thermalized" is ~430 kW.
    - The 410.3 Hz PCALY calibration-line informed relative optical gain, \kappa_C, where we see a value of 1.0 at the beginning of the thermalization period, and 1.024 (2.4% high) once thermalized
    - The410.3 Hz PCALY calibration-line informed coupled cavity pole frequency, f_cc, where we see a value of ~445 Hz at the beginning, and 435 Hz once thermalized.

Then, open the three period's worth of "Feature Plots." This shows the sensing function *residual* as a function of time -- the direct measurement of the sensing function (informed by new-ish, temporary-ish CAL_AWG_LINES calibration lines; LHO:69284) divided by the reference model of the sensing function (informed by the latests pydarm_H1.ini parameter set LHO:69332). The reference model is also compensated for the reported change in \kappa_C and cavity pole frequency "time-dependent correction factors" or TDCFs mentioned above (though their values are taken from the GDS pipeline's production from the 410.3 Hz calibration line rather than the CAL-CS answer in the trend).

Each trace is a 2 minute time period.

All three thermalization periods report the same thing: since the fixed SRCL offset is intending to compensate for a large *anti*spring when the IFO is thermalized and by making the sensing function flat, it's perhaps no surprise that before thermalization -- when the cavity pole is high at ~450 Hz (and I conjecture that when the low-frequency sensing function is still flat, with no detuning) -- we see a large pro-spring at the beginning of the thermalization period until the IFO thermalizes.

The other thing that's sad and consistent is that the data showing what would be unphysical phase evolution *if* the only thing that was going on was a "simple" spring detuning evolution from pro-spring to tuned. This is, equally sadly, consistent with the pro-spring detuning that we've seen in O3 -- see the breakdown of measurement compared against the mathematical equations for pro- and anti- springs in LHO:48083. No surprise, but -- this continues to support that there is more physics than just a detuned optical spring happening here in the low-frequency sensing function.

At least the thermalized answer appears to be landing on the same location, which is consistent with what we've been seeing with the long sweeps that we run after thermalization.

Unfortunately, the data also shows that the thermalization is not consistent between these three periods -- there's shows a much larger magnitude pro-spring detuning than (B) and (C), and the starting phase is different by ~5-10 deg.


There are much more interesting plots in the .pdf collections for your perusal, showing
    (1) The live measured sensing function compared against the reference model (before correcting the reference model by the \kappa_C and f_cc TDCFs)
    (2) The sensing function residual, but unlike the feature plot, the reference model is *not* corrected by the TDCFs
    (3) A repeat of the feature plot
    (4) The live measured *response* function, PCAL / DARM_ERR = (1+G)/C, using *all* the PCALX and PCALY lines, compared against the modeled *response* function
    (5) The ratio the measurement vs. model in page (4), without correcting for TDCFs. This, we affectionately refer to as the response function "systematic error," or the "systematic error in the calibration"
    (6) Same as (5) but *with* correcting for TDCFs
    (7) A display of the live computation the "systematic error" that's been recently commissioned, from LHO:69285
    (8) A time-series report of the TDCFs that were used during the period.

The study leaves a lot to be desired for the next steps, that I'll continue to work on.
    (1) In addition to the 3-dimensional Bode feature plot, that shows the sensing function residual evolution in time as an evolving rainbow of colors, we want a time-series trend of the answer for the full time stretch as well. This will give a better feel the exponential nature of the evolution.
    (2) We'd really love to see more lower frequency data points, to really resolve the spring
    (3) We'd like to validate the processing of the sensing function with these continuous lines in the same way that we validated the broadband injections from LHO:69402
Images attached to this report
Non-image files attached to this report
