Sheila, Daniel, Vicky
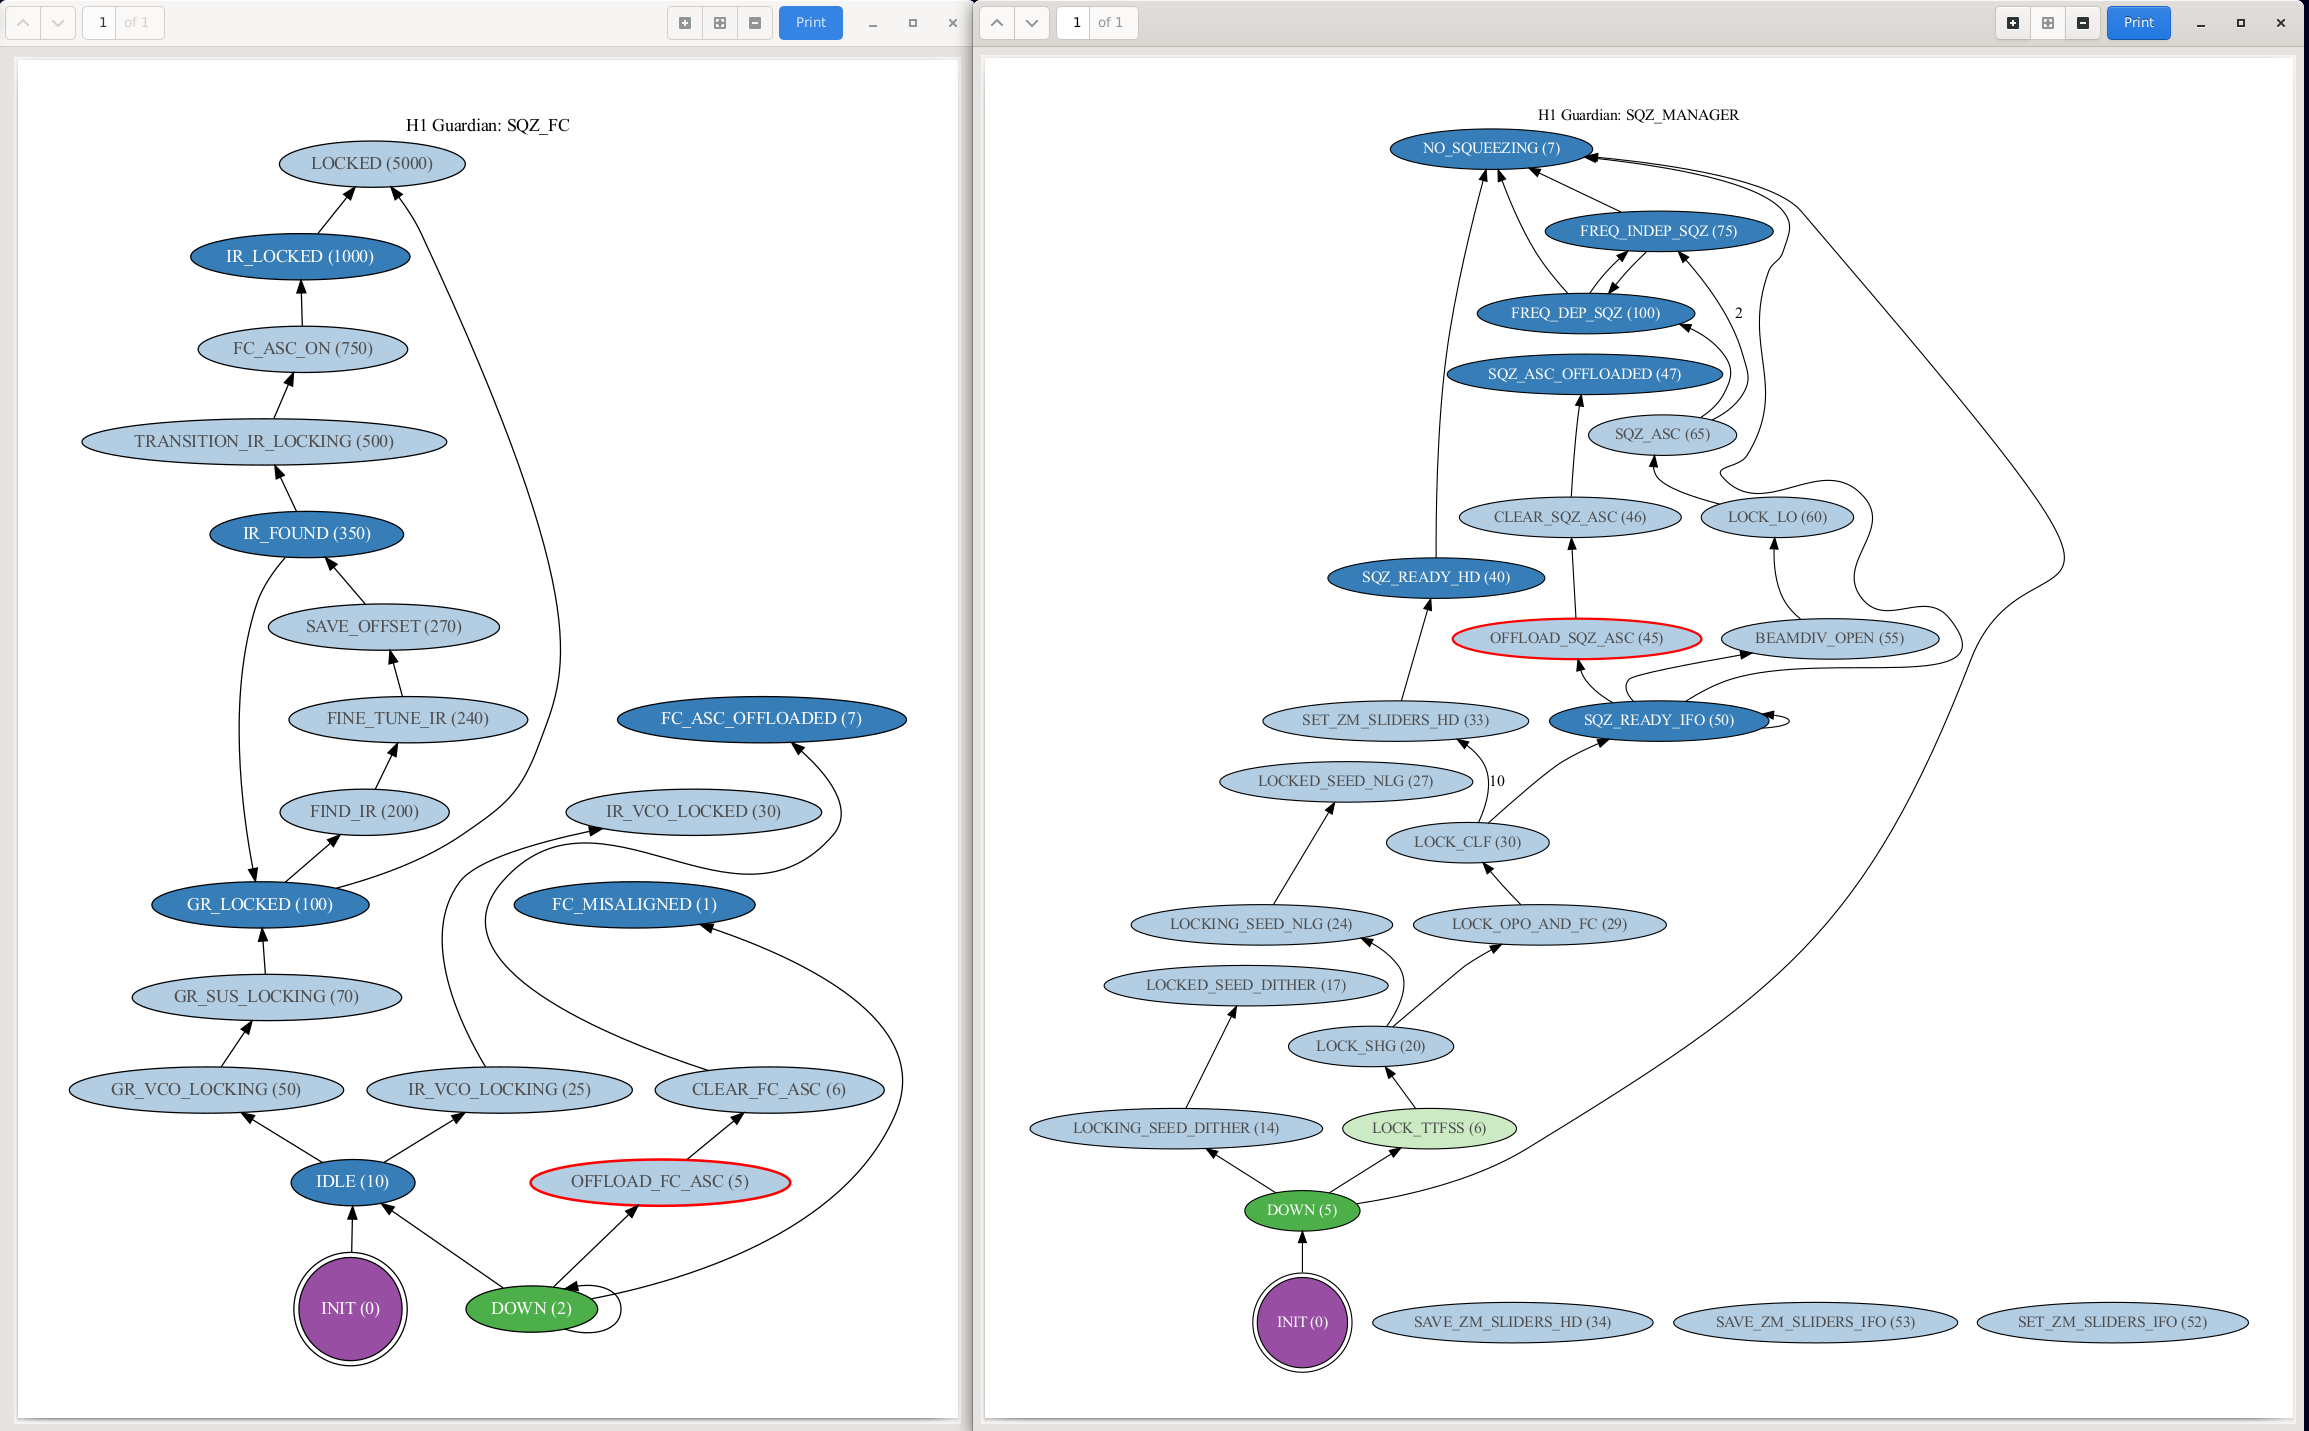
Given our squeezer ASC offloading issues, Sheila and I have guardianized our SQZ ASC offloading in SQZ_FC and SQZ_MANAGER. See updated graphs; currently offloading states are only selectable when ASC is not running, but this is subject to change as we go. Guardians tested while IFO was down from an earthquake, and the following states work to offload and clear ASCs. Working guardians with offloading checked into svn version 25670.
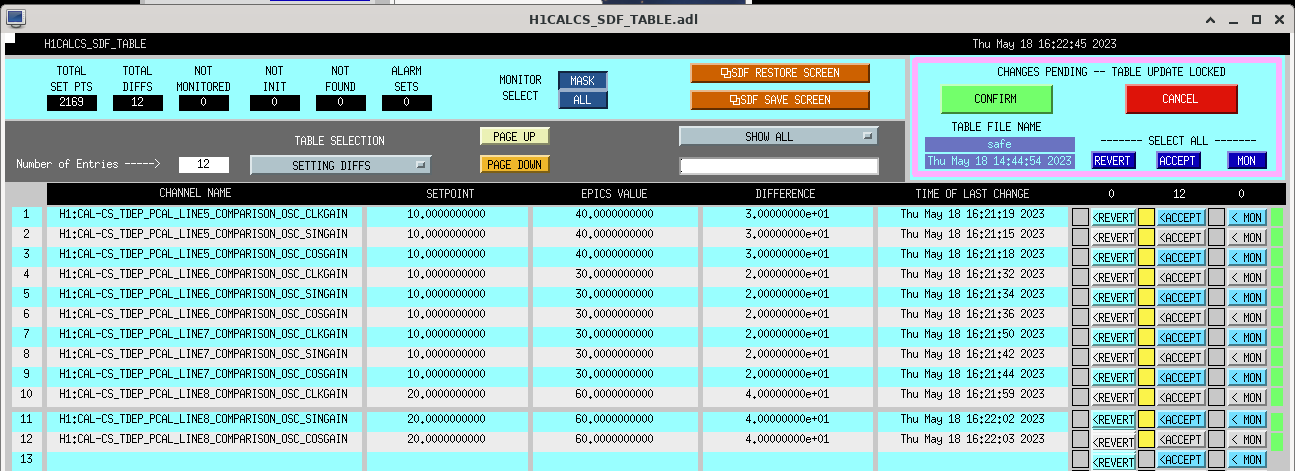
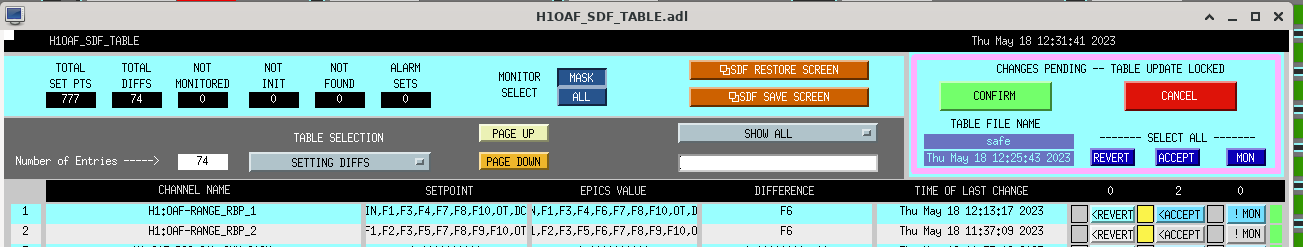
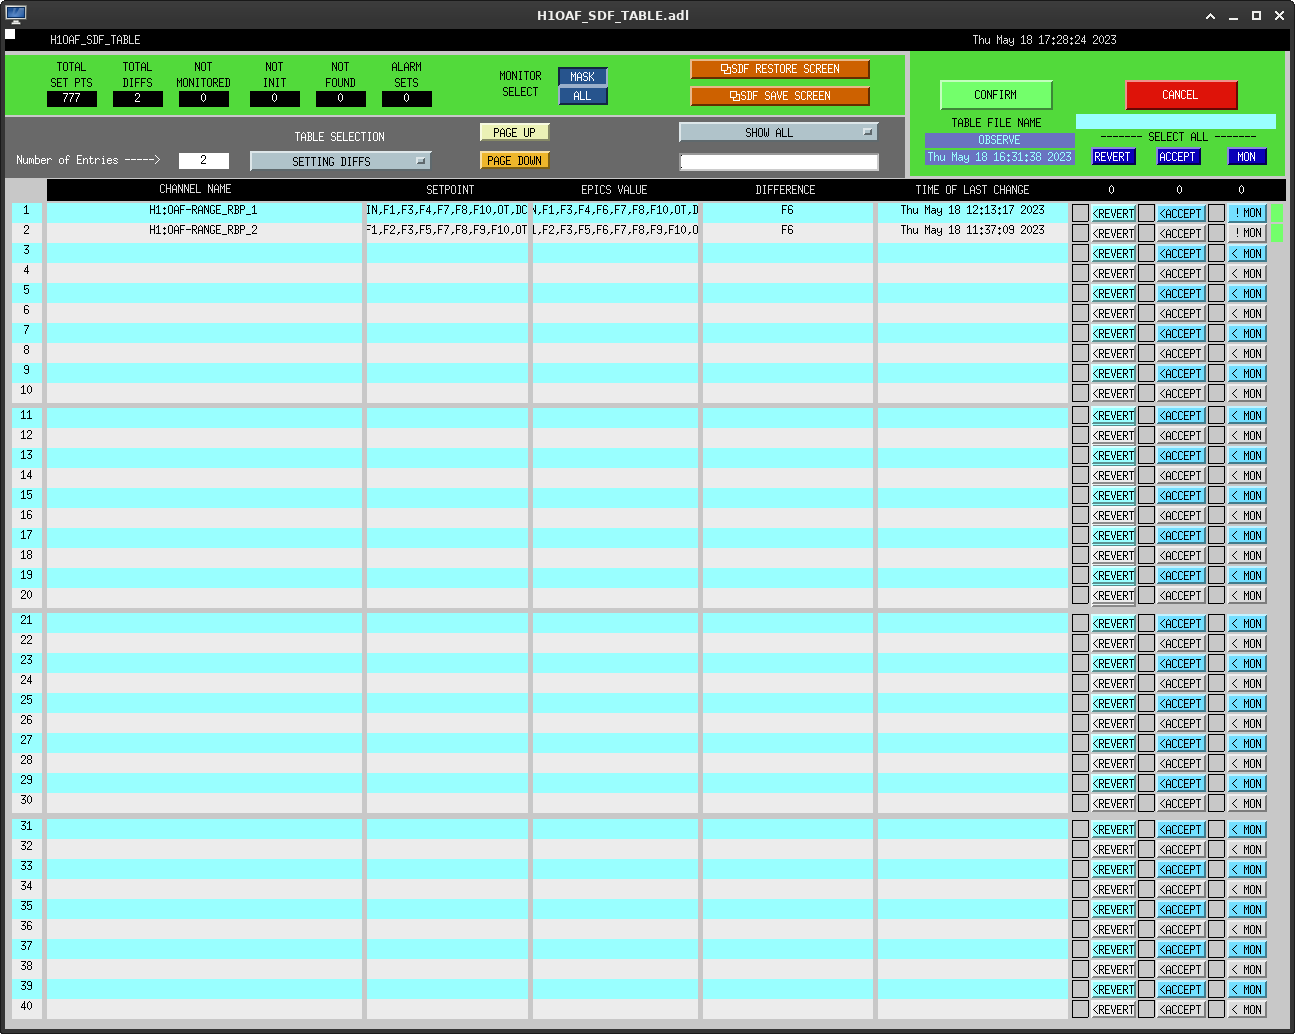
I also cleaned up SQZ_MANAGER a little; now only relevant states for observing are requestable in the drop-down menu. In addition, today Daniel has LHO:69732 which makes it so we only need to accept FC1/2 + ZM slider values in SDF models once after offloading, and it saves it to both observe and safe.snaps.
Ryan, Jane, Adrian, Anamaria, Robert
We have completed the main program of PEM injections. The more than 130 hand-tuned injections are detailed in the attached spreadsheet, which, along with the automated injections, will be analyzed in the comming days. We did not find troubling magnetic coupling, but we did find certain areas, particularly EX and the PSL, where ambinet vibration levels can produce noise in DARM. For some of the sensitive frequencies we found, e.g. 4Hz, and 10Hz, the ambient vibration level is dominated by the HVAC, particularly, turbulence in the turbine plenums and in the chilled water pipes. Tomorrow, I plan to experiment with the turbine flows and the pump VFDs to see if we can reduce vibration levels at the sensitive locations and frequencies with reasonable changes in the air and water flows.
IFO lost lock at 2:06 for unkown reasons. After doing an IA, I tried relocking only to be delayed by a 7.7 EQ in New Caledonia...holding in DOWN while we ride it out.
We had a GC outage around 6:15pm PDT (1:15 UTC). During this time we moved the network connection to a new router. The network is looking good. We will monitor for a day or two before we close the work permit.
DQ Shifter: Derek Davis
Summary:
J. Kissel We're finally to the point where we are able to review the results of the online measures of the systematic error (the new-to-O4 PCALX lines at the below listed frequencies), and we're finding that we need more SNR, (increased coherence, decreased uncertainty). Recall, we first set these heights blindly in July 2022 (LHO:64214), but live front-end processing of the data didn't appear until May 03 2023 (LHO:69285) -- from which the data is stored "in the frames" via EPICs channels, which means we can look at, and trend the results and compare against other IFO channels with all the usual tools. This week, we've begun reviewing those results as the *modeled* systematic error (ldas-jobs.ligo-wa.caltech.edu/~cal/) starts to become trust worthy (post yesterday's calibration pipeline update; LHO:69696), and we're trying to validate the "grafana" live processing of these lines (calibration-monitoring). I've increased three of the four the line height amplitudes by a factor of 3 and one by 4, as indicated below: PCAL CAL-CS DEMOD Frequency Amplitude Amplitude Ratio OSC Number Number (Hz) New (ct) Old (ct) (New/Old) PCALX_PCALOSC4 LINE5 33.34 40 10 4.0x PCALX_PCALOSC5 LINE6 53.67 30 10 3.0x PCALX_PCALOSC6 LINE7 77.73 30 10 3.0x PCALX_PCALOSC7 LINE8 102.13 60 20 3.0x These changes have been in place as of the NOMINAL_LOW_NOISE segment that started on 2023-05-18 22:30 UTC. Attachments: 2023-05-18_PCALX_LineHeight_Increase.png This shows the change in amplitude of these four lines. - RED -- the new H1 amplitudes - BLUE -- the corresponding L1 amplitudes (they have better noise at the lower frequency end, so they don't need to drive as hard to achieve the same SNR, or coherence, or uncertainty) - MAGENTA -- the old H1 amplitudes 2023-05-18_PCALX_LineHeight_Increase_12hourtrend.png This shows how the measurement of the systematic error, and its corresponding uncertainty has improved. The lowest panel shows that the uncertainty on the above mentioned DEMOD output has decreased from 4-5% to 1-1.5%. as expected. One can see by the magnitude (top) and phase (middle) plots that one can much more clearly read off the value of the trend of the systematic error. 2023-05-18_PCALX_LineHeight_Increase_SDFAccept.png This shows that not only have I SDF accepted the values of the new SINGAIN in the PCALX SDF system (not shown), I've also matched the amplitude increase DEMOD LO gains in the CALCS model (shown). Here's the latest list of calibration lines: Freq (Hz) Actuator Purpose Channel that defines Freq Changes Since Last Update (LHO:69555) 15.6 ETMX UIM (L1) SUS \kappa_UIM excitation H1:SUS-ETMY_L1_CAL_LINE_FREQ No change 16.4 ETMX PUM (L2) SUS \kappa_PUM excitation H1:SUS-ETMY_L2_CAL_LINE_FREQ No change 17.1 PCALY actuator kappa reference H1:CAL-PCALY_PCALOSC1_OSC_FREQ No change 17.6 ETMX TST (L3) SUS \kappa_TST excitation H1:SUS-ETMY_L3_CAL_LINE_FREQ No change 33.43 PCALX Systematic error lines H1:CAL-PCALX_PCALOSC4_OSC_FREQ Amplitude Change; THIS ALOG 53.67 | | H1:CAL-PCALX_PCALOSC5_OSC_FREQ Amplitude Change; THIS ALOG 77.73 | | H1:CAL-PCALX_PCALOSC6_OSC_FREQ Amplitude Change; THIS ALOG 102.13 | | H1:CAL-PCALX_PCALOSC7_OSC_FREQ Amplitude Change; THIS ALOG 283.91 V V H1:CAL-PCALX_PCALOSC8_OSC_FREQ No change 284.01 PCALY PCALXY comparison H1:CAL-PCALY_PCALOSC4_OSC_FREQ No Change 410.3 PCALY f_cc and kappa_C H1:CAL-PCALY_PCALOSC2_OSC_FREQ No Change 1083.7 PCALY f_cc and kappa_C monitor H1:CAL-PCALY_PCALOSC3_OSC_FREQ No Change n*500+1.3 PCALX Systematic error lines H1:CAL-PCALX_PCALOSC1_OSC_FREQ No Change (n=[2,3,4,5,6,7,8])
On Tuesday, there was a swap from Fan 1 to Fan 2 at End-X (alog 69635) in attempt to reduce the vibration levels at EX, and in turn prevent 4.1. Hz noise from appearing. Looking for periods of 4.1 Hz noise after this swap, there appears to be few, if any, cases of 4.1. Hz noise in the last 2 days. An example daily spectrogram is attached showing the 4.1 Hz noise before the swap. I've also included a daily spectrogram from today, which shows one time period that may have weak 4.1. Hz noise still present.
More data is still needed to understand the full effect of this swap, but preliminary checks suggest that even if the 4.1. Hz isn't gone completely, the rate is lower compared to previous days in ER15.
TITLE: 05/18 Day Shift: 15:00-23:00 UTC (08:00-16:00 PST), all times posted in UTC
STATE of H1: Observing at 133Mpc
SHIFT SUMMARY:
PEM Week Continues
GC Network outtage at 6pm PT tonight.
LOG:
TITLE: 05/18 Eve Shift: 23:00-07:00 UTC (16:00-00:00 PST), all times posted in UTC
STATE of H1: Commissioning
CURRENT ENVIRONMENT:
SEI_ENV state: CALM
Wind: 11mph Gusts, 9mph 5min avg
Primary useism: 0.02 μm/s
Secondary useism: 0.11 μm/s
QUICK SUMMARY:
- IFO is stuck at OMC_WHITENING while violins are damping
- CDS/SEI ok
- PEM injections are currently ongoing
Script saved as /ligo/home/camilla.compton/Documents/sqz/squeezing-measurements/ script_for_no_sqz_fis_fds.py Run using 'python script_for_no_sqz_fis_fds.py -s 1368477220' where 1368477220 is gpstime to start script. Starts in No_SQZ, then goes FIS for 0, +90 +180,-90, FDS for 0, +90 +180,-90, No_SQZ, back to nominal.
Things that should be updated: nominal_clf should be the H1:SQZ-CLF_REFL_RF6_PHASE_PHASEDEG we want to script to go back to at the end (current sqz angle). Now we have increased NLG, the sqz_angles should be re-found as in alog 69625.
We want 0deg (sqz) 180deg (anti-sqz) and +/-90deg (middle-sqz):
#sqz_angles = [0, +90 +180,-90] # change to SQZ-CLF_REFL_RF6_PHASE_PHASEDEG angles
sqz_angles = [[0, 161], [0, 225], [1, 97], [0, 60]] # [CLF_sign, CLF_angle]
Anamaria and I further improved the range BLRMs from alog 69619. They could be improved more but we lost lock.
When I walked up to the TCSX chiller the Ruler was on the ground. But judging by the remnants of the adheisive and the Max Level sticker I'd wager that the water level was greater than 30.
| TCS X | TCS Y | |
|---|---|---|
| Previous Level | >30 | 10 |
| New Level | >30.0 | 10 |
| Water added | 0mL | 0mL |
I also went back to clean up the old adhesives and apply some new double sided tape to the ruler. So it should stop falling now.
ENDY Station Measurement:
During the Tuesday maintenace, the PCAL team (Jennie W. and I) went to ENDY with WSH (PS4) and took an End station measurement.
The ENDY Station Measurement was Mostly carried out according to the procedure outlined in Document LIGO-T1500062-v15. Except for the very last measurment. Rick and I have spoken about trying to reduce the light entering the Rx Sphere during a background measurement similar to measurment #9 by placing the normal PCAL enclosure covers back on before the start of the background. I somehow misinterpreted his suggestions and put the covers on for measurement #9. This change was hand written in to the measurment document LIGO-T1500062-v15 and is attached. Once we started to do the analysis I realized that Putting the covers on for Measurement #9 was a blunder because; only the measurement #9 was covered with pannels. Which means we won't be subtracting enough light from the rest of the measurements #7 and #8. Effectively ruining this measurement. So this needs to be it's own measurement on future attempts to take backgrounds with the covers on.
Before I touched anything, I took a pictures of the beam spot.
Martel:
We started by setting up a Martel Voltage source to apply some voltage into the PCAL Chassis's Input 1 channel and we record the times that a -4.000V, -2.000V and a 0.000V signal was sent to the Chassis. The analysis code that we run after we return uses the GPS times, grabs the data and created the Martel_Voltage_Test.png graph. We also did a measurement of the Martel's voltages in the PCAL lab to calculate the ADC conversion factor, which is included on the document.
There was also another error in the data when we were at the end station taking the measurement. Which lead to the BadTimeEy.pdf which is attached. A number of the plots during the time marked on the Document either had no data or had some "disturbance" during the time indicated on the document for measurment #2. We able to "salvage" some of this data by reducing the duration of our measurements from 240 seconds to 78 seconds and change the gpstime on measurment #2 to get usable data for all plots.
New Measurement #2 GPSstart time is now: 1368291685.
After the Martel, measurement the procedure walks us through the steps required to make a series of plots while the Working Standard is in the Transmitter Module. These plots are shown in WS_at_TX.png.
Next steps include: WS in the Receiver Module, These plots are shown in WS_at_RX.png.
Followed by TX_RX.png which are plots of the Tranmitter module and the receiver module operation without the WS in the beam path at all.
The last picture is of the Beam spot after we had finished the measurement.
All of this data is then used to generate LHO_ENDY_PD_ReportV2.pdf which is attached.
All data and Analysis has been commited to the SVN.
https://svn.ligo.caltech.edu/svn/aligocalibration/trunk/Projects/PhotonCalibrator/measurements/LHO_ENDY/
This morning, H1 was not in Observing because the squeezer was not injecting squeezing. I requested the Sqz_manager to DOWN, then FREQ_DEP_SQZ. That worked, and the IFO automatically flipped to Observing.
Since we increased the SHG power on Tuesday (69671) the FC launch power almost doubled, 3mW to 6mW see attached. I have increased the sqzparams.fcgs_trans_lock_threshold from 50 to 110uW (was recently reduced from 80uW to allow FC to lock with low SHG) and reloaded SQZ_FC to stop this happening again.
We should think about if we want 6mW into FC launch and if we've always had this much power in higher order modes in the FC. There hasn't been any ZM2 PSAMS changes since the end of April.
TJ noted the SQZ_LO_LR guardian was unhappy at the time the FC unlocked, this is because the OPO unlocked and SQZ_MANAGER jumped to LOCK_OPO_AND_FC but didn't run though the DOWN state so BDiv stayed open and LO locking, I added a turn_off_sqz() line to LOCK_OPO_AND_FC. We should check there aren't more jump states that need this added.
Like Sheila and Camilla found, the first hours-long squeezer lockloss was due to FC locking on a LG01 donut mode. Their solution to increase the green lock threshold was great! Daniel and I have also updated the nominal FC GREEN TRANS value in slowcontrols, H1:SQZ-FC_TRANS_C_DC_NOMINAL.
Additionally though, FC guardian should have brought itself down b/c the beam clearly failed the TEM00 mode-checker decorator. This function looks at the FC TRANS GREEN camera's gaussian widths of the beam waist, H1:VID-FC_TRANS_C_{WX,WY} to check TEM00. Daniel and I also fixed this secondary bug, so now we should be doing check_TEM00() in the SQZ_FC guardian again. See the bottom trends: FC green trans was above its lock threshold (SQZ_FC_TRANS_C_LF_OUTPUT), but the beam's fitted waists were about 2x bigger than normal -- however, this didn't trigger FC to relock because of a stray "else" statement error in the guardian code logic. This should now be fixed, and we will monitor.
The second sqz lockloss could have happened because the OPO PZT voltage bottomed out, see the top trend here when SQZ_MANAGER went down. Not sure this is related to lab temp changes of even 0.5C. We've previously addressed this same issue for the SHG PZT in 69366. What I've done to address this: to deal with OPO PZT bottoming out in the future, I've edited SQZ_MANAGER to relock the OPO if its voltage is too low, and we're not squeezing. Specifically, I've upgraded "@SHG_PZT_checker" to a general "@PZT_checker" which now checks both SHG + OPO PZTs in the SQZ_READY_IFO state. And, in the "LOCK_OPO_AND_CLF" state, if not OPO_PZT_OK() (b/c its too low), the opo will re-lock.
From TJ and Camilla's investigations above, I checked and I don't think there are more jump states that need to "turn_off_sqz()"; in fact only DOWN and LOCK_TTFSS are goto=True states, and not LOCK_OPO_AND_FC. In turn_off_sqz(), I added a 1 second sleep timer to let the beam diverter close before moving on to relock the squeezer.
After the calibration update this morning, I need to retrain the NonSENS noise cleaning. However, the NDS team is still in progress on understanding why we can't get past GDS-CALIB_STRAIN channels right now. Once we can get that past data, I should be able to retrain. Until then, the NOISE_EST is zeros, so GDS-CALIB_STRAIN_CLEAN will be the same as GDS-CALIB_STRAIN_NOLINES.
This doesn't look like it'll get fixed tonight, as it may require a restart of the gstlal-calibration pipeline. I've set the NOISE_CLEANING guardian to have a gain of 0 in the WHITENING_NOISE_EST channel, and accepted it as zero in both safe and observe.
This means that while this is true, GDS-CALIB_STRAIN_CLEAN will be the same as GDS-CALIB_STRAIN_NOLINES.
After the newest calib fix and restart that fixed the nonsens subtraction channel (but didn't affect any other parts of the calib), I retrained the jitter subtraction (but not yet retrained the LSC subtraction). The jitter subtraction should be running, and I've accepted the SDFs in both safe and observe.
See attached for the effect, including I've got a bit of noise re-injection that I didn't expect.
Jennie, Sheila
Sheila and I looked at the steps Elenna changed the DARM offset through, the last time the contrast defect measurement was taken (see LHO #69361). To get an idea of how much light seen at the anti-symmetric port (calibrated in terms of power into HAM6) is insensitive to DARM motion I plotted the scaling of the light at ASC-AS_C_NSUM_OUTPUT with DARM offset changing (OMC-DCPD_SUM_OUTPUT).
| DARM offset (mA) (OMC-DCPD_SUM_OUTPUT) |
Power out of SRC (ASC-AS_C_NSUM_OUTPUT) (+/- 0.00945792) |
Time offset changed |
| 19.91 | 0.8655 | - |
| 6.760 | 0.8467 | 1367176162 |
| 10.62 | 0.8519 | 1367176288 |
| 15.15 | 0.8589 | 1367176413 |
| 20.82 | 0.8666 | 1367176538 |
| 27.17 | 0.8755 | 1367176663 |
| 34.15 | 0.8857 | 1367176788 |
Attached is the plot (pdf) of total power into HAM 6 versus the power that gets through the OMC.
The uncertainty in the AS measurement is was estimated using the y cursors on ndscope (shown in png).
0.837W of power is predicted for no DARM offset, and 82% of the light coming into HAM 6 is sensed by the OMC DCPDs.
We also tried to use the total power on OMC REFL to do a similar calculation of the light rejected from the OMC that is insensitive to DARM motion but due the noise on this signal we made need bigger DARM offset steps to see a clear trend.
Since this measurement, whitening has been implemented on the OMC REFL PD by Daniel.
Code is Plot_OMC_REFL_2023-05-12.ipynb in /ligo/home/jennifer.wright/git/OMC_mode_matching/
Figure is in /ligo/home/jennifer.wright/git/OMC_mode_matching/figures
In the SQZ loss budget, HAM6 losses are OM1 (99.3%) OM3 (98.5%), OMC transmission (95/7% measured before installation), and DCPD QE (98% in budget, should be 99%). This gives an expected HAM6 throughput of 92%, which means we are missing 11% loss, including OMC mode mismatch and any degredation of the OMC transmission or PD QE.
See 60885 and the comment above it for a similar measurement from LLO.
Just to clarify, that's 82% of carrier light that gets through the OMC from the input of HAM 6.
Jennie W, Sheila D
We reviewed some alogs and dcc documents about OMC losses, OMC cavity scans suggest that our OMC transmission has degraded from 96% to 92%.
Testing before installation results start on page 140: T1500060 The input output coupler transmission (T) is 7690ppm, 50ppm loss per mirror.
Finesse = pi/(1-r1*r2*rloss) (approximation) with r1=r2 = sqrt(1-T) and rloss is an amplitude reflectivity that represents all the cavity losses.
round trip loss = 1-[(1-pi/F)/(1-T)]^2
cavity transmission = T^2 * (Finesse/pi)^2
I've updated the SQZ Loss wiki, if we assume the OMC transmission is 92%, our known IFO output losses become 13%, and our known squeezing losses become 19%.
Redoing the comparison above of Jennie's HAM6 throughput estimate (82%) to the 12% known HAM6 losses:
Implies that we have 7% unknown HAM6 losses, which could be OMC mode matching.
Testing documents page 143: reports 4690ppm transmission of the input and output couplers, and summing the losses 284ppm, implies finesse of 401 and cavity transmission of 96.4%
Minor comment: This line should be identical to P.140. The transmission of the input/output couplers should be 7690ppm. Did I give you a link to an old document...?
Ryan S, TJ S
Ryan and I looked into all of the symlinks for the safe and observe files as read from the target area for all of the models that are in our SDF Revert scheme. Column 4, and a bit of 5, of this table shows the awkward web that we've created over the years with some safes linked to observes and some to downs, and one the other way around. These are only a small fraction of all of the models, while we haven't gone into all of the others, I imagine the web is equally as tangled. Since we've been locking decently well and seem to have a working system, I don't think it's worth the effort and potential fallout to clean this all up, but I worry that we could definitely confused ourselves further with this inconsistent linking.
All of this stemmed from some diffs in the ISC_EX and ISC_EY (h1syseyiscsdf) that had their observes linked to their safes. I've now unlinked the safe and observe for the for these and made a new link to an observe.snap that was a copy of the safe. I then accepted the differences when we got to low noise.
| MODEL | DCUID | userapps_area | safe linked to | observe linked to |
| alsex | 85 | als | down | observe |
| alsey | 95 | als | down | observe |
| asc | 19 | asc | down | observe |
| ascimc | 20 | asc | down | observe |
| iscex | 86 | isc | down | observe |
| iscey | 96 | isc | down | observe |
| lsc | 10 | lsc | down | observe |
| omc | 8 | omc | down | observe |
| susbs | 31 | sus | down | observe |
| susetmx | 88 | sus | down | observe |
| susetmy | 98 | sus | down | observe |
| sushtts | 21 | sus | safe | safe |
| susifoout | 46 | sus | observe | observe |
| sussqzout | 22 | sus | observe | observe |
| sussqzin | 162 | sus | safe | observe |
| susfc1 | 161 | sus | safe | observe |
| susfc2 | 168 | sus | safe | observe |
| susitmx | 29 | sus | down | observe |
| susitmy | 30 | sus | down | observe |
| susim | 104 | sus | observe | observe |
| susmc1 | 34 | sus | observe | observe |
| susmc2 | 39 | sus | down | observe |
| susmc3 | 35 | sus | observe | observe |
| susprm | 36 | sus | down | observe |
| suspr2 | 40 | sus | down | observe |
| suspr3 | 37 | sus | down | observe |
| sussrm | 45 | sus | down | observe |
| sussr2 | 41 | sus | observe | observe |
| sussr3 | 44 | sus | observe | observe |
| sustmsx | 89 | sus | observe | observe |
| sustmsy | 99 | sus | observe | observe |
| sysexisc | 1028 | sys | safe | observe |
| syseyisc | 1031 | sys | safe | observe |
h1susfc1, h1susfc2 and h1sussqzin are now using identical SDF files with safe pointing to OBSERVE.
Adrian, Camilla, Gabriele, Fil, Richard
While trying to track down the source of the 4 Hz bumps in DARM, Richard noticed the cosmic ray photomultiplier tube (PMT) power supply voltage display numbers were jumping around. When he reset the dial, we noticed the 4 Hz oscillations in H1:PEM-ADC_5_29_2K_OUT_DQ disappeared for a few minutes. We unplugged the power supply to the PMTs at 19:05:00 UTC and have not seen 4 Hz features in the ADC channel or DARM since. Plots of the change in ADC channel timeseries behavior when Richard first touched the power supply knobs as well as the ADC channel behavior after the power supply was unplugged are attached. A spectrum comparing the ADC power supply plugged in (blue) and unplugged (red) is attached. We had about 40 minutes to watch DARM before some commissioning tasks started and we didn't see any more bumps. Another plot is forthcoming for this...
(edit for spelling...)
We need to collect more data to be sure, but for now it looks like the 4.05 Hz bumps in DARM are gone
This is awesome and fingers crossed that it fixes things.
Just a quick note that as we try to figure out how this coupled, it seems that H1:PEM-CS_ADC_5_29_2K_OUT_DQ might not be our best witness channel because while today it saw the 1.35Hz and 4.05Hz before the CR PS unplug, it did not see those peaks during some past times when n*4.05Hz bumps were seen in h(t) such as 4/12, 4/14, and 4/16.
Some of the other PEM channels such as H1:PEM-CS_ACC_LVEAFLOOR_HAM6_Z_DQ do seem to be reliable witnesses, having seen the 1.35Hz and 4.05Hz during h(t) bump times on those previous days as well as today before CR PS unplug, but not after unplug.
There was another instance of the 4 Hz bumps at 20:50 UTC. The attached plot shows OMC-DCPD_SUM, with blue as a reference, green dotted an example of the glitch a few days ago, and orange the one now. It's complicated a little by the PCal line at 24 Hz; it could be notched if we wanted a better plot. The bump at 20 Hz does look weaker but the rest are similar to before.
Most likely one of the photomultiplier tubes has developed a minor short and is going through a charge/discharge cycle. Not surprising after ~20 years! It is probably worth testing if the discharge is in the PMTs or the HV power supply by disconnecting the HV cables from the power supply and powering it back up. Either the fluctuations in the display will stay or not.
It looks like there are fewer of those 4.05Hz bump / glitches, but the problem is still with us, some of them quite loud.
Power was restored to the PMTs around 11:00:00 local on May 16, 2023, as we believe the 4 Hz glitching is coming from the the cryyobaffle. All four displays worked when I turned the power supply back on again.
Yesterday and today I made measurements of our soft yaw loops to determine why they are causing us such trouble at high power. I think our overall goal is to get to a point where we can turn them off, but in the meantime we need to stabilize them.
Both soft yaw loops are engaged at Power 25W. Yesterday we used a CSOFT Y gain of 5, but today our lock stability at 60W is thanks to a CSOFT Y gain of 20. All of these measurements were made with the new CHARD Y loop.
I have attached plots of the open loop gain of CSOFT Y and DSOFT Y at 25W, 50W and 60W. The gain for DSOFT was 100 for every measurement. These plots show that with increasing power, the peak of the loop shifts to lower frequency, and the phase slowly degrades. This is similar to the effect of high power in the soft pitch loops.
Also, the 25W and 50W measurements were made at the high bandwidth ASC state, while the 60W measurement was made at low bandwidth. It would probably have very little effect on these loops, but the amount of gain in the CHARD Y loop at 0.45 Hz changes.
Stefan and I looked at the current control filter, and have considered changing the zero at 0.3 Hz to 0.1 Hz. The resulting change to the filter can be shown here (we scaled the gain of the new filter to match at 10Hz): comparison plot. This would give us ~20 deg more phase and only 2 dB of gain difference at 0.45 Hz.
It might be worth making this change in all soft loop control filters. We will test this change after the next lockloss.
I have also copied my measurement templates over to userapps, into asc/H1/templates/ into the respective ASC dof folder. These were broadband excitation olg measurements.
The control filter change for soft yaw caused a lockloss with an oscillation at 0.56 Hz while we were in move spots.
The first two plots I am attaching here reiterate information already in this alog, but I have also included the close loop suppression of the soft loops. I also rescaled the gain of the 60W measurement of CSOFT Y by 0.25 so the open loop gain has the same loop gain as the 25W and 50W measurements (CSOFT Y and DSOFT Y).
I have tried modeling the soft yaw loops. I am really curious about what is happening to the phase around 0.4 Hz where at 25W is appears stable, but then as we move to higher power it degrades and moves through zero. However, this feature is not evident in the models I have created. I overlayed my open loop gain measurement with the model, for CSOFT Y and DSOFT Y. In this model, I include the M0 suspension stage as well as L2 and L3. For the CSOFT model I used 100 kW of power for the 25W model, 270kW for 50W and 330 kW for 60W. For the DSOFT model I used 120 kW, 290 kW, and 350 kW respectively. I think these two measurements were far enough apart in time that perhaps there was some thermalization that increased the circulating power.
My guess for the phase discrepancy is that there is some sort of cross coupling in the loops that contributes to the loss of phase. I had a similar problem modeling the soft pitch loops.
I often cite these measurements as some evidence that the right half plane poles in the soft loops are spot position related. I looked back at the DTT used for the CSOFT Y measurements I plot in this alog and trended the guardian state for the time when the 25W measurement was taken (GPS time 1354494219). Indeed, the measurement was taken while we were at "Power 25W", which is the state before Move Spots. For further confirmation, I also trended the A2L gains (which we use for spot position). When the beam is centered the P2L gains should be 0.85, and Y2L gains should be zero. That is indeed the case here for the 25W measurements. I don't understand the physical mechanism here, but this is an interesting data point for us while we try to understand what is going on with the ASC loops and suspension plants.