During the transition to my Day shift, I followed our usual check list for Maintenance days, which included taking SEI_CONF to SC_OFF_NOBRSXY. When Hugh and I went to recenter the STSs and T240, the SEI_ENV node was still looking for earthquakes and saw large ground motion, caused by Hugh and I. The node proceeded to switch to earthquake mode in the middle of our recentering. Many chambers tripped as a result.
The failure here was that I was following a checklist that I had not updated to reflect this new SEI_ENV node. This node should be taken to the MAINTENANCE state every Tuesday morning to avoid this in the future. I will update the checklist now, and double check others to make sure it doesn't need to be somewhere else that I can't think of.
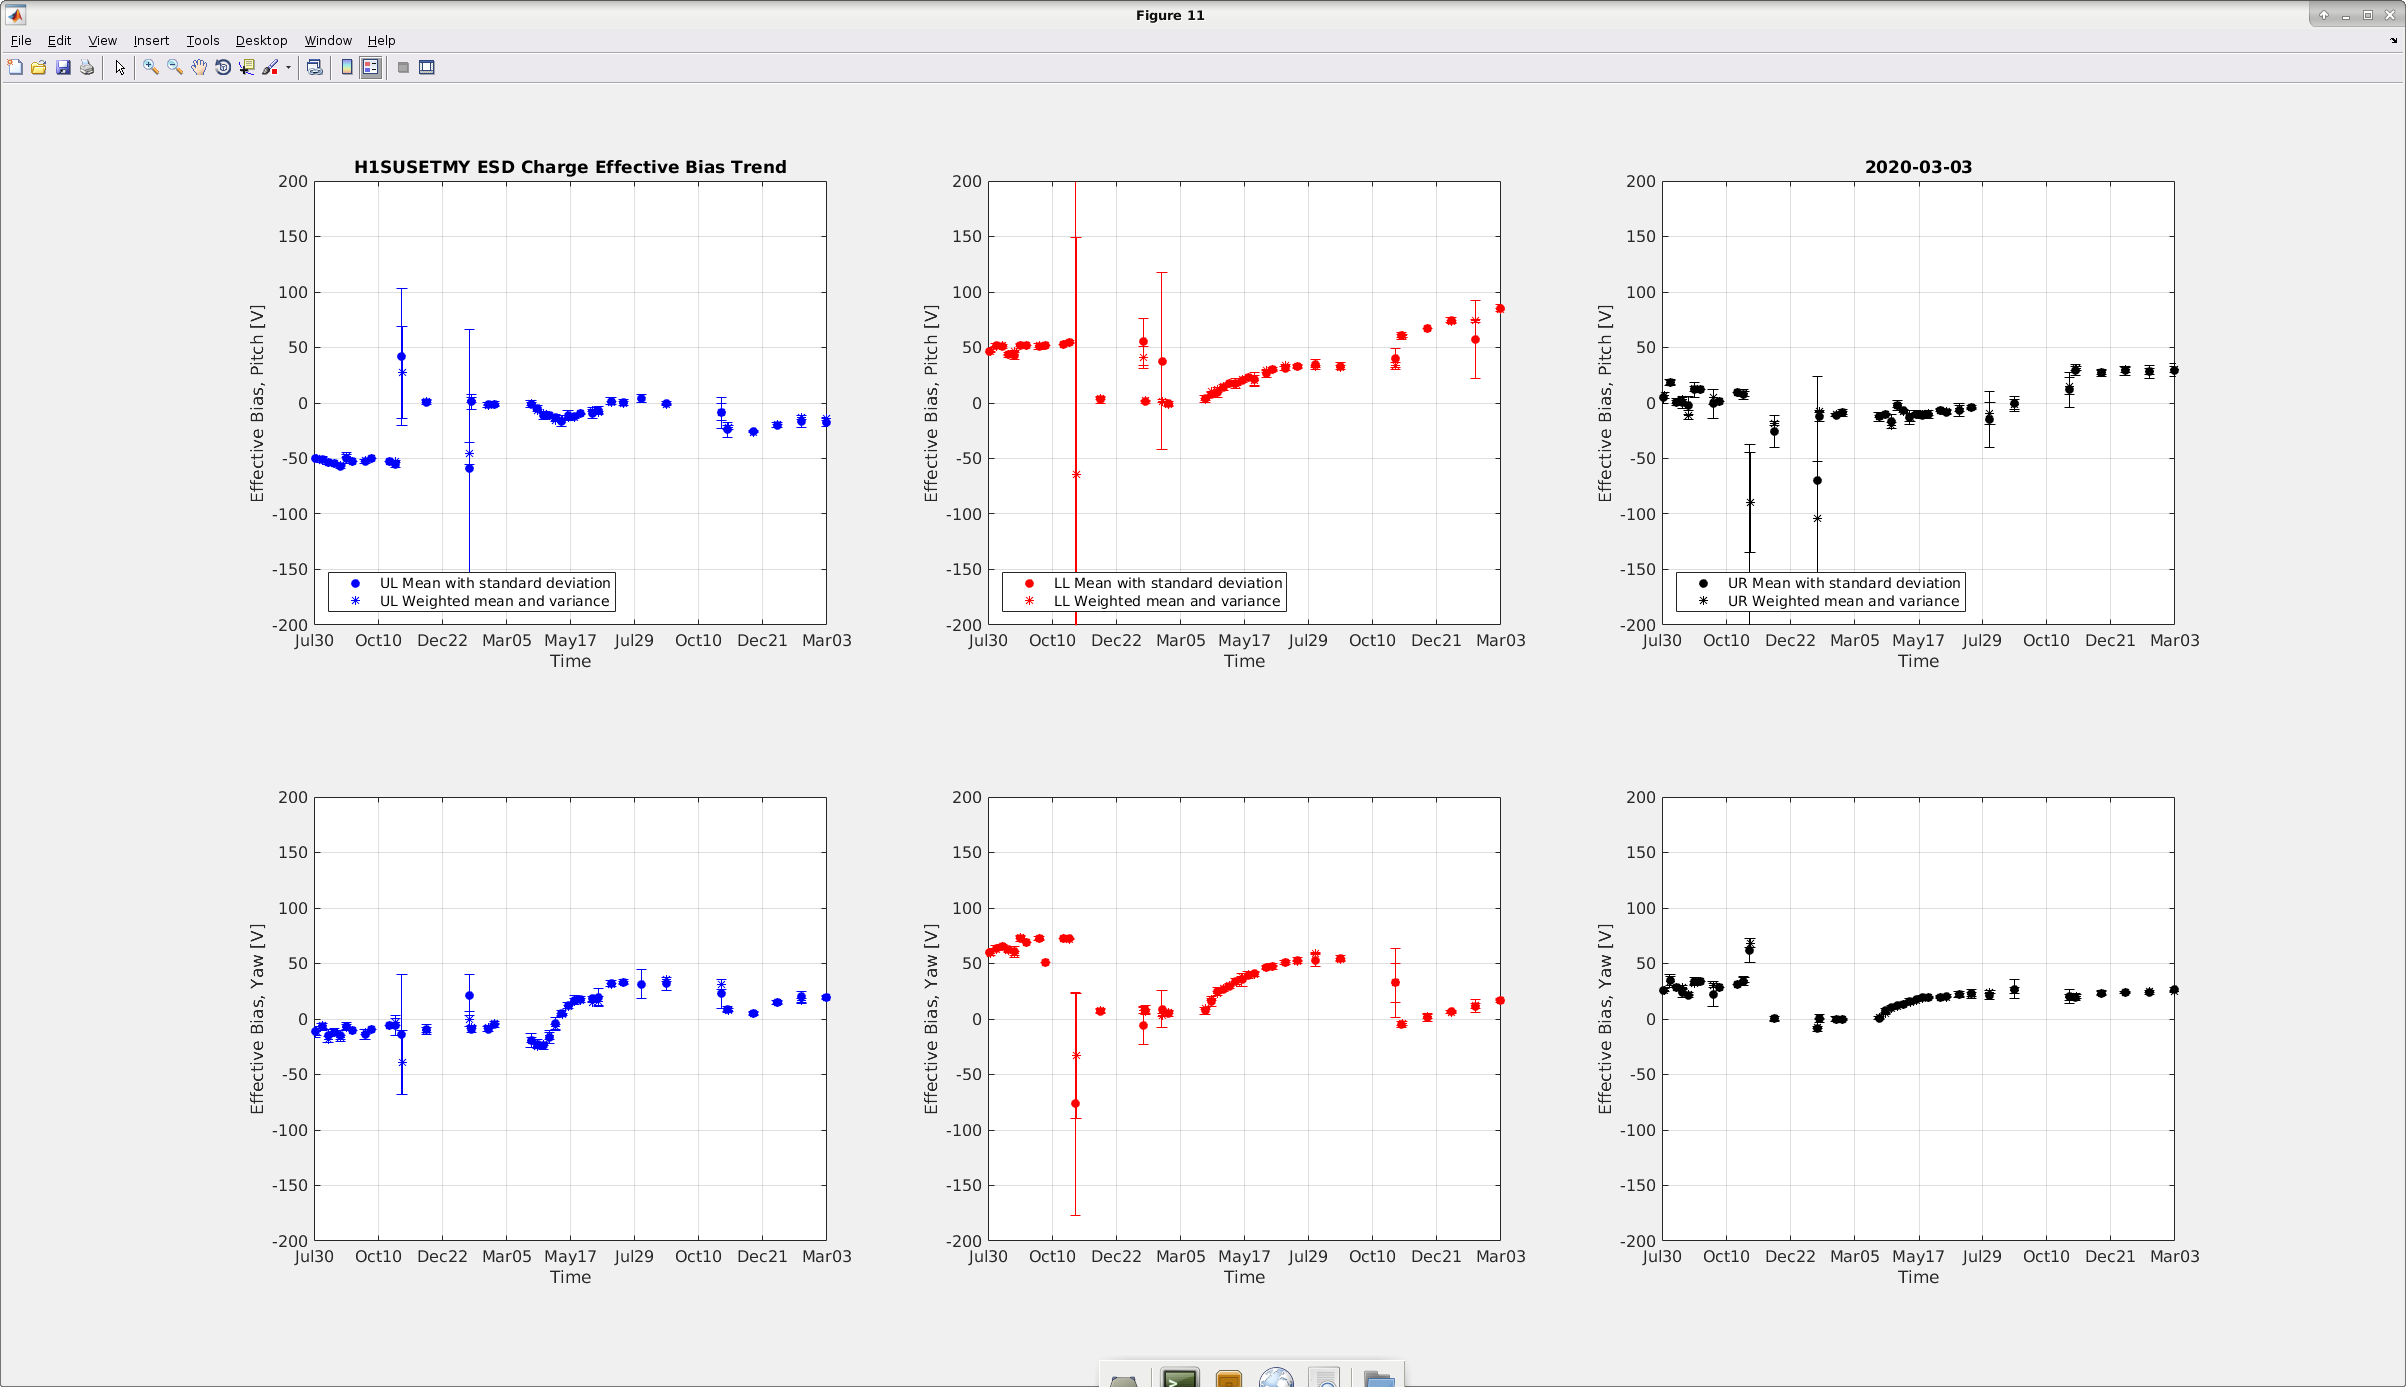
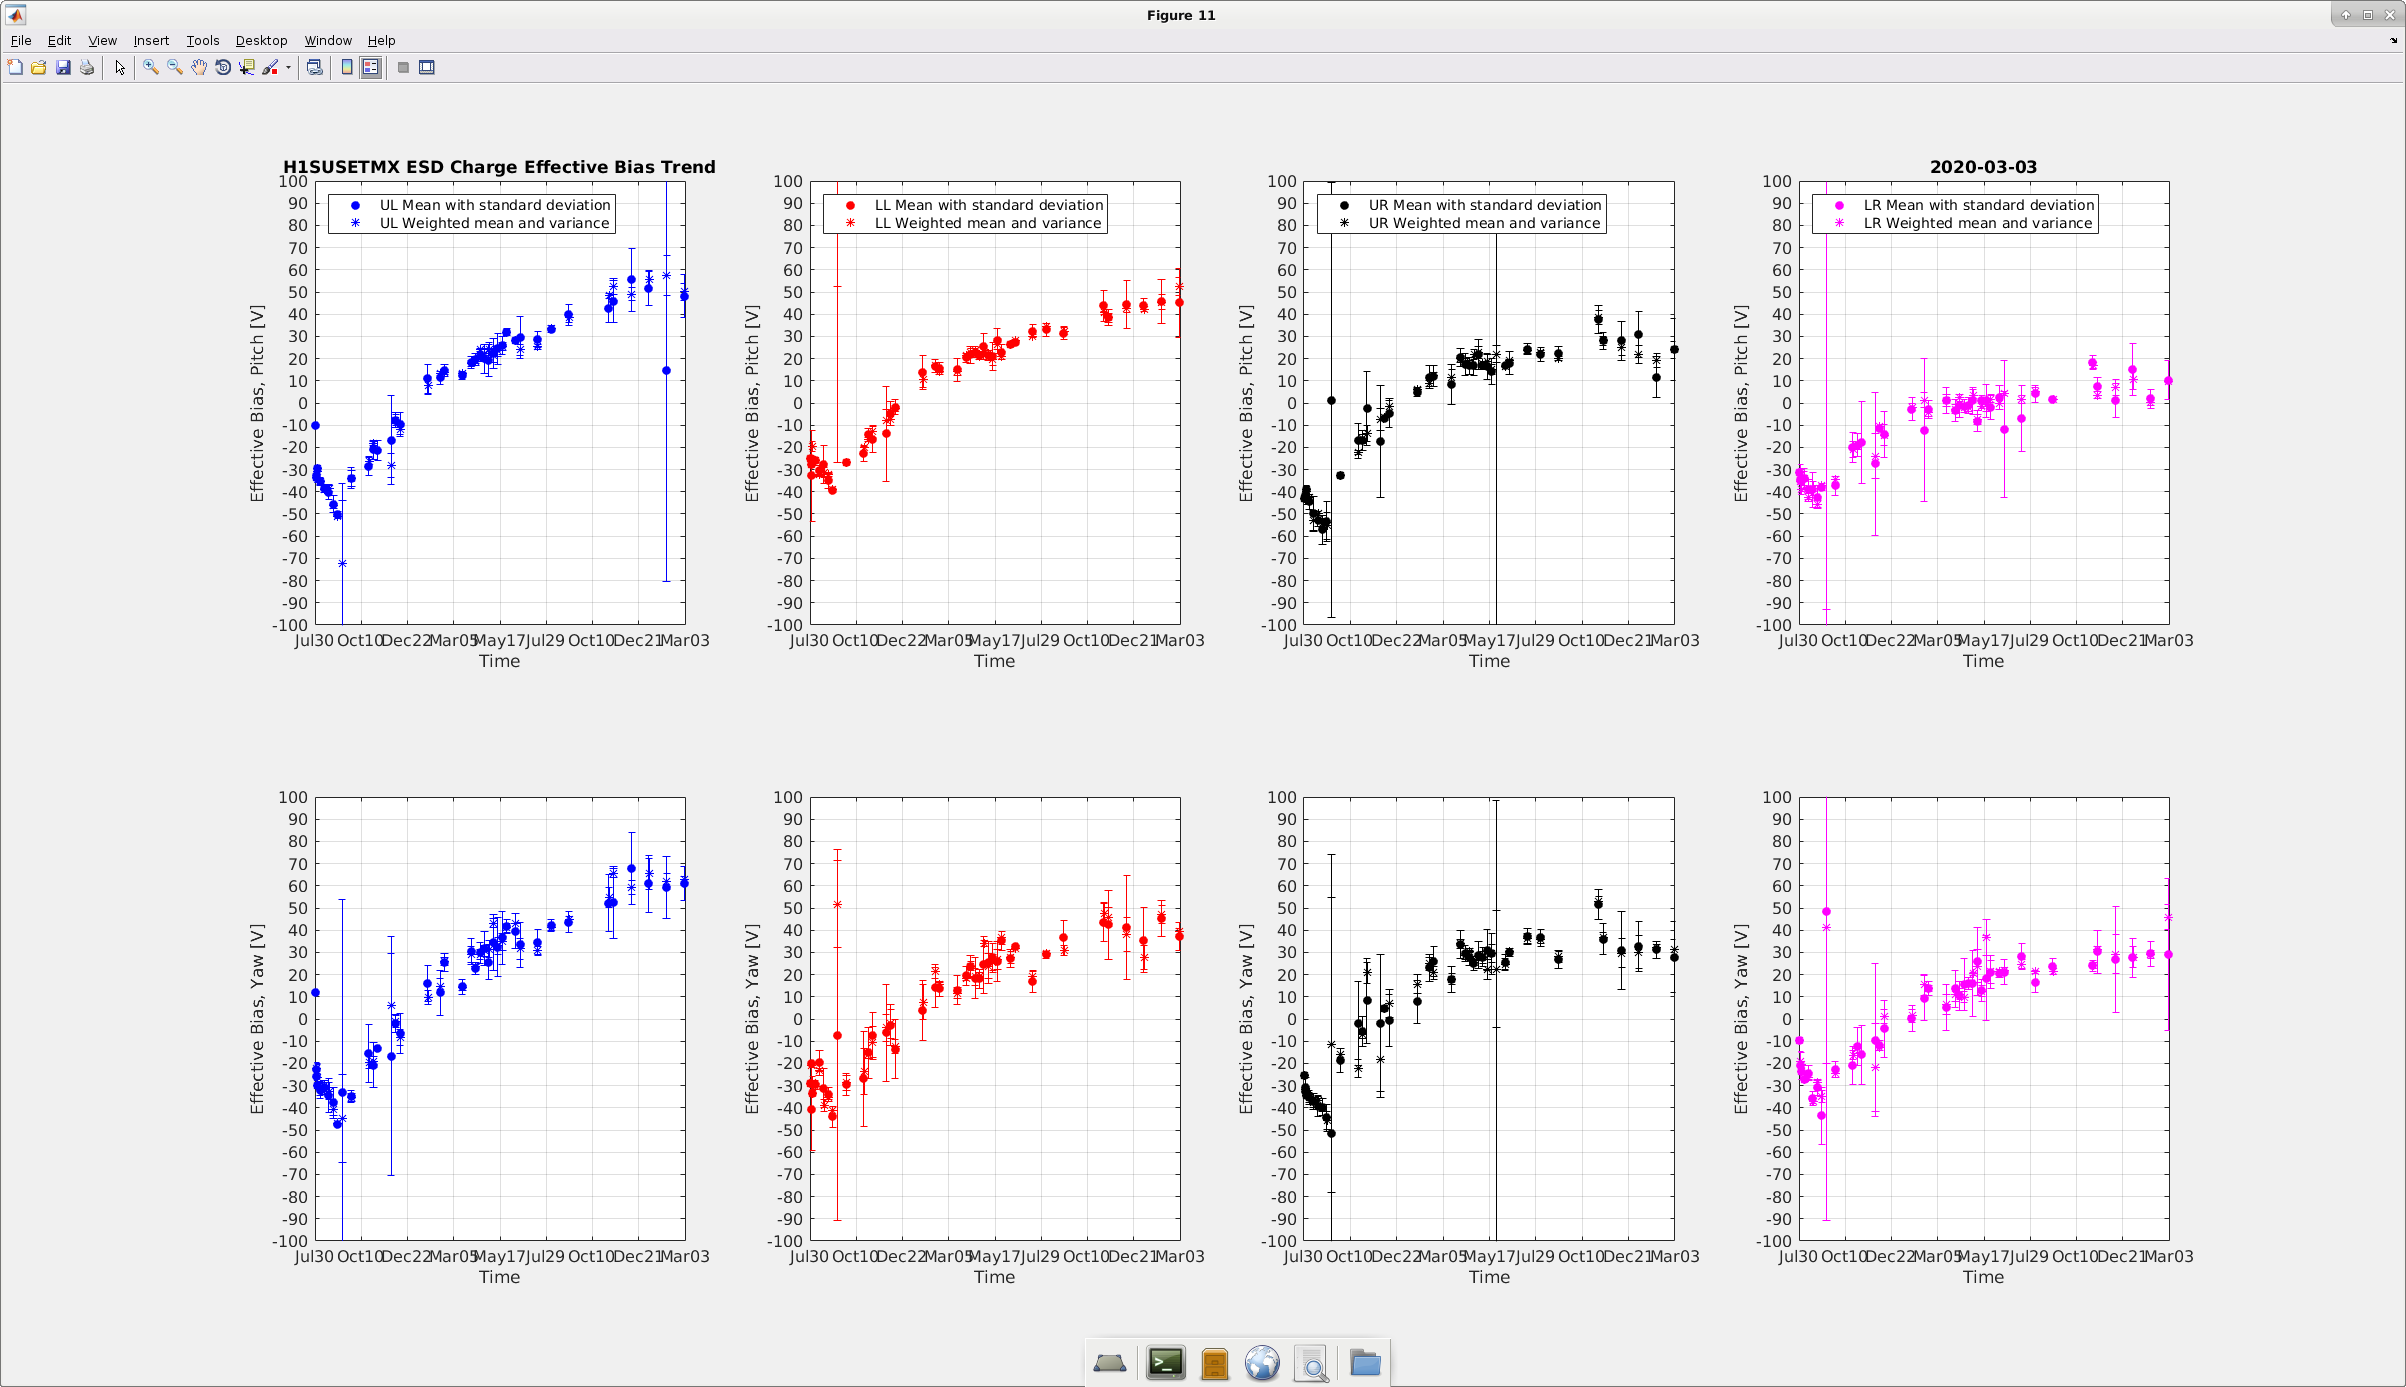
Attached below are the results for the monthly charge measurements.
ETMX: No significant change observed, the effective bias voltage for the pitch is varying from 10-50V. Last month's measurement for the first quadrant had a huge error bar, which was not observed this time. For the Yaw, the first quadrant is sitting at 60V and the rest are between 30-40V.
ETMY: Increase in the bias voltage for the 2nd quadrant for the Pitch, which is at 85V, which is big jump from last month (57V, with a big error bar). There was a rising trend over here past few months. The other two quadrants are looking stable at 20-40V. For the Yaw, the bias voltage is stable at around 25-30V.
All the slider values were restored after the measurement was complete and SDF differences were looked into.
[Sheila, Jenne]
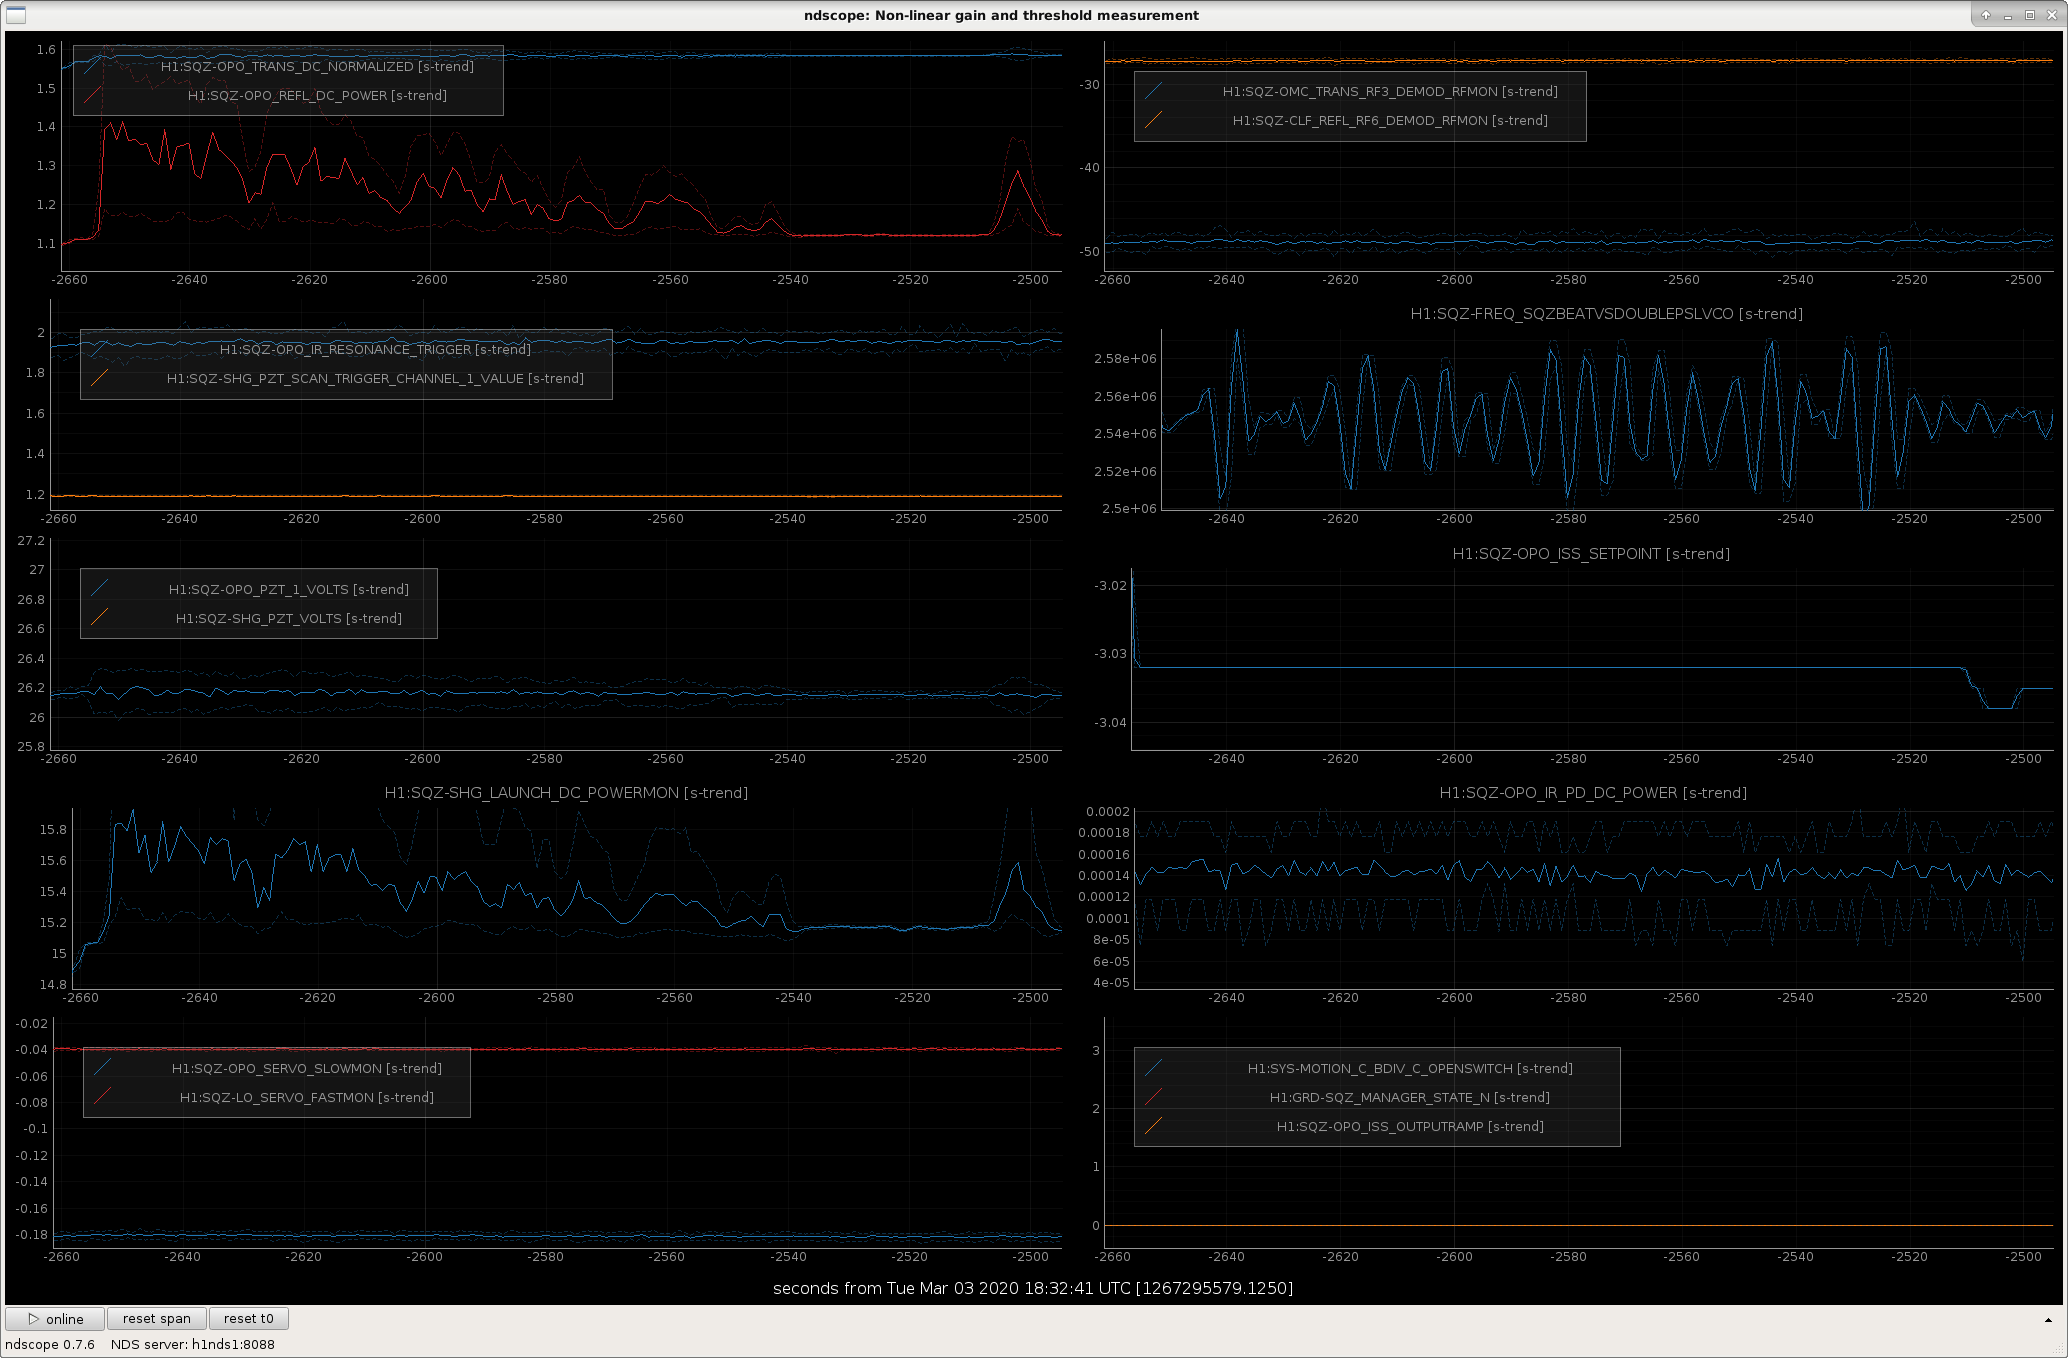
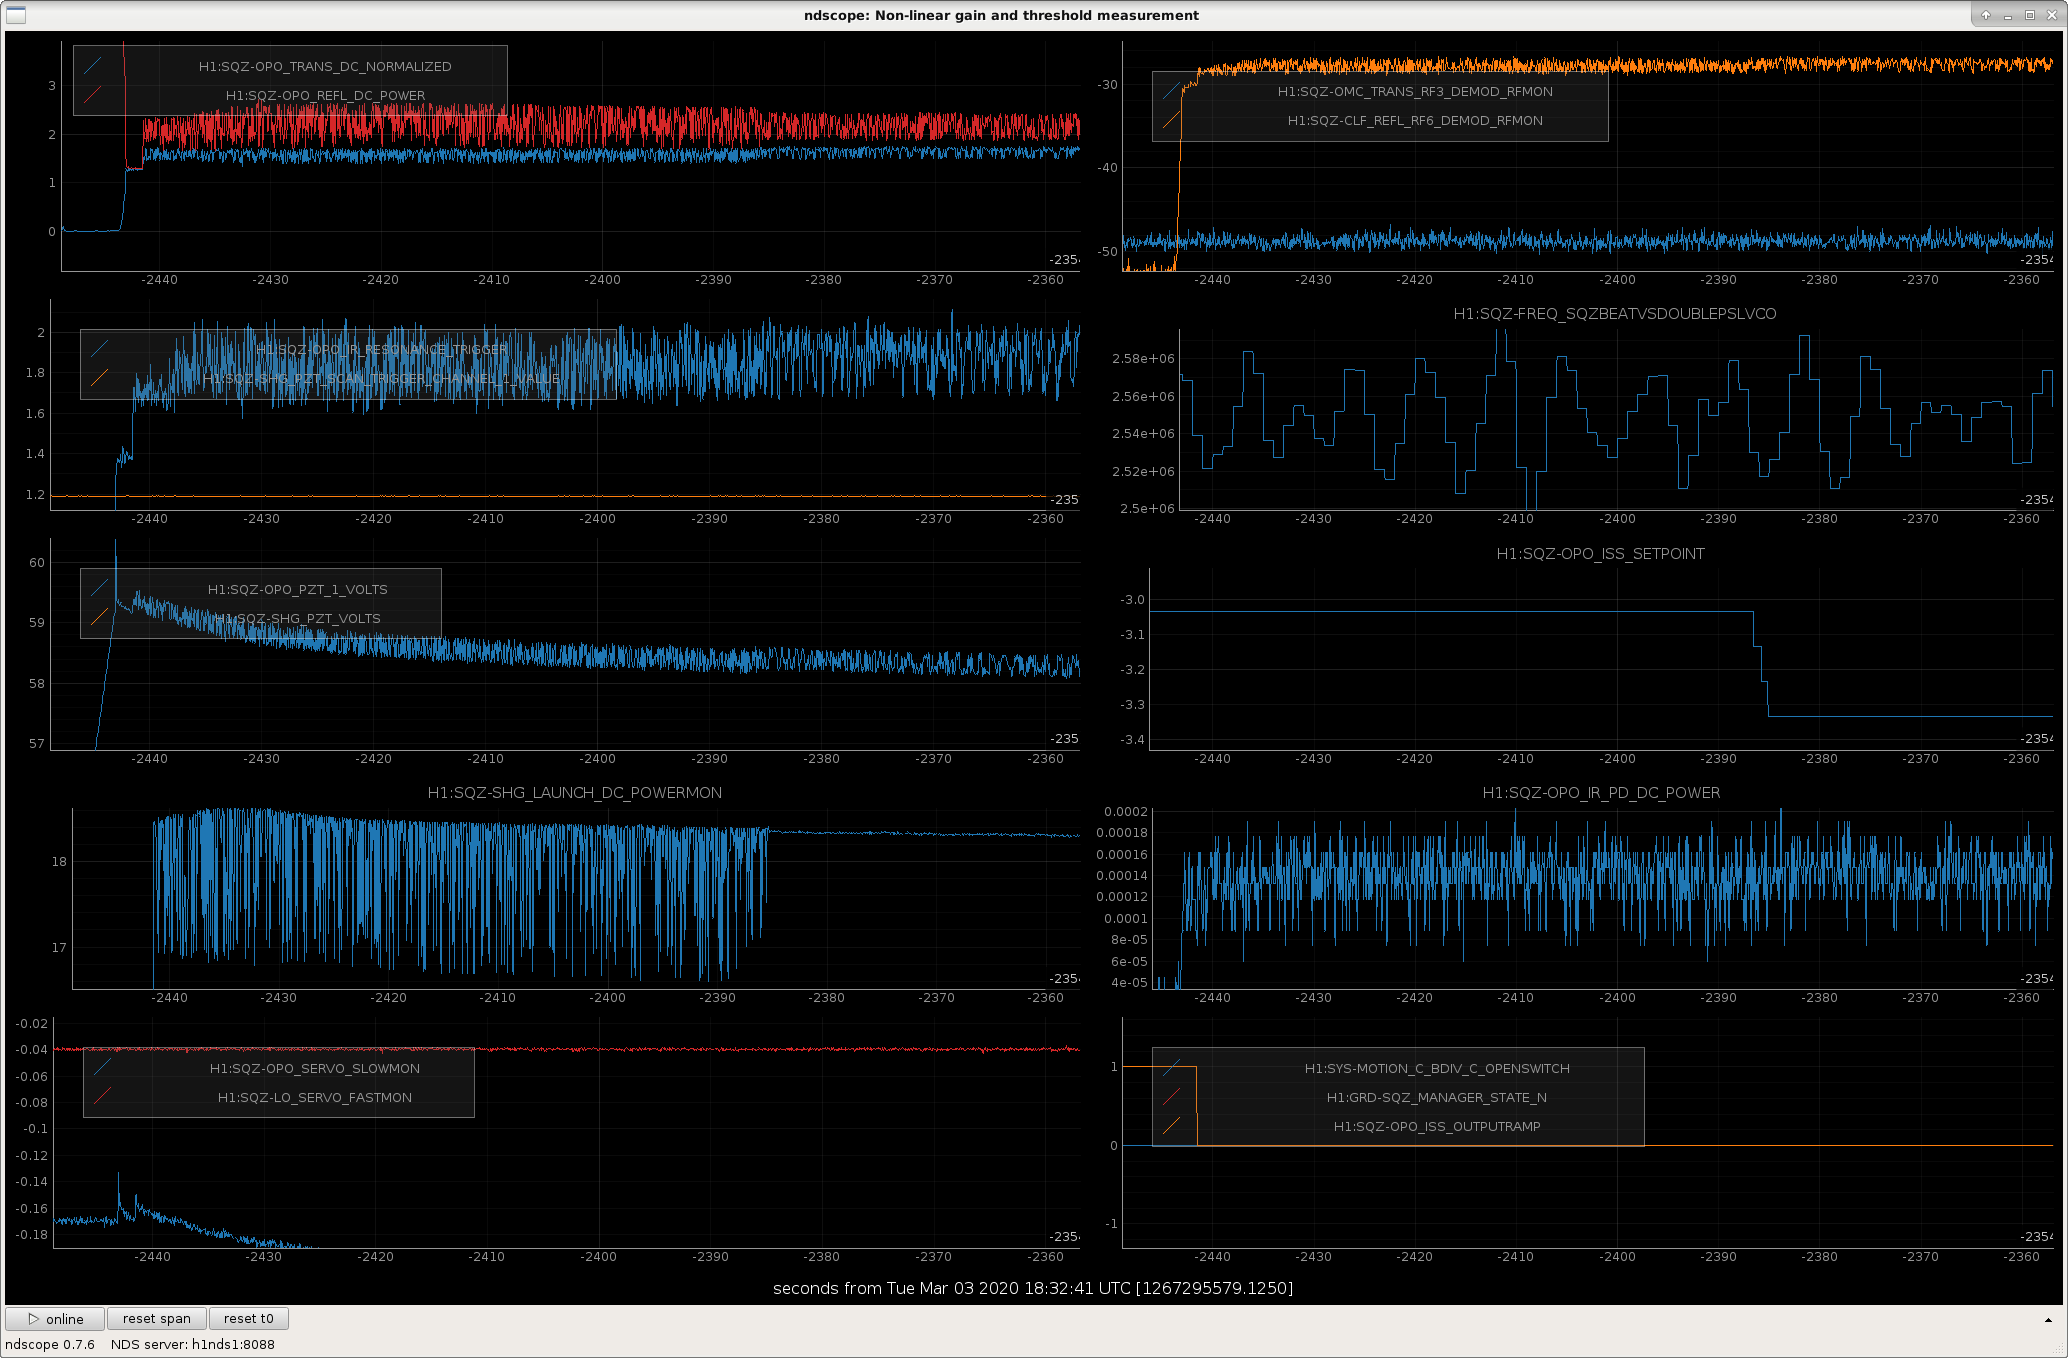
Although the squeezer seems to not have gone into oscillation since last Thursday when we lowered the green power (alog 55339), we are looking to see if we can better understand the cause and ameliorate it (spoiler alert: so far we don't know, although we have further tests to try today).
Here's what we've done so far:
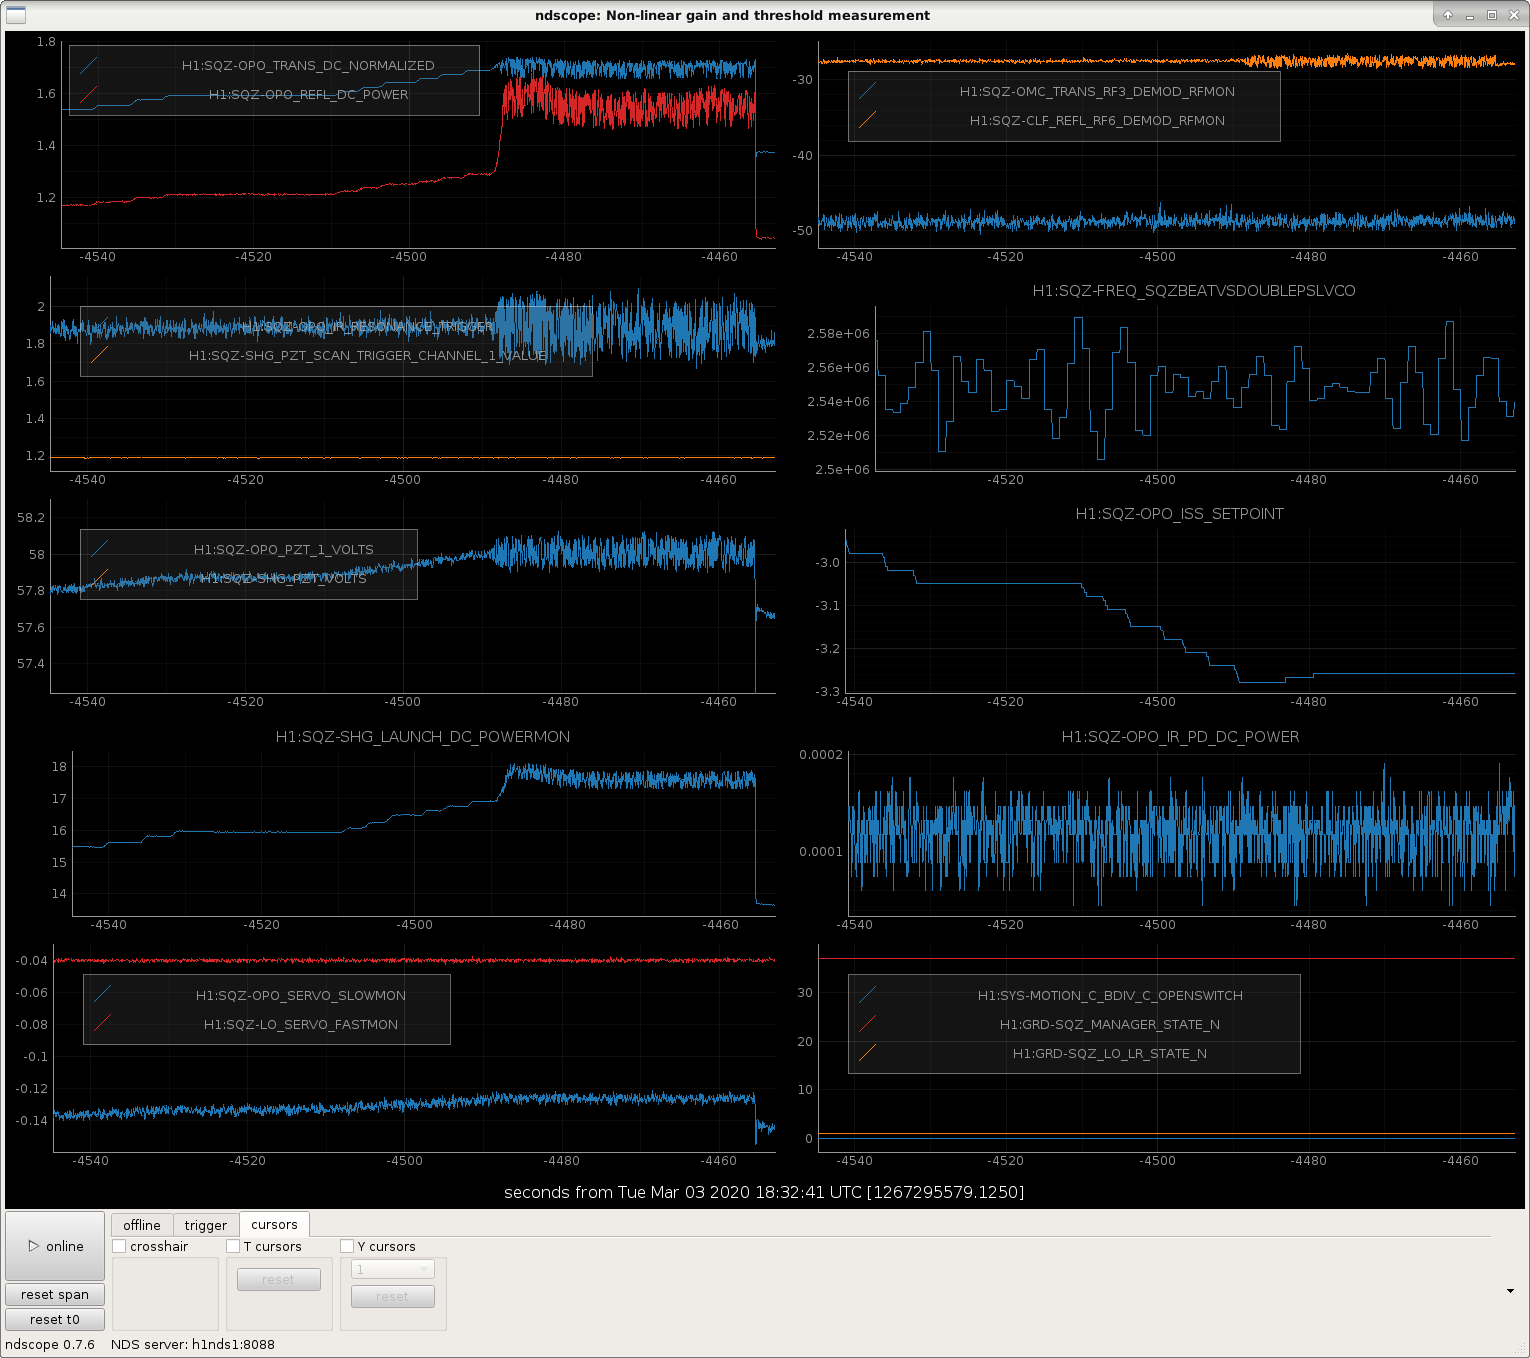
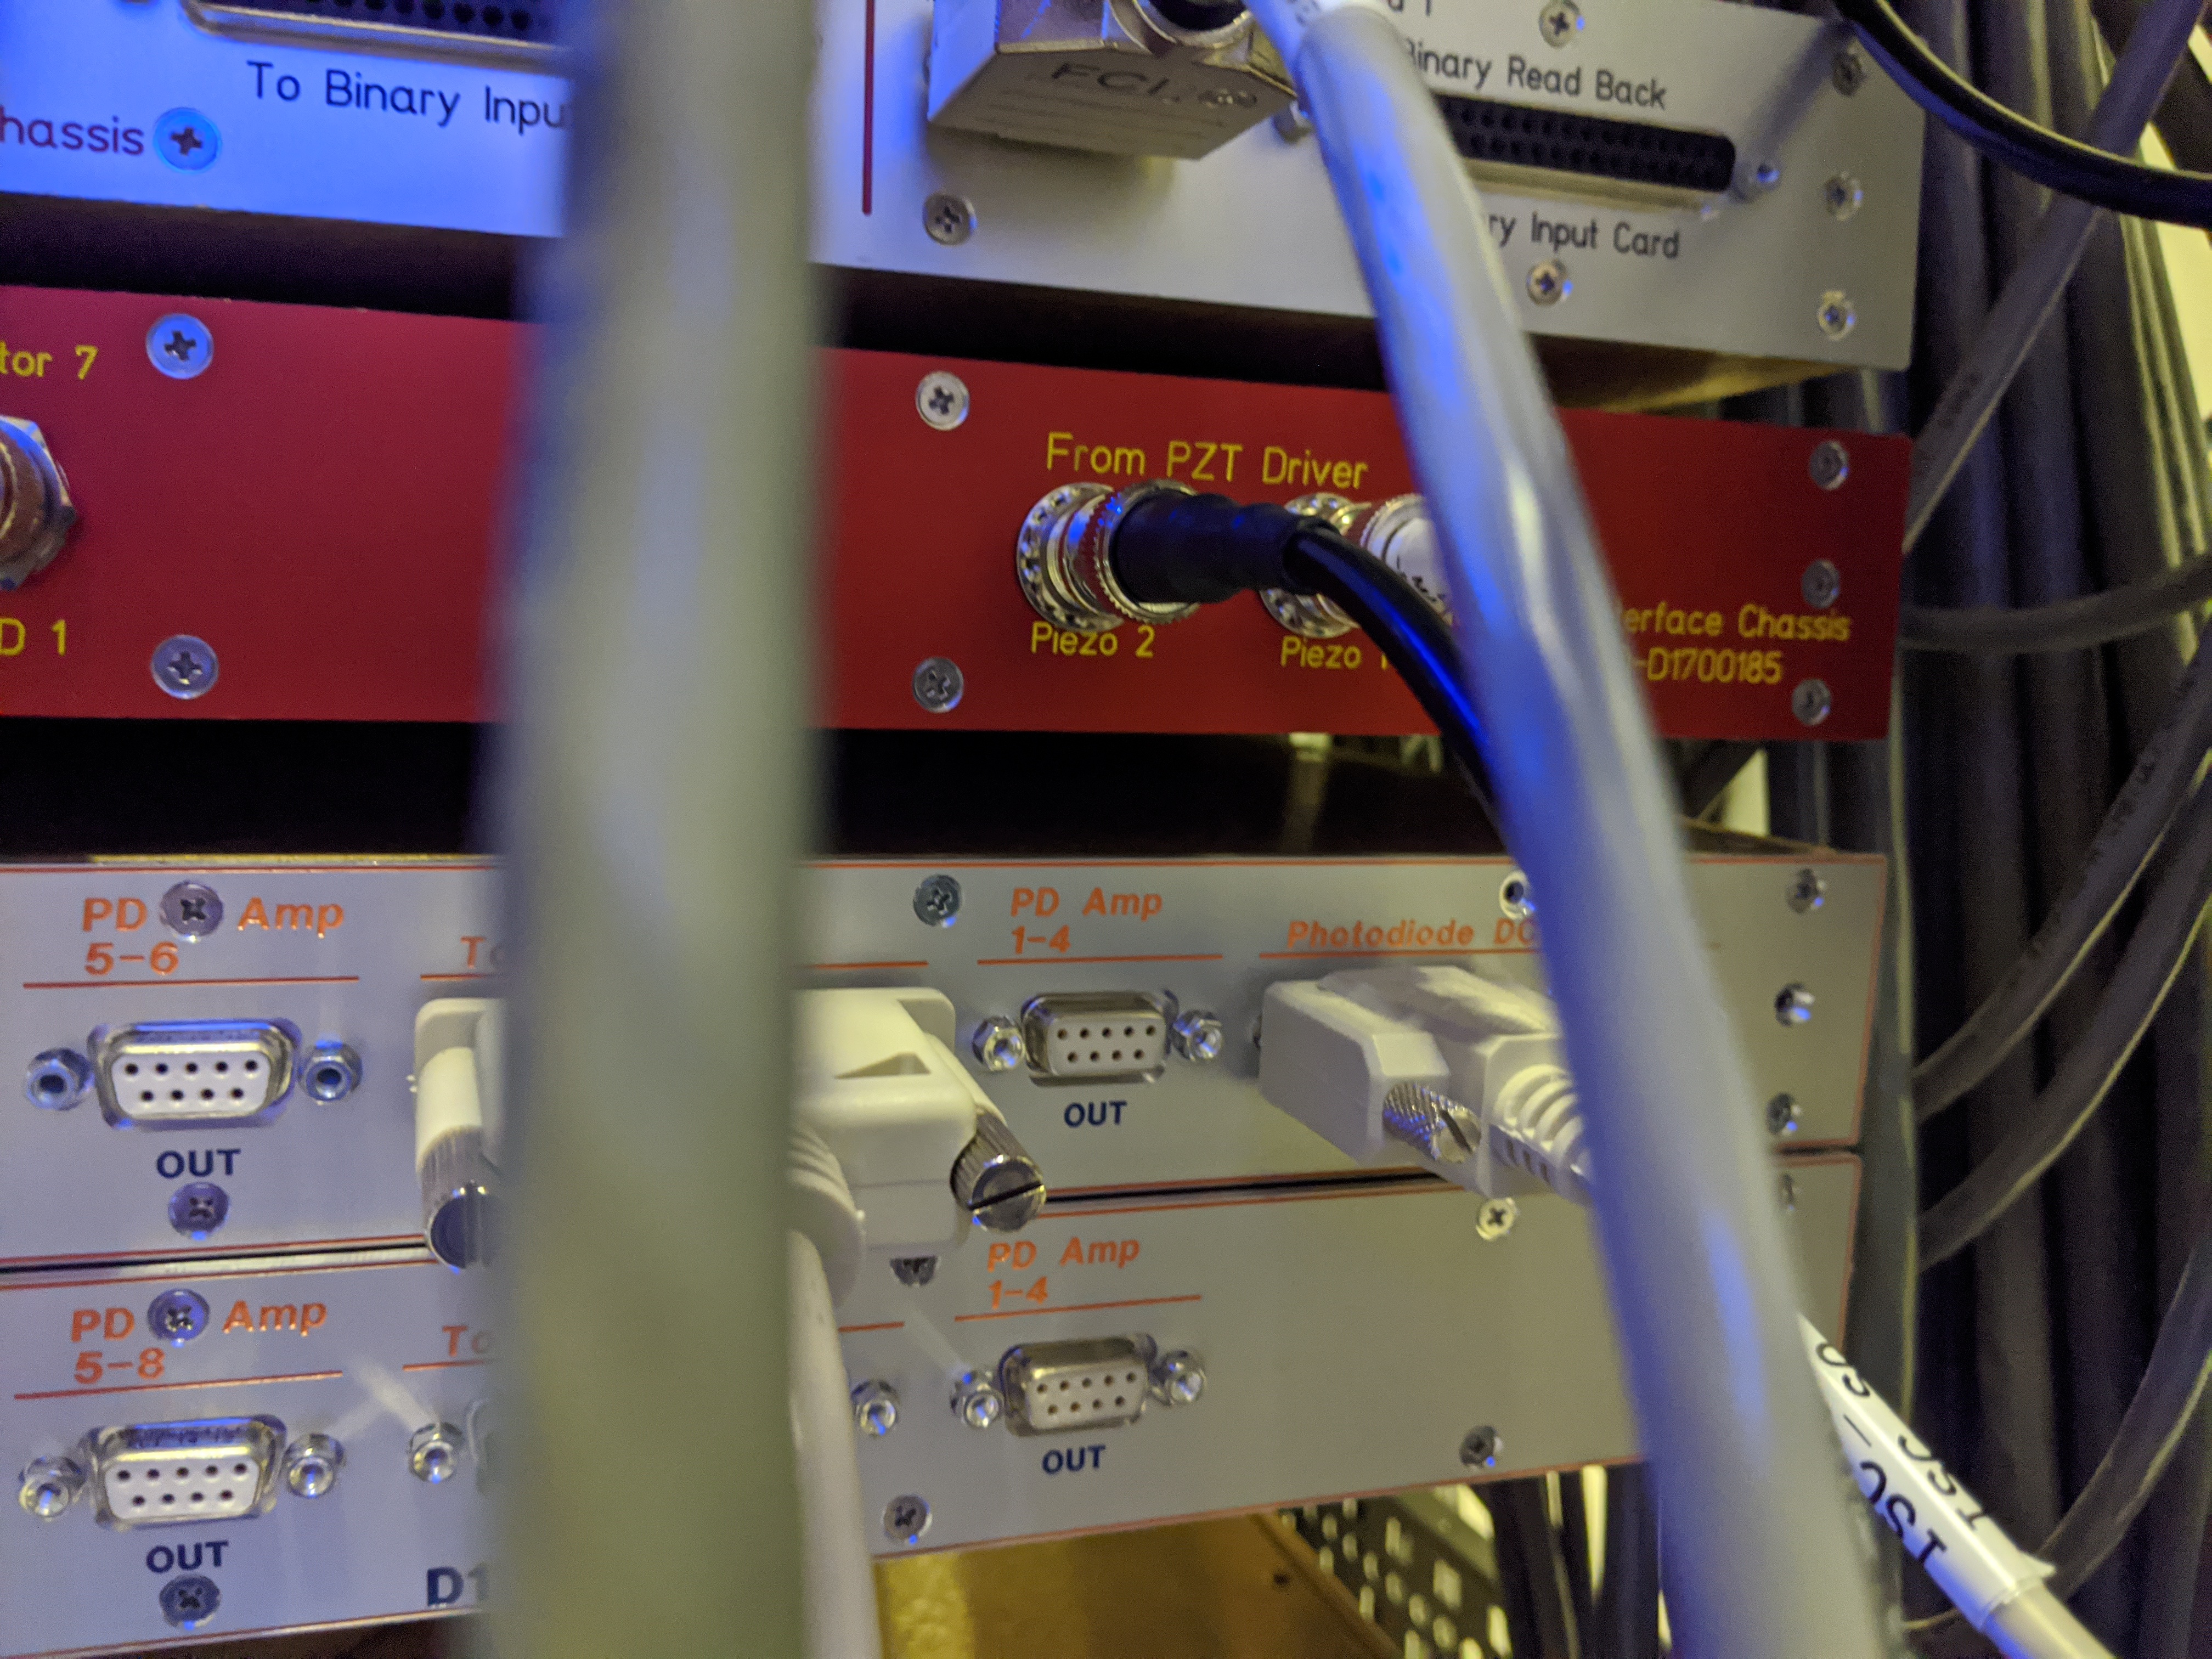
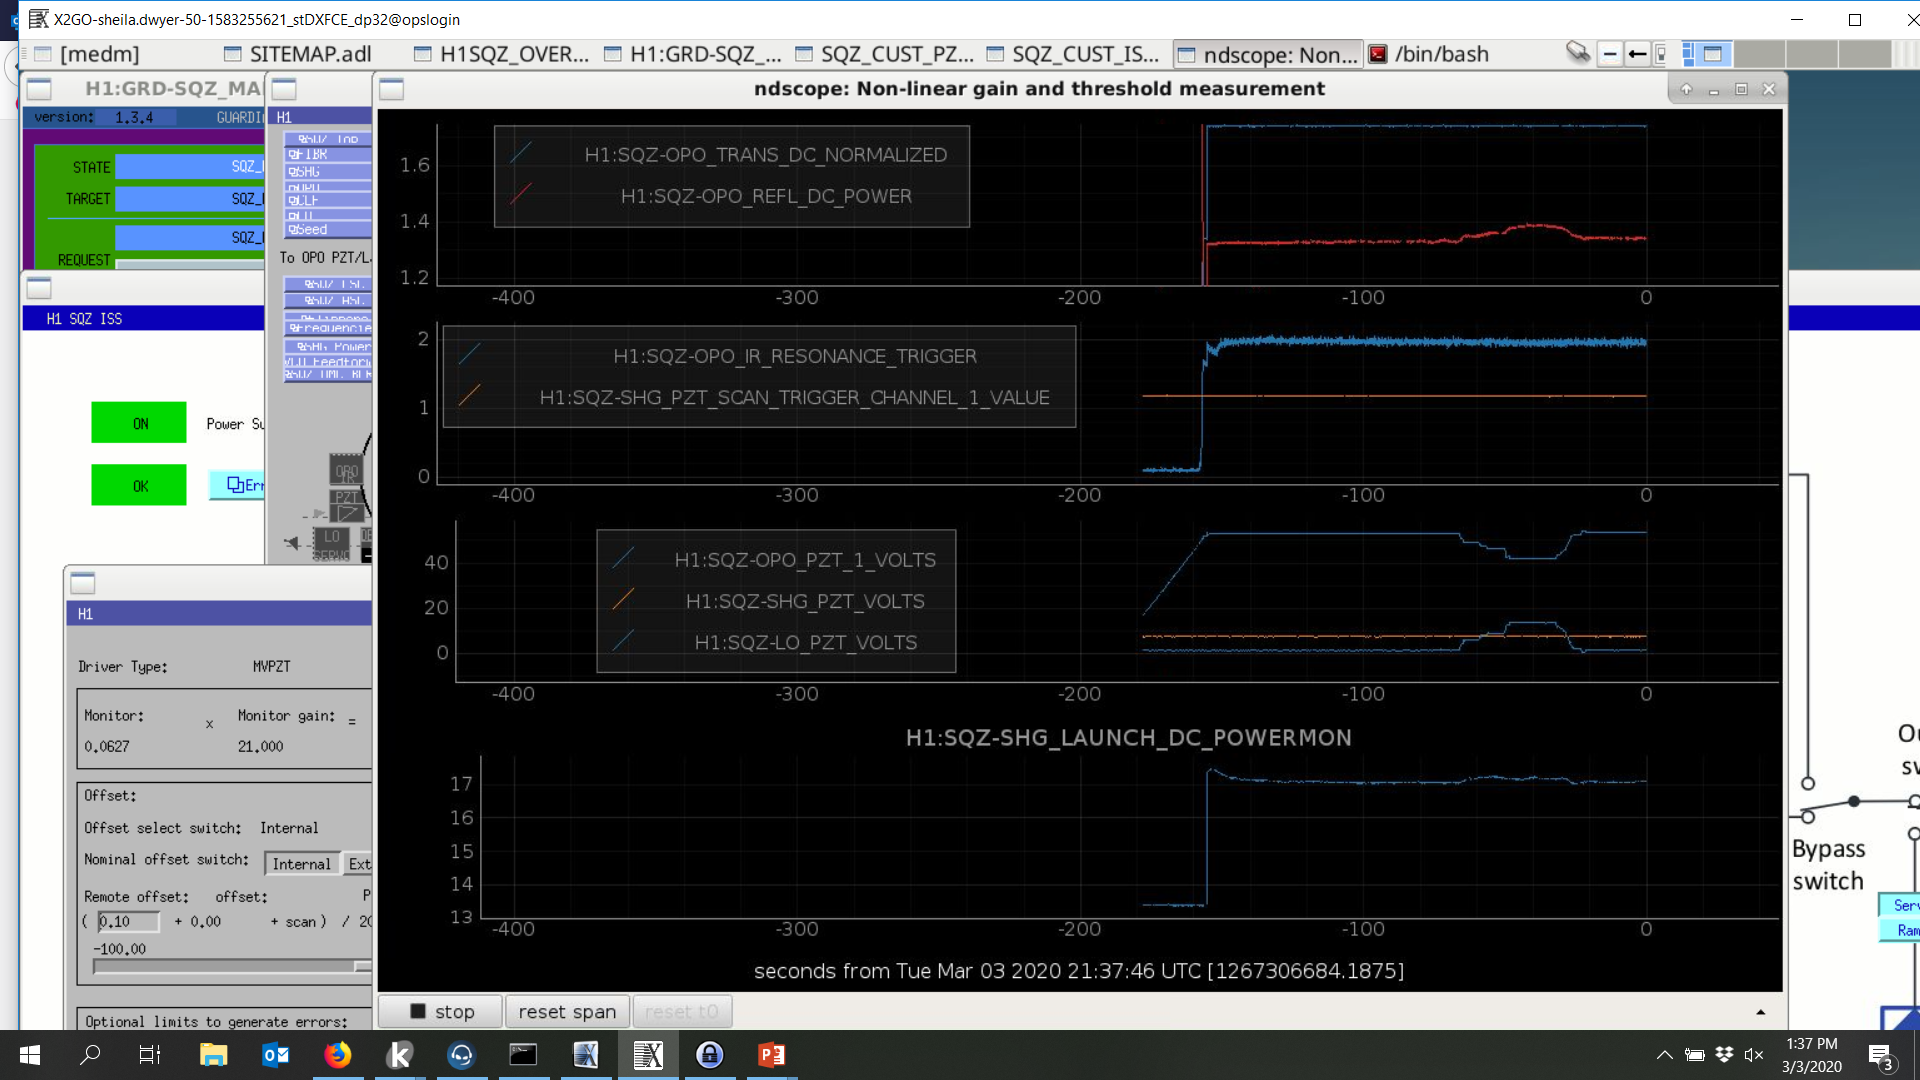
Jenne cabled the LO PZT driver channel (used only for locking with the diagnostic homodyne, not during runing) to the OPO PZT2. The attached screenshot shows that with the OPO locking using PZT1 (blue line, around 50V), we can move the offset on PZT2 (LO channel, blue line around 0-20V) to reduce the voltage on PZT1. You can see that the reflected power increases when there is a higher voltage on PZT2, which is on one of the curved mirrors, because the cavity gets more misaligned from driving PZT2 than PZT1.
We tried but weren't able to recreate the oscillation a second time, so we don't know if moving around the offset on the second PZT will have any impact on the instability. We can try to move this offset if the instability does reappear, although it might not help if the problem is related to the misalignment of the OPO that the high PZT1 voltage causes.
Keita was wondering if part of the difference (that prevented us from recreating the oscillation) was the fact that both PZTs were connected to cables, neither of them was connected to a terminator. So, I reverted PZT2 back to being a terminator (and re-plugged in the LO cable to the LO PZT output of the driver). Now everything cable-wise is back to how it was this morning. However, I still wasn't able to cause oscillations, even if I brought the green power up above 1.8.
So, for now I'll leave all of the cables as they are, which is fully reverted from the tests today. If we see the oscillations come back, then we'll reconsider again borrowing the LO driver channel for PZT2.
When I left things at a green power of 1.3, I had also reverted the squeezer angle, but had forgotten to revert the OPO crystal temperature, H1:SQZ-OPO_TEC_SETTEMP. I have now reverted it to its value from before last Thursday's green power change (33.014 C). I did not measure the nonlinear gain. For this, we were out of Observing for ~1 minute.
All three dust monitor vacuum pumps are running well. The pump body temperatures range between 103f and 139f. Made a small tweak to the vacuum pump air bypass in the corner station. Observed no carbon dust on the filters. Closing FAMIS #13008
HEPI pump fluid levels and pump stations checkout OK. No new leaks were noted. Fluid Levels: CS - 6 5/16" - No change from last check EY - 8 14/16" - No change from last check EX - 7 13/16" - No change from last check Closing FAMIS #13498
I reset both PSL power watchdogs at 17:57 UTC (9:57 PST), thereby completing FAMIS 10752.
In addition, I noticed that the ISS diffracted power % was on the low side (~1.2%, normally closer to 2%), so I adjusted the ISS RefSignal from -1.99V to -1.98V; the ISS is now diffracting ~1.7%. The RefSignal change was accepted in both safe and observe SDF files.
FAMIS9532
2020-03-03 08:45:08.355362
There are 1 STS proof masses out of range ( > 2.0 [V] )!
STS B DOF X/U = -2.291 [V]
All other proof masses are within range ( < 2.0 [V] ):
STS A DOF X/U = -0.752 [V]
STS A DOF Y/V = -0.929 [V]
STS A DOF Z/W = -0.412 [V]
STS B DOF Y/V = -0.456 [V]
STS B DOF Z/W = -0.354 [V]
STS C DOF X/U = 0.42 [V]
STS C DOF Y/V = 0.846 [V]
STS C DOF Z/W = -0.161 [V]
STS EX DOF X/U = -0.057 [V]
STS EX DOF Y/V = 0.301 [V]
STS EX DOF Z/W = 0.226 [V]
STS EY DOF X/U = 0.524 [V]
STS EY DOF Y/V = -0.472 [V]
STS EY DOF Z/W = 0.735 [V]
There are 8 T240 proof masses out of range ( > 0.3 [V] )!
ETMX T240 2 DOF X/U = -1.296 [V]
ETMX T240 2 DOF Y/V = -1.309 [V]
ETMX T240 2 DOF Z/W = -0.865 [V]
ITMX T240 1 DOF X/U = -1.498 [V]
ITMX T240 3 DOF X/U = -1.545 [V]
ITMY T240 2 DOF Y/V = 0.305 [V]
ITMY T240 3 DOF X/U = -0.554 [V]
ITMY T240 3 DOF Z/W = -1.851 [V]
All other proof masses are within range ( < 0.3 [V] ):
ETMX T240 1 DOF X/U = -0.036 [V]
ETMX T240 1 DOF Y/V = -0.076 [V]
ETMX T240 1 DOF Z/W = -0.124 [V]
ETMX T240 3 DOF X/U = -0.112 [V]
ETMX T240 3 DOF Y/V = -0.135 [V]
ETMX T240 3 DOF Z/W = -0.092 [V]
ETMY T240 1 DOF X/U = -0.121 [V]
ETMY T240 1 DOF Y/V = 0.256 [V]
ETMY T240 1 DOF Z/W = -0.036 [V]
ETMY T240 2 DOF X/U = -0.053 [V]
ETMY T240 2 DOF Y/V = -0.076 [V]
ETMY T240 2 DOF Z/W = -0.085 [V]
ETMY T240 3 DOF X/U = -0.05 [V]
ETMY T240 3 DOF Y/V = -0.125 [V]
ETMY T240 3 DOF Z/W = 0.092 [V]
ITMX T240 1 DOF Y/V = 0.112 [V]
ITMX T240 1 DOF Z/W = 0.114 [V]
ITMX T240 2 DOF X/U = 0.09 [V]
ITMX T240 2 DOF Y/V = 0.173 [V]
ITMX T240 2 DOF Z/W = 0.165 [V]
ITMX T240 3 DOF Y/V = 0.061 [V]
ITMX T240 3 DOF Z/W = -0.047 [V]
ITMY T240 1 DOF X/U = 0.132 [V]
ITMY T240 1 DOF Y/V = 0.14 [V]
ITMY T240 1 DOF Z/W = 0.219 [V]
ITMY T240 2 DOF X/U = 0.093 [V]
ITMY T240 2 DOF Z/W = 0.211 [V]
ITMY T240 3 DOF Y/V = 0.182 [V]
BS T240 1 DOF X/U = -0.025 [V]
BS T240 1 DOF Y/V = -0.12 [V]
BS T240 1 DOF Z/W = 0.27 [V]
BS T240 2 DOF X/U = 0.077 [V]
BS T240 2 DOF Y/V = 0.242 [V]
BS T240 2 DOF Z/W = -0.027 [V]
BS T240 3 DOF X/U = 0.058 [V]
BS T240 3 DOF Y/V = -0.183 [V]
BS T240 3 DOF Z/W = -0.192 [V]
Hugh and I recentered all of these.
Reminder to future recenterers: Make sure that the chambers are in DAMPED, sensor correction is off, and Earthquake automation is OFF
TITLE: 03/03 Day Shift: 16:00-00:00 UTC (08:00-16:00 PST), all times posted in UTC
STATE of H1: Observing at 118Mpc
OUTGOING OPERATOR: Patrick
CURRENT ENVIRONMENT:
SEI_CONF state: WINDY
Wind: 10mph Gusts, 8mph 5min avg
Primary useism: 0.02 μm/s
Secondary useism: 0.31 μm/s
QUICK SUMMARY: 89 hours locked. Maintenance about to start.
Laser Status:
Front End Power is 32.08W (should be around 30 W)
70W Output Power is 69.49W
Front End Watch is GREEN
70W Watch is GREEN
PMC:
It has been locked 6 days, 20 hr 7 minutes (should be days/weeks)
Reflected power = 11.83Watts
Transmitted power = 51.9Watts
PowerSum = 63.73Watts.
FSS:
It has been locked for 3 days 16 hr and 54 min (should be days/weeks)
TPD[V] = 5.523V (min 0.9V)
ISS:
The diffracted power is around 2.5%
Last saturation event was 3 days 16 hours and 52 minutes ago (should be days/weeks)
Possible Issues: No apparent issues at this time.
TITLE: 03/03 Eve Shift: 00:00-08:00 UTC (16:00-00:00 PST), all times posted in UTC
STATE of H1: Observing at 64Mpc
INCOMING OPERATOR: Patrick
SHIFT SUMMARY:
H1's been locked over 81hrs with range just under 120Mpc. Microseism is inching up just a little.
LOG:
H1's been locked over 77.25hrs. A few big glitches in the last 30min, but all looks good.
Addressed TCS Chillers (6:02pm local):
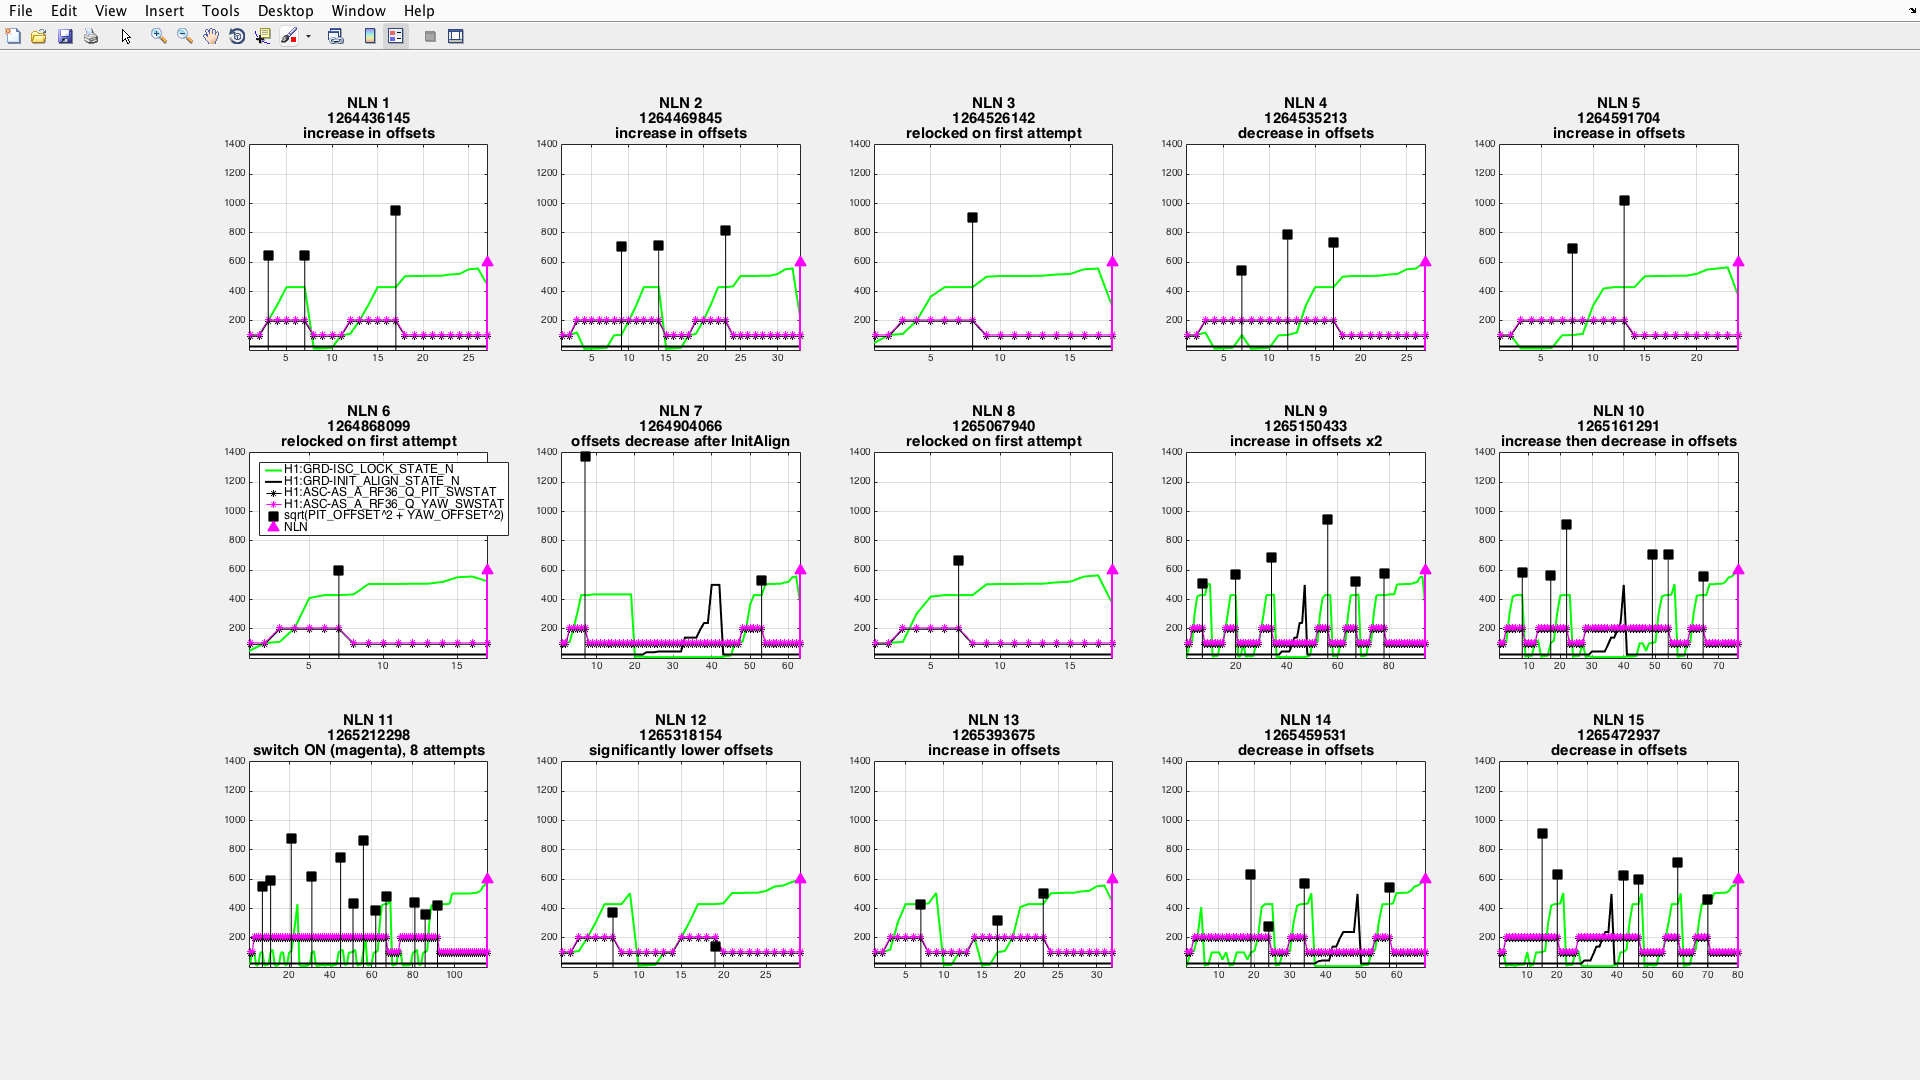
Looking again at H1:ASC-AS_A_RF36_Q_PIT_OFFSET and H1:ASC-AS_A_RF36_Q_YAW_OFFSET, while relocking H1, I've plotted 15 relocks, and instead of plotting pitch and yaw, I've plotted the sqrt(pit^2 +yaw^2), which represents the combined offset required for each relocking sequence that reached ISC_LOCK =110, where the offsets are set.
In the attached plots, I collected data at the interval of 120 seconds from LL (lockloss) to NLN (Nominal Low Noise). Then I reduced the data further, but starting 120 seconds before the first time that the AS_A pitch and yaw offsets were set, and ending at NLN. Any lock atempts that are before the first time that ISC_LOCK reached 110 are not shown, however every lock attempt from the first ISC_LOCK = 110 to NLN is included, so each plot shows continuous data along the X axis, every 120 seconds.
The legend is only on one plot (ugh), so I'm listing it here, and givning more detail, which applies for each of the 15 plots:
In the title of each plot is the NLN number, 1-15, the START time (GPS start time), and a comment about the offsets (black squares), and if they were increasing or decreasing, or the SWSTAT remainded in the "offset ON" for multiple relocking attempts. I didn't collect the OUTPUT AS_A pitch and yaw data for this data set, but have for other data sets, so the SWSTAT is included here just to give a sense of how often it changes, and how often it stays in the ON position.
There are some interesting changes in the offset values, and in particular the change in plot NLN 11, bottom left corner, with a change from before x = 60 to after that is clearly visible, but there is no change to INIT_ALIGN. I could imagine that a manual alignment of one or possibly a few optics is the soure of the change, but I haven't looked into it, so at this point the explanation is unknown.
Even though this data is from a month ago, it has an interesting feature, which is that each row of plots has it's own set of offset values that relocked and made it to NLN:
Charting the max, min, and mean values:
| max | min | mean | |
| top row | 1023 | 734 | 904 |
| middle row | 665 | 523 | 575 |
| bottom row | 541 | 140 | 464 |
This suggests some change that might be possible to track down, and I found this data with no particulare goal in selecting the number of relocks, or when in time, other than within the last 2 months, so it's very possible that all of the data for relocking would have this feature, which could reflect changes that happen on the scale of days to weeks.
Sheila, Sudarshan
Since sensing function measurements taken during O3A, at low frequencies, couldnot be entirely explained by the detuned signal recycling cavity, efforts were made to understand the mechanism by which the measured sensing function could be explained. There were indications that some of these effect could be a result of unmodeled cross couplings between length and angle. Details of some previous efforts can be found in LHO alog # 50511 and DCC document G1901353.
Here we have explored the deviation in measured sensing function from the simple DARM model (with a cavity pole and optical gain) in two different configurations, with A2L gain turned on and A2L gain turned off. The details about the measurment can be found in LHO alog # 54679.
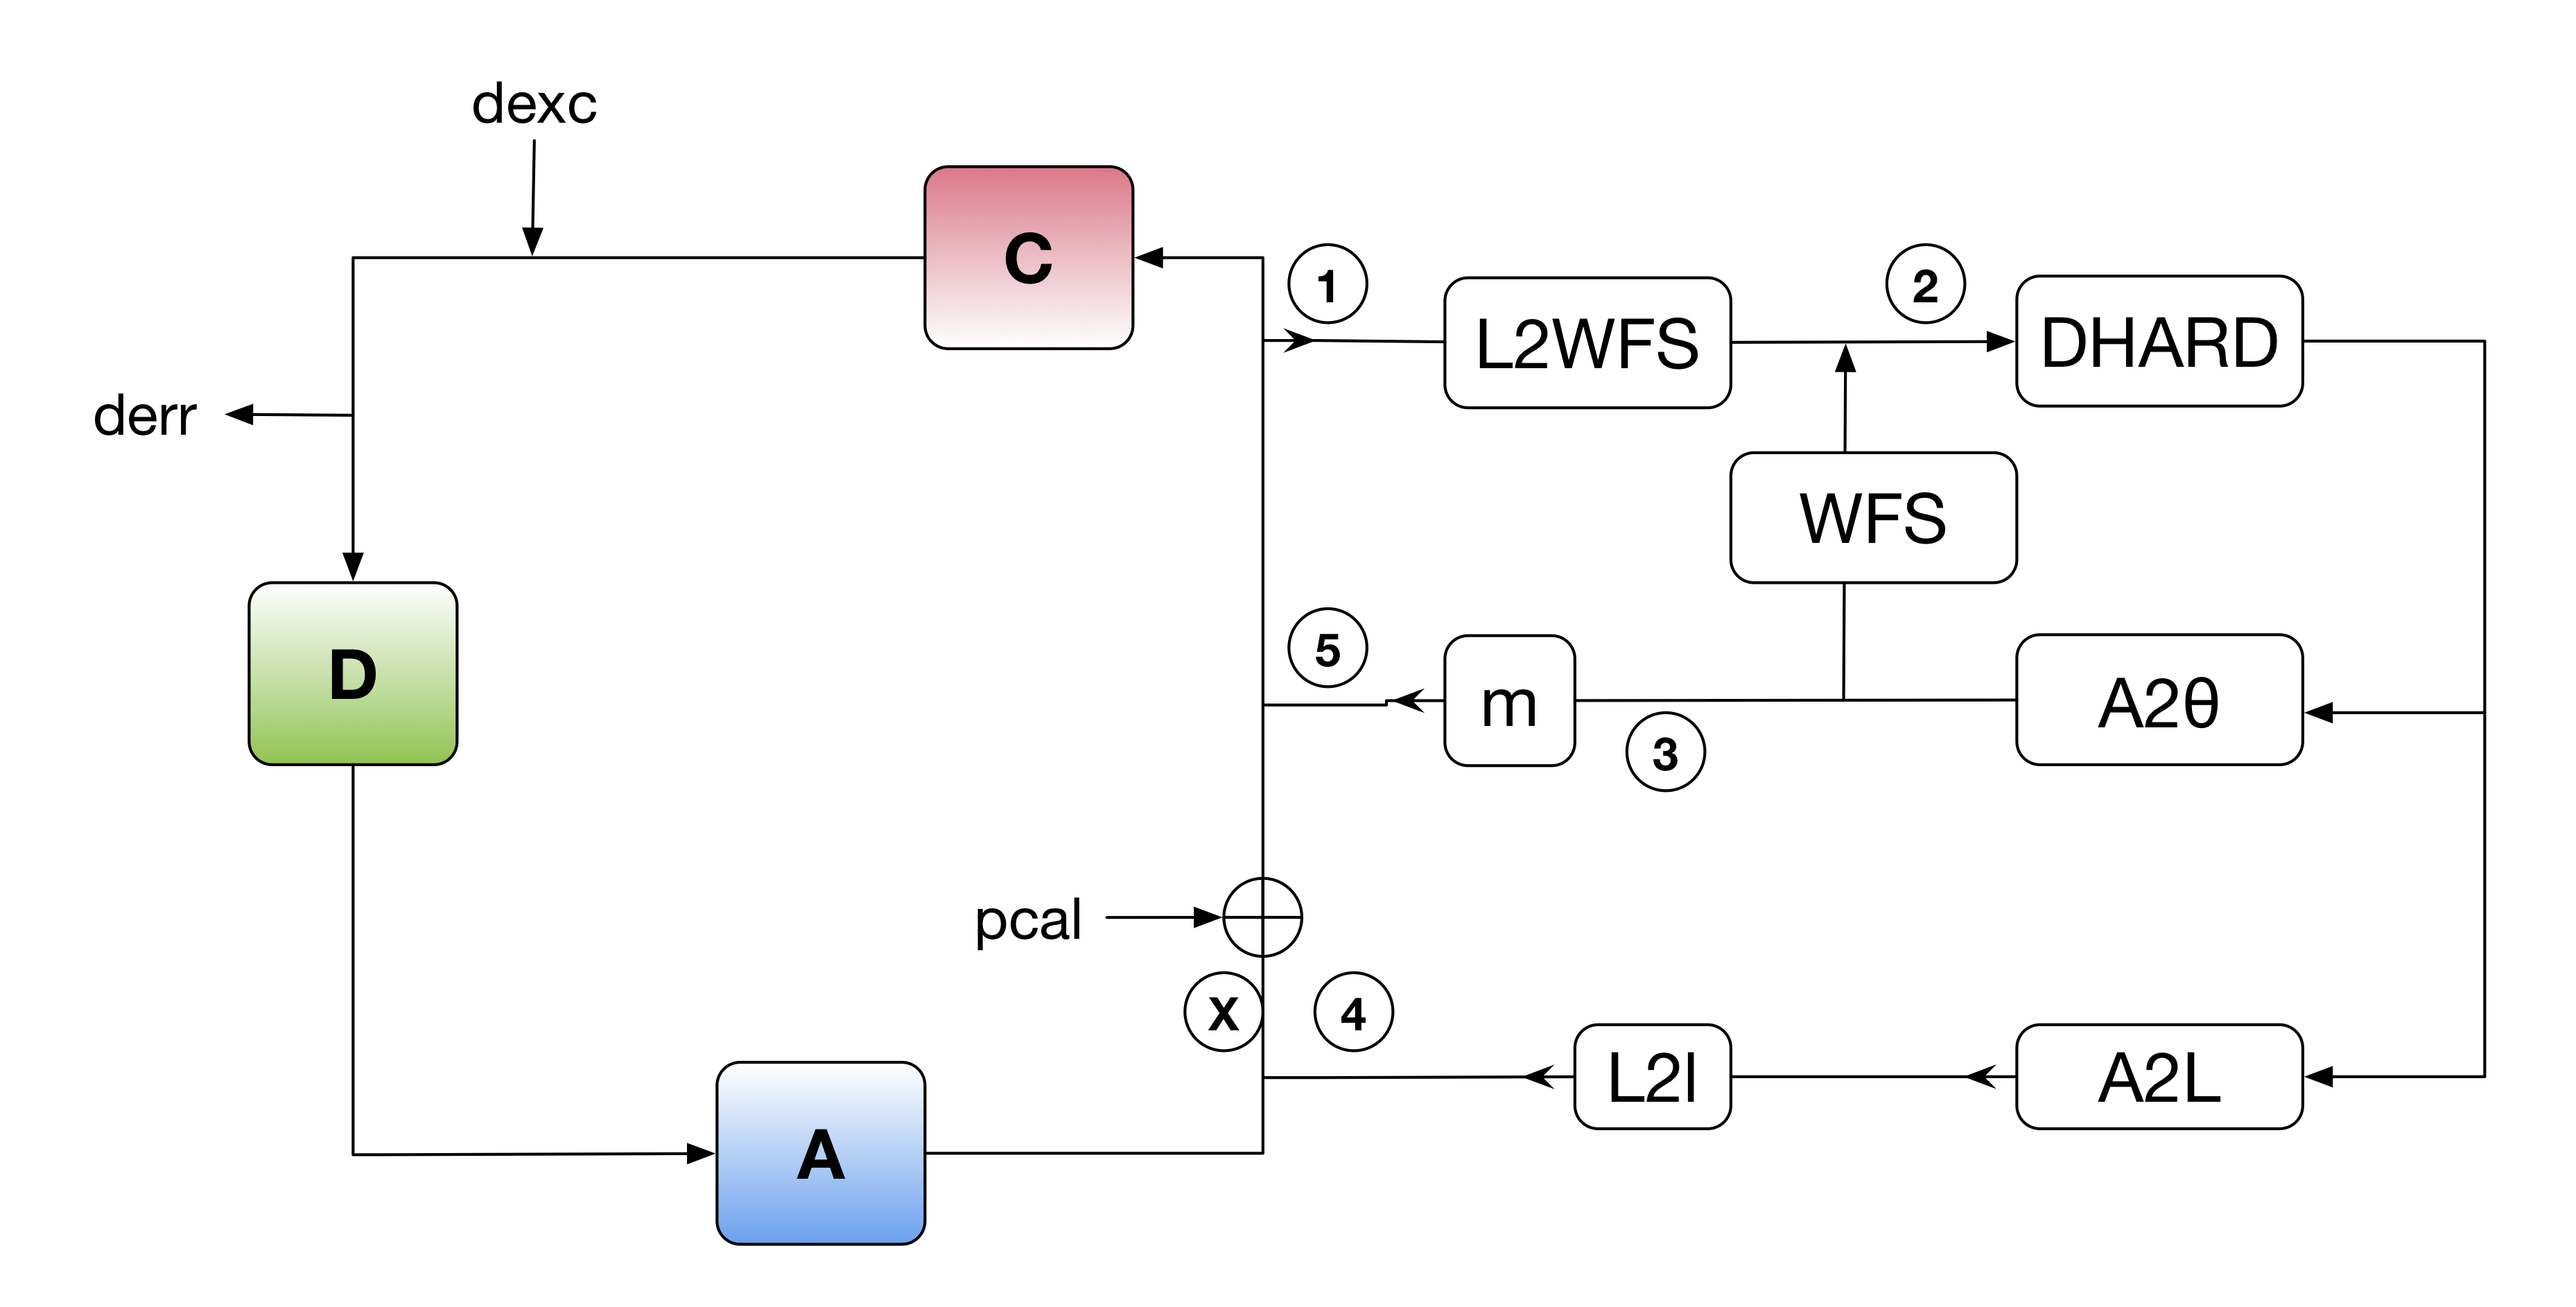
The sensing function model that is considered here is shown in the block-diagram below:

This model considers length (DARM) to angle coupling through the wavefront sensor of the DHARD loops. In this model, the sensing function depends on the the DHARD loop shape as well as the A2L gain. The resultant sensing function differs from the simple model (without cross couplings) as follows:
C_new = C_old/[1-B(L2l*A2L/A2theta+m)]
where B is:
B = GDH/(1-GDH)*(L2WFS/WFS)
and GDH is the DHARD open loop gain.
The comparison between the model and the measurement is shown in the first attached pdf. It shows a reasonable agreement between the model and measurement, although there is some discrepancies at frequencies below 10 Hz. This model only includes the length to angle coupling in pitch. Coupling in yaw, we believe it to be relatively small, has not been considered. Additionally, the model of the DAHRD loop that is considered here doesnot completely agree with the measurement as shown in the second attachment.
Some of the terms used above are defined here:
1. L2WFS : WFS sensitivity to DARM length
2. A2θ : PUM angle drive to test mass angular displacment
3. A2L : Angle to length drive-align digital filters
4. L2l : PUM length drive to testmass length displacment
5. m : miscentering of the IFO beam on testmass
TITLE: 03/03 Eve Shift: 00:00-08:00 UTC (16:00-00:00 PST), all times posted in UTC
STATE of H1: Observing at 117Mpc
OUTGOING OPERATOR: Jim
CURRENT ENVIRONMENT:
SEI_CONF state: WINDY
Wind: 15mph Gusts, 12mph 5min avg
Primary useism: 0.04 μm/s
Secondary useism: 0.35 μm/s
Microseism is slowly increasing over last 24hrs (but still under 90th percentile). Winds are hovering just under 20mph (after recently being above 20mph for an hour-ish).
QUICK SUMMARY:
H1's been locked almost 73.5hrs (observing only 2+hrs due to today's calibration work) with a range hovering just under 120Mpc.
Sudarshan currently has some calibration lines running around 500Hz, and will be turning them off in about 90-120mins.
TITLE: 03/03 Day Shift: 16:00-00:00 UTC (08:00-16:00 PST), all times posted in UTC
STATE of H1: Observing at 113Mpc
INCOMING OPERATOR: Corey
SHIFT SUMMARY:
LOG:
19:00 JeffK running calibration measurements
20:41 Back to Observing
22:08 JeffK & Sudarshan changing PCAL lines
22:14 Back to Observing
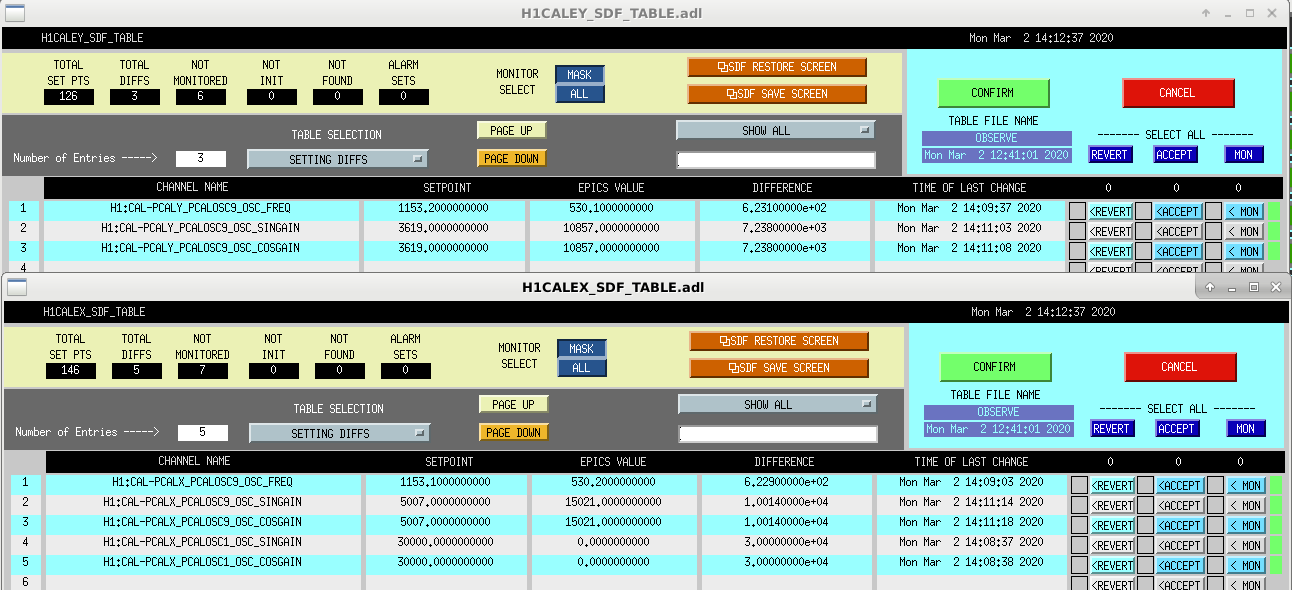
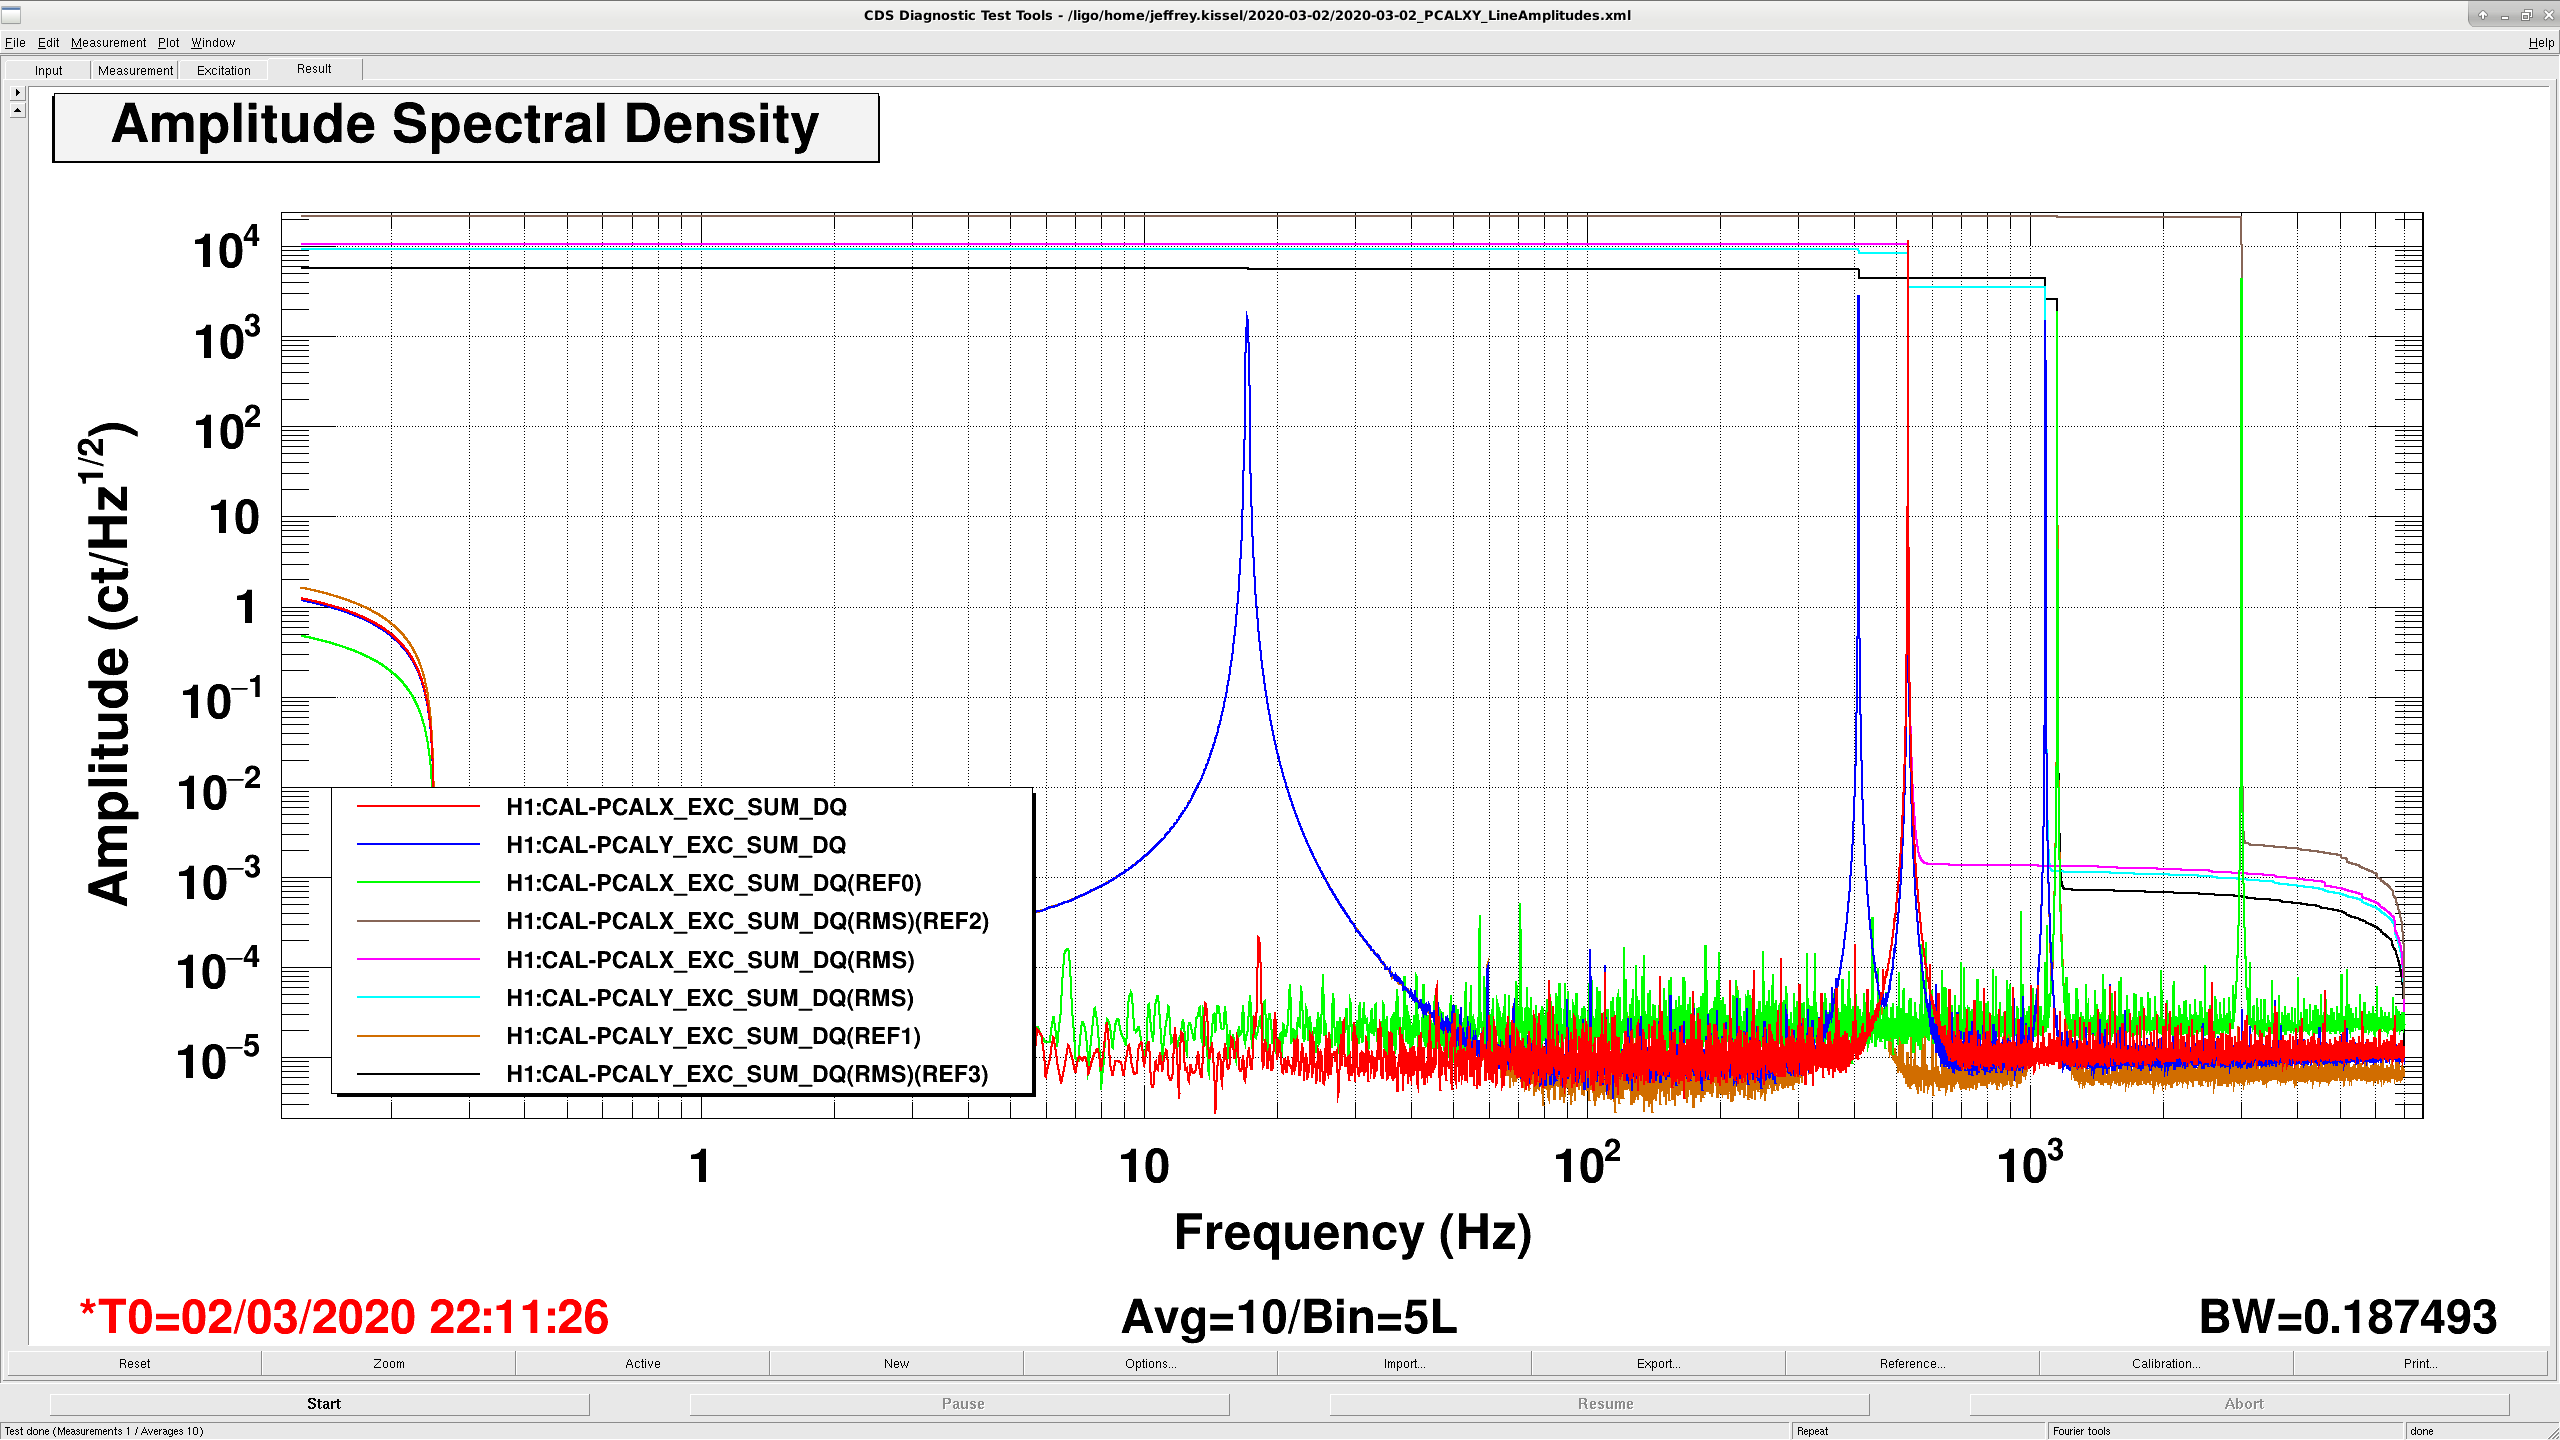
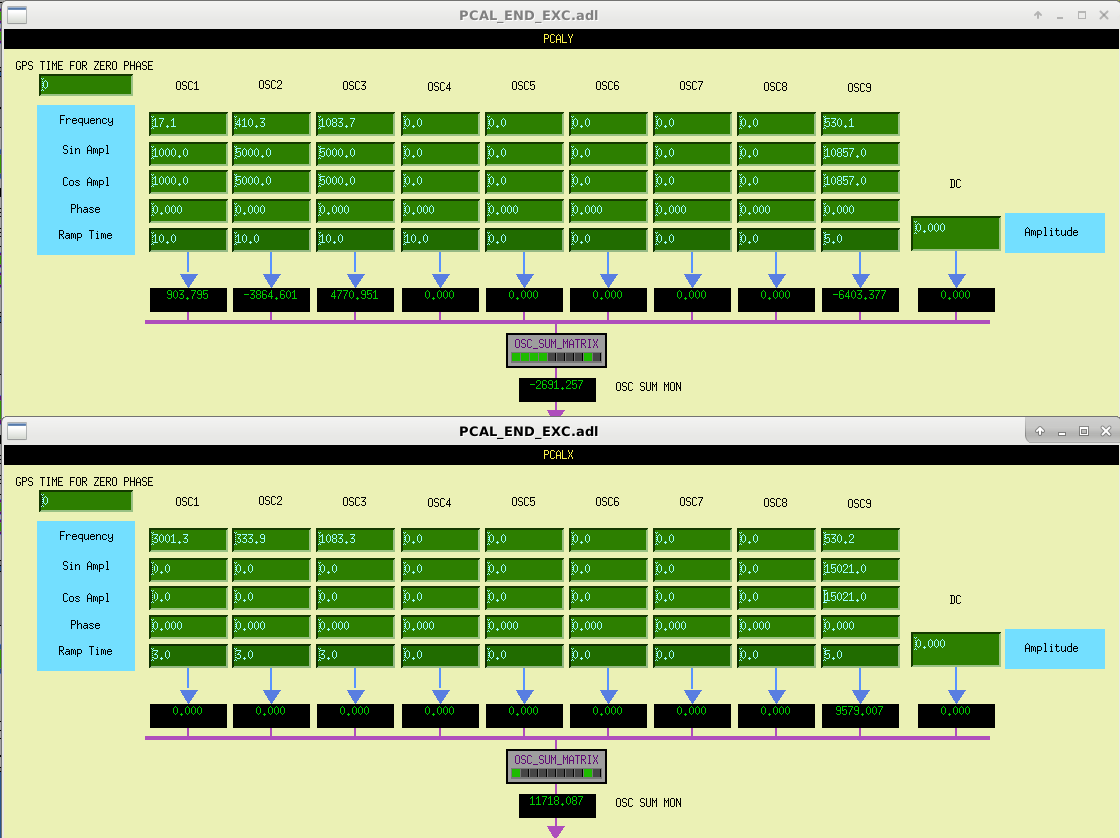
J. Kissel, S. Karki Sudarshan / Dripta have analyzed the data from the last test of PCALX vs. PCALY from back in early February (LHO aLOG 54873), and found that -- even with the factor of ~8 increase in SNR they gained from moving the usual 1153 Hz pair of lines down to 530 Hz -- the variation in the data over the 4 hour test was too large to determine the calibration discrepancy between the ends to a satisfactory precision. Thus, today, we try again, with the PCAL lines back down at 530 Hz, but with an increase in amplitude by a factor of 3 (and a flip-flip of frequency assignment). These lines will be in the data for ~4 hours, and have been installed in the observation ready segment starting at Mar 02 2020 22:13:35 UTC (1267222433). PCALX has been placed at 530.20 Hz, with amplitude 3.0*5007.0 = 15021.0 ct_pk. PCALY has been placed at 530.10 Hz, with amplitude 3.0*3619.0 = 10857.0 ct_pk. With these excitation amplitudes -- and the other "normal" PCALY calibration lines running at 17.1, 410.3, and 1083.7 as well as pulsar injections -- the RMS excitation value is 16021.6 ct_RMS for PCALX and 9189.13 ct_RMS for PCALY. The RMS for PCALX when high frequency roaming line is at 3001.3 Hz, is 21507 ct_RMS, so theoretically there is more head room to increase the amplitude more, if need be, but at the time we don't find it necessary, and we do quite enjoy this kind of head room we have before saturation. Attached are screenshots of the SDF differences that were accepted to make this temporary change, and an ASD and RMS of the total requested excitation signal coming out of each PCAL. Note -- in order to obtain this increase, we had to completely turn OFF the high frequency roaming PCALX line (which is currently at 3001.3 Hz -- but given that we've had a beautiful 70+ hour lock stretch, we won't miss these 4 hours).
Attached is a screenshot of the PCAL oscillator MEDM screens during this test.
These lines have been switched back to X=1153.1 and Y=1153.2 Hz at 2020-03-03 02:14:25 UTC, and we're back in observing by 2020-03-03 02:17:26 UTC. We have data at 530.1 and 530.2 for approx for 4 hours.
In the comments to this aLOG are a number or supporting figures for the suspension model changes for LHO calibration.
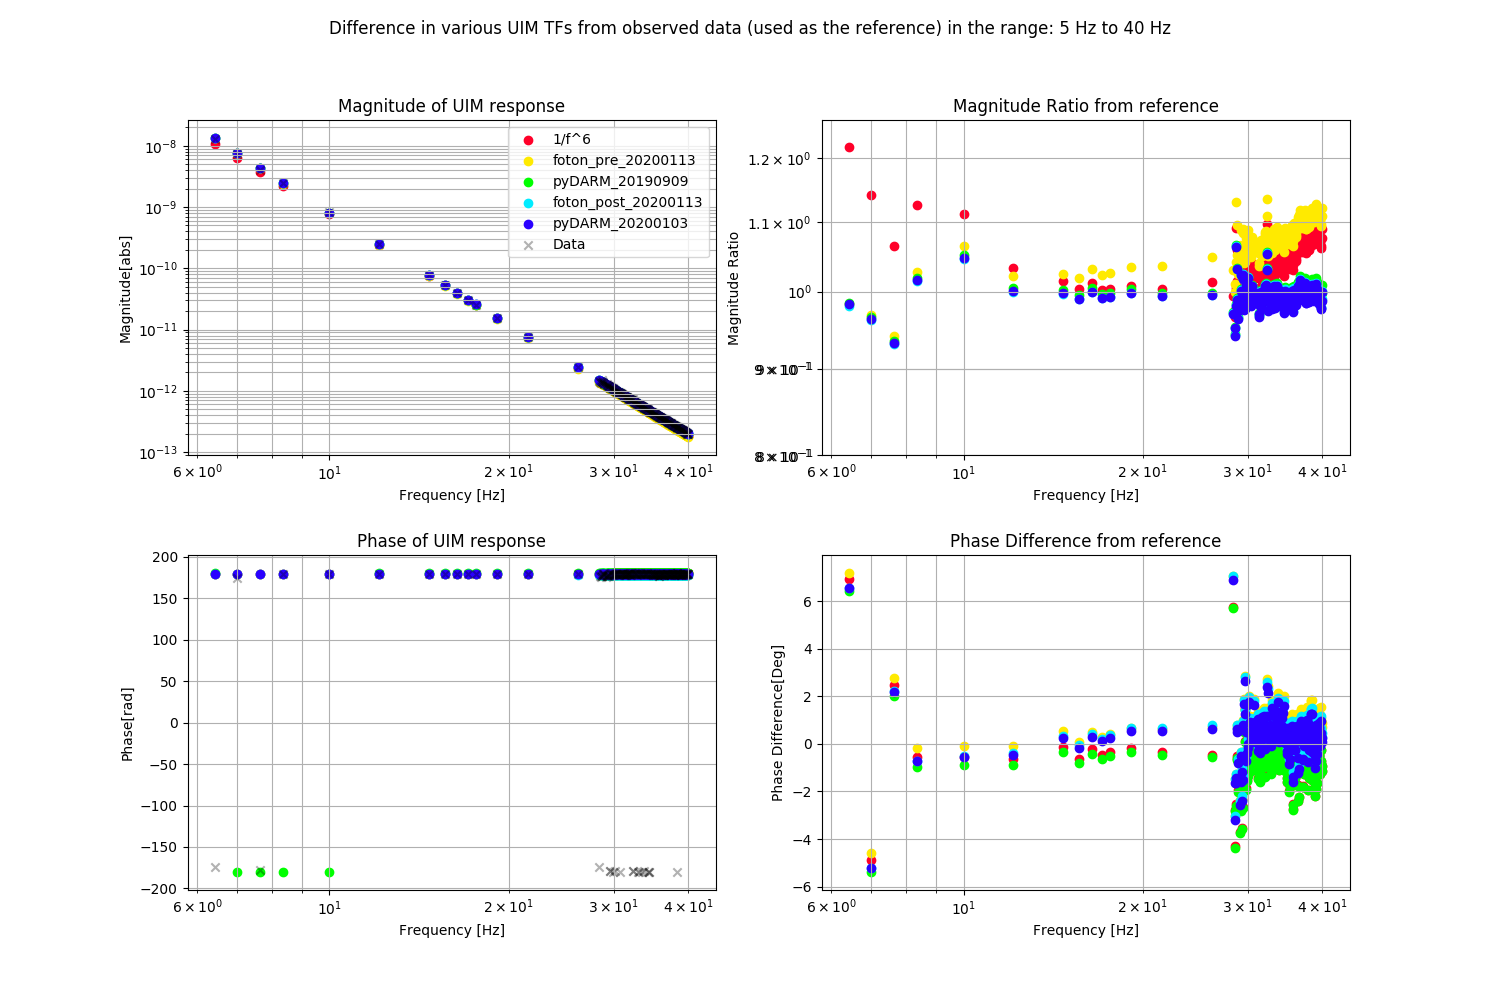
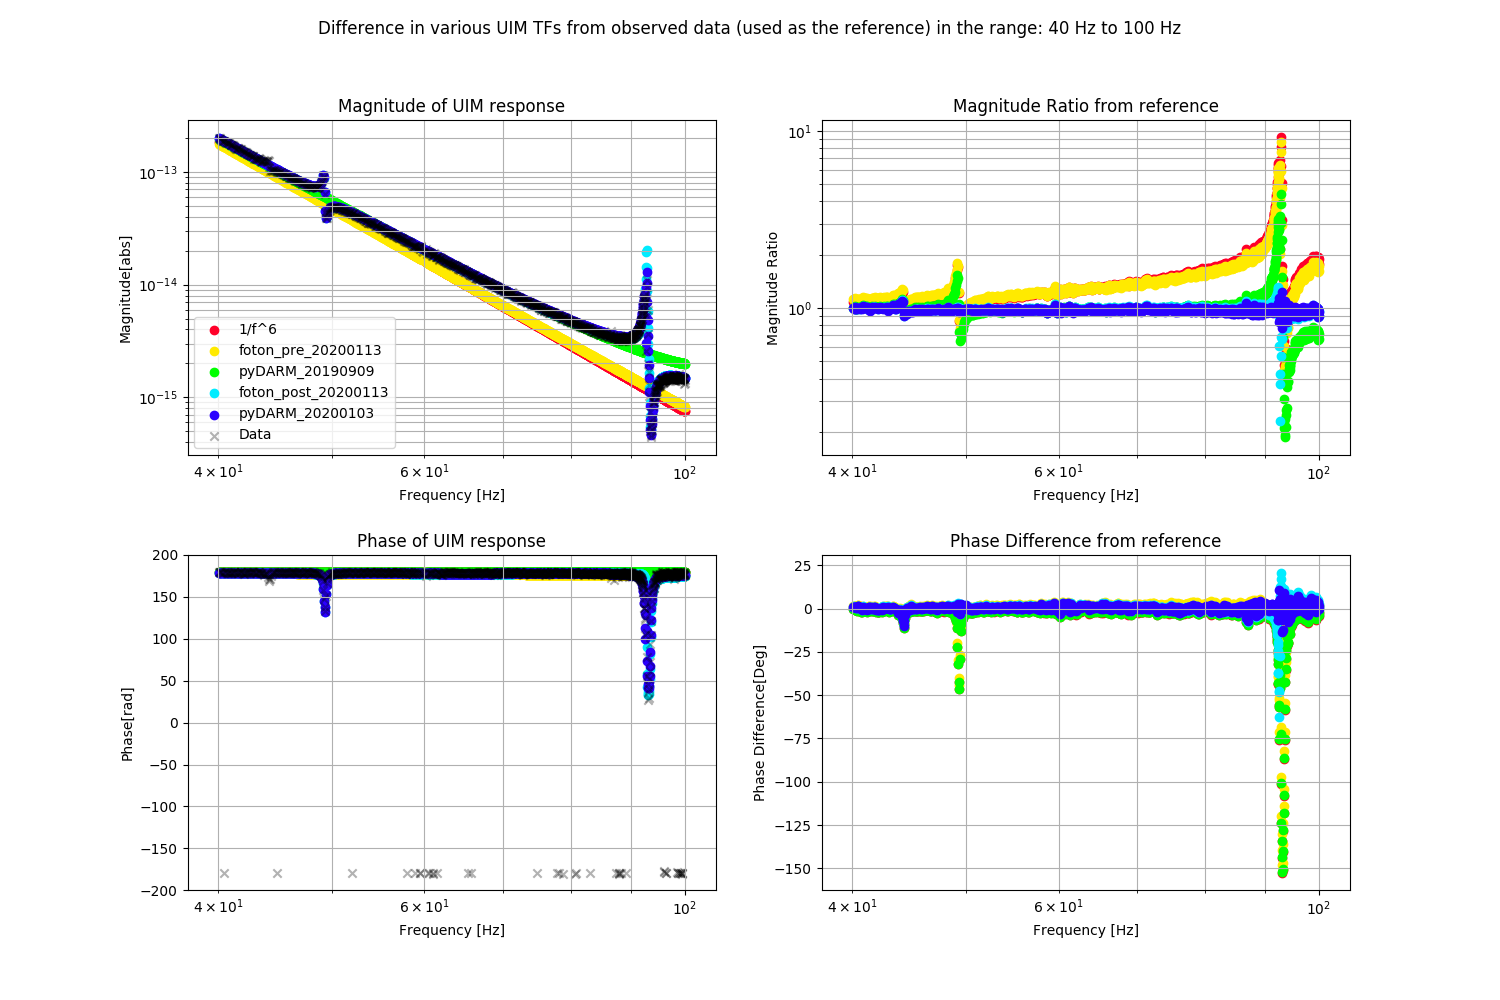
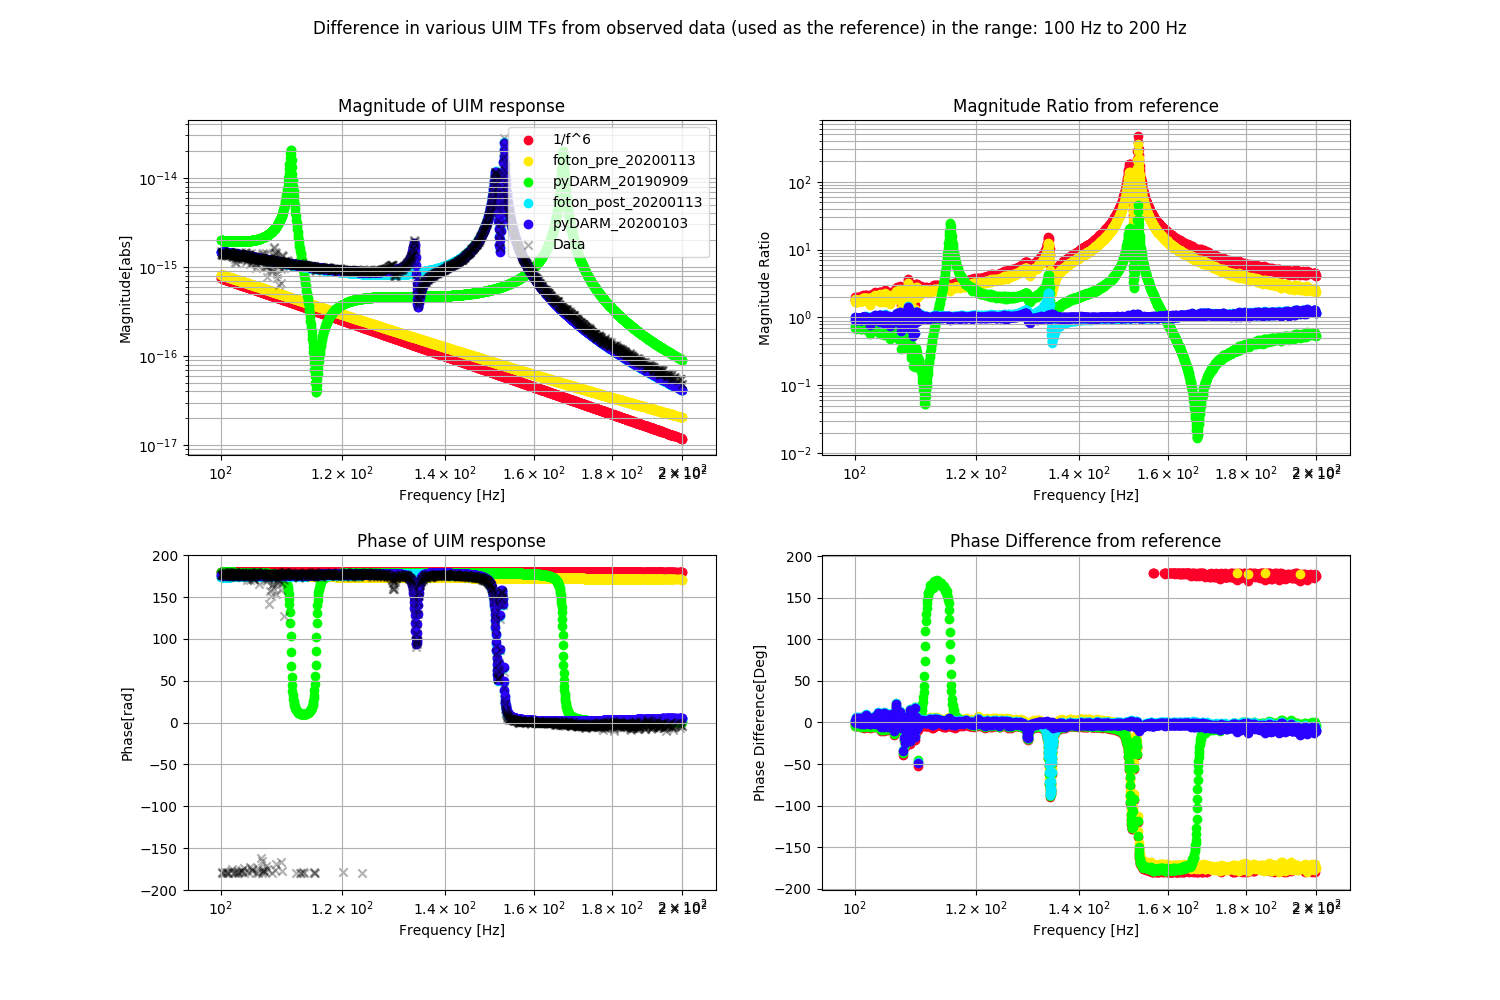
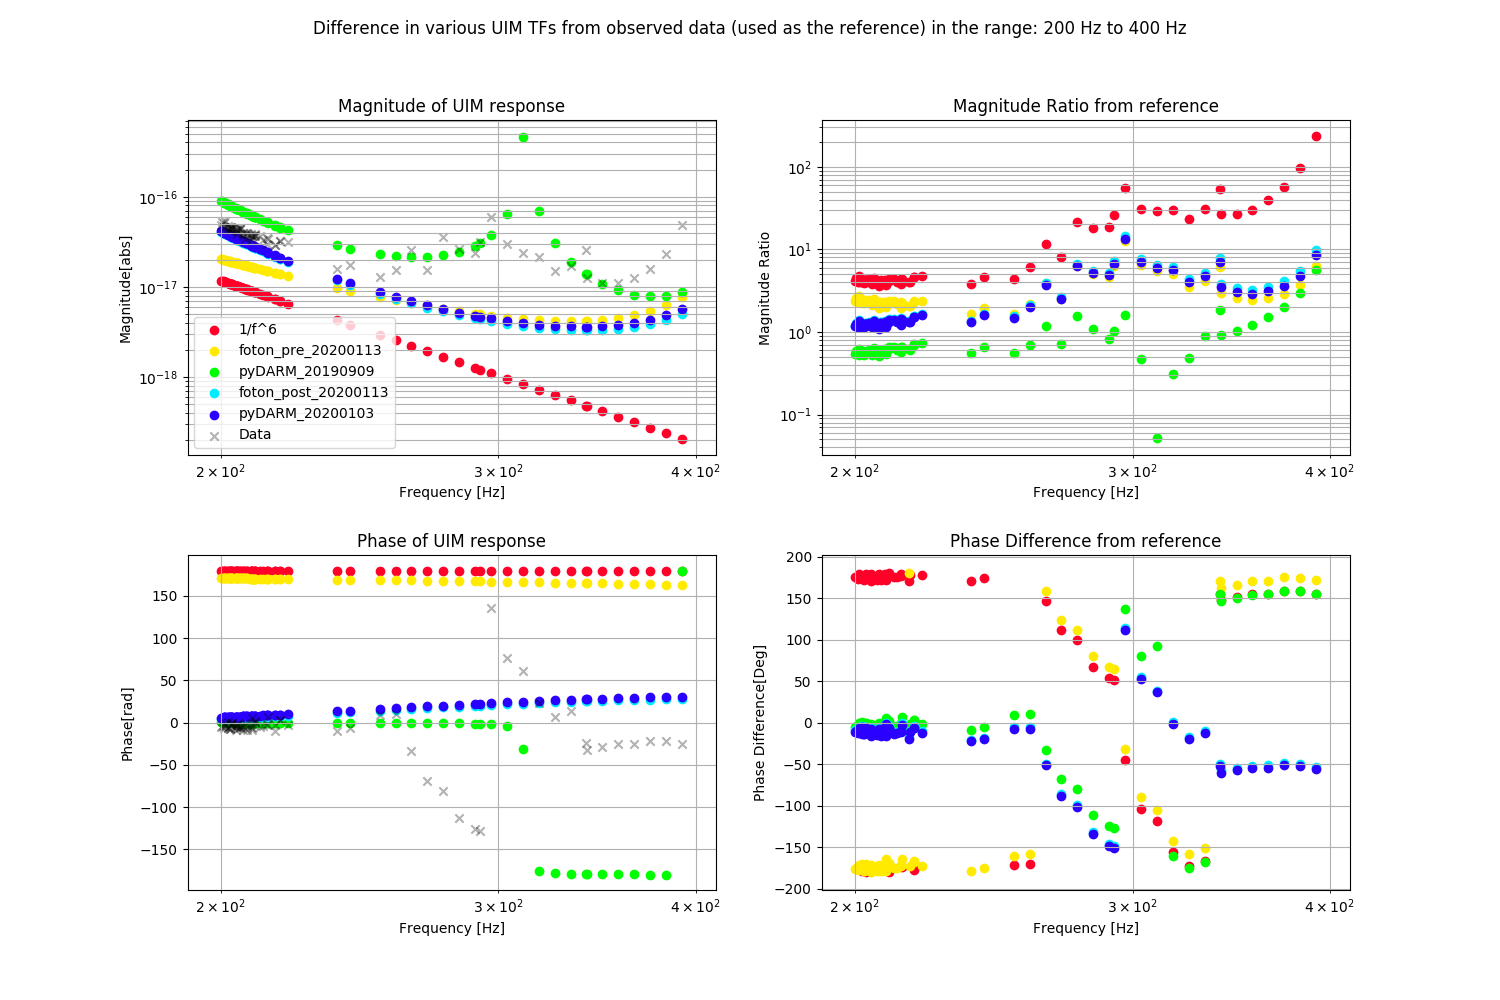
Demonstrating Measurement to Model residual systematic error.
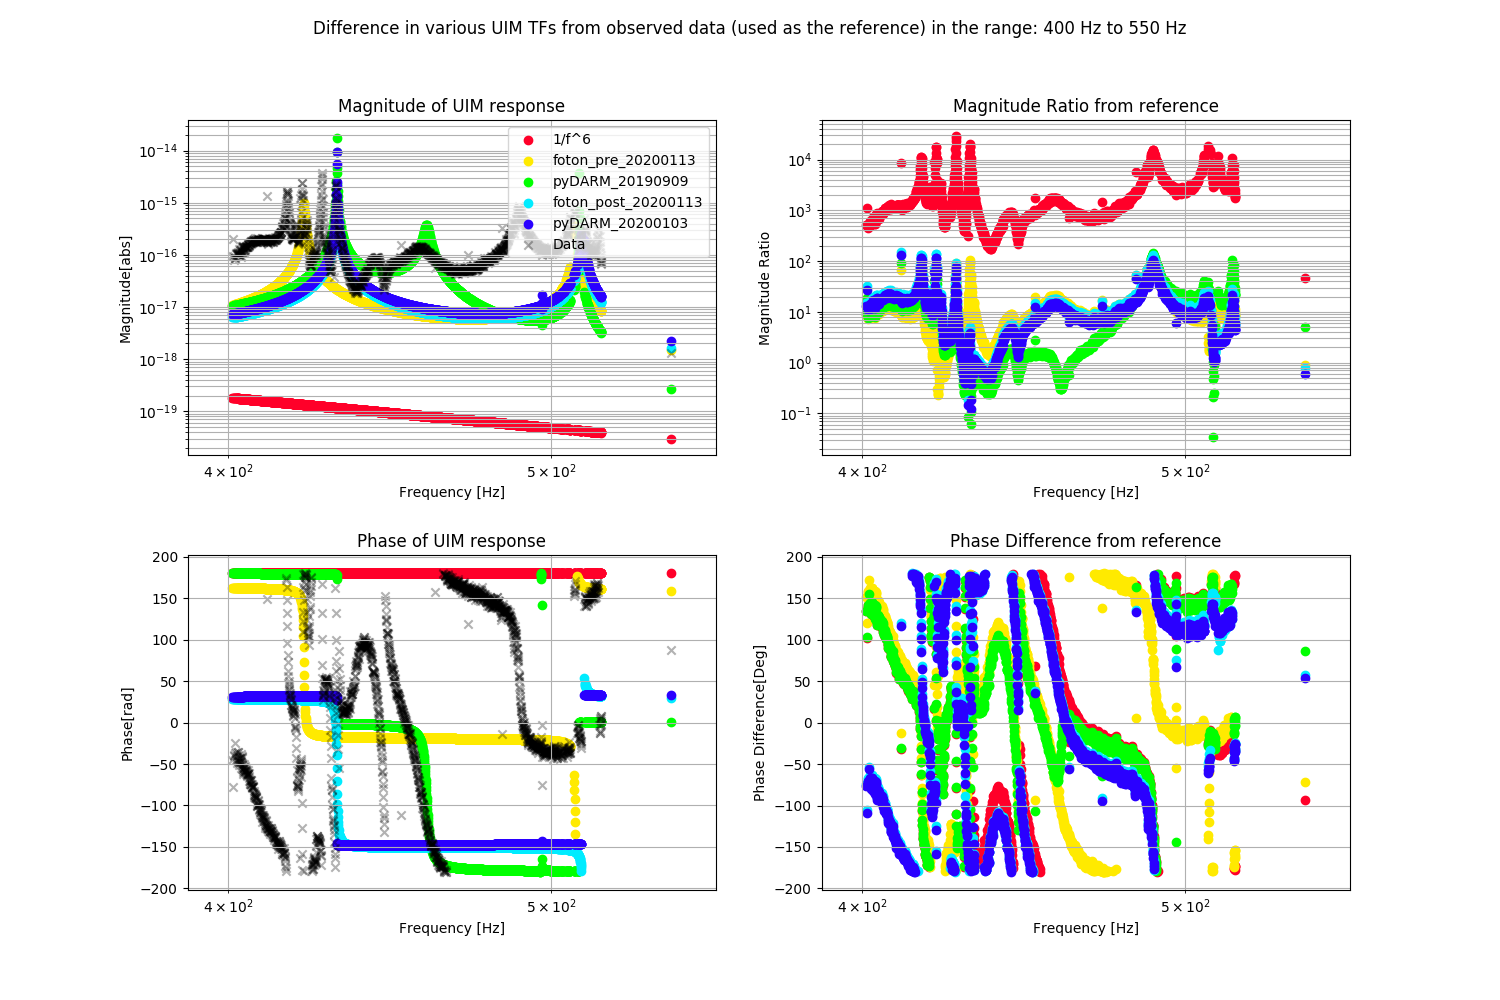
I have plotted the diffference between observed data of the UIM L2L transfer function in comparison with the following models:
The order is chesen to be in decending order with increasing "goodness" - this way to best one is plotted on top of the rest
The plots are broken up into 5 parts of the freuquency spectrum (where we have data: 5 to 550 Hz), to make the lare amount of infromation more readable.
Going through these plots is informative in understanding how each model is "good" is various parts of the spectrum, and how it can be "bad" in other parts.
The take home message is that the new pyDARM model is good up to 200 Hz, and the new CALCS filter is approximately identical to it, and reflects the data just as well.
Demonstrate Model to CALCS residual systematic error.
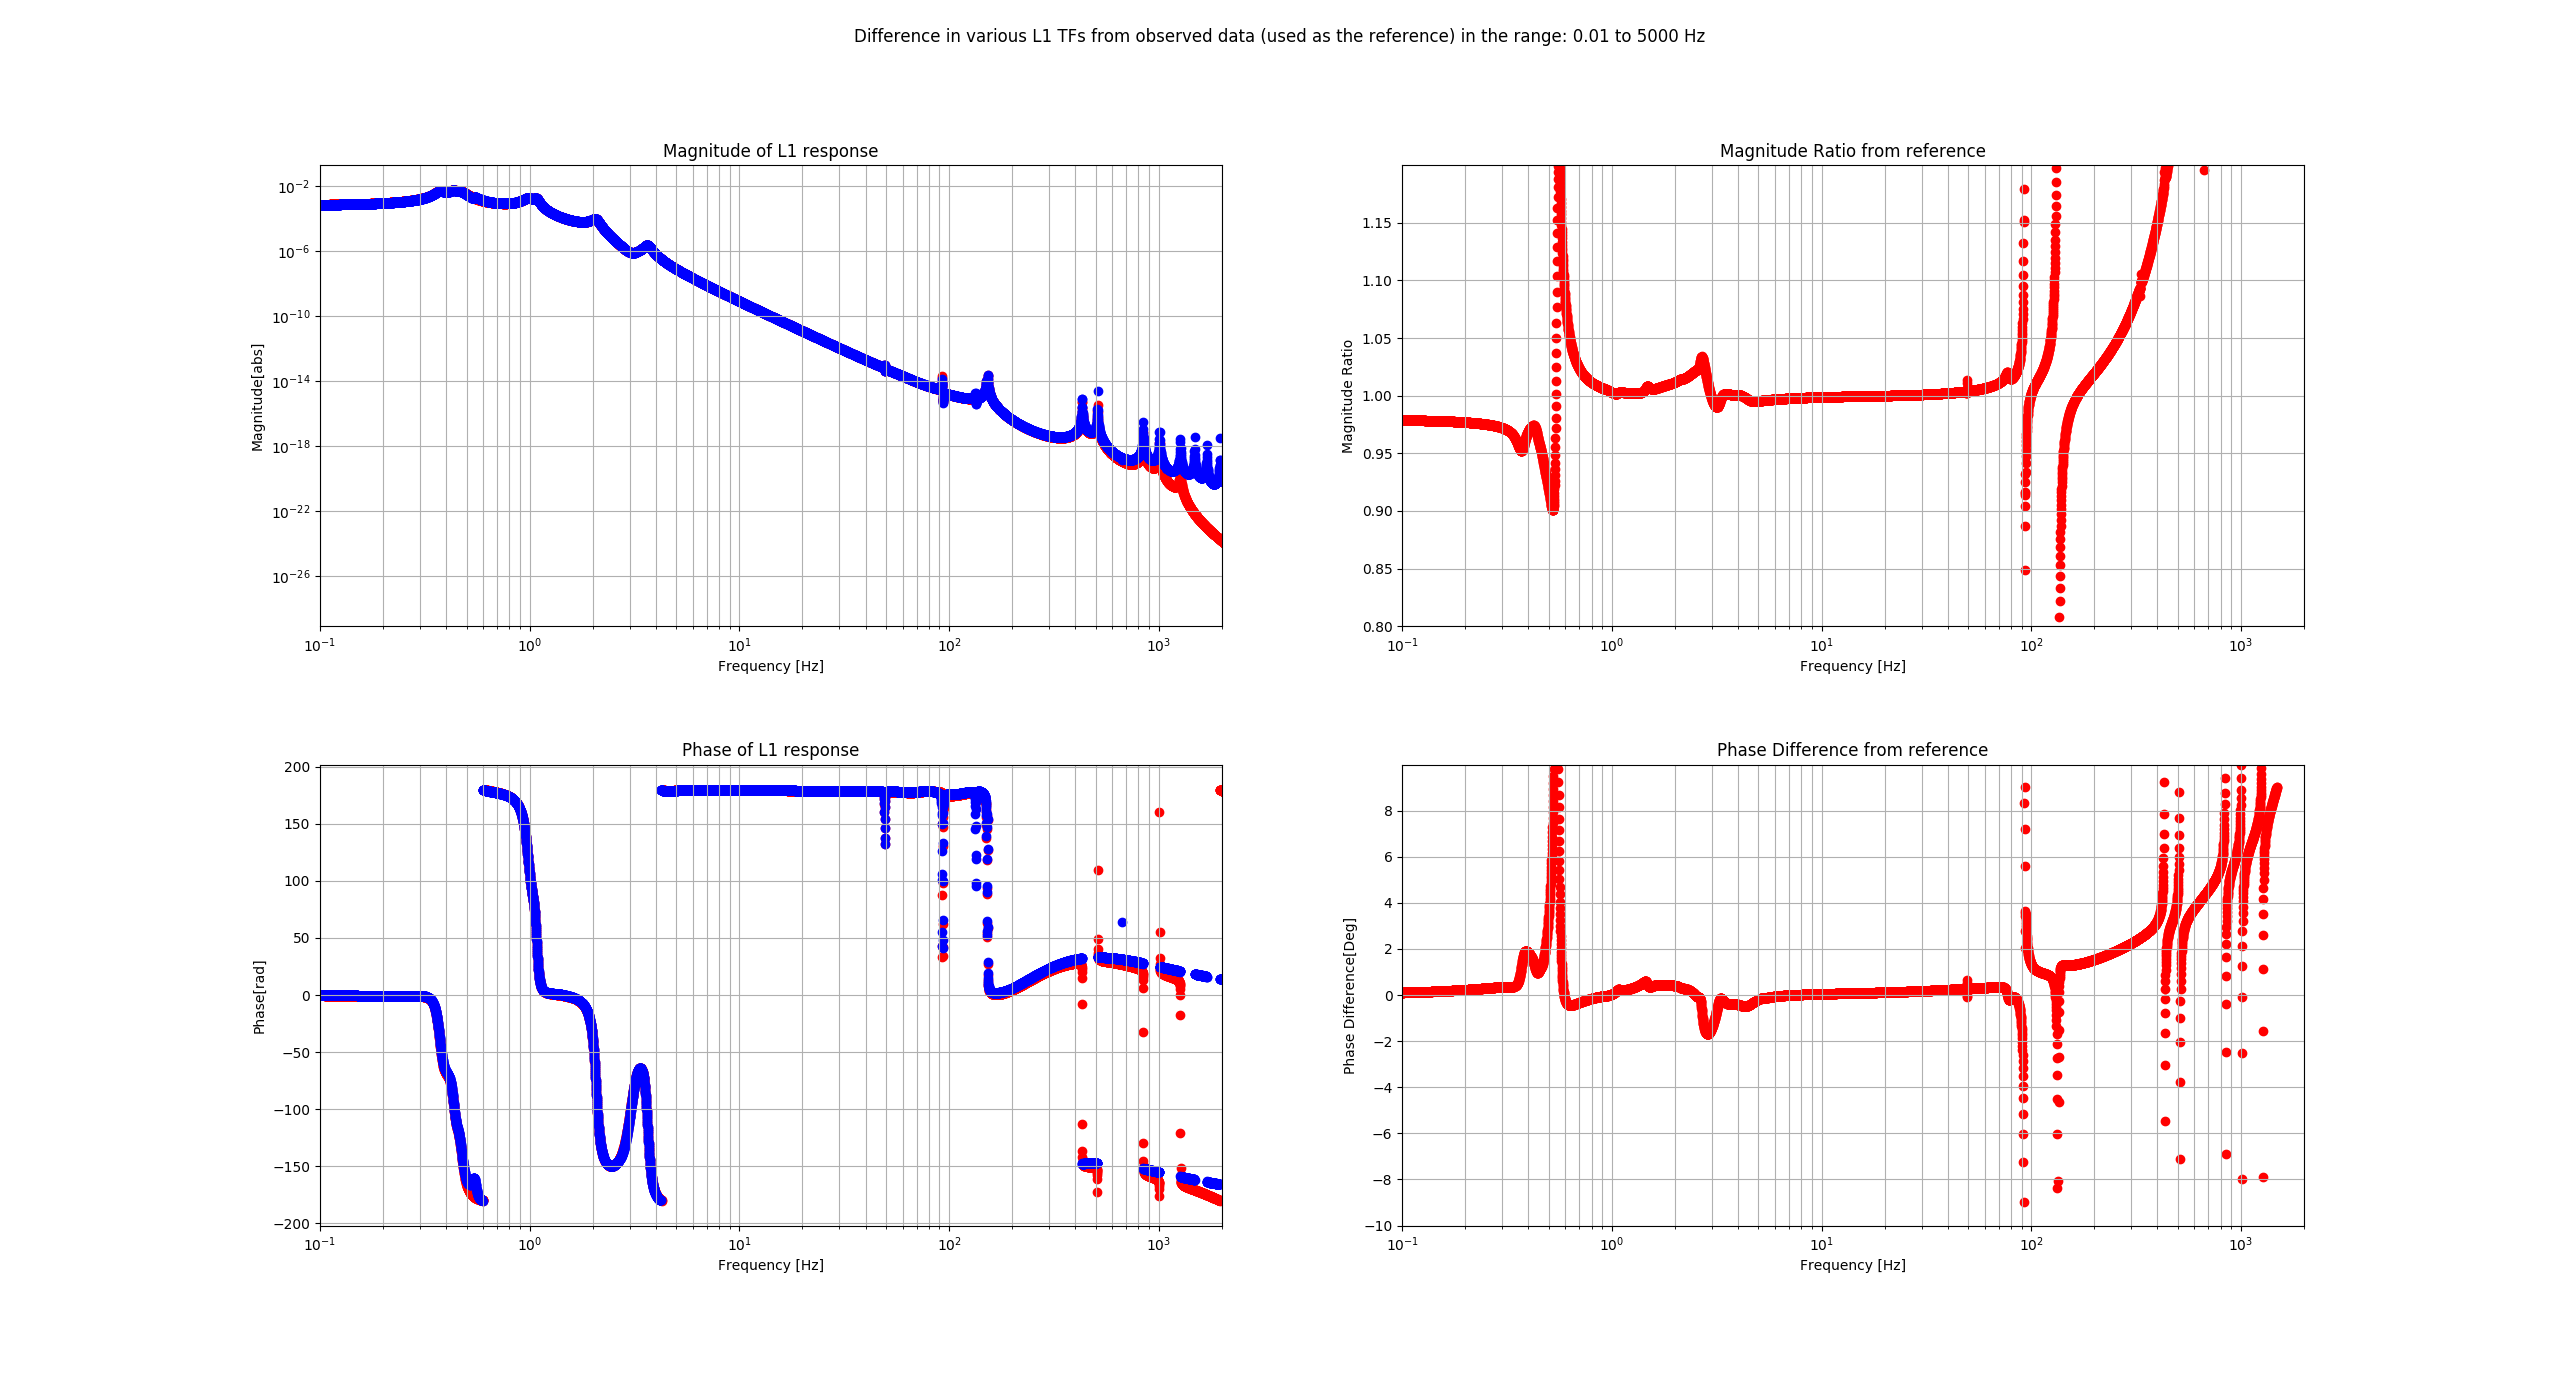
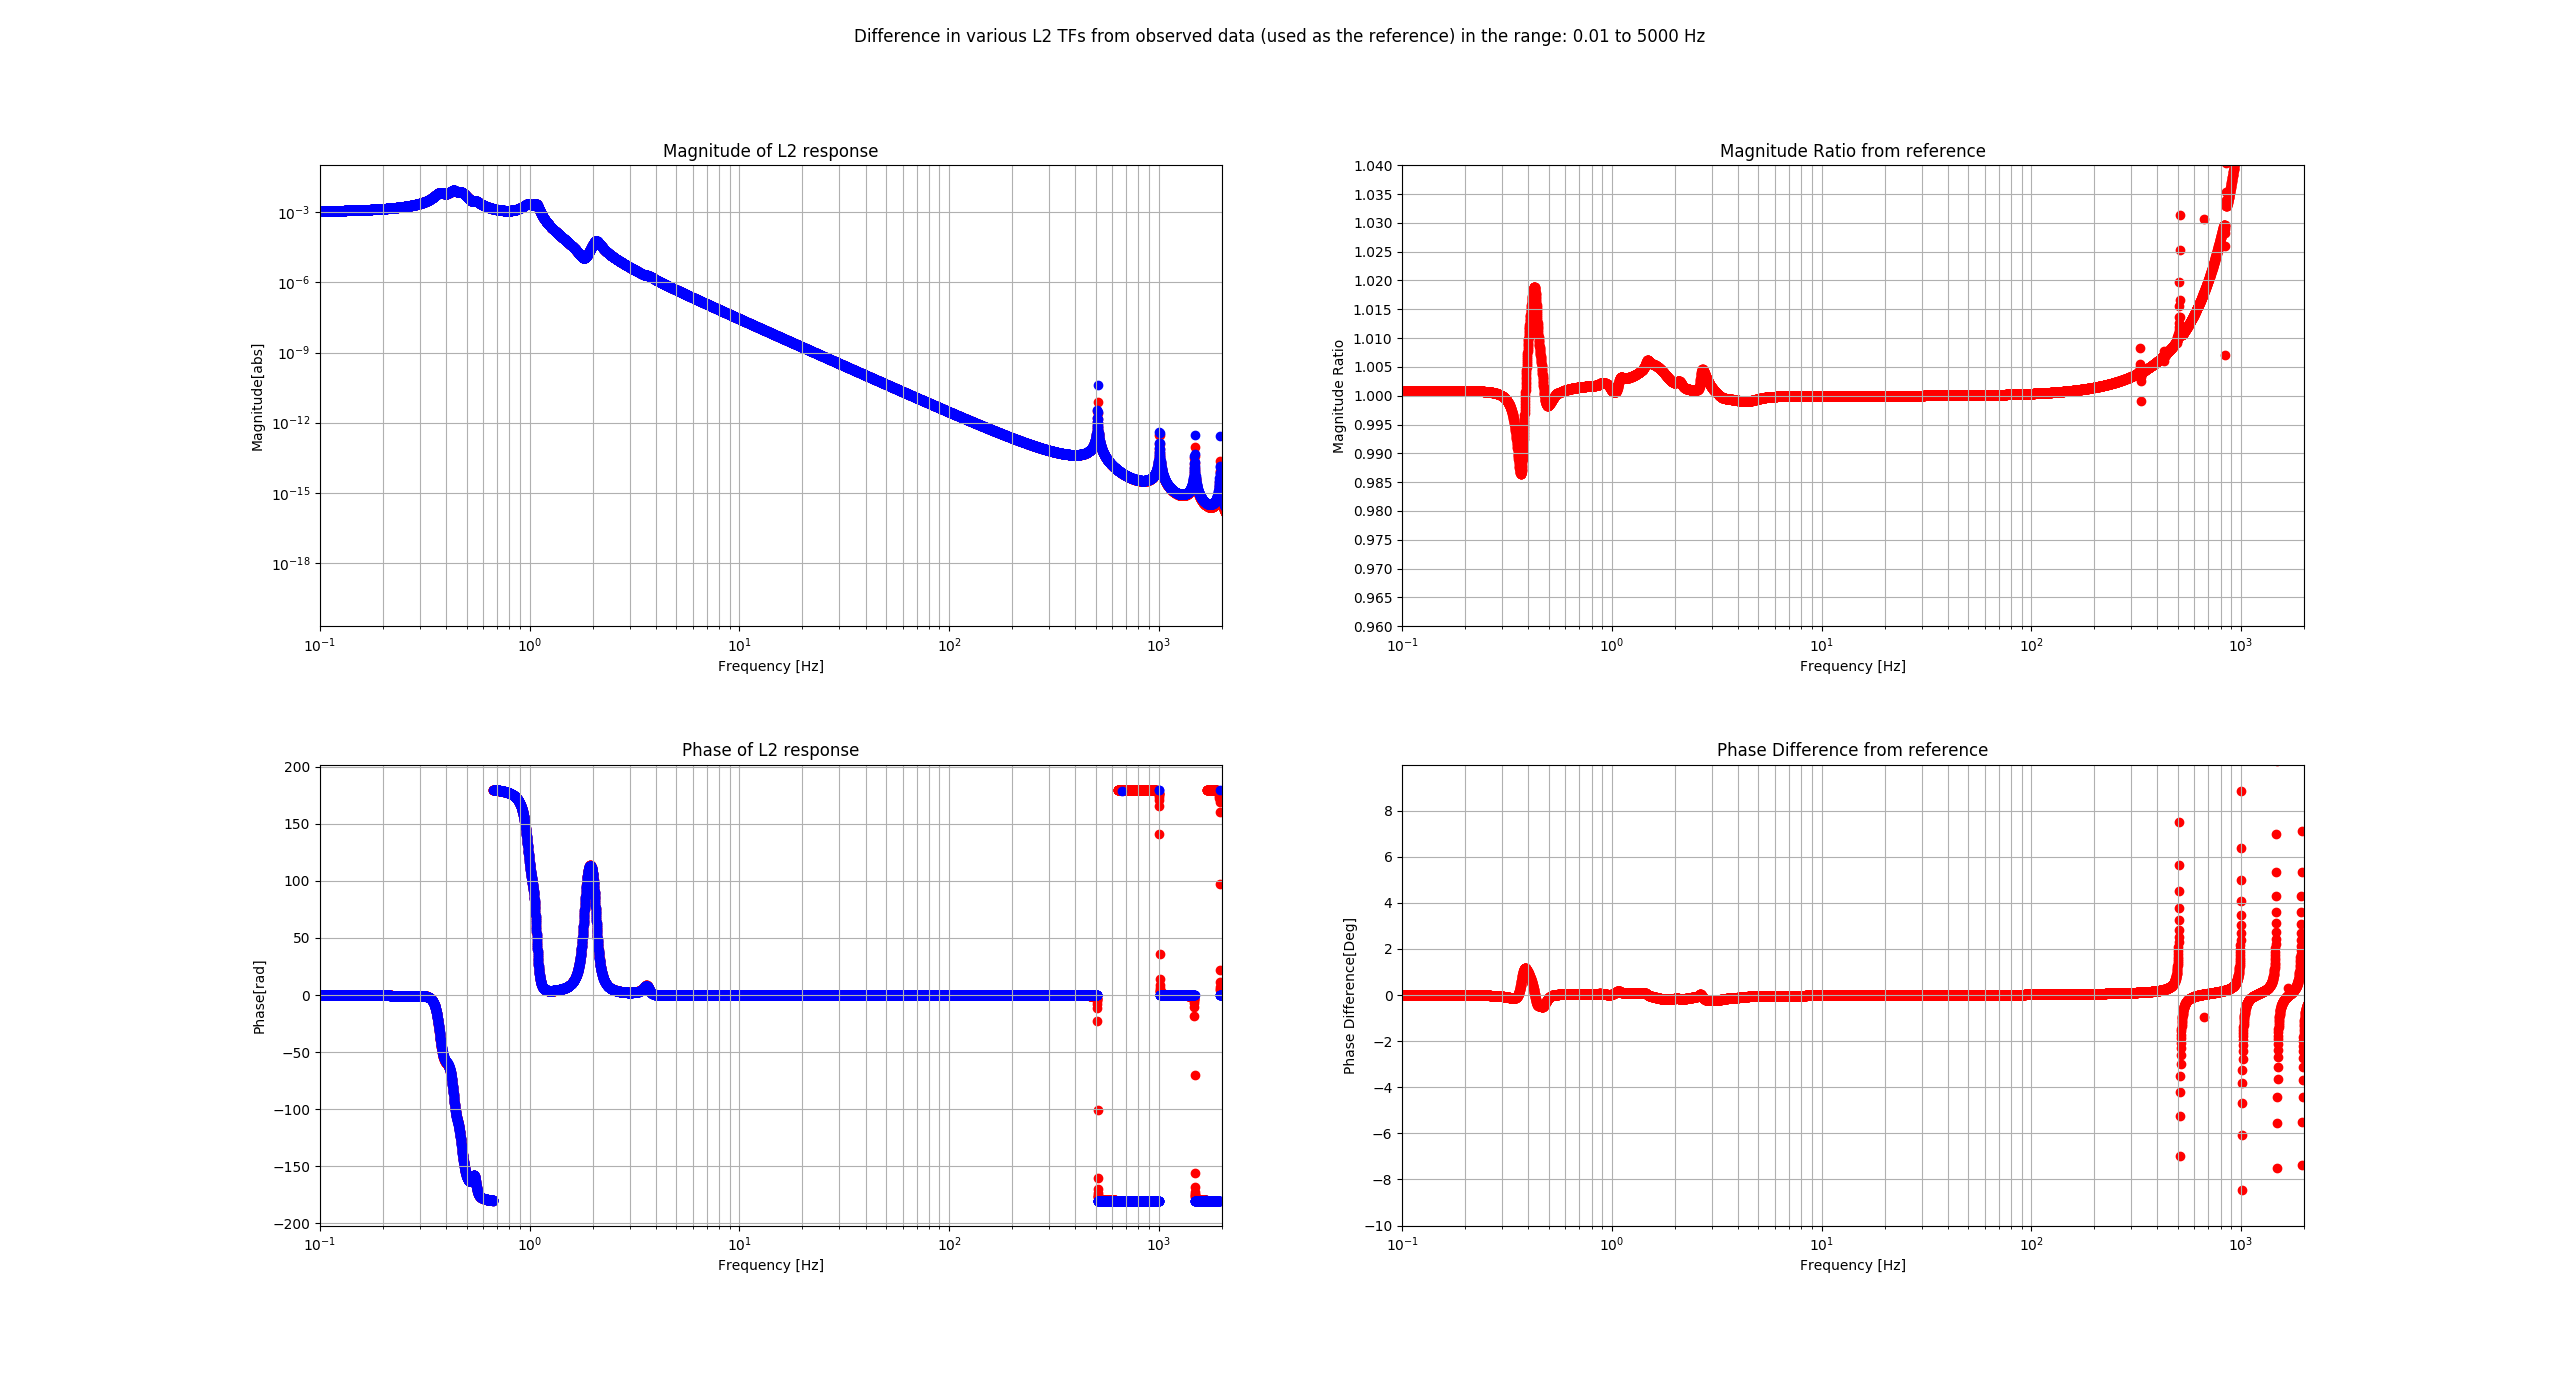
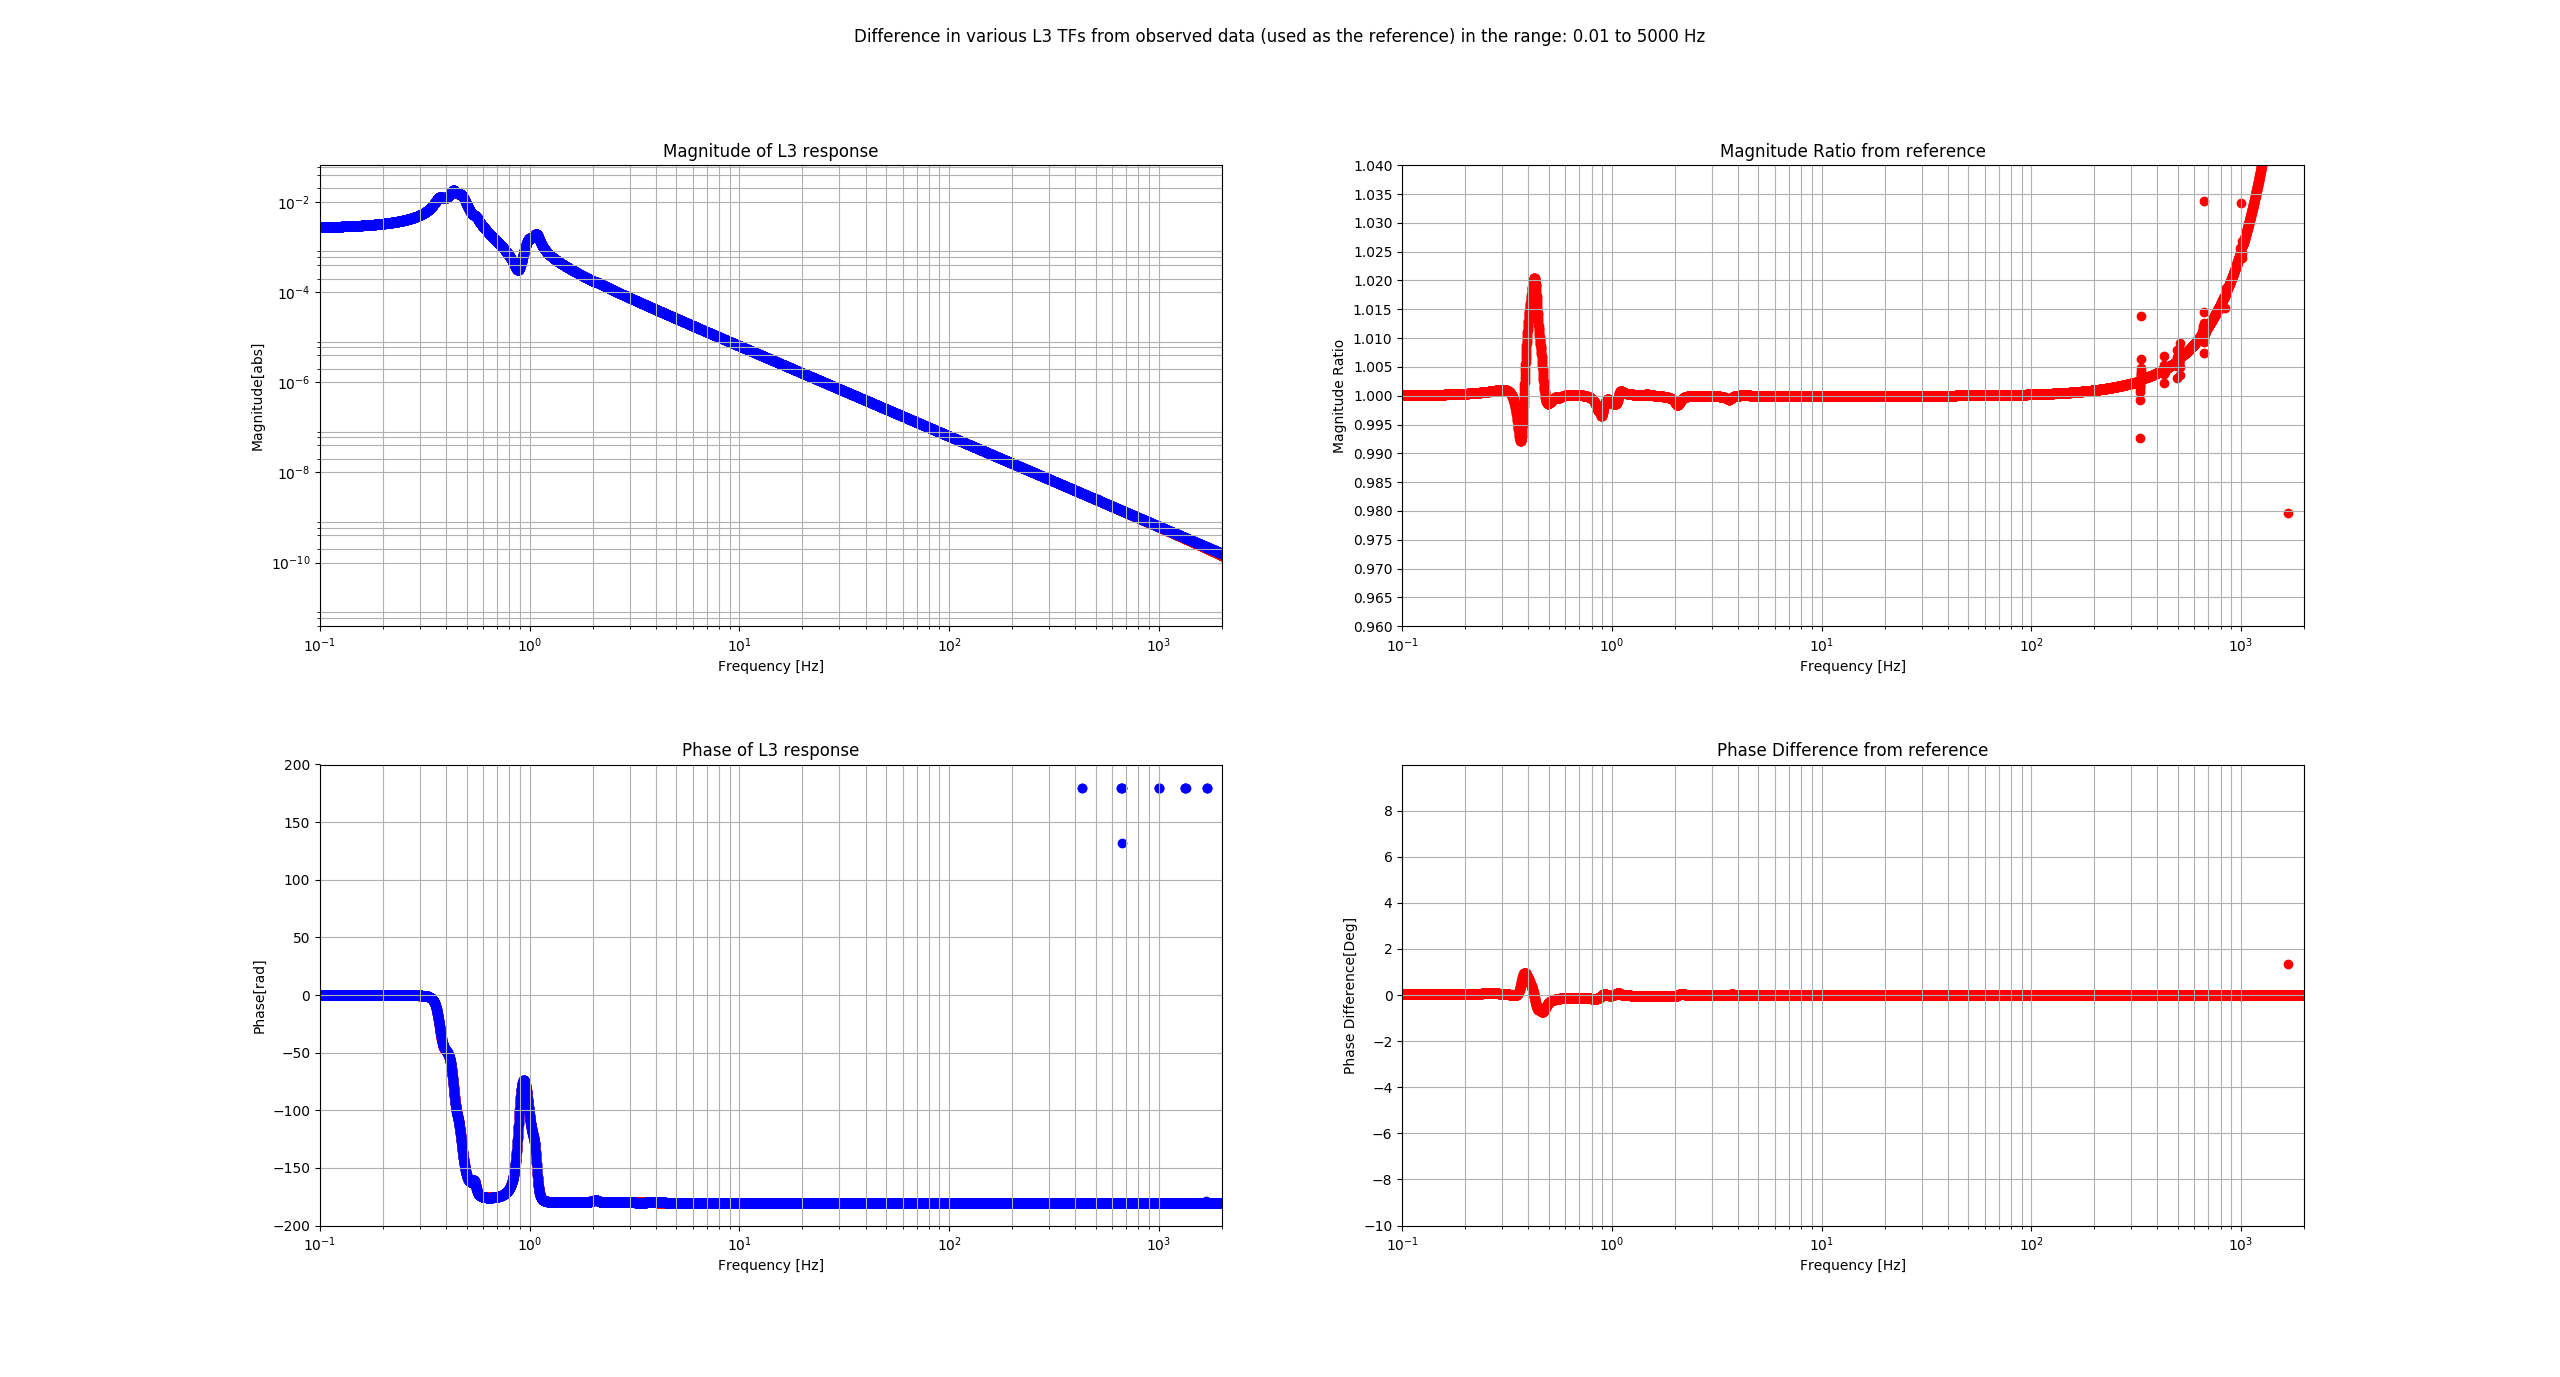
I had plotted this with MATLAB before, but for improved clarity I'll plot the CALCS differences from pyDARM for all stages L1,L2 and L3 (UIM, PUM, TST) L2L transfer functions: so that it is clear where the models are good and bad when we fit these models into the front end filter banks.
The most drastically different is the L1 stage (which the comment preceeding this claims to be a pretty close fit to observed data). You can see the effect of the removal of a vast amount of poles and zeroes from the TF impacting the low frequency, as well as the two missing features at 90 Hz and 134 Hz, also visible in the previous comment.
At high frequency, gain and phase difference comes about from the fact that the front end model is a discrete model (with a sample rate of 16384) and hence has a Nyquist frequency around 8kHz, so what you see is the contributing fraction of that coming into lower frequencies.
Remake the "contributions to R" plot, using the new 20200103 parameter file.
Now that the paramter file is all its detail about it updated, the previous estimates to the contribution of that 152 Hz feature to the response can be more accurately modelled.
Where I previously said that the contribution was about 8.5%, it is clear that it is closer to 7%.
Make the "final" version of R_foton_new / R_foton_old plot.
With the parameter file update fully, this plot also changes from the one I plotted previously.
This plot is generated by:
This was the expected change in DELTALEXT/PCAL. The actual observed change was here,with further discussion.
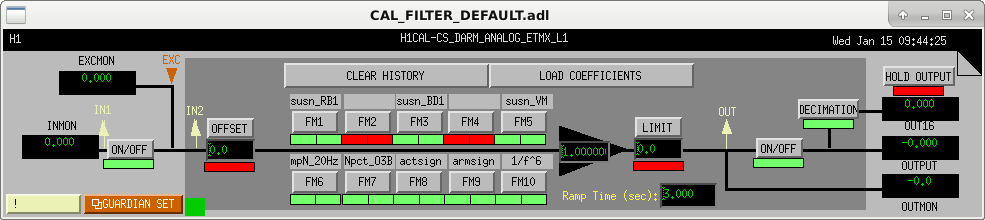
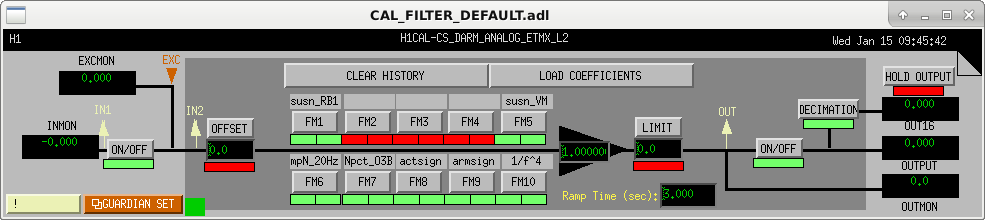
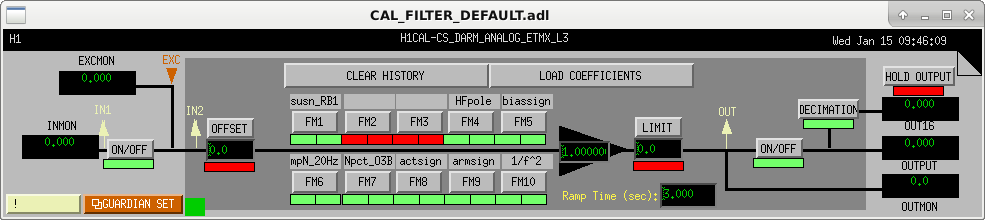
The H1CALCS filter banks were rearranged to make more sense and to make it obvious that there is plently of room to add more filter bank blocks that would do an even *better* job of representing the full transfer functions in the front end.
Attached are the images so that you can see how things are arranged. Below I define what the abbreviations mean:
minor clarification on the biassign, in the above comment, since I was in a rush and not thinking: its the bias on the ESD drive for actuation on the TST stage
To find the code to generate the figures in this alog, consult the following directory:
/ligo/home/vladimir.bossilkov/Work_Done/20200111_calibration_checks
Also as a backup I've included the files from this directory as an attachment. I had to omitted the very densely evaluated transfer function from foton that was used to produce plots in the first set of figures, because it makes the attachment too large. You can probably use ETMX_L1 new and old files used in the second set of files without much error.
While writing the O3A cal paper, I made a comparison plot showing the UIM contributions in 0909 O3A, and the 0909 O3A model with O3B SUS data (trunk/Common/pyDARM/matlab_scripts/20200107_H1_EX_O3_susdata.mat).
The comparison is show in the attached pdf. The "old UIM" is the actual 0909 model. The "new UIM" is 0909+O3B sus.