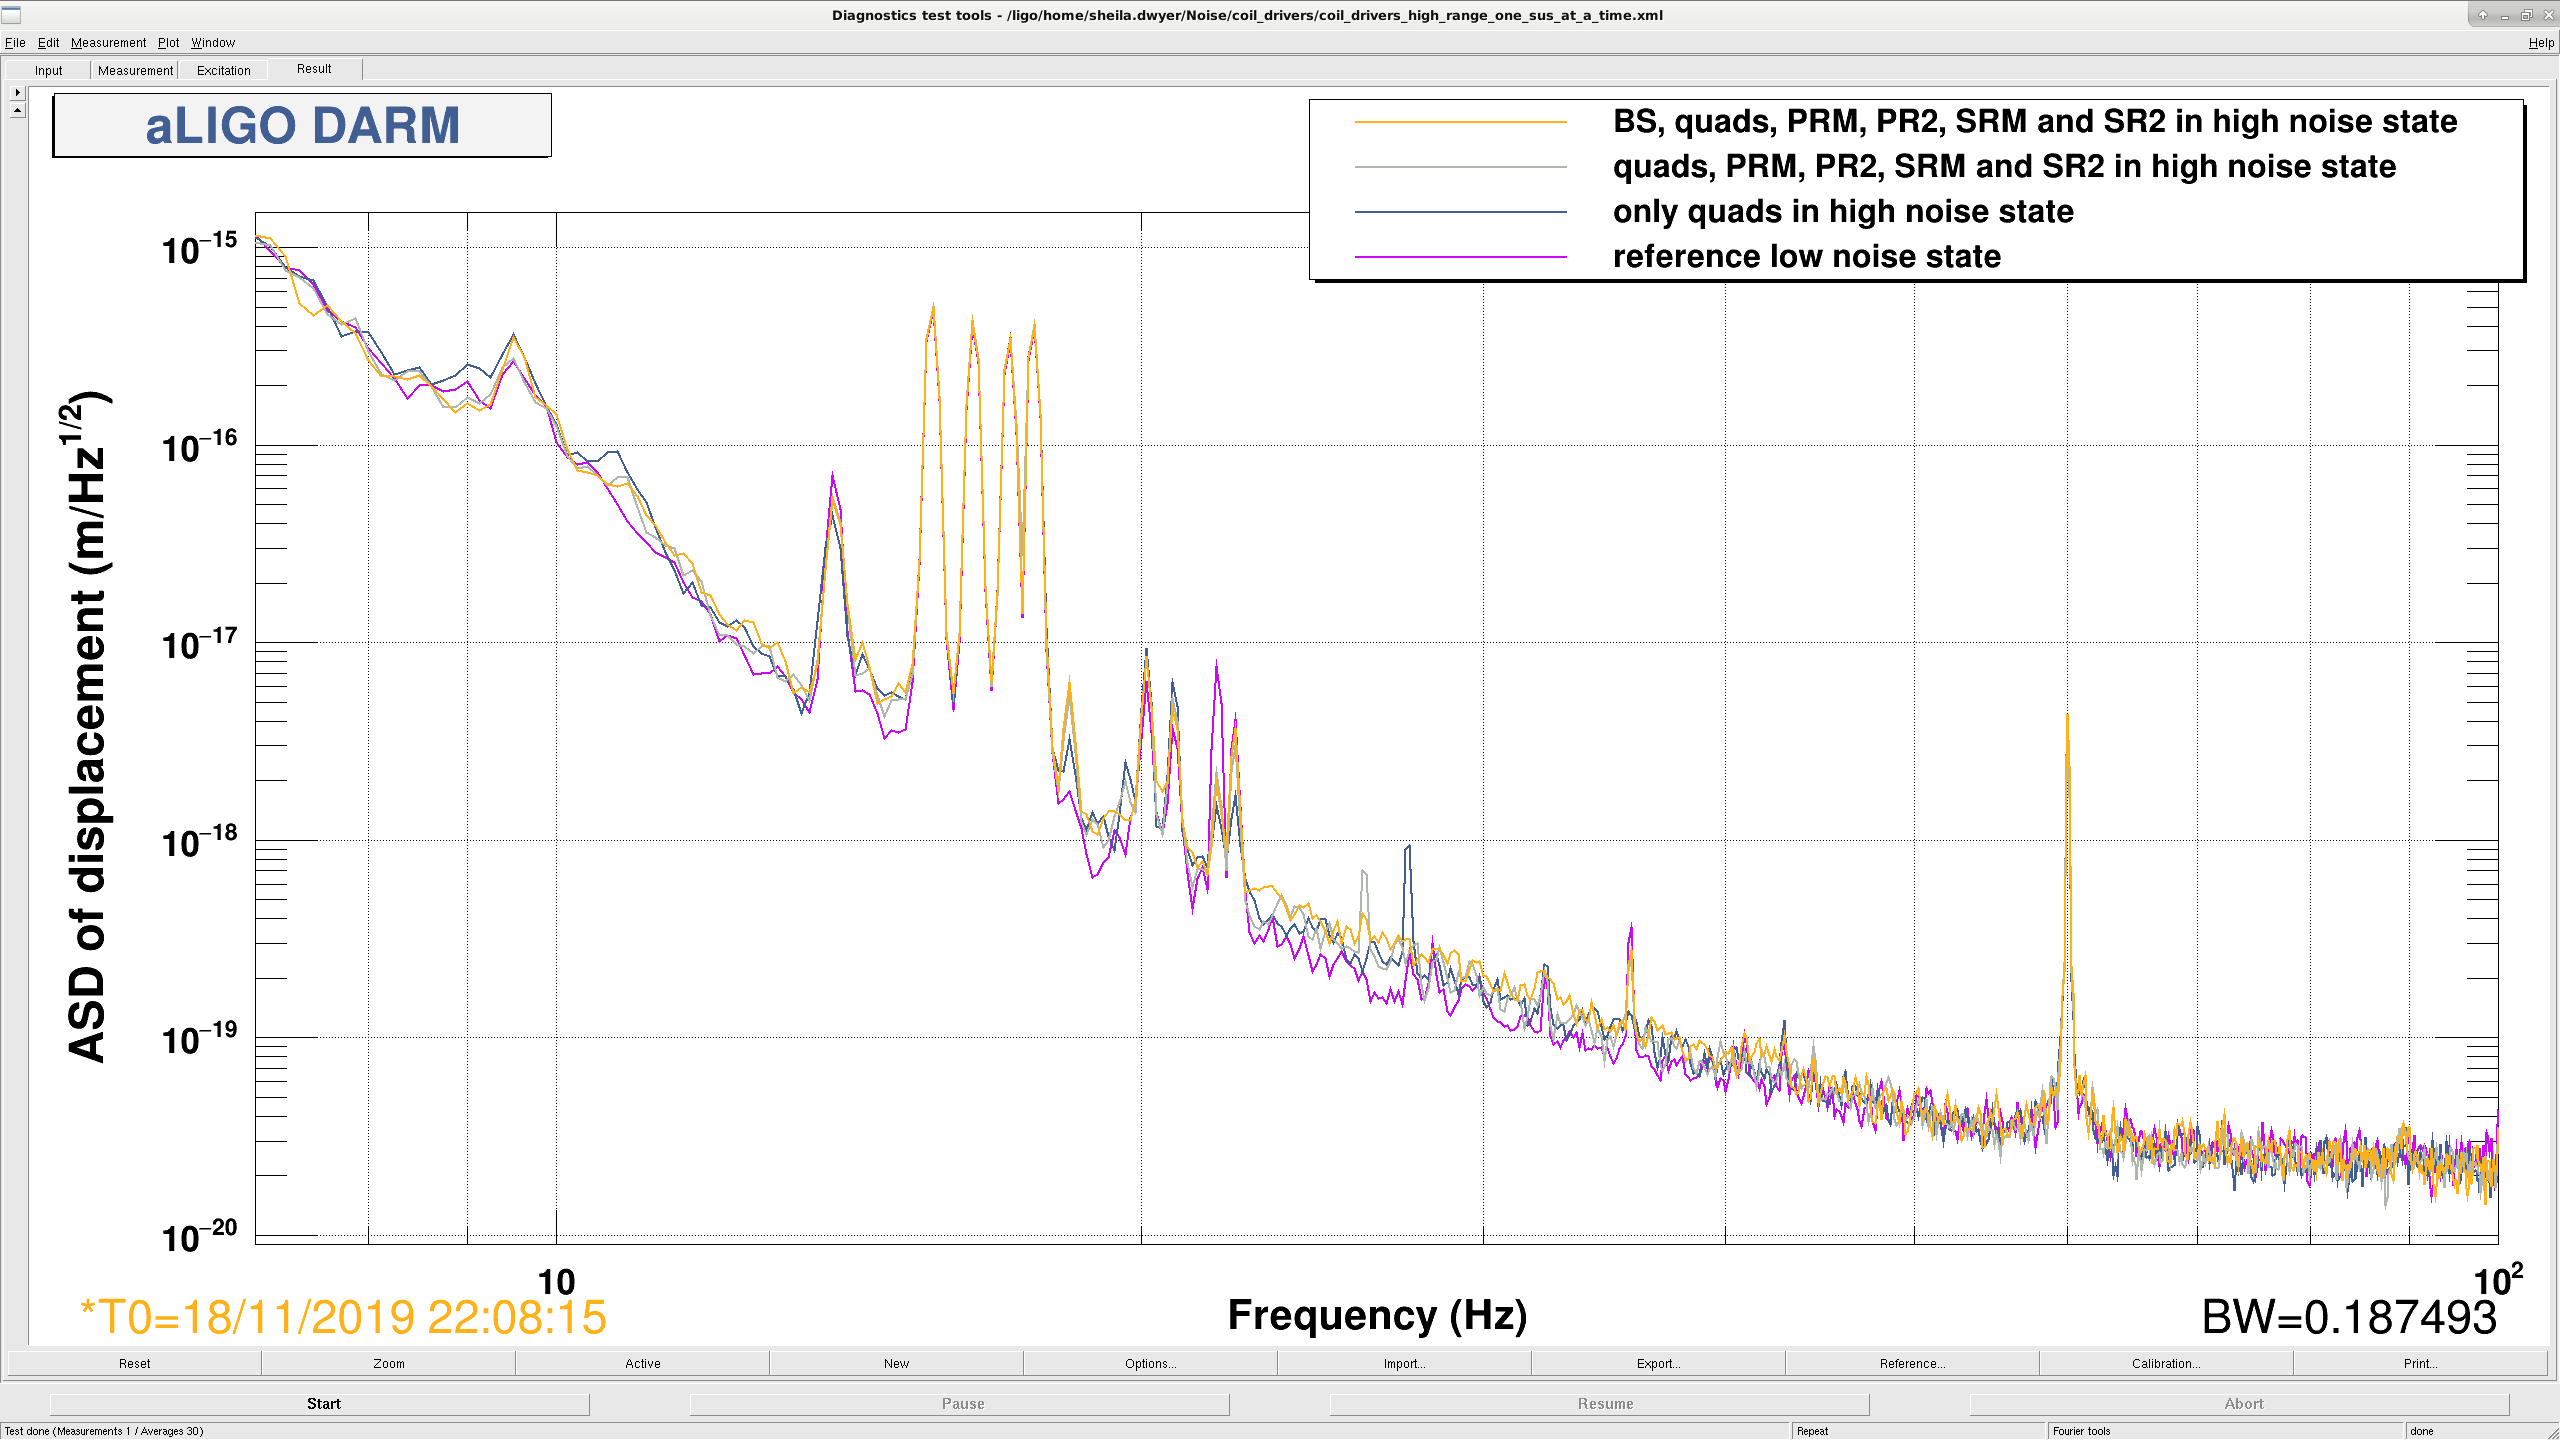
(Gray, Kissel, Thomas)
Per Mainteance Day procedure, SEI_CONF was transitioned to SC_OFF_NOBRSXY. Went back to WINDY a little early 11:42amPDT. Noticed the SEI_CONF guardian node was transitioning in/out of being in a green NOMINAL state. Looked upstream and saw that the ETMx ST1 node was also not GREEN in its NOMINAL State. This eventually had us look at BRS (on Patrick's suggestion), and then Jeff brought up the BRS Health ndscope and noticed odd behavior (i.e. weird "heart beat" behavior for the BRS EX INMON signal is shown in the top plot in the attached plots).
To help correct the situation, we took SEI_CONF to WINDY_NO_BRSX. Jeff hit the DISABLE button for BRSx. And then we monitored the BRS Health ndscope. After DISABLING the damping, the INMON signal changed to a more normal-looking oscillation (vs. the heart beat). We then monitored for awhile; the resonant frequency for BRS is in the millihertz range, so it takes on the order of minutes to see an oscillation or two.
Will continue monitoring and see how we should operate BRSx post-Maintenance.
With SEI_CONF still in the WINDY_NOBRSX state, we re-ENABLED the damping for BRSx. You can see it looked big for part of a cycle (I almost DISABLED!), but luckily after a cycle or two, the INMON BRSx signal (orange) damped out pretty well.
The attached plots show BRS Health for a few hours and then there is a zoomed in spot of when the damping was re-ENABLED. The time between the two vertical cursors is when we running with no BRSx damping.
Once we had a lockloss, and since BRSx looked nice, I took the SEI_CONF back to the nominal WINDY state.
Between October 18 and 24, 2019, Philippe Nguyen accompanied by Ian Hollows investigated the 2.023695 Hz comb at H1 using a portable magnetometer. It was visible in both the SEIRACK and SUSRACK magnetometers at EY (with the peak amplitude at the SUSRACK being about twice that at the SEIRACK) but it was not seen at EX. One of the slow controls units at EY had its top panel removed so we had a good view of most if not all the LEDs inside. The ones that were blinking seemed to be blinking quite fast (>12 Hz based on slow-mo video), and close enough in frequency to each other that there was no obvious 2 Hz beating between any pair. We made numerous measurements around the area and found that the comb was stronger when measuring the middle of the three slow controls units than when measuring any other unit in the area (including top and bottom slow controls). The comb was even stronger when measuring the power strip shared by the three slow controls units, compared with measuring near the units or near other power strips. The ranking of comb amplitudes, from strongest to weakest was as follows: 1) Slow controls power strip 2) RF oscillator power strip (right above slow controls power strip) 3) ISC rack power supply (on top of the rack) 3) Slow controls middle unit 4) Slow controls top/bottom units 5) Adjacent racks (TCS/PEM and SUS-C2) 6) Furthest racks (SEI and SUS-C1) It seemed as if the comb was coming from all three slow controls units. The slow controls power strip does not lead to the power supply that powers the RF oscillators. The comb briefly disappeared on the morning of October 22, 2019, which coincided with the removal of the entire illuminator chassis from its rack. On October 29, the illuminator chassis was powered off as a test between 09:24-09:50 PDT but the comb was still there. Considering that, and that the comb was present during the May 21, 2019, illuminator failure, we now suspect it only disappears when the entire chassis is removed from the rack. A portable magnetometer was left in operation by the EY SUSRACK. The illuminator chassis was isolated on October 12 and we are currently checking the magnetometer records to identify whether the comb was still present.
WP 8466
Power supply at EX was close to maxing out on its current output. New Kepco power supply has a 20 amp load rating. Effected electronics include SUS high voltge interlock, NCAL computer, Illuminator Chassis, HEPI Pump Controls, PD Baffle Amplifier Chassis ect. All systems seem to have come back without any issues.
We also took the oppurtunity to power the HWS Sled Driver from the illuminator chassis to allow the driver to be remotely enabled/disabled.
F. Clara, M. Pirello
8:11 am (local): valved out compressor-fed IA and valved in new N2 bottle to LVEA (2550 psig full).
8:46 am: While bottle regulator read 82 psig, I valved out all four GV actuator pistons, after maximizing their supply pressure (all but GV7 at 78-80 psig), and then leak checked the IA line in LVEA using SNOOP. Found seven leaks and marked them with orange duct tape:
For the morning, I've left the four GV actuators valved out to monitor bottle consumption. GV7 might start to sag because of its big leaks and limit of 60 psig. As of 10 am, there was no measureable loss at bottle, but the regulator fell from 82 psig to 71 psig.
In order to fix these leaks, we will need to close valves. Or we may end up buying a different air compressor rated for low noise.
1405 hrs. local
Bottle pressure @ 2500 + smidge -> valved-out bottle, valved-in compressors, GV8,5 and 6 pneumatic pistons
Requested as part of Filiberto's work.
I reset both PSL power watchdogs at 17:36 UTC (9:46 PST). This completes FAMIS 10737.
WP 8469 Updated to change the alarm limits for the ion pumps on CP1 and CP2. For torr the new limits are: High: 0.0001 Low: 1.0E-10 For the log of the ion current the new limits are: High: 1.4900 Low: -4.9000 For the ion current the new limits are: High: 30.9009 Low: 1.2588E-5 Burtrestored to 6am this morning. Ran /ligo/home/vacuum/alarm_set.bsh. The high voltage at HAM6 did not trip off because it is currently latched on the ion pump instead of the gauge.
The primary and redundant calibration pipelines on the DMT machines were restarted at GPS time 1258216712. The only change with this restart was a configuration change that will allow the calibration pipeline to fill in any missing raw data using the real-time clock. This should prevent the calibration pipeline from falling behind and acquiring a large (minutes or hours) latency if/when there is a large raw data dropout. However, we have seen that the recent problem with increasing latency (~15 s) is not resolved by this. We are still investigating the issue.
TITLE: 11/19 Owl Shift: 08:00-16:00 UTC (00:00-08:00 PST), all times posted in UTC
STATE of H1: Preventive Maintenance
INCOMING OPERATOR: Corey
SHIFT SUMMARY: locked in Observe
LOG:
TITLE: 11/19 Day Shift: 16:00-00:00 UTC (08:00-16:00 PST), all times posted in UTC
STATE of H1: Preventive Maintenance
OUTGOING OPERATOR: Cheryl
CURRENT ENVIRONMENT:
SEI_CONF state: WINDY
Wind: 6mph Gusts, 4mph 5min avg
Primary useism: 0.03 μm/s
Secondary useism: 0.26 μm/s
QUICK SUMMARY:
Getting ready for Maintenance! Cheryl's finishing up PEM injection.
Contributions from Vlad, Beverly and many other LHO commissioners.
Full DQ shift: link
Observing 74.9% of the time
Mean observing range ~ 108 Mpc, overall the range varied from 98 to 119 Mpc
High seasonal microseismic activity (~0.5µm) that couples to scattering
Air compressor noise at ~36Hz
Lots of downtime and bad data due to ground motion caused by wind fence installation
Hveto winners: PEM-EX_ADC_0_18_OUT_DQ, ASC-DHARD_Y_OUT_DQ and other channels closely related to these two
Explained by
high microseismic activity producing scattering
ground motion noise caused by wind fence installation
LLO is starting Maintenance now, ~14:20UTC, due to lock loss.
locked in Observe
TITLE: 11/19 Owl Shift: 08:00-16:00 UTC (00:00-08:00 PST), all times posted in UTC
STATE of H1: Observing at 114Mpc
OUTGOING OPERATOR: Ed
CURRENT ENVIRONMENT:
SEI_CONF state: WINDY
Wind: 9mph Gusts, 6mph 5min avg
Primary useism: 0.03 μm/s
Secondary useism: 0.27 μm/s
QUICK SUMMARY: locked in Observe
TITLE: 11/19 Eve Shift: 00:00-08:00 UTC (16:00-00:00 PST), all times posted in UTC
STATE of H1: Observing at 117Mpc
INCOMING OPERATOR: Cheryl
SHIFT SUMMARY:
H1 locked and Observing ~ 9 hrs without incident.
LOG:
Camilla, Sheila
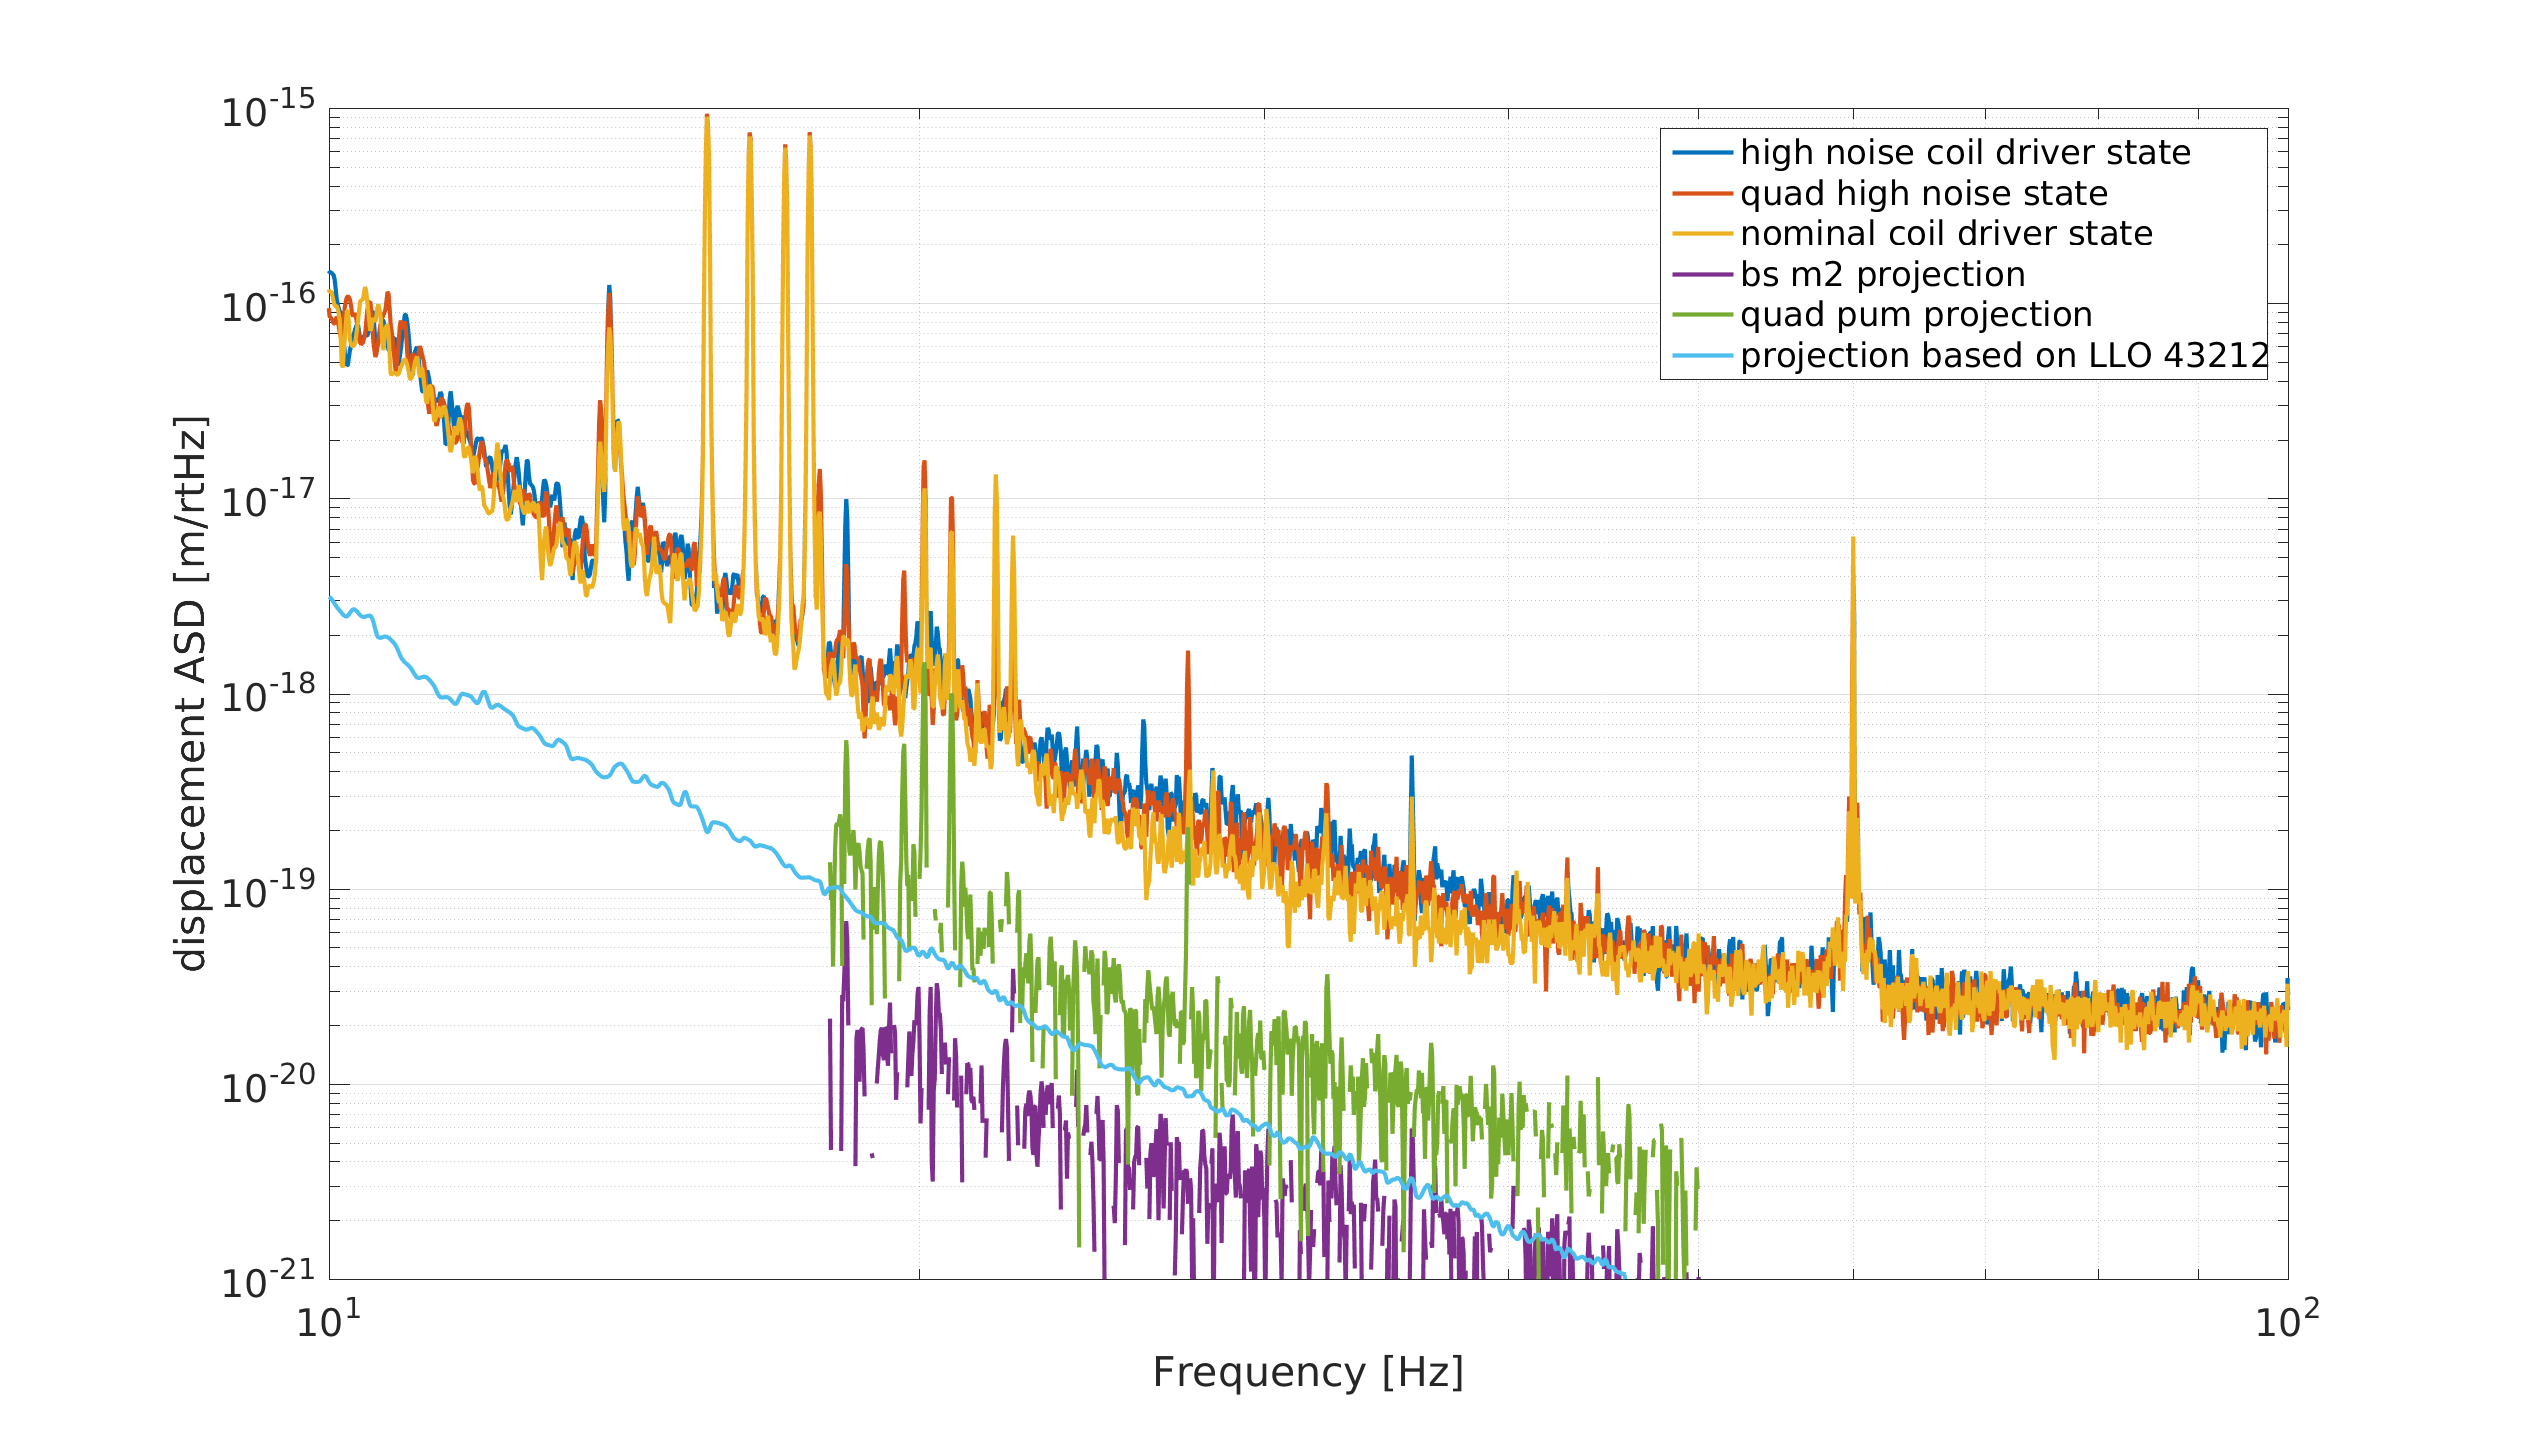
Following up on the high noise coil driver test in 53253, we again locked to the nominal noise state with our coil drivers in high noise and attempted to switch them to the nominal driver state a few suspensions at a time, I caused a lockloss when trying to swtich ETMY coils.
Based on the measurements we did get, the quad pums are the largest contribution to this noise, the beam splitter also makes a measureable but small contribution. The projections in the second attachment are based on difference in the ASDs between different coil states, and assume that the noise scales with the analog filters, which wouldn't be a correct assumption for a drive dependent noise. This is generally about a factor of 2-3 higher than the projection in the noise budget, and is about a factor of 5 below our noise budget residual.
Times:
Conor, Chiara.
There are two issues with the CAL_PRCL M1 Calibration:
1. The integrator doesn't reset, and causes numerical noise after some time. As such we will turn off the <0.01:0> filter module, and the calibration will be correct to approximately 10mHz, and then differ by this response. This removes the need for an AC-coupling filter, and we deleted it.
2. High-frequency noise (reported here: 53160), which we hope to solve by re-ordering the modules in the <H1CALCS_CS_SUM_PRCL_PRM_M1> filter bank.
The changes have been saved to the filter file, and we will load the coefficients tomorrow in maintenance.
So far, this seems to have fixed the issue with the PRCL calibration.
Attached ndscope shows all TMS QPD input segments during a powerup up to our lockloss at Nov 18 2019 22:21:30 UTC.
32000 cts is the maximum our ADCs can output.
Two channels are within 1000 cts of saturating:
H1:ASC-X_TR_B_SEG1_INMON (XB1)
H1:ASC-Y_TR_B_SEG2_INMON (YB2)
This is all consistent with what our PIT YAW outputs are telling us: our QPDs are poorly aligned.
XA XB YA YB
---------------------------------
PIT 0.40 0.54 0.48 0.57
YAW 0.66 0.84 -0.47 -0.71
EDIT: We just locked again and it appears that after some thermalization YB2 is 100% touching the saturation limit. See attachment 2.
ADC overflows for the TMS QPDs YB upper left, XB upper right are overflowing during this lock. These do not seem to have an immediate effect on the interferometer: No locklosses, no immediately apparent glitches [although those might be happening, these QPDs are used for CHARD control]
Looking at whether we can align the TMS at 2 watts and trust it will be well-aligned at 38 watts input (33.5 watts on back of PRM) Seems like yes, we can align red on the TMS QPDs at 2 watts and expect it to be okay for 38 watts, as long as it's after MOVE_SPOTS. During the guardian state MOVE_SPOTS, we adjust the spots on the ITMs and to avoid our point absorbers prior to going to full power. During this stage we move significantly on our TMS QPDs, especially in pitch. Not a lock killer, but enough to saturate a segment once we reach full power. After we've reached full power, the QPD alignment continues to drift but nowhere near as significantly as the MOVE_STOPS change. If we realign the TMS to center on the QPDs after MOVE_SPOTS, I suspect our saturations will go away.
I checked the CHARD error and control signals during a time when the TRX and TRY B QPDs were saturated (now) and not saturated (early in the lock). The CHARD error signal consists of 5 PD signals for pitch, and 6 for yaw. TRY B is not one of those PDs. TRX B is. TRX B's signal is only slightly altered by the single segment saturation. (PDF 2) The normalized sum is falling as the TMS drifts further off this QPD. This causes the NSUM, PIT, and YAW ASDs to all decrease at AC. The saturated segment does not contribute at AC. Basically, our signal from this QPD is falling to zero, decreasing the overall gain of the loop. Ultimately, saturating in TRX B does not produce huge noise effects in CHARD due to the number of PDs contributing to CHARD's error signal, and the fact that TRX B's signal has not completely flatlined due to the other segments still contributing. There is a small increase in noise in pitch from 4 to 8 Hz. See PDF 1. There is effectively no increase in noise in yaw.
Sudarshan K, Ethan P, Rick S
During commissioning time, we excited PCALX and PCALY at 395.1 Hz. This was done in relation to alogs 53244 and 53195. In order to achieve a higher SNR of the cancelling line, we decreased the frequency from 1153.1 Hz to 395.1 Hz. We were limited in decreasing the frequency further by Jenne's MICH, SRCL, etc noise injections. We also increased the amplitude of the excitations from 3619 to 18095 cts in PCALY and 5007 to 25035 cts in PCALX (factor of 5 increase).
We take 15 averages of a 100 s FFT with Hanning windowing and 50% overlap from 1257809856s. Note some issues were encountered in finding a suitable segment for the FFT due to Jenne's injections (some noise reached ~400 Hz).
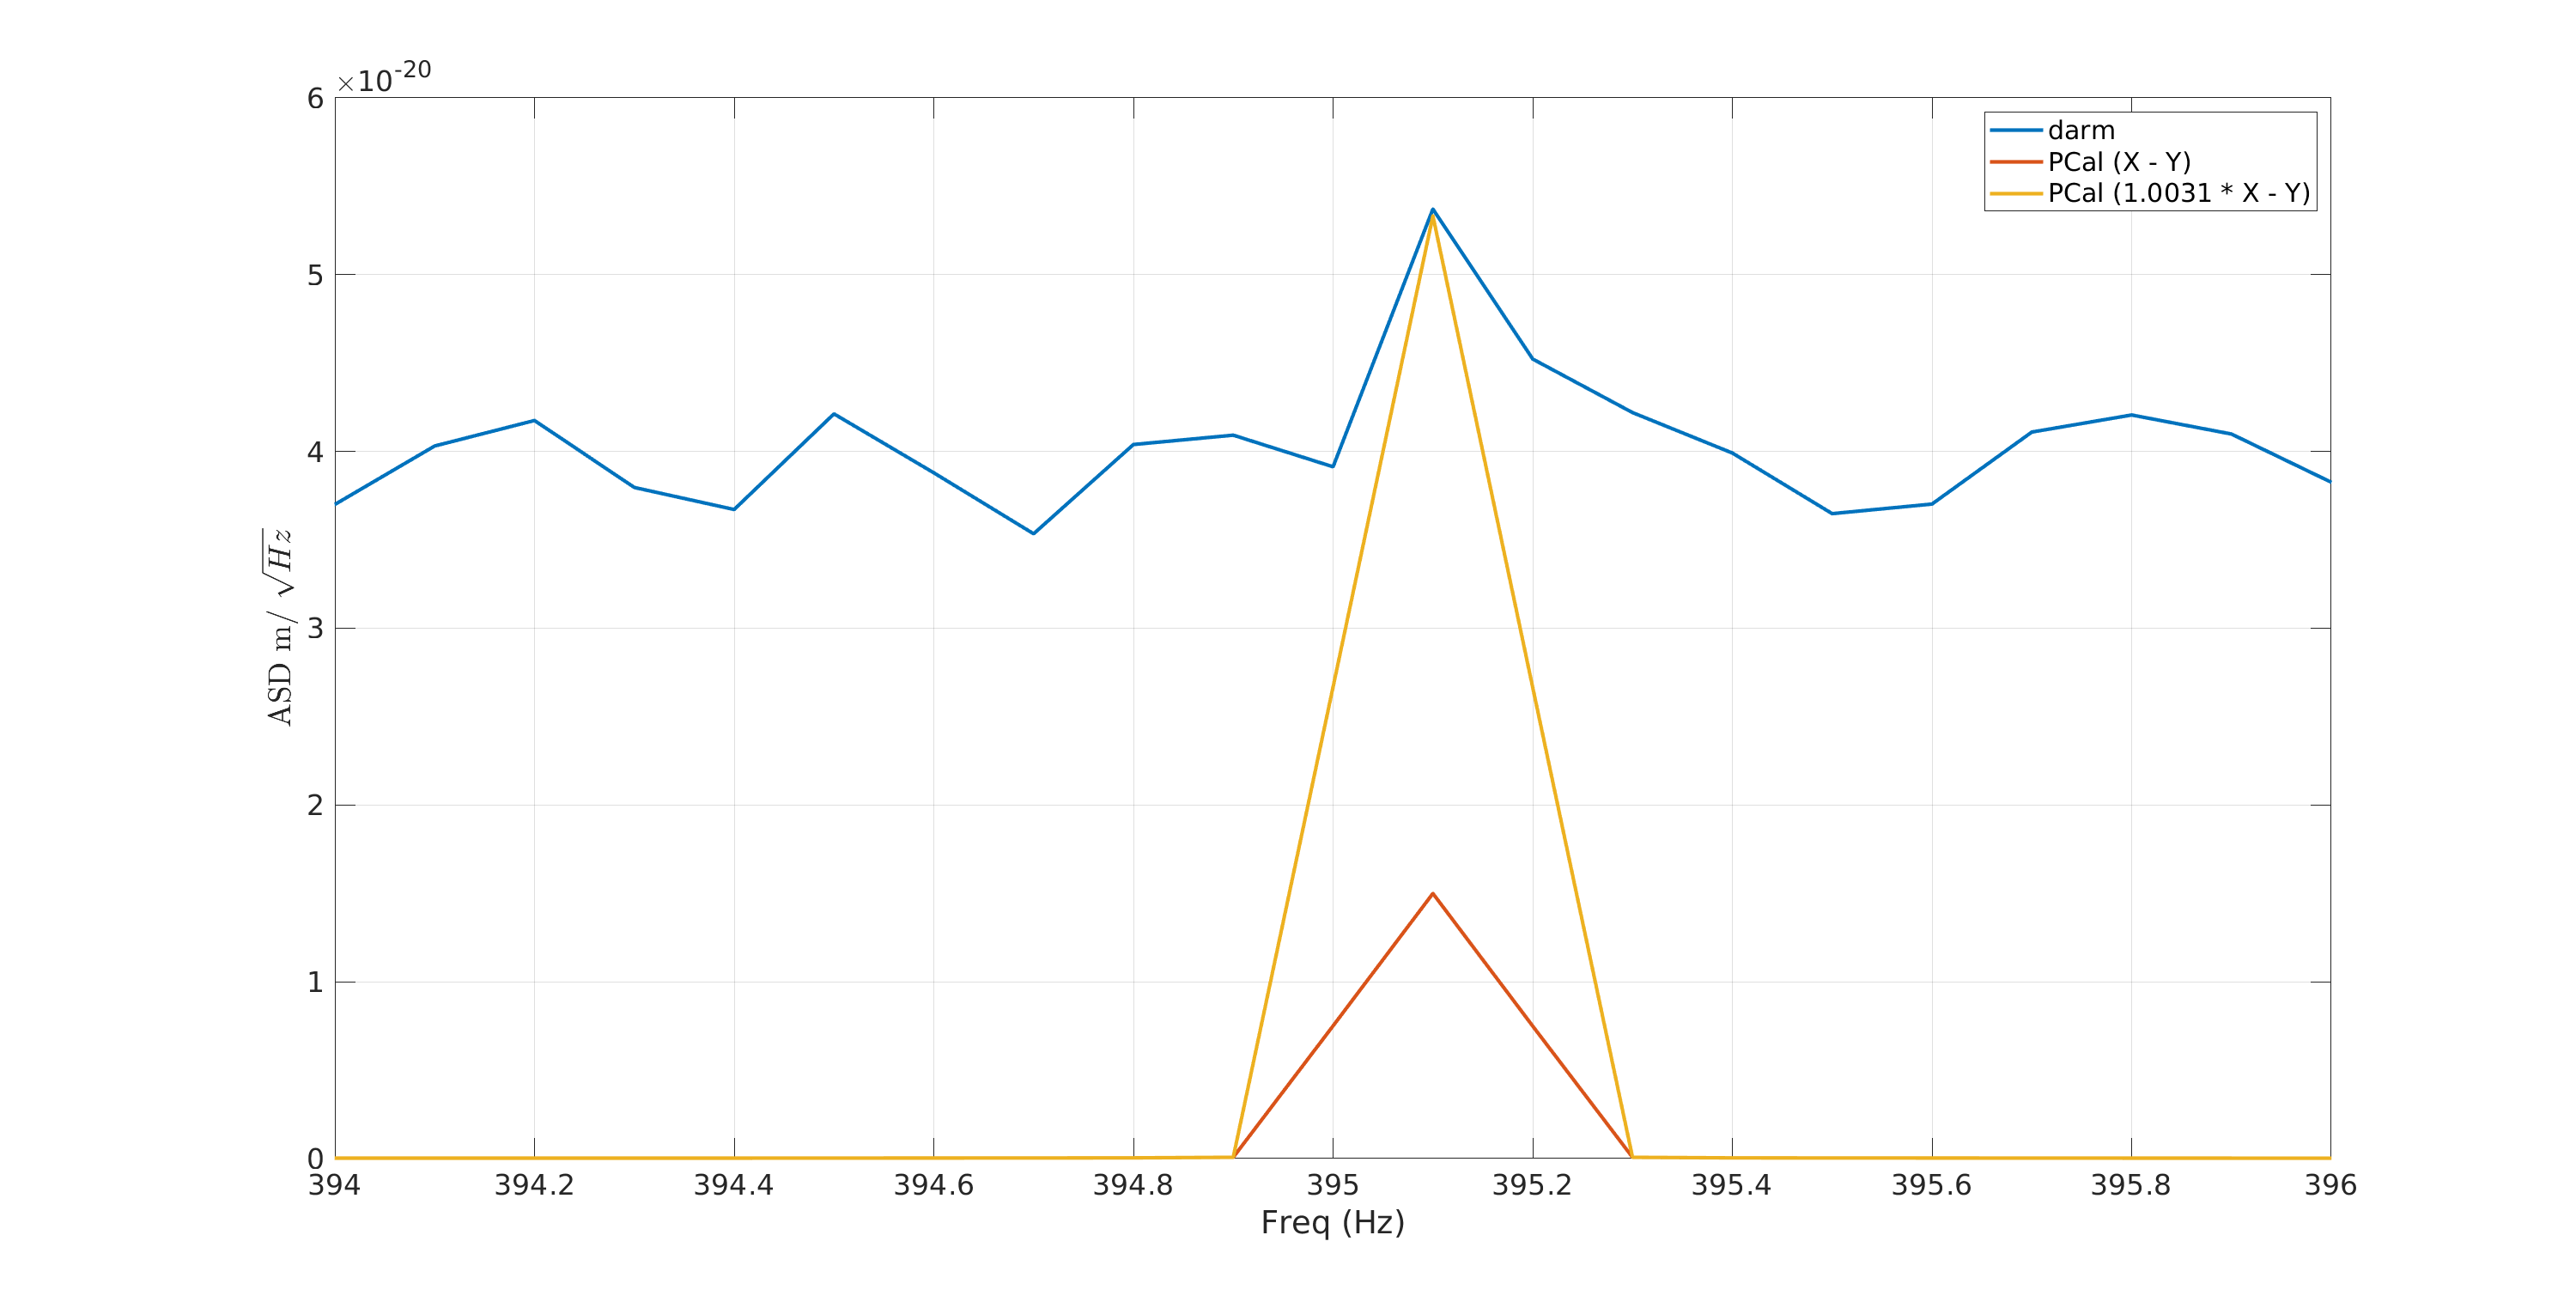
See attached for the amplitude spectral densities. The table contains the measured amplitudes. We see a line within DARM corresponding to a difference in the amplitude of the two PCAL excitations.
| H1:CAL-PCALX_RX_PD_OUT_DQ | 4.47e-17 |
| H1:CAL-PCALY_RX_PD_OUT_DQ | 4.46541e-17 |
| H1:CAL-DELTAL_EXTERNAL_DQ | 1.31147e-19 |
The amplitudes of the excitations driven by the PCALs differ by 0.11% similiar to alog 53244.
However, now we notice a line present in DARM with an ampllitude of 1.31147e-19 m/Hz^1/2. This indicates an error of 0.31% between the endstations. Further work is required on determining whether the 0.11% from the measured discrepancy is in addition to or subtracted from the error observed in DARM.
Attached is a plot showing DARM, X - Y (PCAL) for this time period, zoomed in around 395.1 Hz. In the plot, PCal (X - Y) corresponds to power spectrum of diference of two PCal RX PD signals. We have also plotted the difffence with X-end signal scaled by 1.0031. We see that with the scaling of X-end signal by 1.0031, the X - Y signal agrees with what we see in DARM. The coherence between X - Y and DARM is not that great at this drive frequency, so the associated uncertainty on 0.31% could be large (coherence based estimate provide an uncertainty of 6%). Assuming the line we see in DARM is true to a good accuracy then this suggests either
(i) the absolute power calibation of X-end PD differs from Y-end PD by 0.31% ,
(ii) the force-to-length response of X and Y-end mirrors are off by 0.31% or
(iii) the combination of absolute power calibration and force-to-length response is off by 0.31%.
We note here that since DARM is pegged against Y-end PCal, the difference has to come from the deviatoin of X-end with respect to Y-end. The code used to make this plot is also attached here with.
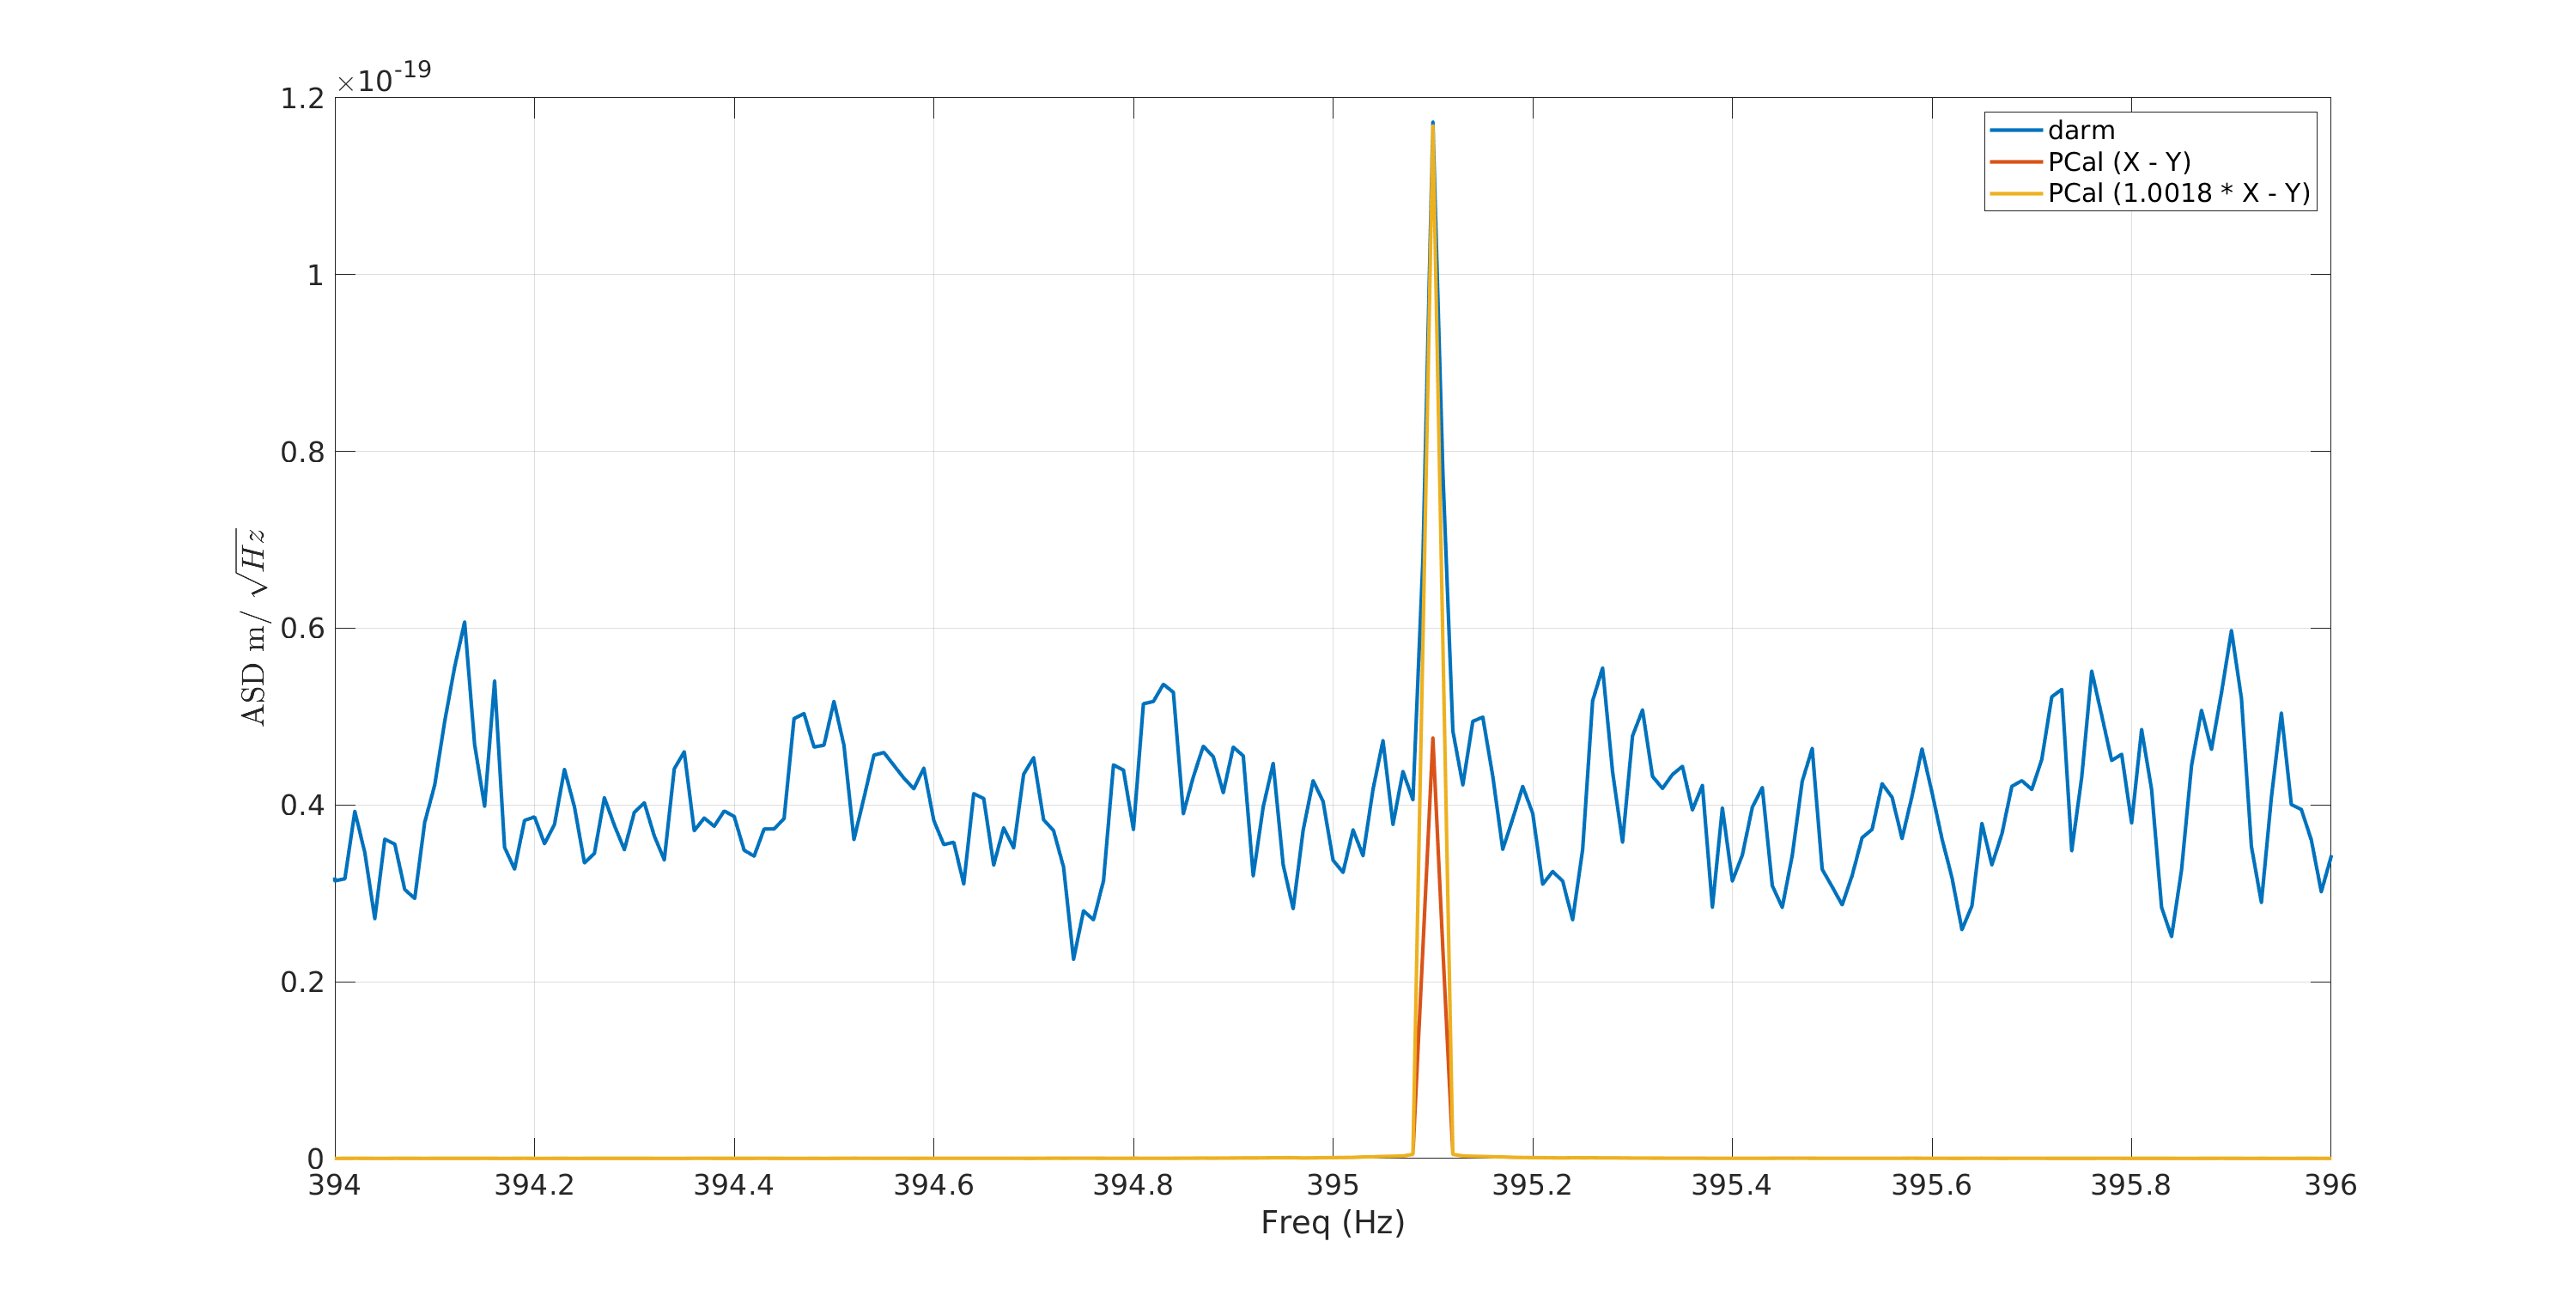
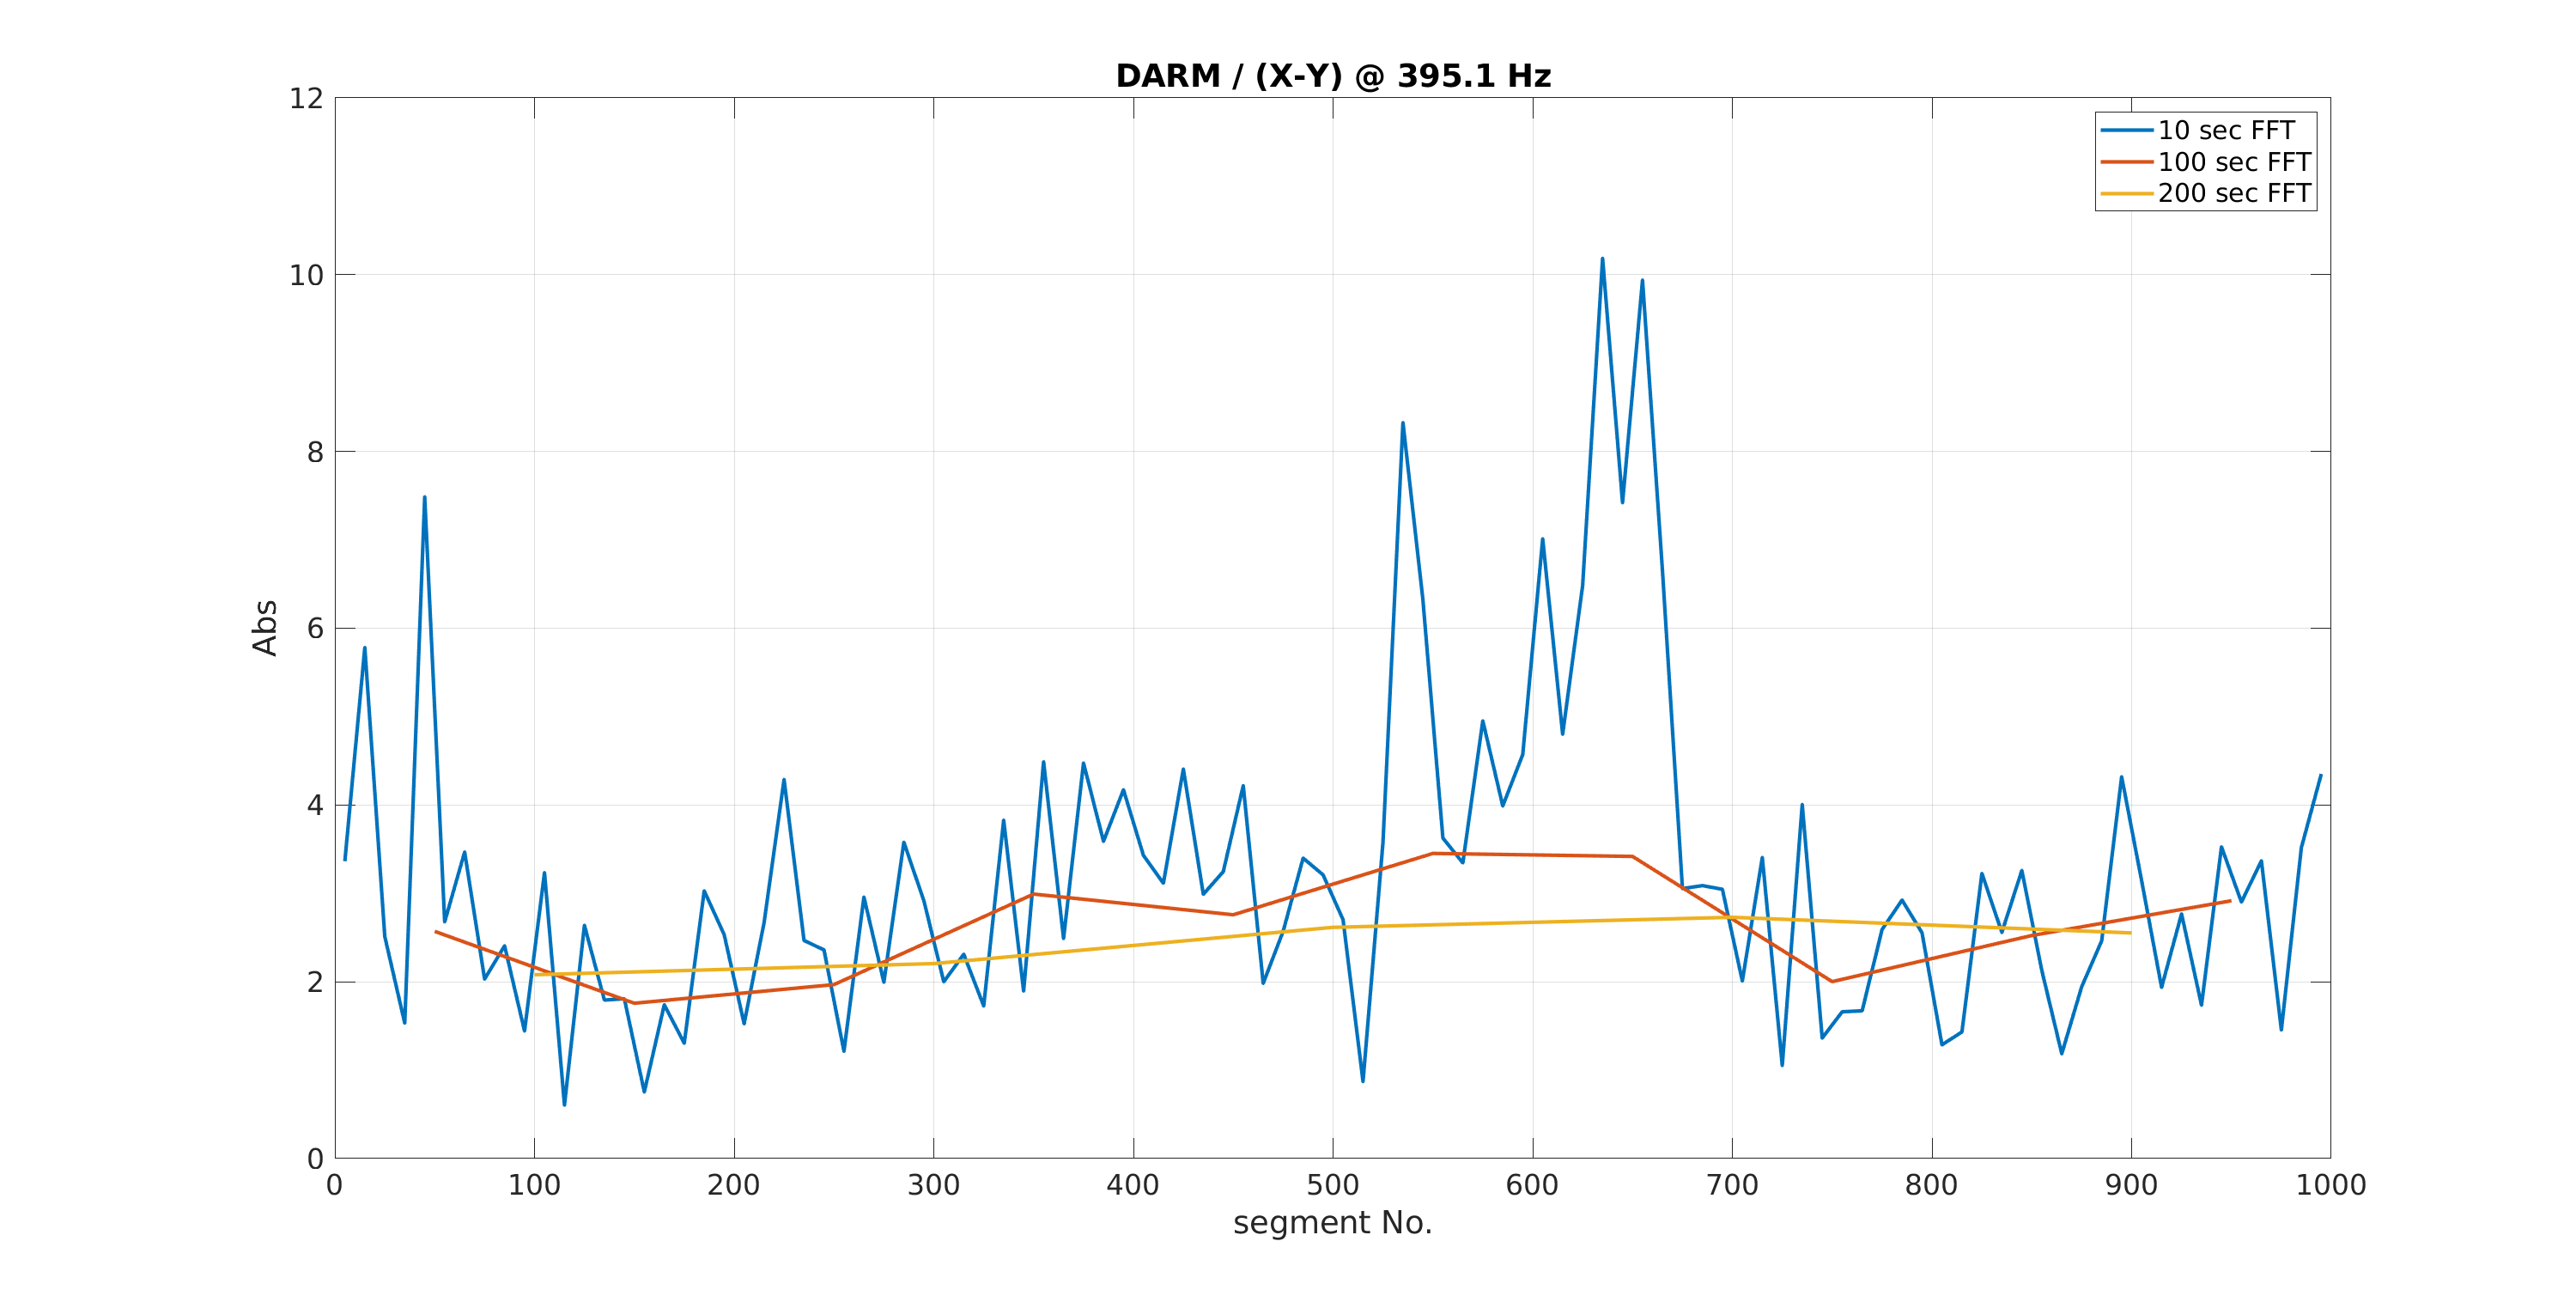
Here I have attached similar plot with better resoluton (100 sec FFT as opposed to 10 sec FFT as done in the previous comment). With this we get a difference of 0.18% between the end station Pcals and this number seems to be more robust when I increase the FFT duration (to get better SNR). I have also added a plot showing the values of DARM / (X - Y) at 395.1 Hz for various segments in the 1000 sec stretch used here. Looking at this trend for various segment durations we find that for 10 sec segment used in the previous commnet the data is not randomly distributed but has some features and hence the mean value would not agree with mean values we get from other segment durations (for truly random noise we expect means of different segment durations to agree with each other).