Displaying reports 37801-37820 of 89089.Go to page Start 1887 1888 1889 1890 1891 1892 1893 1894 1895 End
Reports until 20:51, Thursday 31 October 2019
H1 ISC (ISC)
craig.cahillane@LIGO.ORG - posted 20:51, Thursday 31 October 2019 - last comment - 22:41, Thursday 31 October 2019(52855)
Increasing FSS Common Gain by +3dB removes most of frequency noise from DARM
We got back to nominal low noise.

The frequency noise in DARM as extremely bad right when we returned.  
I measured the CARM and IMC loops and found the IMC UGF was 45 kHz and look wonky above 20 kHz.

Georgia increased the FSS common gain by +3dB from 20 to 23 dB after noticing the plummeting transmission and reflection on the FSS.  She also found that the IMC REFL DC light was relatively high (up to 14 mW from the normal 9 mW).  
After +1 dB the frequency noise was replaced by intensity noise, likely imprinted by the ISS from the freq noise incident on the IMC.  
Georgia further increased by +2dB.  This cleared up everything further, now the spectrum is more clear of laser noise.  See first PDF.
The IMC REFL DC light is now back to 9 mW.

The new IMC UGF is 80 kHz.  
New CARM gain is 16 kHz.
See PDF 2.

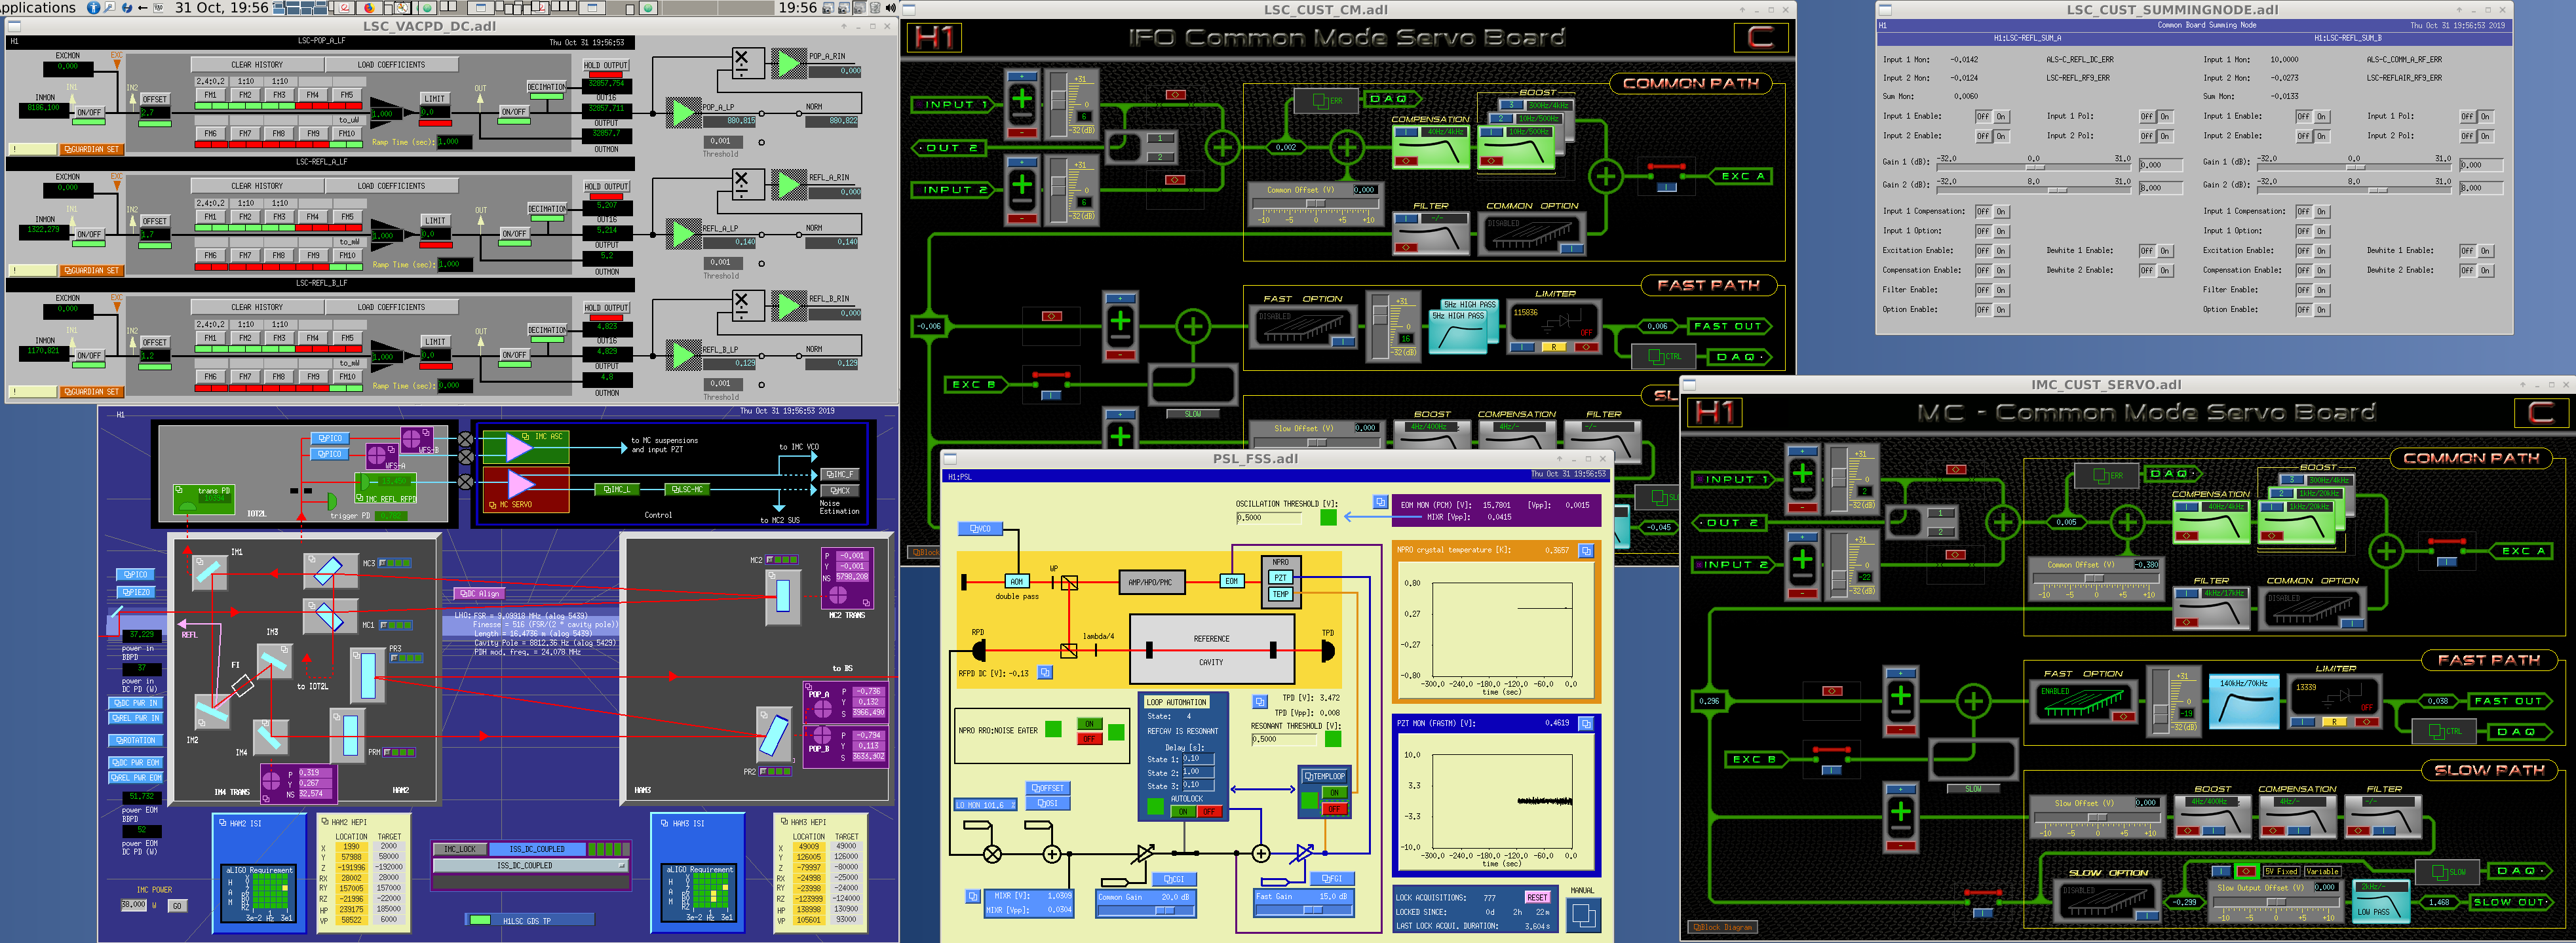
PNG shows the original gain sliders, before we made any changes, and some PD DC powers.
Images attached to this report
Non-image files attached to this report
Comments related to this report
craig.cahillane@LIGO.ORG - 21:30, Thursday 31 October 2019 (52857)
Note, we saw this exact problem before in February, and it was solved in the same way (FSS gain increase): alog 46968

We expect that the power glitches we saw when powering up will go away now that the IMC loop is back to normal.
georgia.mansell@LIGO.ORG - 22:41, Thursday 31 October 2019 (52859)

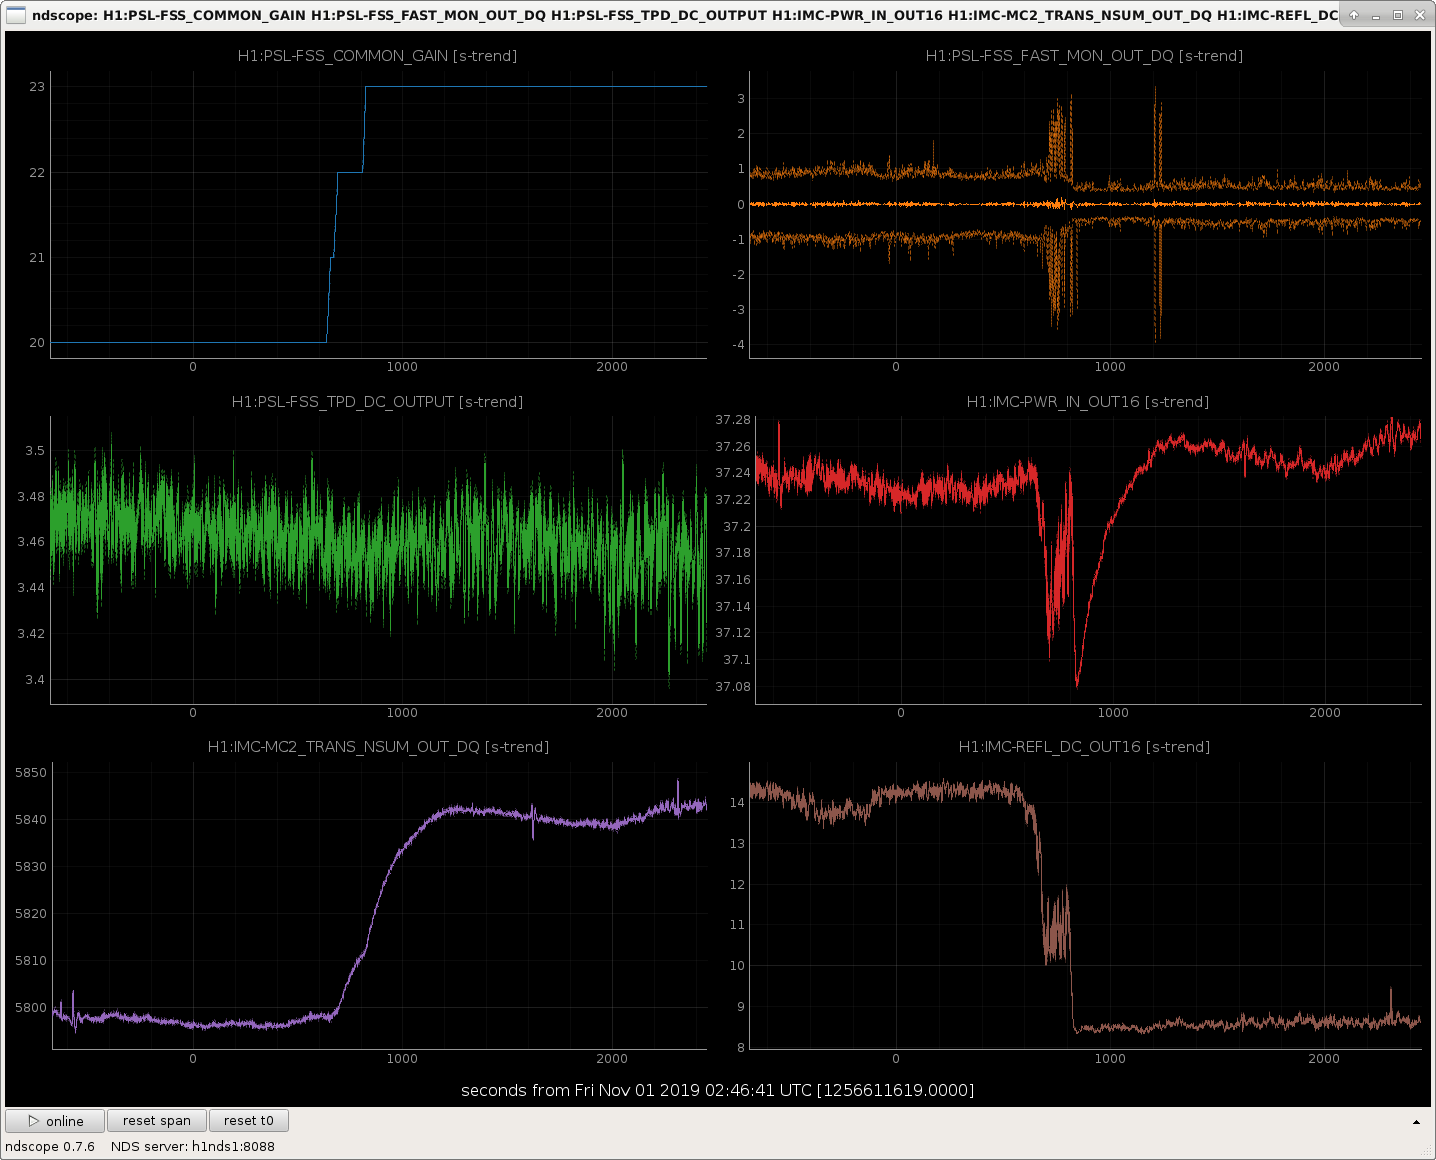
Attaching a screen shot of some time series while I increased the FSS gain:

  • FSS PZT monitor (fast_mon) is less noisy
  • IMC power in is less noisy
  • MC2_trans is higher
  • IMC_refl is lower, back to ~9mW where it was before Tuesday.
Images attached to this comment
H1 SUS (SUS, SYS)
georgia.mansell@LIGO.ORG - posted 20:36, Thursday 31 October 2019 - last comment - 14:58, Friday 01 November 2019(52856)
ITM ESD high voltage untripped 01:50 UTC

We got to TRANSITION_FROM_ETMX (where DARM control is temporarily handed off from ETMX L1 L2 L3 to ETMY L1 L2 + ITMX L3) and found that the guardian would not complete the transition as the ITMX ESD high voltage was off (nice catch in the guardian!)

Dan went to the mezzanine and pressed the red button on the box above the HV supply to untrip the high voltage.

It seems like it's been tripped since 00:14 UTC October 31.

Comments related to this report
rahul.kumar@LIGO.ORG - 14:58, Friday 01 November 2019 (52890)

Kyle, Fil, Sheila, Rahul

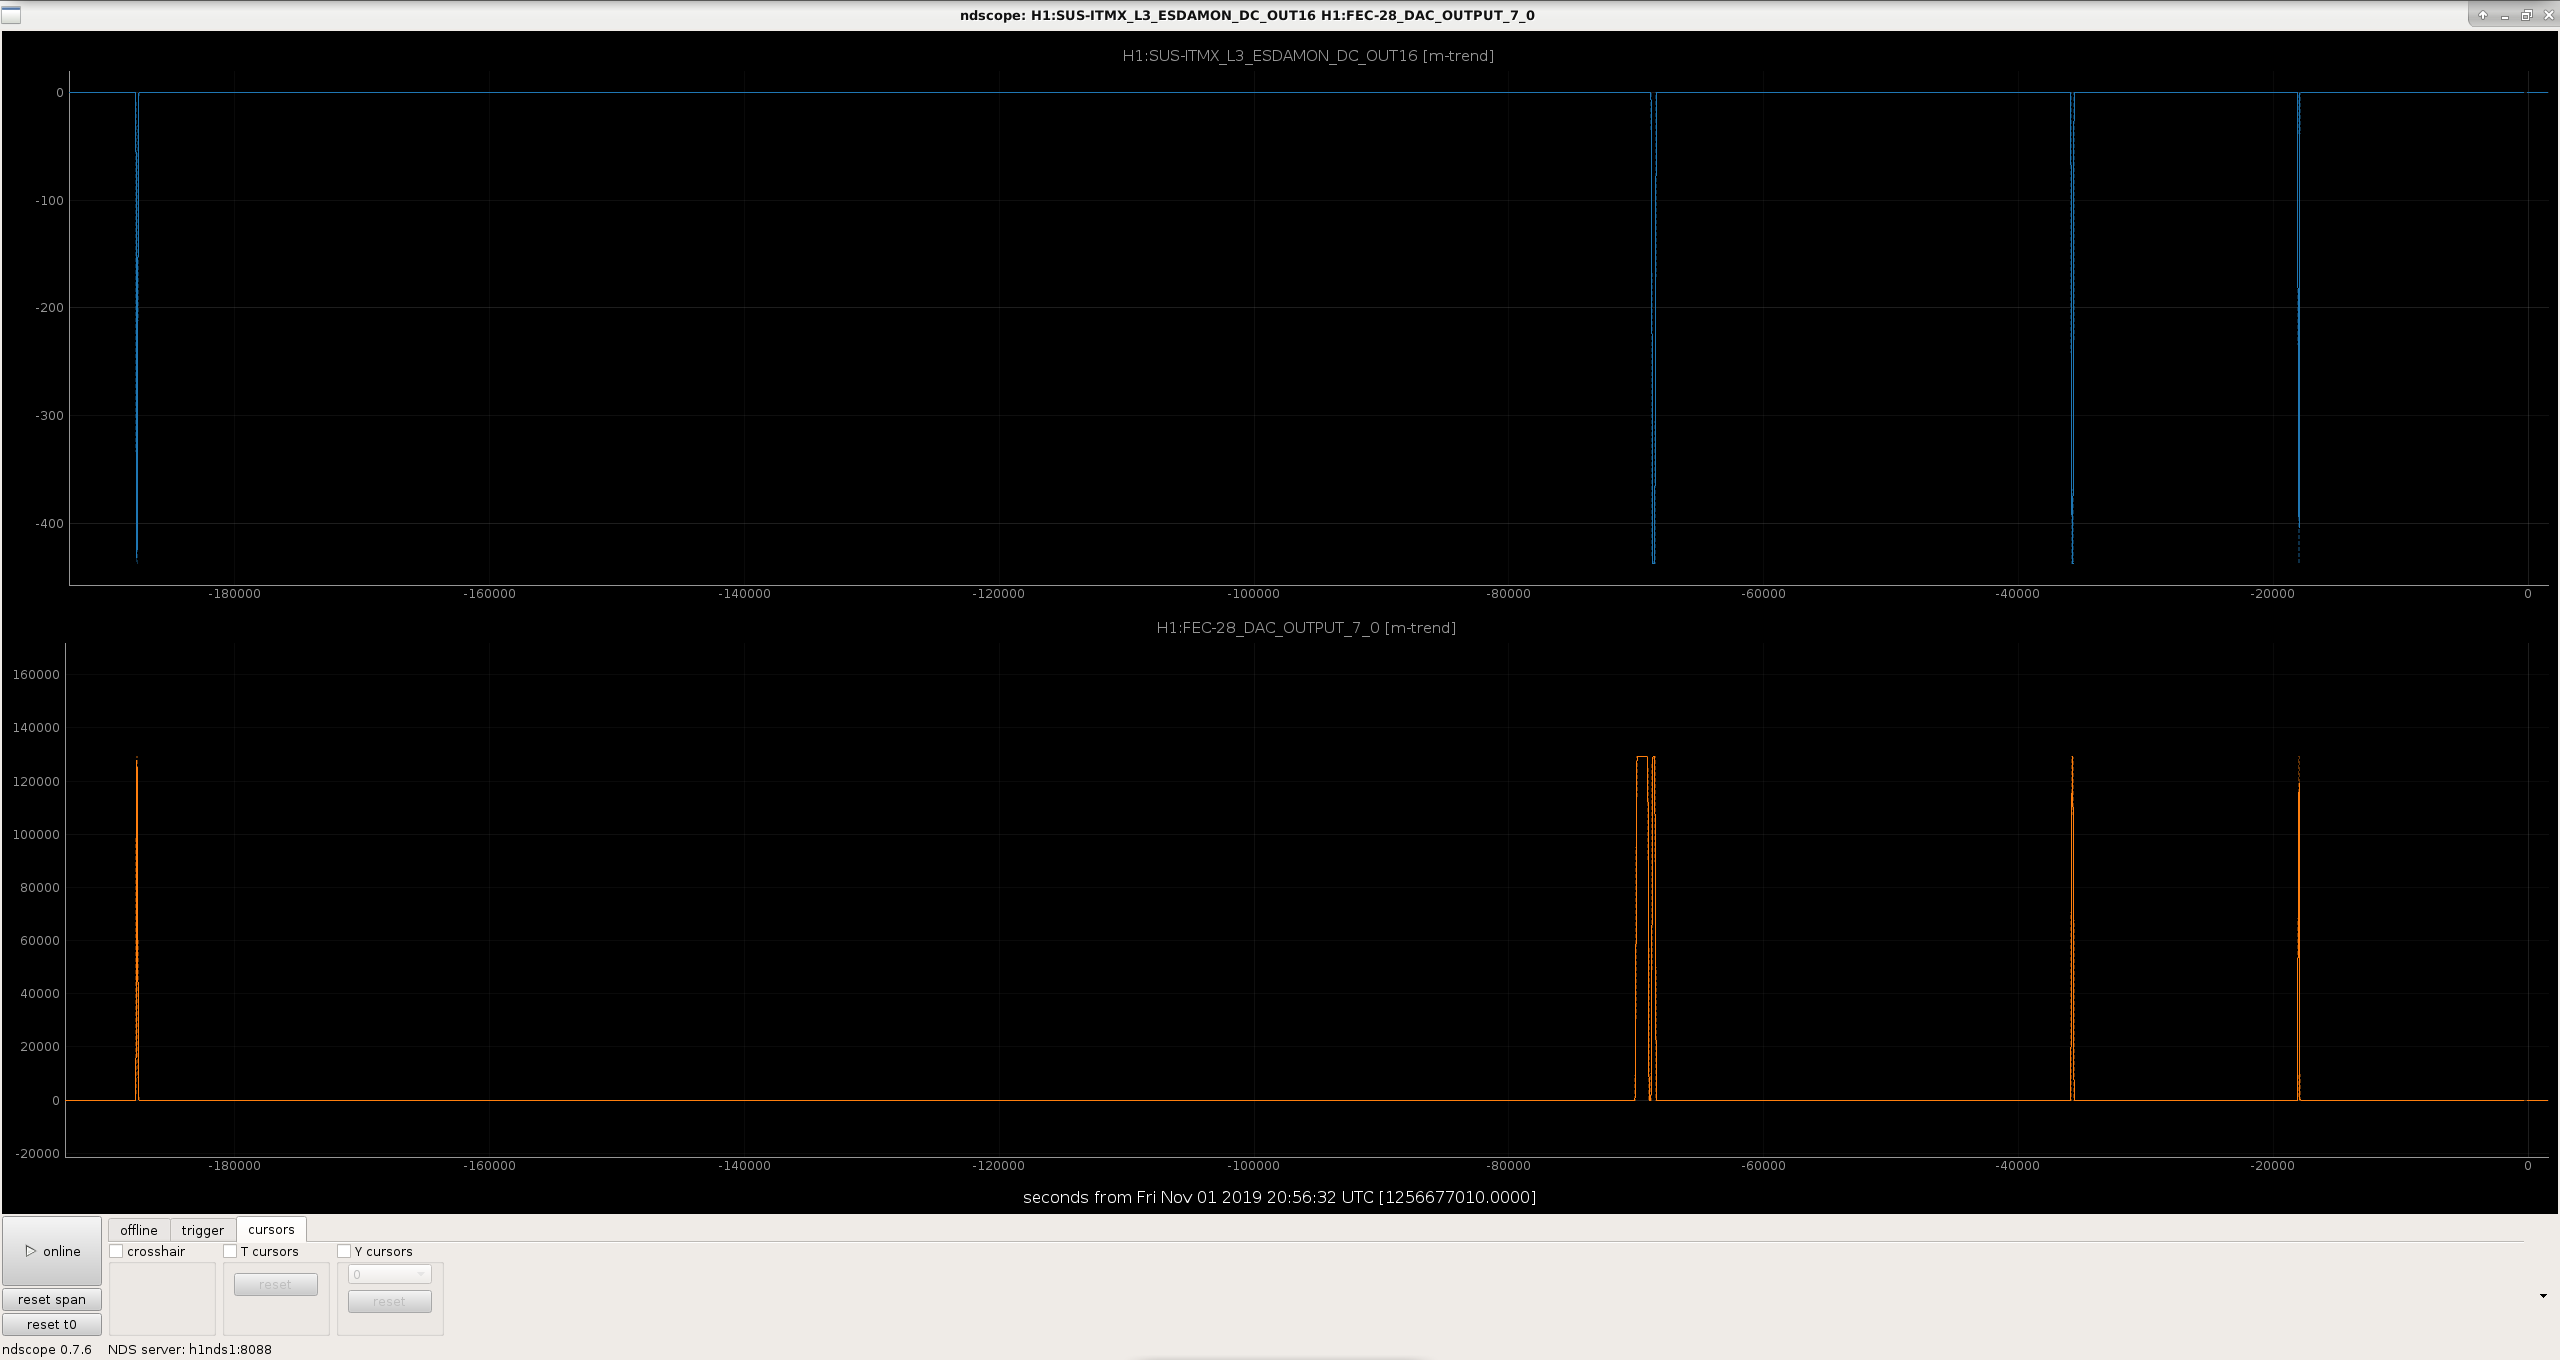
To investigate further on this, I trended the following two channels to see Guardian request for HV at ITMX,

H1:SUS-ITMX_L3_ESDAMON_DC_OUT16    #shows the status if HV has been supplied

H1:FEC-28_DAC_OUTPUT_7_0    #where Guardian is requesting HV

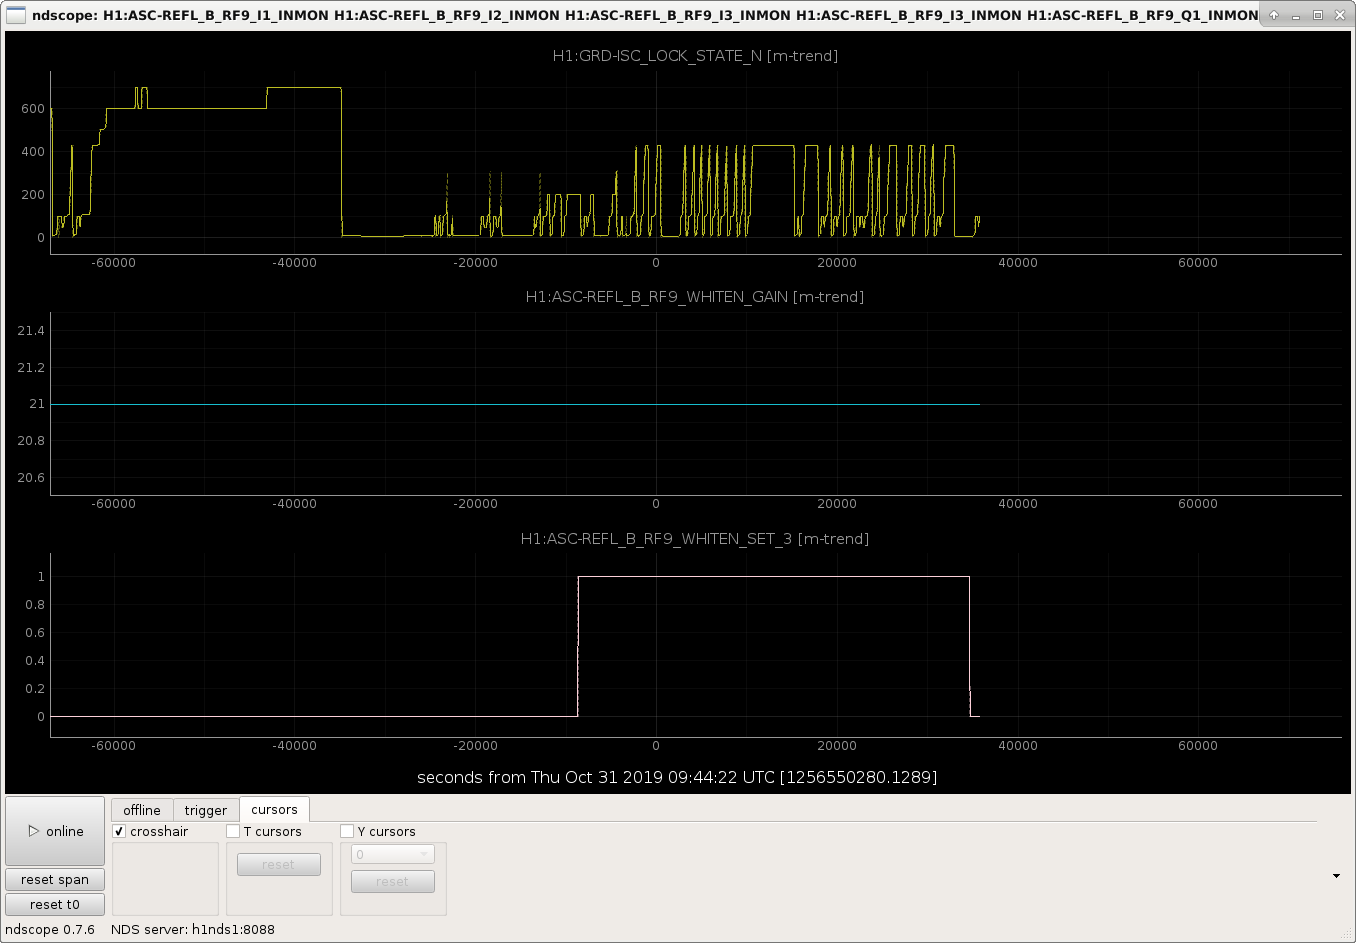
Last evening Guardian requested for HV at 0.1.30 UTC, however HV was tripped (can been seen in the ndscope plot attached). On 30 Oct, this was working fine, which can be seen in the same plot.

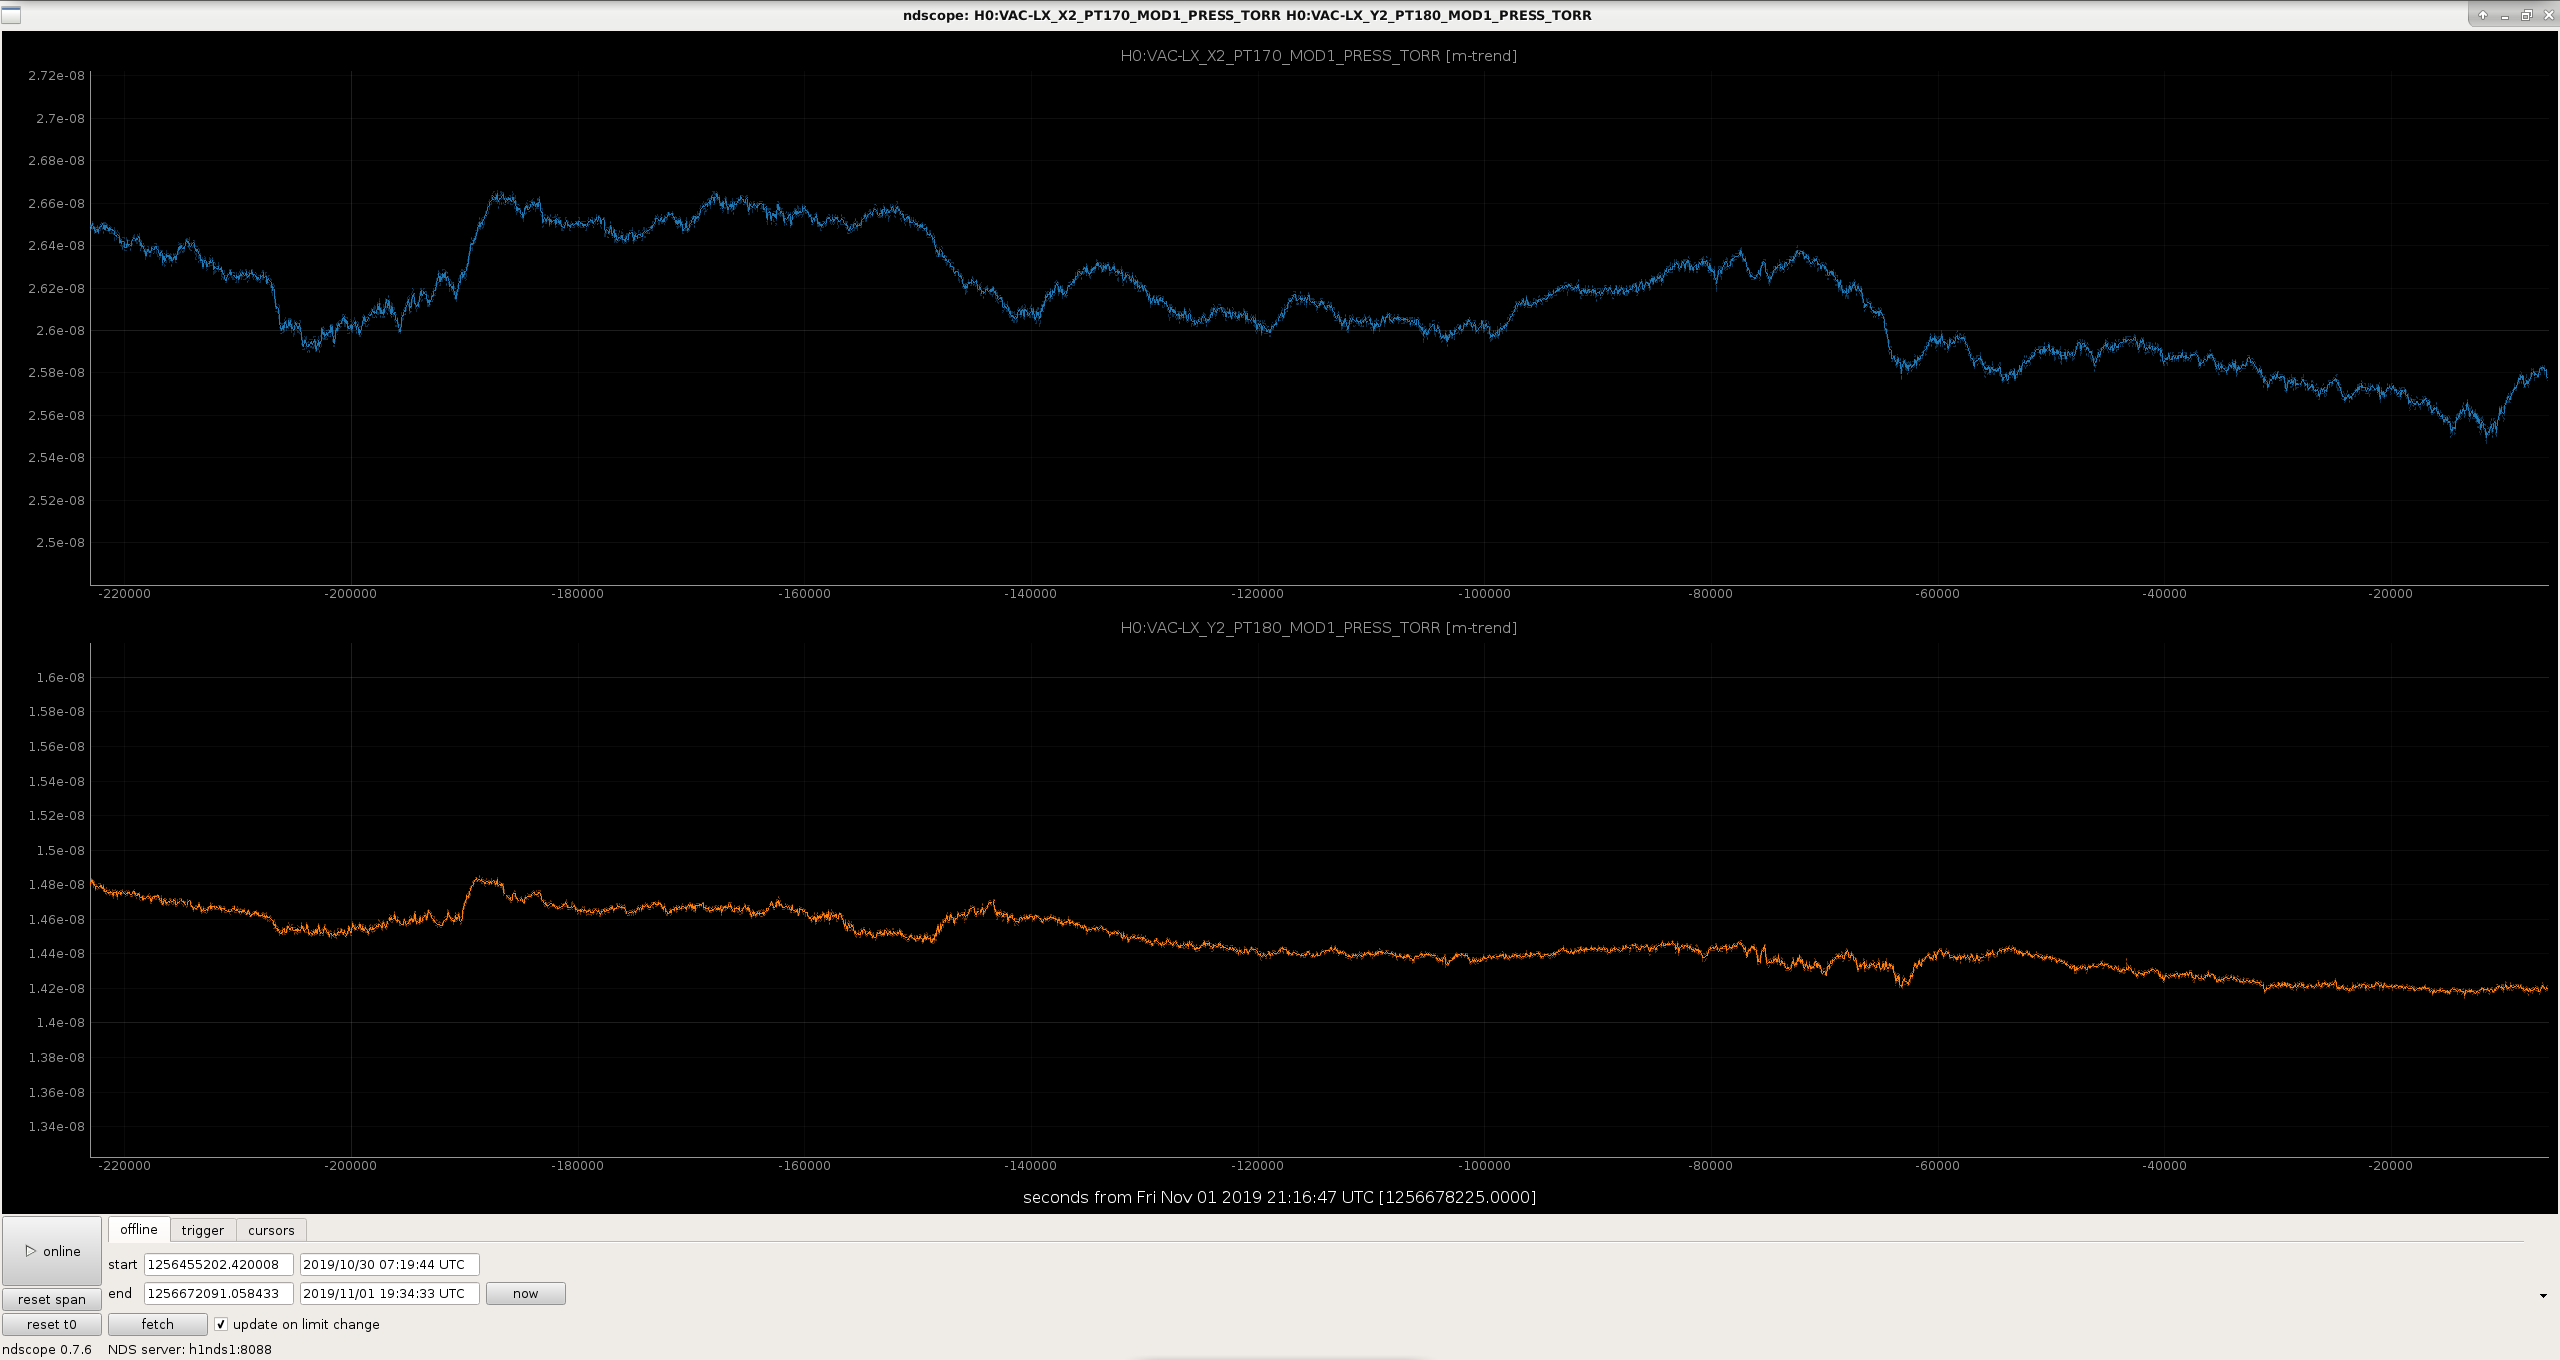
We trended (attached) the HAM (7 and 8) vacuum data (PT 170, PT 180) to look for any drop in pressure which could potentially trip the HV supply. The pressure was fine, however Kyle thinks that the glitches in the gauges could be possible. According to Fil, the safety relays (between vacuum gauges and HV supply) could be another possibility.


Images attached to this comment
H1 IOO (IOO)
cheryl.vorvick@LIGO.ORG - posted 19:23, Thursday 31 October 2019 (52852)
CW1 camera images show beams with frindges
Images attached to this report
H1 CAL (CAL)
richard.savage@LIGO.ORG - posted 19:13, Thursday 31 October 2019 - last comment - 19:15, Thursday 31 October 2019(52853)
Updating Pcal force coefficients for temporary compensation for Pcal suspension filters still using O2 masses

DriptaB and RickS

Because we want to start O3 with updated Pcal force and displacement coefficients, and because the Pcal suspension filters have not yet been updated to incorporate the O3 masses (they are still using the O2 masses) we have generated "fudged" Pcal force coefficients to compensate for the incorrect ETM masses.

As soon as these filters are updated with the correct masses, we will revert to the "unfudged" coefficients.

The compensating force coefficients have been implemented as follows:

H1:CAL-PCALX_FORCE_COEFF_CTS2V_T 7.9264e-13
H1:CAL-PCALX_FORCE_COEFF_CTS2V_R 6.2333e-13
H1:CAL-PCALY_FORCE_COEFF_CTS2V_T 9.2340e-13
H1:CAL-PCALY_FORCE_COEFF_CTS2V_R 6.2795e-13

A table showing both the nominal and the compensating coefficient values, as well as the "fudge factors" from the O2/O3 mass ratio, is attached to the comment below.

Comments related to this report
richard.savage@LIGO.ORG - 19:15, Thursday 31 October 2019 (52854)CAL

Table of nominal and "compensating" Pcal force coefficients attached.

Non-image files attached to this comment
H1 SUS (Lockloss, SUS)
rahul.kumar@LIGO.ORG - posted 19:01, Thursday 31 October 2019 (52845)
Violin mode damping

Cheryl, Jenne, Rahul

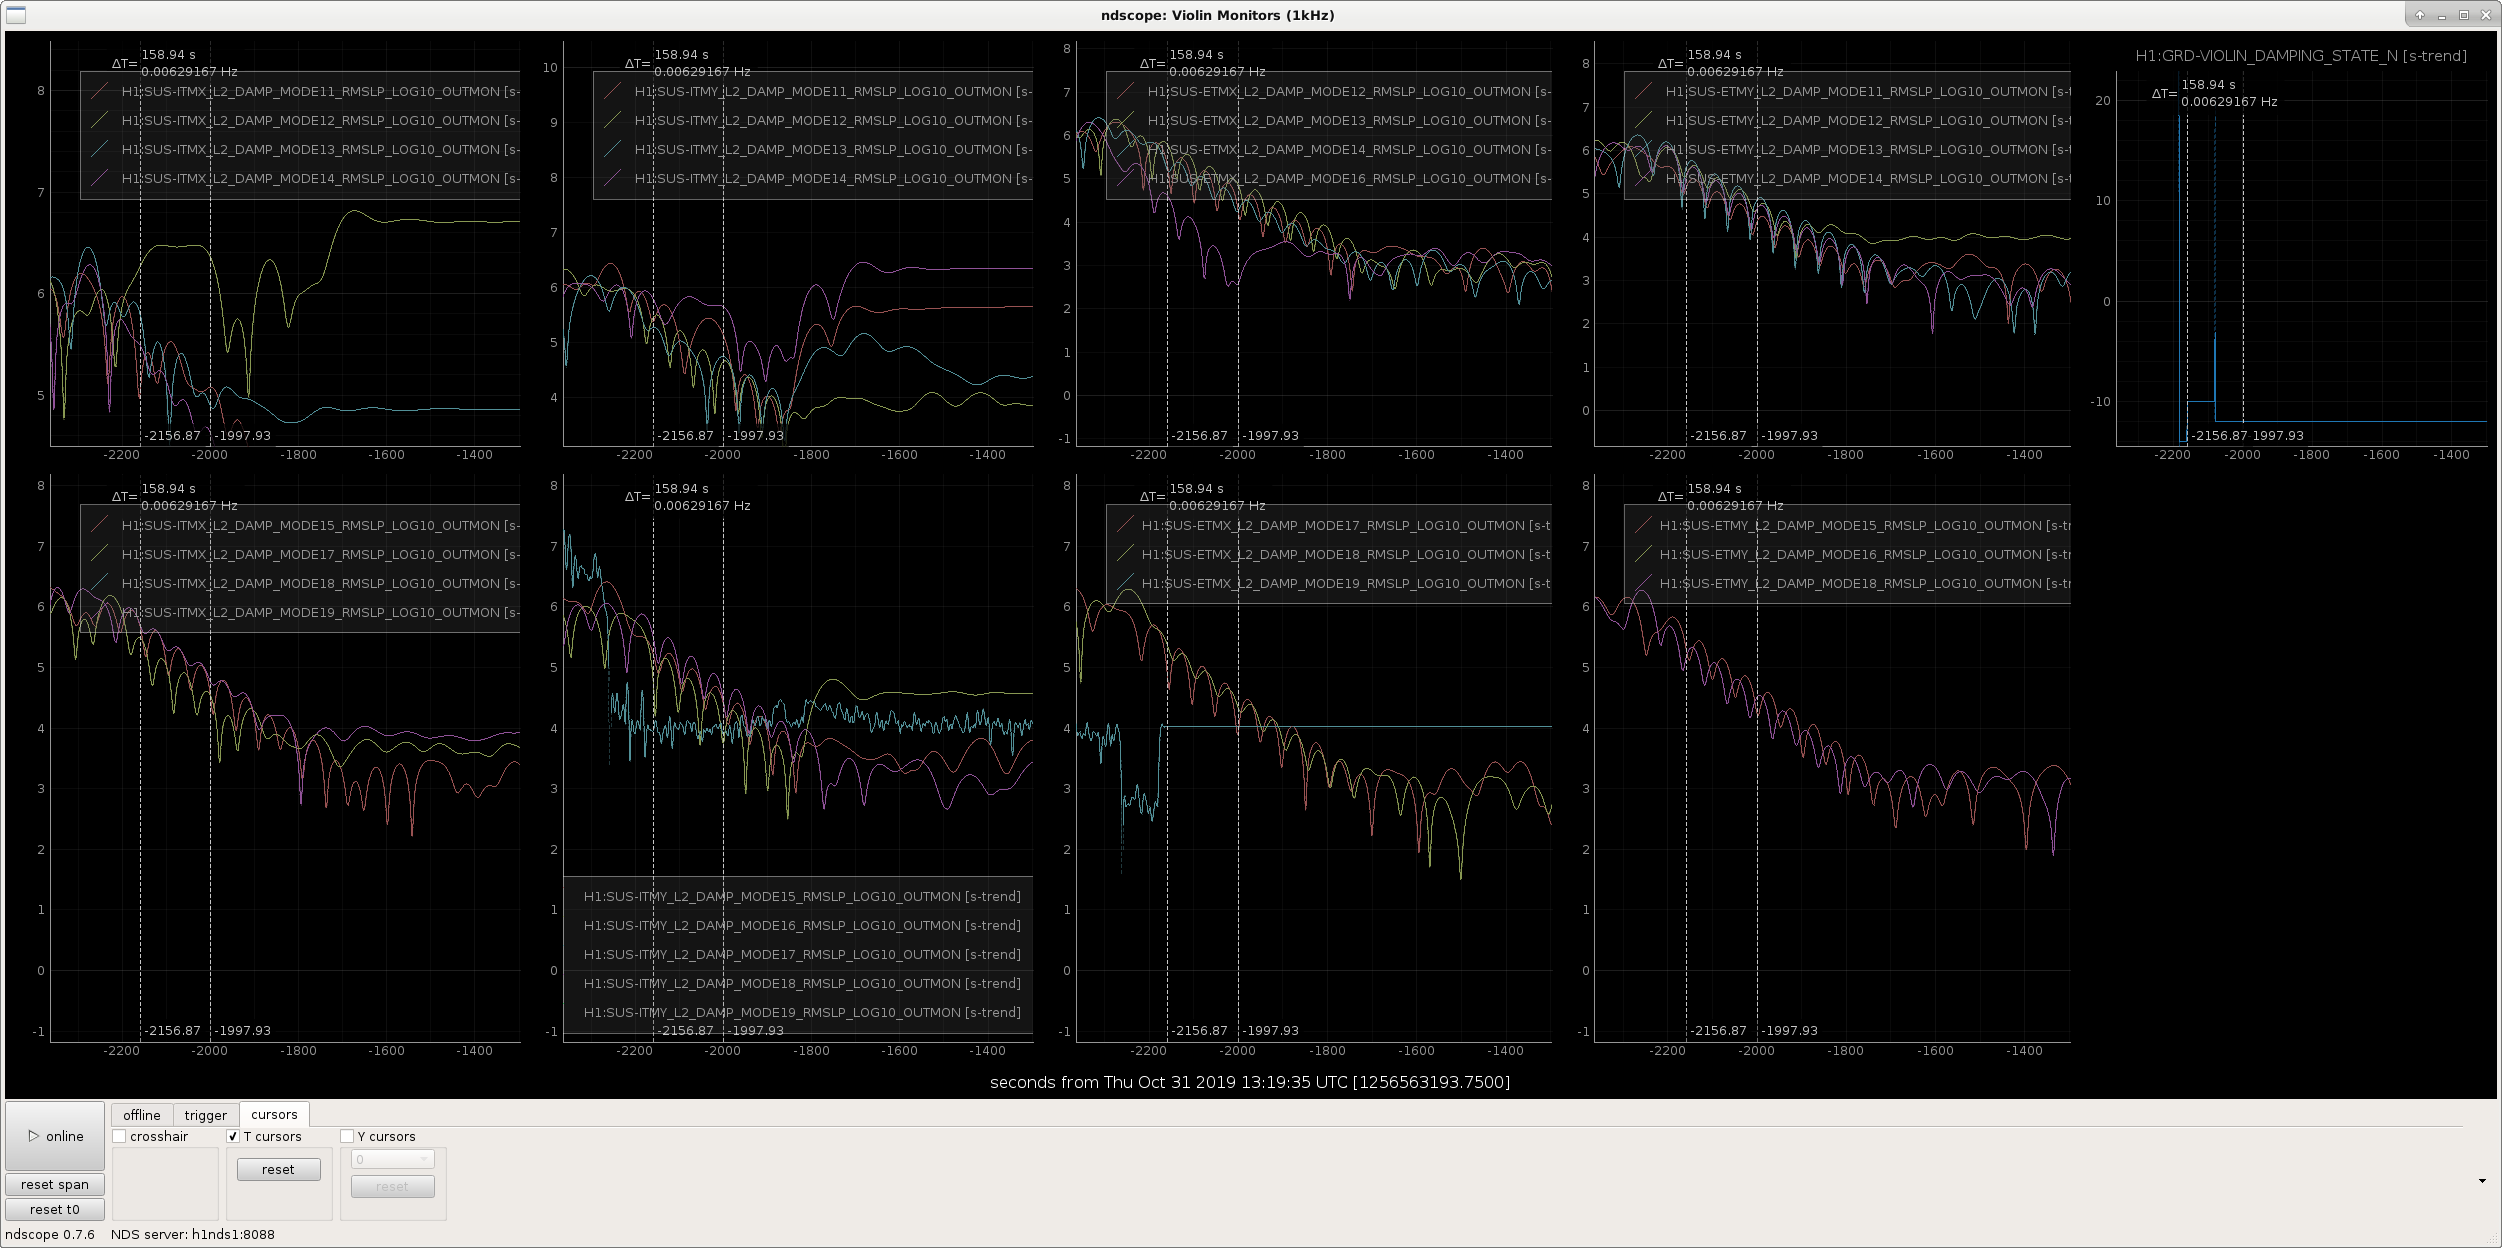
Given below are the list of modes which were rung up. We tried damping them over the course of few lock attempts,

Lock attempt 1 (UTC 20.37): ETMY 1 (did not like the applied +- 0.1 gain; nominal is +0.1), ETMY 4, ITMY 14 (applied gain +200, nominal is +500)

Lock attempt 2 (UTC 21.38): ETMY 1 , ITMX 12, ITMY 14, ETMX 6, ETMX 3, ETMX 4

Lock attempt 3 (UTC 22.01): ETMY 15, ETMY 6, ITMX 13, ETMY 1 (phase changed from +60 to zero), ETMY 4 (applied some GAIN), ITMX 12, ITMY 11, ITMY 14,

Lock attempt 4 (UTC 23.00): ETMY 1, ITMX 13, ETMY 6,

Lock attempt 6 (UTC 01.16): ETMY 1, ETMY 6, ITMX 13, ITMY 15 - DAMPING_ON_DC working fine for now.

H1 ISC
varun.srivastava@LIGO.ORG - posted 18:42, Thursday 31 October 2019 (52851)
IM mirror alignment changed

Jenne, Varun

We saw the peaks in IM4_TRANS_SUM_OUTPUT similar to peaks in the ISS as shown in plots attached in alog 52815. Thus hinting clipping must be in the input path at the Faraday isolator and not the ISS. Therefore, we restored the input alignments of the IMs to yesterday's night configuration tuned by Jenne and redid the initial alignment. This was done to ensure that there is no clipping through the Faraday. We picoed PM1 in the ISS path to recenter the ISS QPD.

LHO FMCS
yasmeen.asali@LIGO.ORG - posted 18:29, Thursday 31 October 2019 (52850)
Timing Spot Check pre O3b
Spot checks were performed on GPSTIME: 1256605434 to check that timing is correct prior to the start of O3b. The IRIG-B timestamp is in agreement with the timestamps written to frame files within +/- 10 seconds of the given time, and DuoTone delays are within 1 microsecond for ADC channels at LHO. Timing checks at LHO are as expected and consistent with the absolute timestamps. 

Scripts used to run these checks can be found here: https://svn.ligo.caltech.edu/svn/aligocalibration/trunk/Common/Scripts/Timing
Images attached to this report
Non-image files attached to this report
H1 ISC (ISC)
craig.cahillane@LIGO.ORG - posted 17:53, Thursday 31 October 2019 (52848)
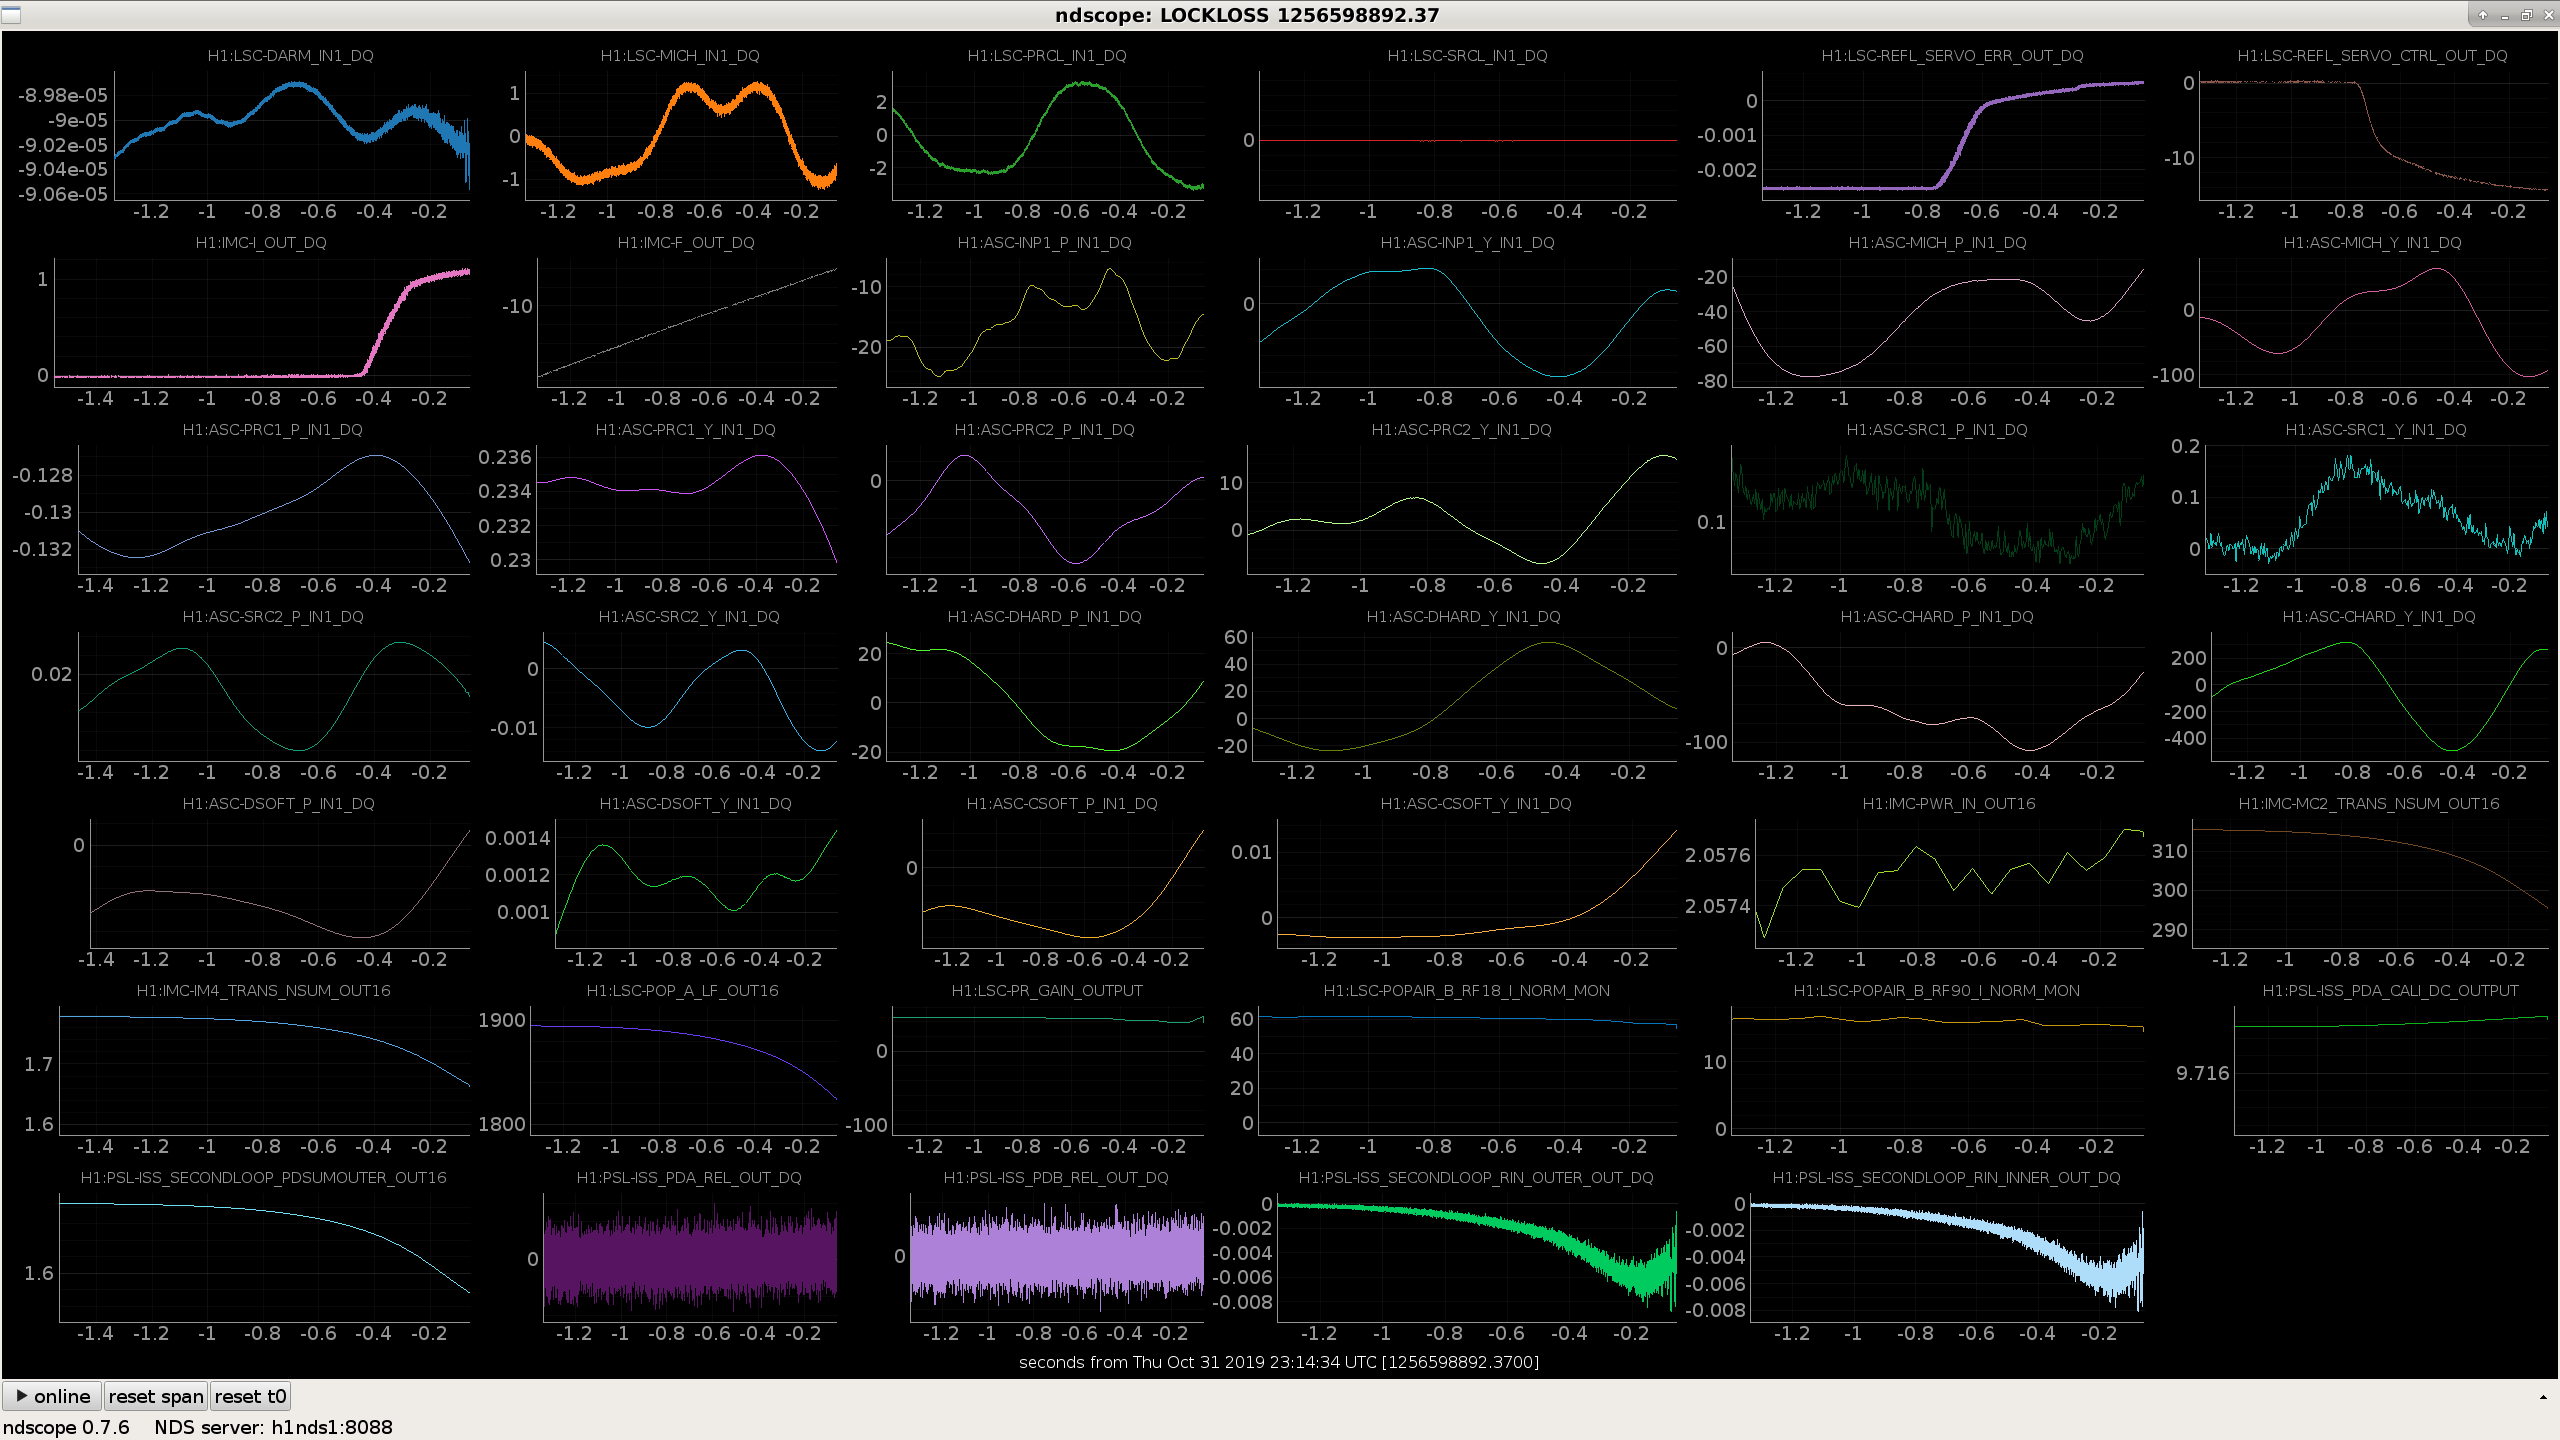
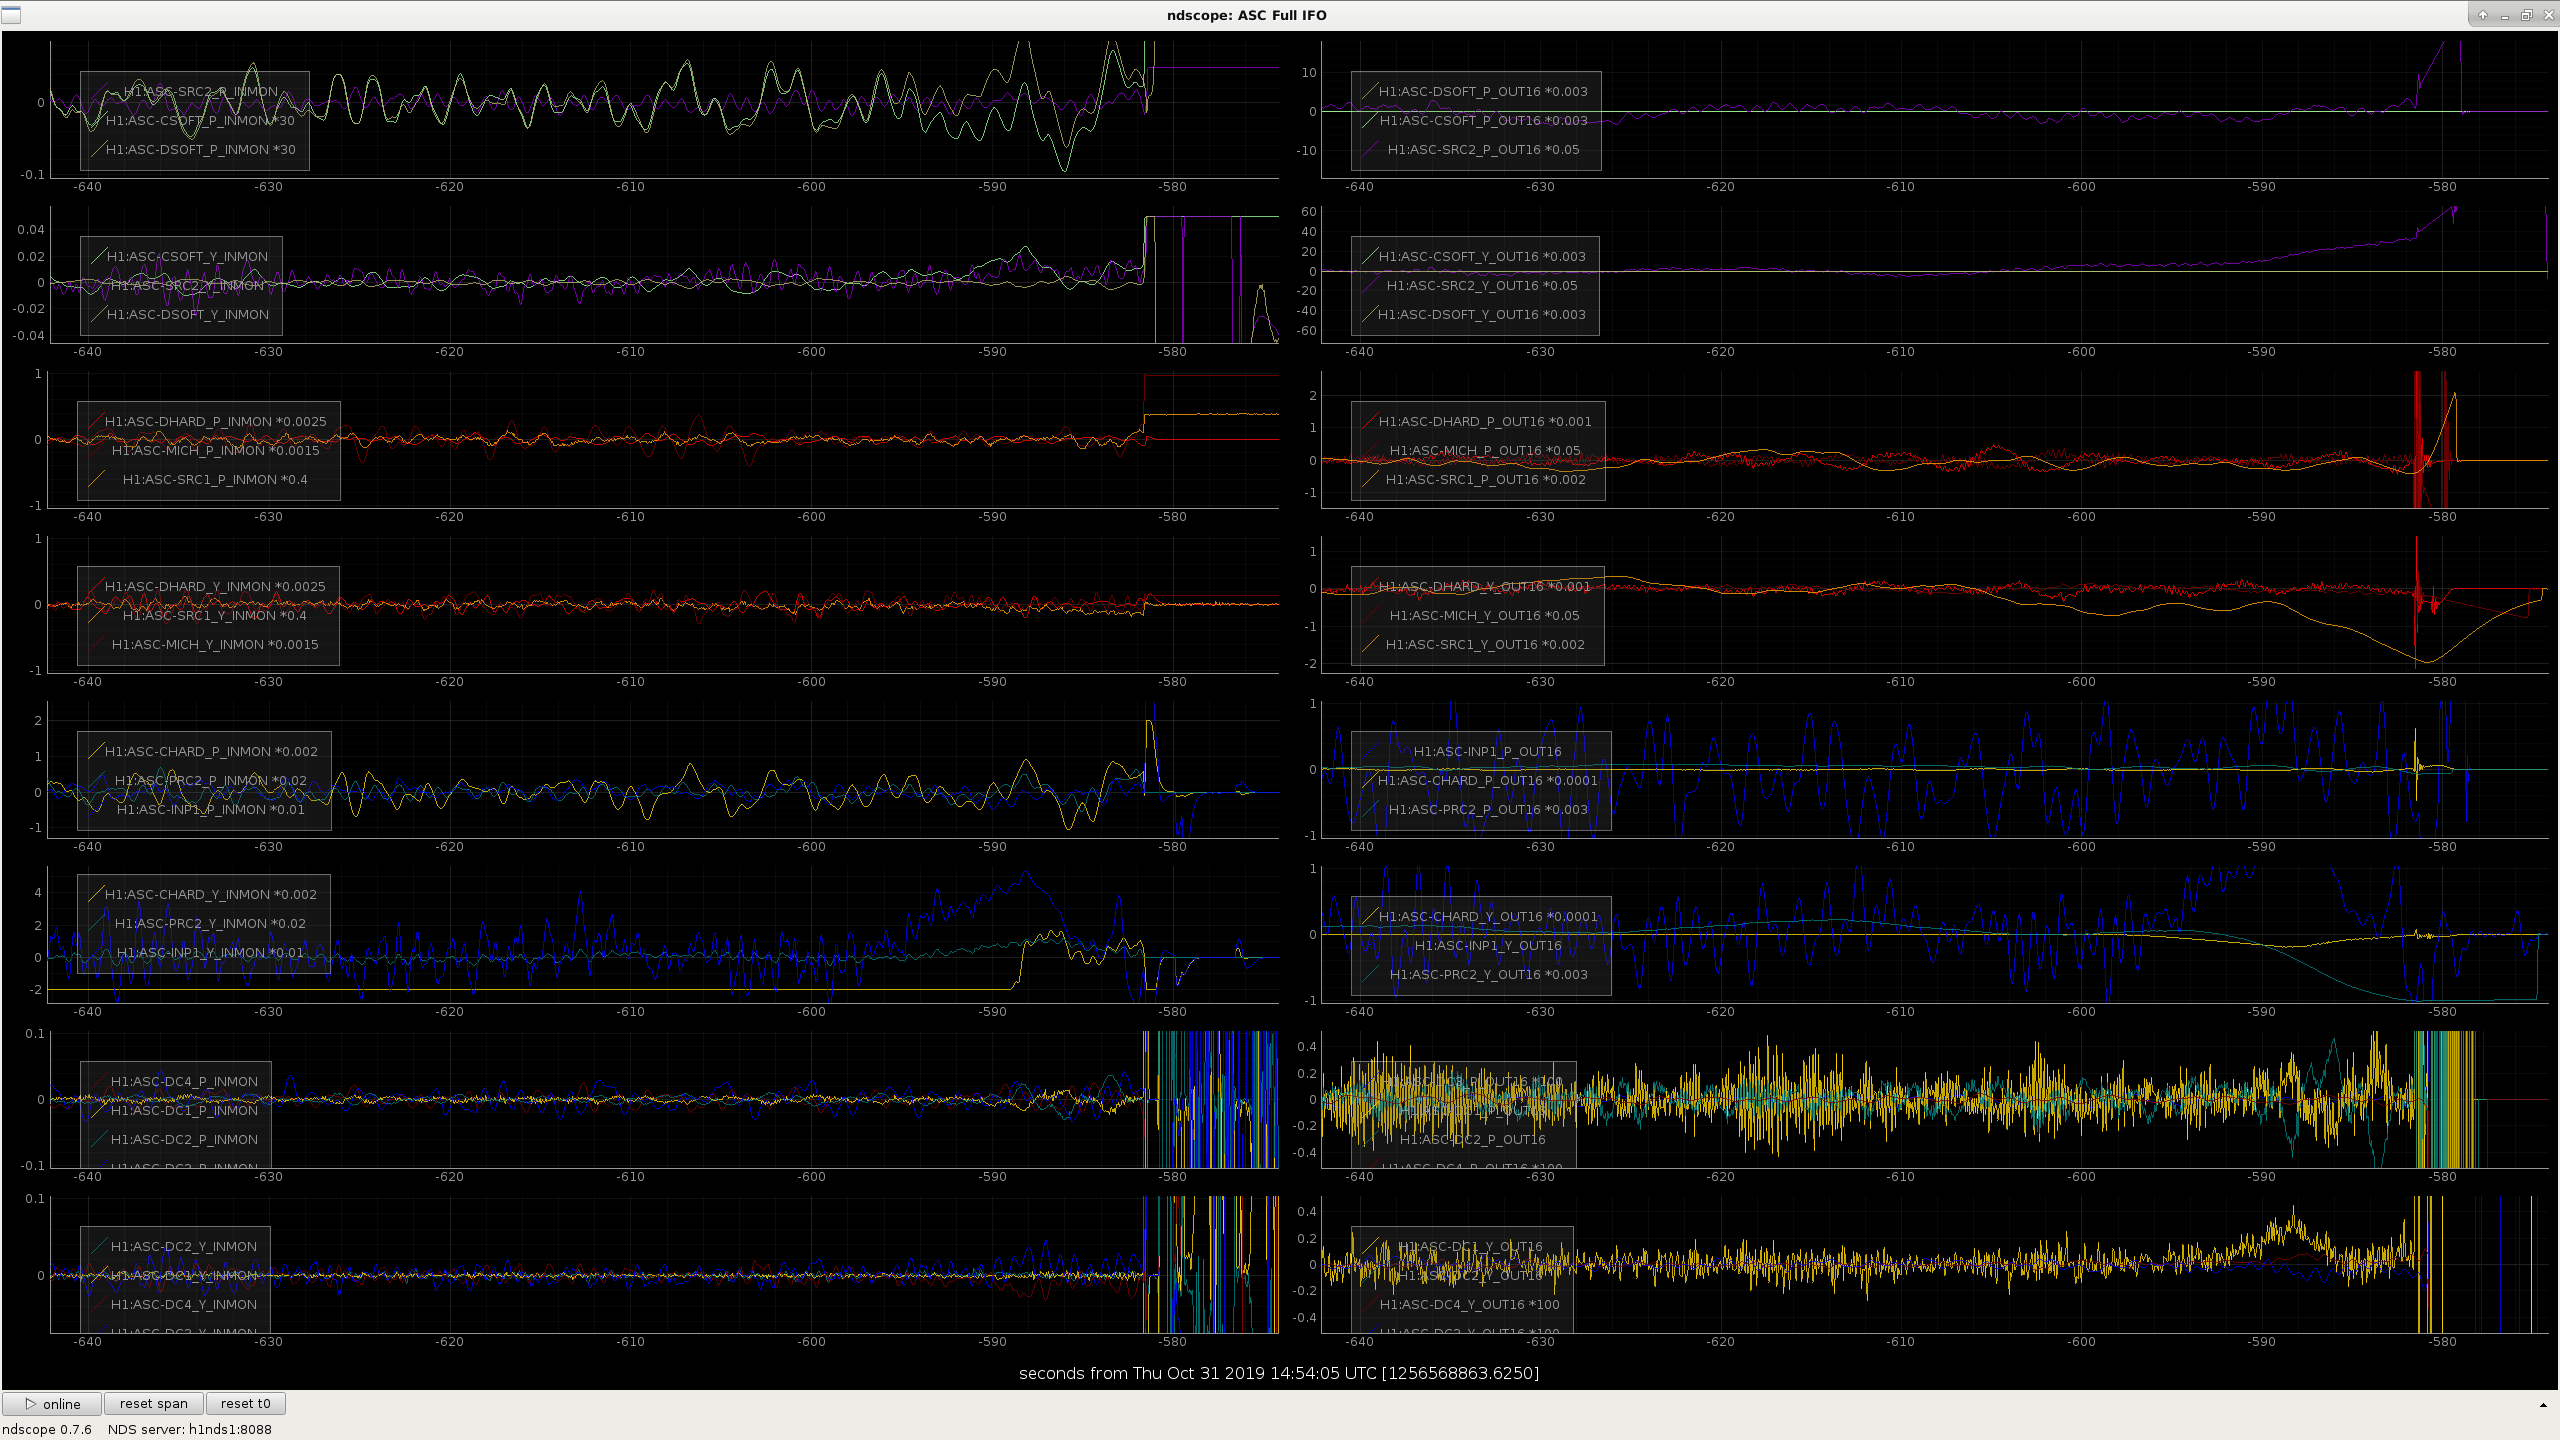
ASC locklosses probably a power dump from IMC
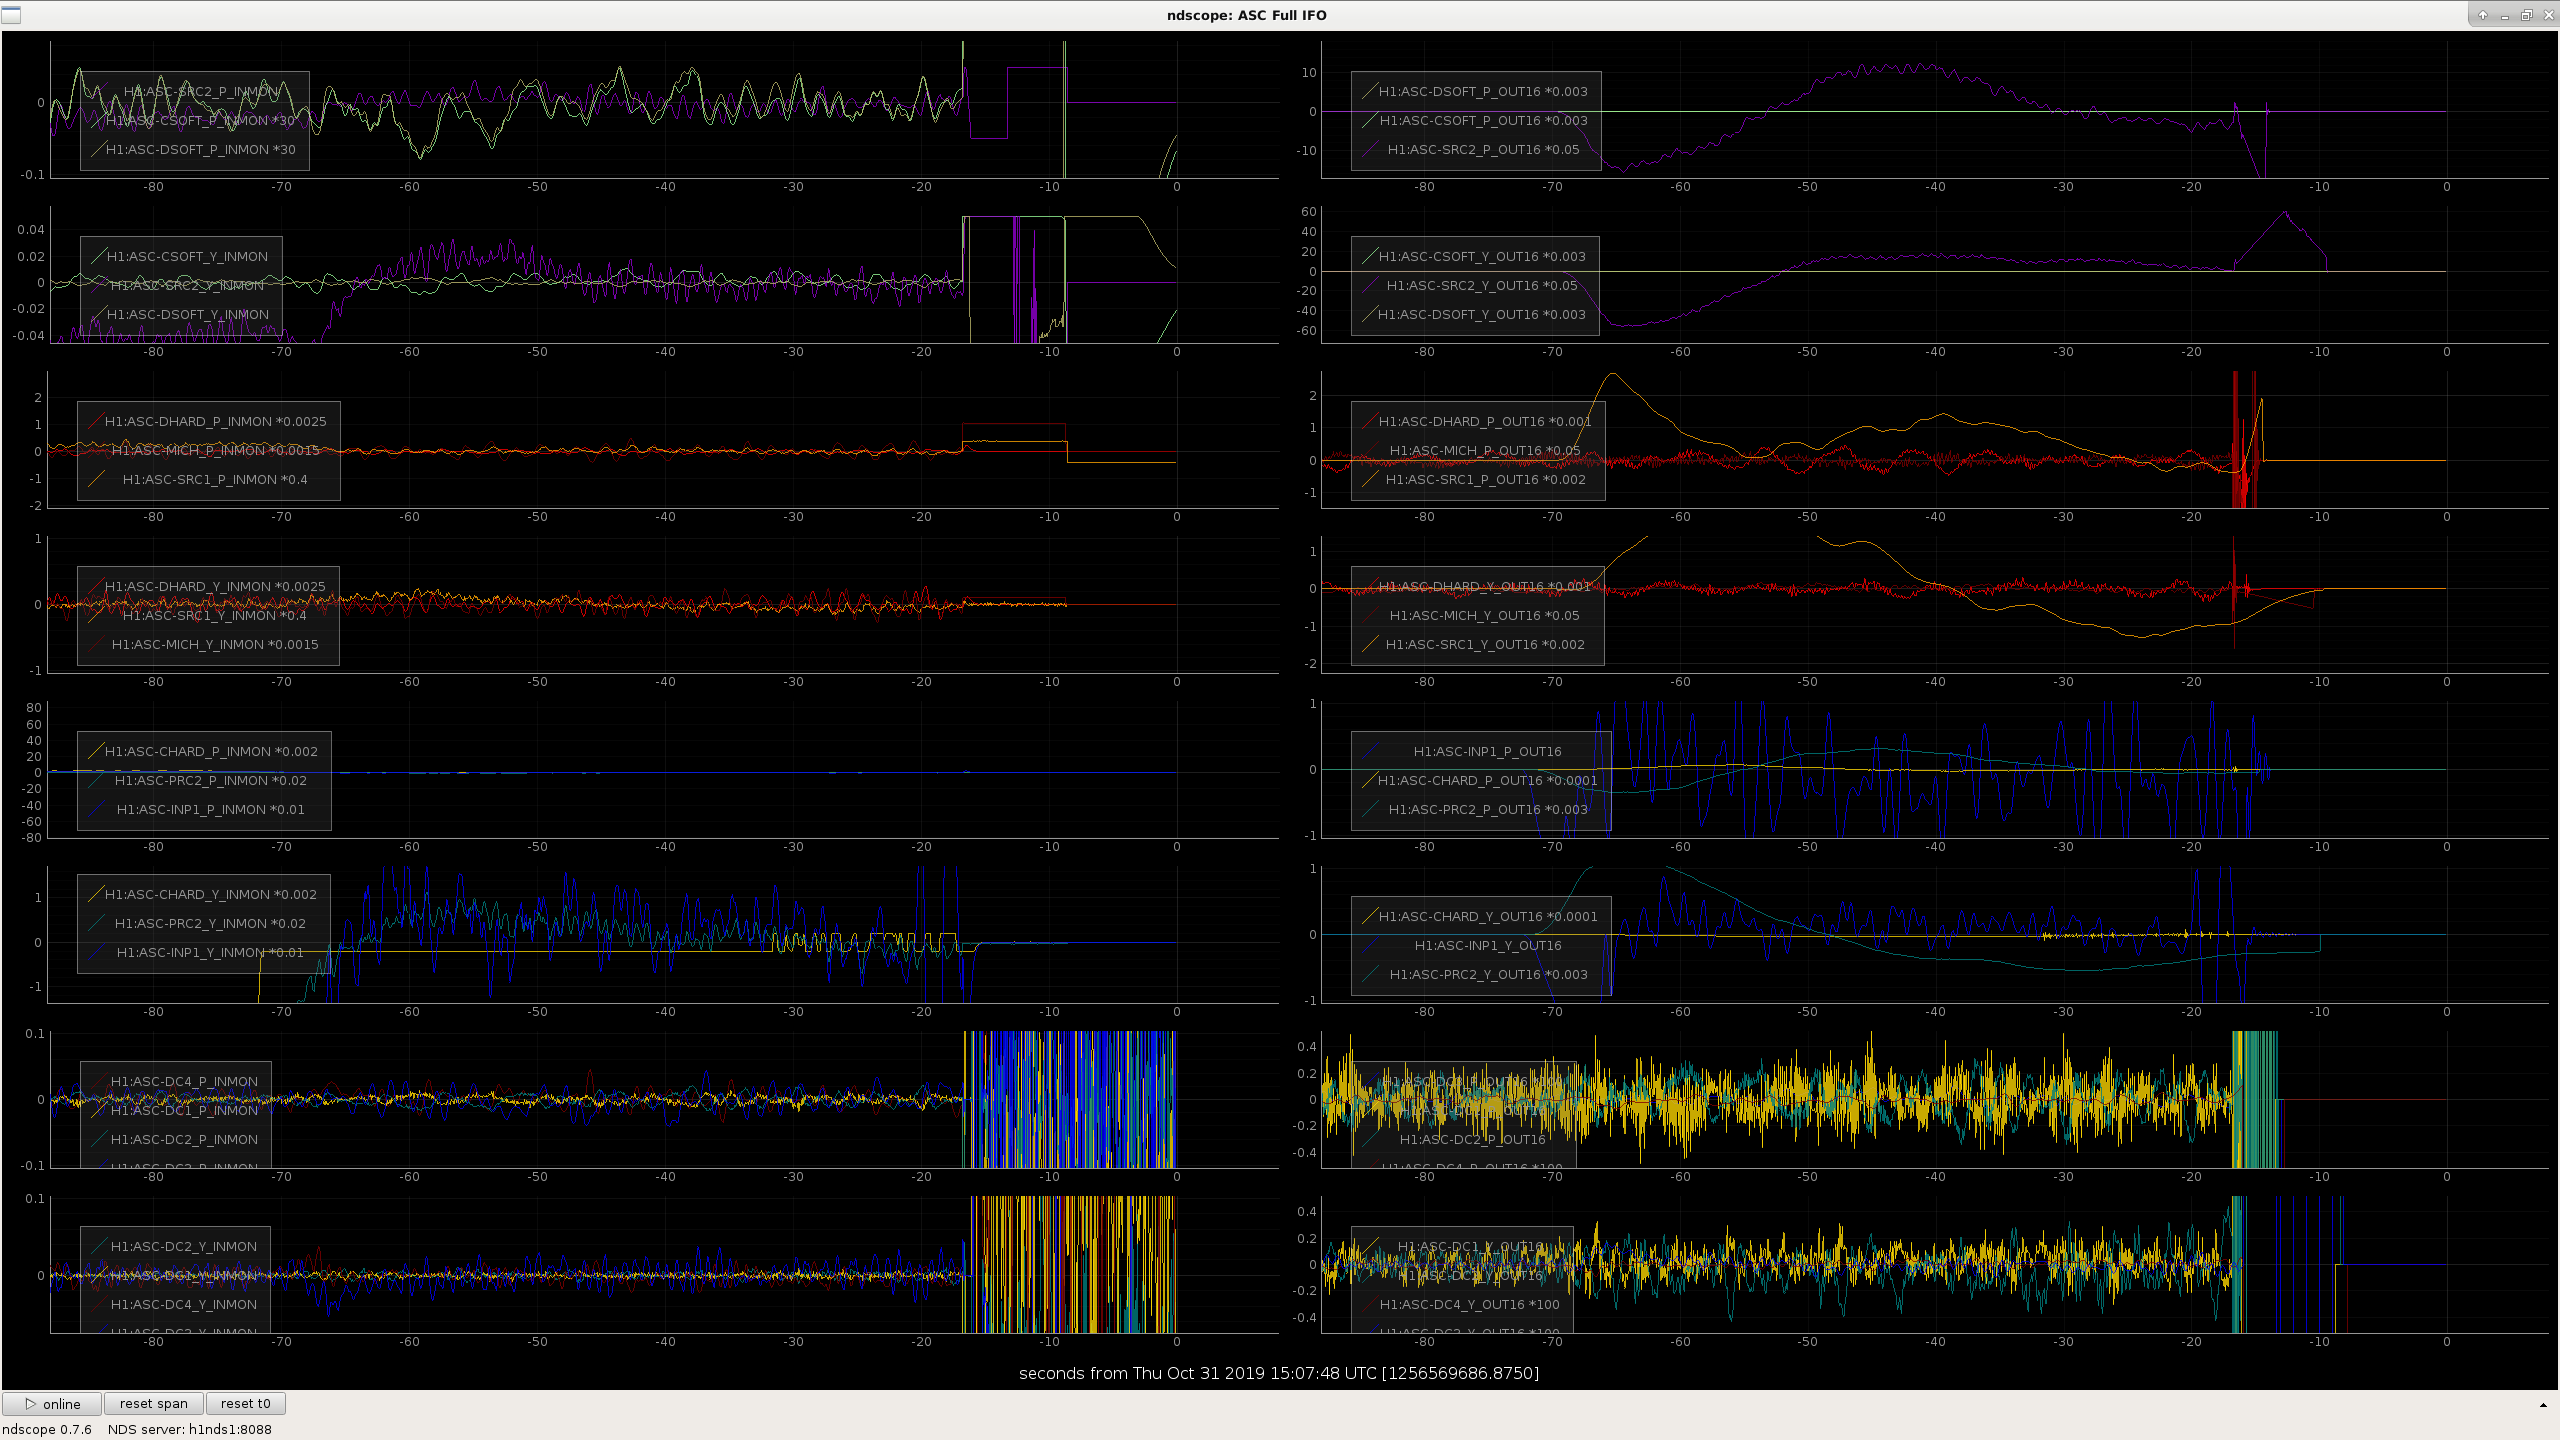
Shown are times directly before two locklosses from this afternoon in PREP_ASC_FOR_FULL_IFO.
Seems like the power BEFORE the IMC is fine, but the power everywhere AFTER the IMC is plummeting.
This seems associated with some CARM and IMC control signals moving rapidly here as well.
I undid my IMC gain lowering of 2 dB from alog 52794 in the guardian.  Hope this helps us get through ASC convergence, but unclear if power glitches will return.
Images attached to this report
H1 IOO (IOO)
cheryl.vorvick@LIGO.ORG - posted 17:42, Thursday 31 October 2019 (52847)
IO analog camera lens and housing swapped

HAM2 top center viewport camera housing changed from black box to old round style.  When talking to various people, I discovered the smaller size of the old style round camera can was prefered, so I swapped that out.  The camera is the same, but I changed lenses, and as  reminder, the LEXAN is locked in place.

- Cheryl, Rahul

H1 CDS
jonathan.hanks@LIGO.ORG - posted 17:15, Thursday 31 October 2019 - last comment - 15:02, Friday 01 November 2019(52846)
Nds1 limits hit in the control room
The nds1 server tracks connections via a series of (small) bitmaps.  Today users in the control room needed more connections than the server could handle.

The quick fix is to close down unneeded live streams to the nds1 server (ndscope, dataviewer, dtt, ...).

I am evaluating what is needed to significantly boost these limits. It will require an update and rebuild of daqd for the nds1 servers1.
Comments related to this report
jonathan.hanks@LIGO.ORG - 15:02, Friday 01 November 2019 (52892)
H1 ISC
sheila.dwyer@LIGO.ORG - posted 17:05, Thursday 31 October 2019 - last comment - 16:47, Friday 01 November 2019(52825)
violin modes, ASC engagement trouble this morning

Sheila, Varun, Jenne

This morning I found that IFO had relocked and lost lock at engage ASC 10 times in a row (some of those where while people were here last night, several more after they left).

Images attached to this report
Comments related to this report
jeffrey.kissel@LIGO.ORG - 16:47, Friday 01 November 2019 (52899)CDS, ISC
There is a proposed solution to the PUM watchdogs, as described in ECR E1600270 and IIET Ticket 6100. 
It had been put on hold in February 2019.
H1 General
cheryl.vorvick@LIGO.ORG - posted 16:31, Thursday 31 October 2019 - last comment - 14:14, Saturday 02 November 2019(52843)
OPS Day Summary:

TITLE: 10/31 Day Shift: 15:00-23:00 UTC (08:00-16:00 PST), all times posted in UTC
STATE of H1: Planned Engineering
INCOMING OPERATOR: Niko
SHIFT SUMMARY: commissioning, restoring H1 for O3b, as of 23:29UTC, taking an hour break for multiple pre-aproved activities, relocking starts at 0:30UTC Nov. 1
LOG:

Comments related to this report
cheryl.vorvick@LIGO.ORG - 14:14, Saturday 02 November 2019 (52919)

CORRECTION:

  • 31-10-19 23:25 DanBand Ca to ISCT1 should be...
  • 31-10-19 23:25 DanB and H. Cao to ISCT1
H1 CAL
jeffrey.kissel@LIGO.ORG - posted 15:44, Thursday 31 October 2019 - last comment - 16:27, Friday 01 November 2019(52837)
On the effect (and direction) of PCAL Systematic Error
J. Kissel

Recently, the PCAL team identified that we hadn't updated the model of the force-to-displacement transfer function on the PCAL systems for the new O3 test masses, and in parallel, further refined their estimate of the power-to-force coefficient due to more carefully addressing ADC gains and incorporating the results for many more measurements of the transfer coefficients between the gold standard NIST reference and regularly-in-use end-station references (e.g. the RX and TX PDs) -- see more details in LHO aLOG 52828. 

This has been updated and fixed today, so this will no longer be a problem for O3B. However, this means there's been a systematic error in the PCAL displacement estimate that we've been using as an absolute reference for the IFO calibration for O3A.  

In this aLOG, I interpret the level of difference between "now" and "earlier" as described in LHO aLOG 52828 in terms how how this impacts our model of the IFO response function, and thus the impact on our estimate of h(t) -- i.e. recasting the "now" vs. "earlier" as a systematic error that we report in our transfer function that we typically report as the "uncertainty budget," e.g. LHO aLOG 52727.

In that LHO aLOG 52828, (and the subsequent comment LHO aLOG 52834), we see the definition of the "change in calibrated displacement," xi, as reported is 

           [   NOW               ]
     xi =  [ --------    -    1  ]  * 100                                                      (1)
           [ EARLIER             ]

where NOW is after today when the coefficients were installed (updated to be closer to the correct truth), and EARLIER is prior to today, during all of O3A (which therefore had a level systematic error proportional to xi).

We've dealt with systematic error in the PCAL systems in the past: back in the winter of O2 when the alignment of the PCAL beam decayed to the level some level of time-dependent optical clipping on the integrating sphere. LHO aLOG 34153 gives us the formalism to address such systematic error, so we should recast xi into that formalism, which called the systematic error eps (where, for reasons that will become clear later, I re-write the definition of eps in terms of dL_{PCAL} instead of x_pcal):

     eps is a real number that converts the "apparent" displacement, dL_pcal, (i.e. that which includes a known systematic error) into the real displacement, dL_pcal' (i.e. the "truth" that has no known systematic error):

          dL_pcal' = eps * dL_pcal                                                             (2)

     so, if "NOW" is the real, truth displacement estimate, dL_pcal',  and EARLIER is the "apparent" displacement, dL_pcal, then

                            NOW            TRUTH            dL_pcal'
           (1 + xi/100) =  ---------   =  ---------   =    --------    = eps.                  (3)
                           EARLIER        APPARENT          dL_pcal

     And thus, skipping a few of the steps shown in LHO aLOG 34153 for brevity, the "true" response function, R_pcal', (determined by the NOW, true displacement estimate by PCAL system) is related to the apparent, previously report response function, R_pcal, (determined by the the EARLIER PCAL system which had systematic error) is
      
           R_pcal' = eps * R_pcal = (1 + xi/100) * R_pcal                                      (4)


So how does this relate to the various metrics we have for calibration? 
    - How will this systematic error be included in uncertainty budgets? 
    - What does it mean for error in the amplitude of previously reported h(t)? 
    - What does that mean for the BNS range?

To do this, we have to invoke the nomenclature in T1900169 (which is why I switched from x_pcal to dL_pcal above):

     Equation 23 of T19000169 states that the uncertainty budget (e.g. LHO aLOG 52727)

             R_sample     ~      R_pcal            dL_pcal
             ---------    =   -----------    =   -----------                                   (5)
               R_MAP            R_pyDARM          h_GDS * L 

where R_MAP == R_pyDARM is a single response function calculated from the reference model parameters, and R_sample is the posterior distribution of numerically evaluated response functions based on sampling the previously determined uncertainty (and systematic error) on the model parameters, which should bee equivalent to the response function as measured directly by the PCAL, i.e. R_pcal. Via the math shown in Eq. (1) of T1900169, it can be shown that any ratio of response functions is equivalent to the ratio of displacement, and thus the last equivalence in Eq. (5) here.

But Eq. (5) is generic, and now we need to fold in the systematic error in PCAL; eps, or xi. For O3A, the denominators R_MAP, R_pyDARM, and h_GDS*L are now fixed. So, in order to reflect an error in dL_pcal, or R_pcal in to the ratio that we display for the uncertainty, R_sample / R_MAP, then we should *multiply* that ratio by eps = (1 + 100*xi):

             dL_pcal '      R_pcal '    eps * R_pcal          R_sample                    R_sample 
             ---------  = --------   =  ------------  = eps * --------   = (1 + xi/100) * ---------             (6)
            h_GDS * L      R_pyDARM       R_pyDARM              R_MAP                      R_MAP

which means that the reported h(t), h_GDS, is different from the truth, dL_pcal', by the following uncertainty and systematic error.

           dL_pcal' = eps * (R_sample/R_MAP) * h_GDS * L  = (1 + xi/100) * (R_sample/R_MAP) * h_GDS * L         (7)

or, if we had known these systematic errors and uncertainties ahead of time, we might say that the "real" "truth" strain amplitude, h_GDS', can be computed from the reported strain stored in the frames, h_GDS,

           h_GDS' = eps * (R_sample/R_MAP) * h_GDS  =  (1 + xi/100) * (R_sample/R_MAP) * h_GDS                  (8)

And, assuming no signal, the amplitude spectral density of h_GDS, the sensitivity of the detector, call it ASD_GDS, can be used to define that the "truth" BNS range, r', is related to the "apparent" or "reported" BNS range, r, by the following:
                    { f_max
          r' =  C * |       [ ASD_GDS' ]^{-1} * f^{-7/6}  df
                    } f_min

                    { f_max
              = C * |        [ eps * (R_sample / R_MAP) * ASD_GDS ]^{-1} * f^{-7/6} df
                    } f_min

                 1         { f_max
              = ---- * C * |        [ (R_sample / R_MAP) * ASD_GDS ]^-1 * f^(-7/6) df
                eps        } f_min

                 1                1 
           r' = ----  * r = ------------ * r                                                                    (9)
                eps         (1 + xi/100)

where, for brevity, the integrated (R_sample / R_MAP) has been dropped on the last line, because in the case where we're only considering a scalar systematic error, the integrand of (R_sample / R_MAP) * ASD_GDS is the same for both r' and r. 
This would not be true for a frequency dependent systematic error (either in PCAL or in any other component of R_sample/R_MAP).


So, depending on whether eps is greater or less than 1, or if xi is positive or negative, then 
- the uncertainty budget will have a corresponding multiplicative "offset" from unity magnitude, i.e. the "uncertainty budget" plot of R_sample / R_MAP should show a magnitude wiggling around (1 + eps),
- the reported strain amplitude has been wrong by a multiplicative factor of eps,
- the reported sensitivity, i.e. the ASD of the reported strain has been wrong by a multiplicative factor of eps, and
- the reported range has been wrong by by a multiplicative factor of (1 / eps),

So: 
- if eps > 1, or xi > 0, then 
    - if we don't correct the data, then the median line in the uncertainty budget goes up in magnitude, or, 
    - if we were to correct the live data stream (which we will not for O3A), the strain (and noise) amplitude gets larger, the ASD gets worse (less sensitive), and the range goes down.  
- if eps < 1, or xi < 0, then
    - if we don't correct the data, then the median line in the uncertainty budget goes down in magnitude, or, 
    - if we were to correct the live data stream (which we will not for O3A), the strain (and noise) amplitude gets smaller, the ASD gets better (more sensitive), and the range goes up.  
Comments related to this report
ling.sun@LIGO.ORG - 16:27, Friday 01 November 2019 (52897)

According to Rick, Dripta, and Jeff, the numbers to be applied to O3a are:

                               unc        sys (xi)         sys (eps)
LHO EY RXPD      0.54%      +0.42%          1.0042
LLO EY RXPD      0.54%      +0.31%          1.0031

The RRNom changes are as below. (Note: valid GPS time for this correction is set to be chunk 2+3)

Index: RRNom.py
===================================================================
--- RRNom.py    (revision 8656)
+++ RRNom.py    (working copy)
@@ -172,11 +172,23 @@
 # FIXME: Check clipping in O1/O2 (e.g., alog LHO 36884)
 # clipCorrection = hfile['Clipping/ClipFactor'].value
 # We believe in O3 there's no clipping, so set the correction to 1.
-clipCorrection = 1.0
+# O3a: Jun 11 2019 16:57:18 UTC -- Oct 01 2019 16:23:10 UTC, add Pcal sys error
+# It should apply to all O3a, but we do not correct for the released chunk1 before Jun 11
+if run == 'O3' and args.gpsTime >= 1244307456 and args.gpsTime <= 1253982208:
+    if args.IFO == 'LHO':
+        clipCorrection = 1.0042
+    else:
+        clipCorrection = 1.0031
+else:
+    clipCorrection = 1.0

 # TODO: update the value when more measurements are taken
 # In O3, the optimistic lower limit is 0.5% (G1900395 Page 14)
-PCALSystUnc = 0.0079
+# It should apply to all O3, but we do not correct for the released chunk1 before Jun 11
+if run == 'O3' and args.gpsTime >= 1244307456:
+    PCALSystUnc = 0.0054
+else:
+    PCALSystUnc = 0.0079

 # -------------------------------------------------------
 # Create the nominal model using model file
@@ -670,7 +682,7 @@
     thisRR = responseFunc(thisSenseTheta, thisActUIMTheta, thisActPUMTheta, thisActTSTTheta, \
                           thisCCSyst, thisAUSyst, thisAPSyst, thisATSyst, ff, True, \
                           thisKU, thisKP, thisKT, thisKC, thisFC, thisSenseTheta[2], thisSenseTheta[3], \
-                          'all', thisPcalSystErr, clipCorrection)
+                          'all', thisPcalSystErr, 1.0)


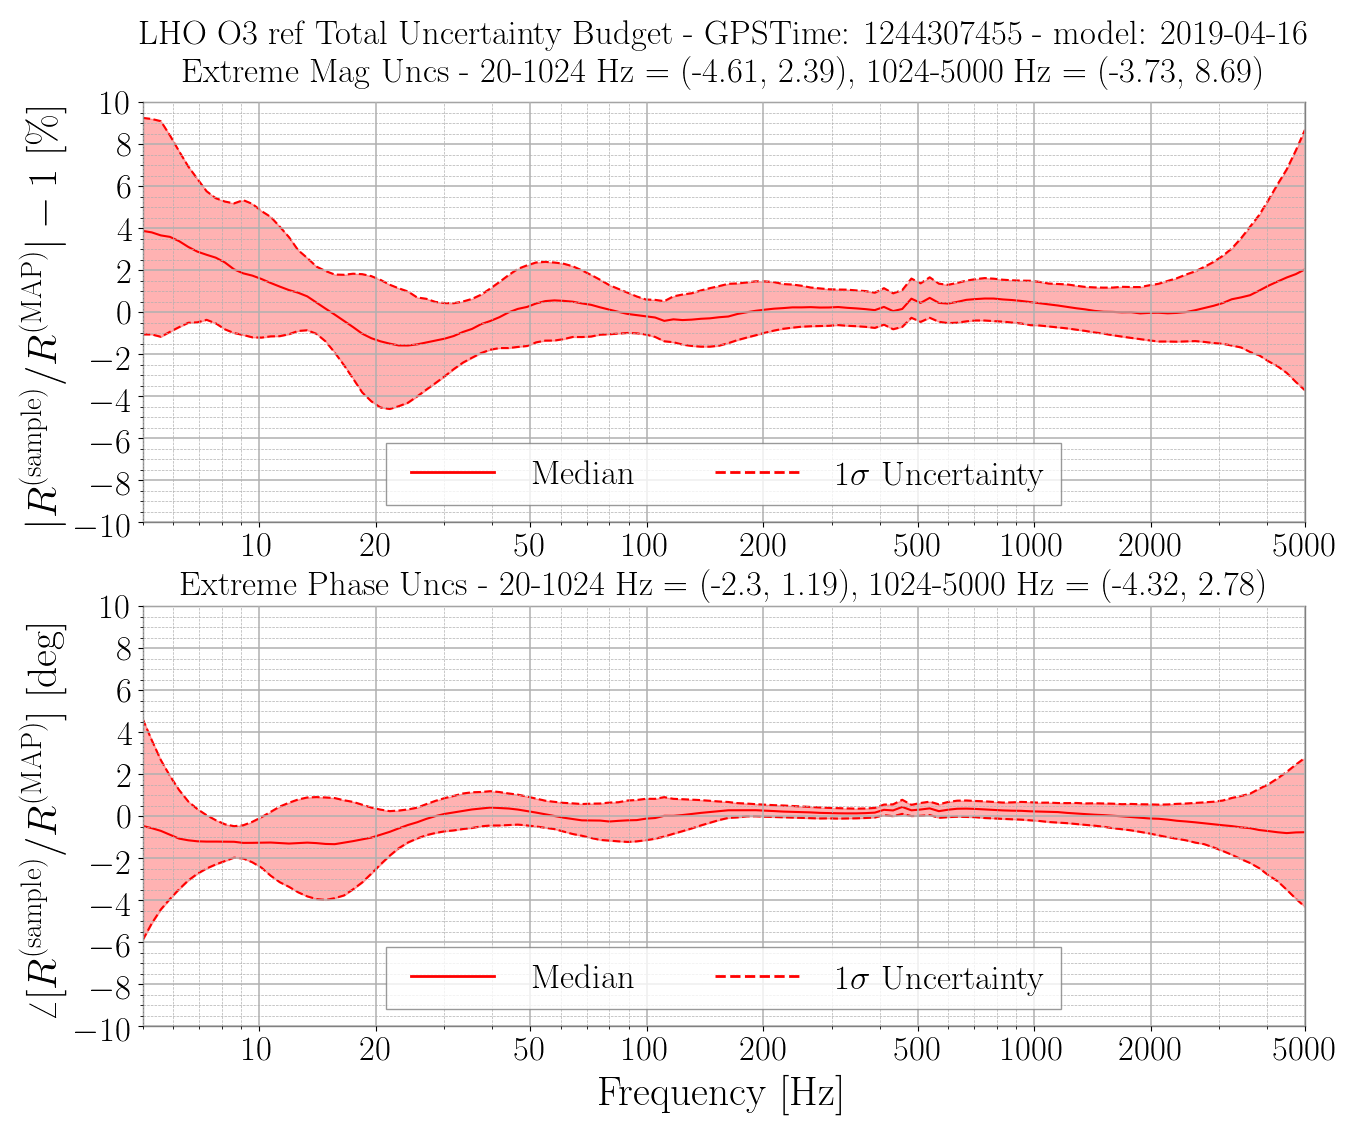
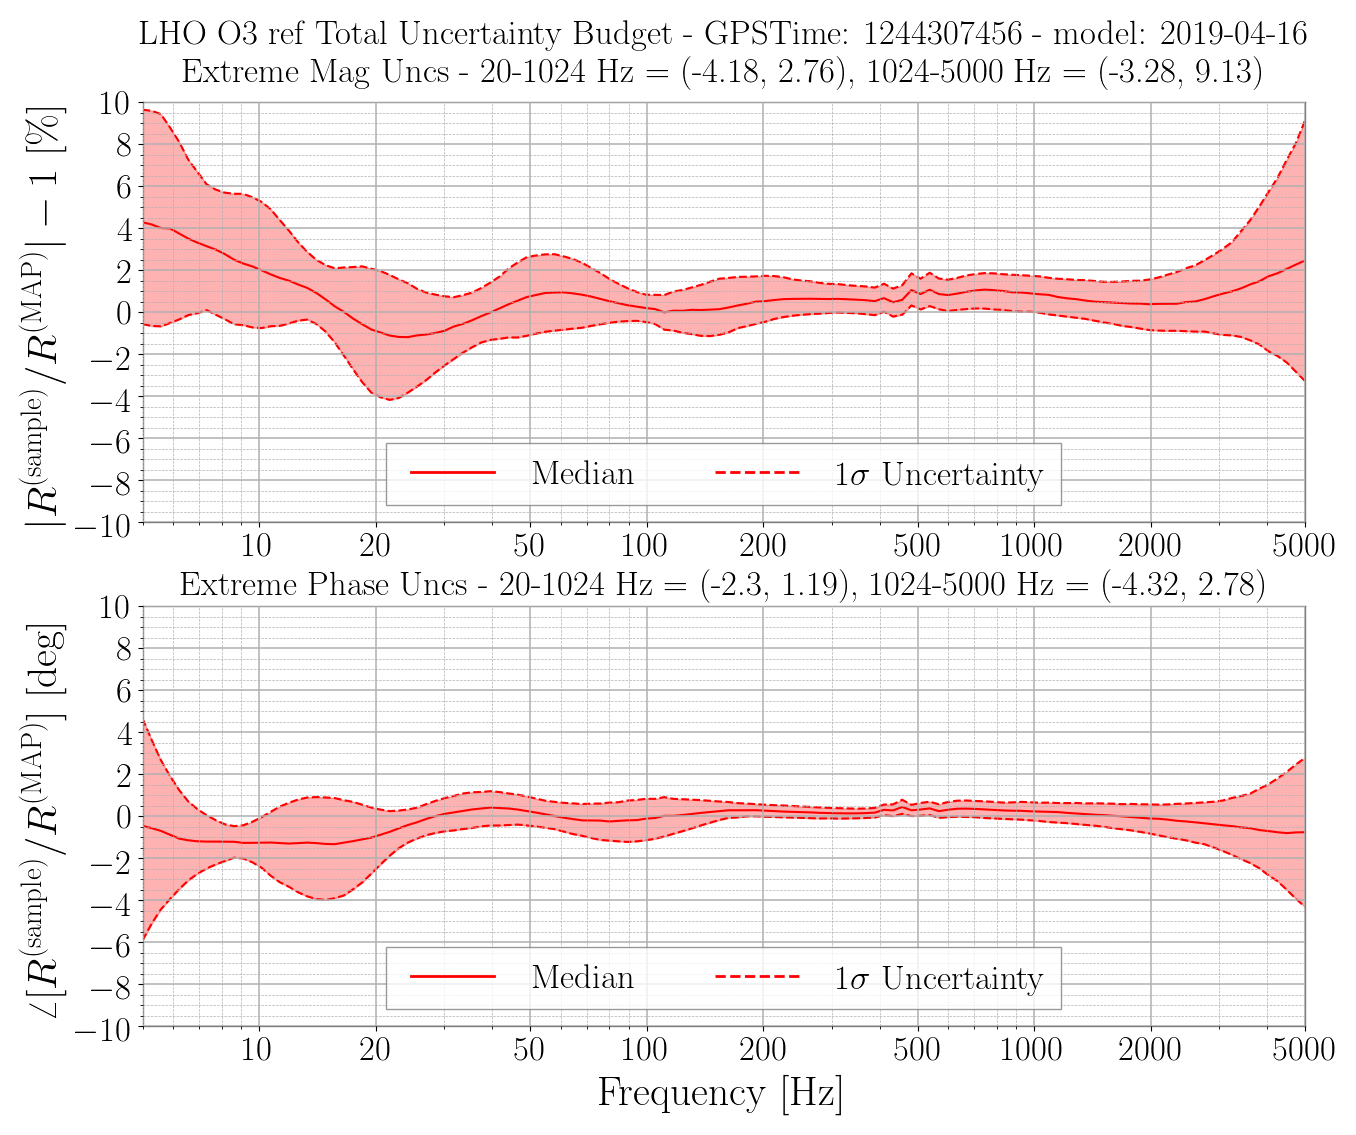
The two attached plots shows the comparison before (old.png) and after (new.png) the PCAL corrections. The commands for generating these plots are:

OLD:

python /home/ling.sun/aligocalibration/trunk/Common/pyDARM/RRNom.py --IFO=LHO --HDF5_A_MCMCresults=/home/ling.sun/aligocalibration/trunk/Runs/O3/H1/Results/Uncertainty/O3_H1_A_MCMC_20190404.hdf5 --HDF5_A_GPRresults=/home/ling.sun/aligocalibration/trunk/Runs/O3/H1/Results/Uncertainty/O3_H1_A_GPR_20190416_meas0327-0925.hdf5 --HDF5_C_MCMCresults=/home/ling.sun/aligocalibration/trunk/Runs/O3/H1/Results/Uncertainty/O3_H1_C_MCMC_20190404.hdf5 --HDF5_C_GPRresults=/home/ling.sun/aligocalibration/trunk/Runs/O3/H1/Results/Uncertainty/O3_H1_C_GPR_20190416_meas0328-0828_withHFafter0611_nofsQcorr_fmin30Hz_lengthscaleZp5.hdf5 --modelPath=/home/ling.sun/aligocalibration/trunk/Runs/O3/H1/params/ --modelFilename=modelparams_H1_20190416 --IFOmodel=modelPars --sampleNumber=1000 --seed=1111 --version=ref --outDir=/home/ling.sun/tmpUnc/  --plot1SigmaUncs --saveSummaries --gpsTime=1244307455

NEW:

python /home/ling.sun/aligocalibration/trunk/Common/pyDARM/RRNom.py --IFO=LHO --HDF5_A_MCMCresults=/home/ling.sun/aligocalibration/trunk/Runs/O3/H1/Results/Uncertainty/O3_H1_A_MCMC_20190404.hdf5 --HDF5_A_GPRresults=/home/ling.sun/aligocalibration/trunk/Runs/O3/H1/Results/Uncertainty/O3_H1_A_GPR_20190416_meas0327-0925.hdf5 --HDF5_C_MCMCresults=/home/ling.sun/aligocalibration/trunk/Runs/O3/H1/Results/Uncertainty/O3_H1_C_MCMC_20190404.hdf5 --HDF5_C_GPRresults=/home/ling.sun/aligocalibration/trunk/Runs/O3/H1/Results/Uncertainty/O3_H1_C_GPR_20190416_meas0328-0828_withHFafter0611_nofsQcorr_fmin30Hz_lengthscaleZp5.hdf5 --modelPath=/home/ling.sun/aligocalibration/trunk/Runs/O3/H1/params/ --modelFilename=modelparams_H1_20190416 --IFOmodel=modelPars --sampleNumber=1000 --seed=1111 --version=ref --outDir=/home/ling.sun/tmpUnc/  --plot1SigmaUncs --saveSummaries --gpsTime=1244307456

Images attached to this comment
H1 SQZ
daniel.sigg@LIGO.ORG - posted 15:05, Thursday 31 October 2019 (52841)
Squeezer Intensity Noise Stabilization Servos

Nutsinee Marc Daniel

This is a characterization of the intensity noise stabilization servos for the OPO pump and the CLF beam. During these measurements the OPO was locked with 690nW in transmission, whereas CLF photodetector in reflection showed 120µW of light.

The first plot shows the transfer function of the OPO ISS. The configuration was 31dB gain, positive sign, 40/2kHz boost, setpoint at -2.5V, and the control at 7.4V. The ugf is about 20kHz.

The second plot shows the transfger function of the CLF ISS. The configuration was 16dB gain, negative sign, 40/2kHz boost, setpoint at 1.010V, and the control at 5.83V. The ugf is about 15 kHz. Some gain peaking is visible.

The third plot shows the relative intensity noise on the OPO TRANS photodetector with the ISS on and off. We reach shot noise limited performance everywhere >10Hz. Not sure what the excess noise is at low frequencies.

The forth plot shows the relative intensity noise on the CLF REFL photodetector with the CLF ISS on and off, while the OPO ISS is on.

The fifth plot shows the relative voltage noise on the CLF I channel (we lock on Q) with the ISS on and off. This signal doesn't seem to care about the ISS.

Non-image files attached to this report
H1 SQZ (SQZ)
nutsinee.kijbunchoo@LIGO.ORG - posted 14:51, Thursday 31 October 2019 - last comment - 16:18, Thursday 31 October 2019(52840)
SQZ pump input to OPO set to non-linear gain of 2.5

At a non-linear gain of ~2.3 is where I believe we were operating during O3a. Lee accidently made the range better with normalized OPO transmission of 1 but forgot to adjust the temperature to optimize the nlg, this could mean we are better off operating at low pump power. The pump power is now set to NLG of 2.5. This corresponds to the normalized transmission value of 0.67, pump input to the coupler is 7.3mW, 3.8mW reflected when OPO is unlocked. To be able to engage the OPO ISS I had to throw away about half the power with the half wave plate.

Let's start SQZ optimization from here.

Comments related to this report
daniel.sigg@LIGO.ORG - 16:18, Thursday 31 October 2019 (52844)

We changed the normalization of the OPO TRANS PD from 122uA to 262uA, or by a factor of 2.15. The new normalized value of 0.67 corresponds to 1.44 times the pump power in the OPO during O3a.

H1 TCS
thomas.shaffer@LIGO.ORG - posted 14:39, Thursday 31 October 2019 (52839)
HWS Look Post Break

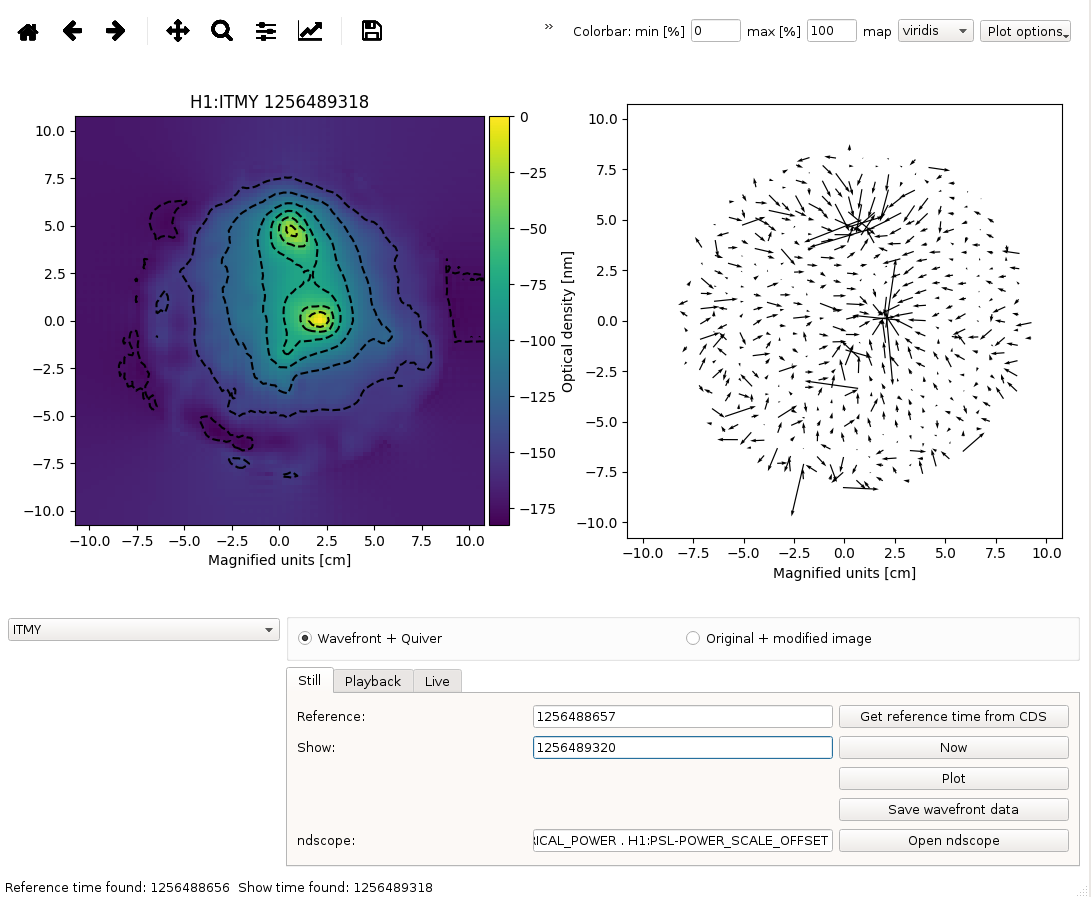
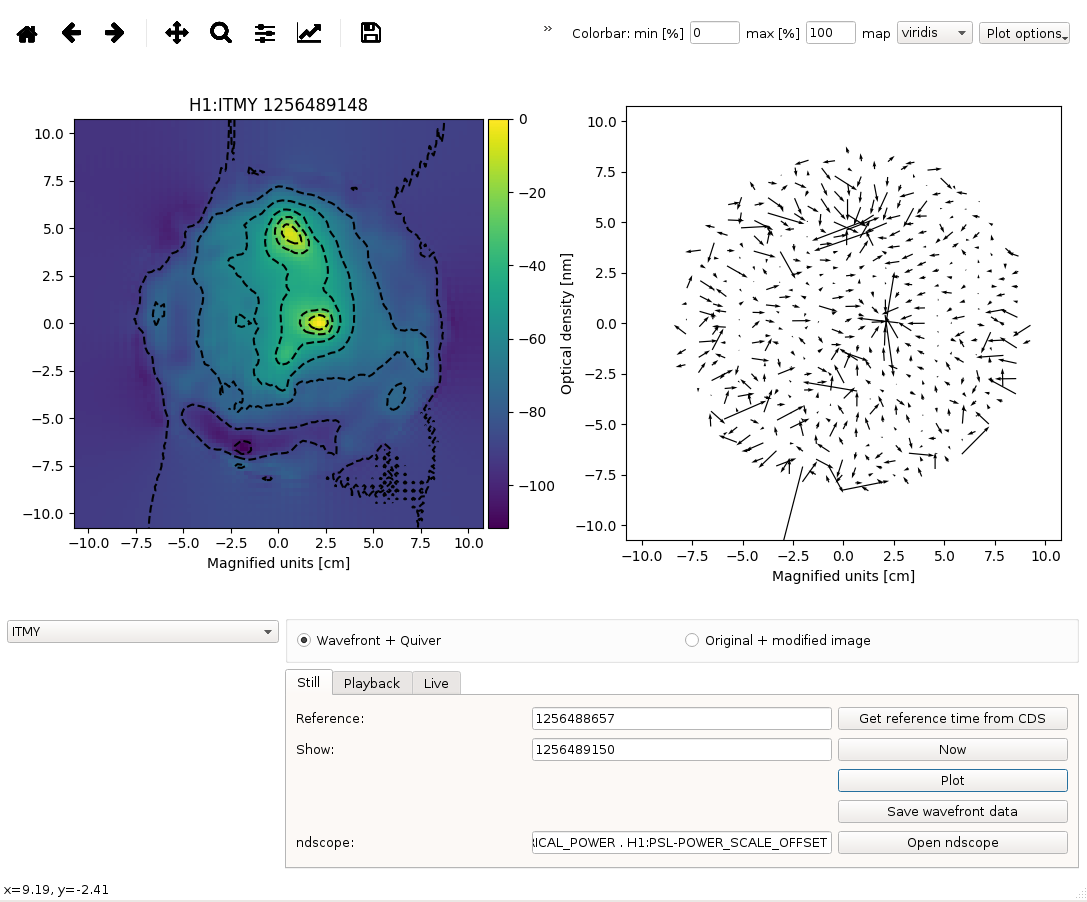
Looking at Aidan's LLOalog49535 scared me, so I went to see if I could see anything new on our test masses. I used the power up that starts at 1256488785 and ends at 40W at 1256489202. My reference was before the power up and I looked at a few spots during, and after power up. Overall, I couldn't obtain enough detail in the images to make any statements. I felt that I should post something here regardless.


ITMY has the known largest point absorbers, as Aidan details in LHOalog52032. I wasn't able to get the detail that he did in that alog, so I was only able to clearly see 2 of the 6 known point absorbers. Below is a few minutes after we reached 40W


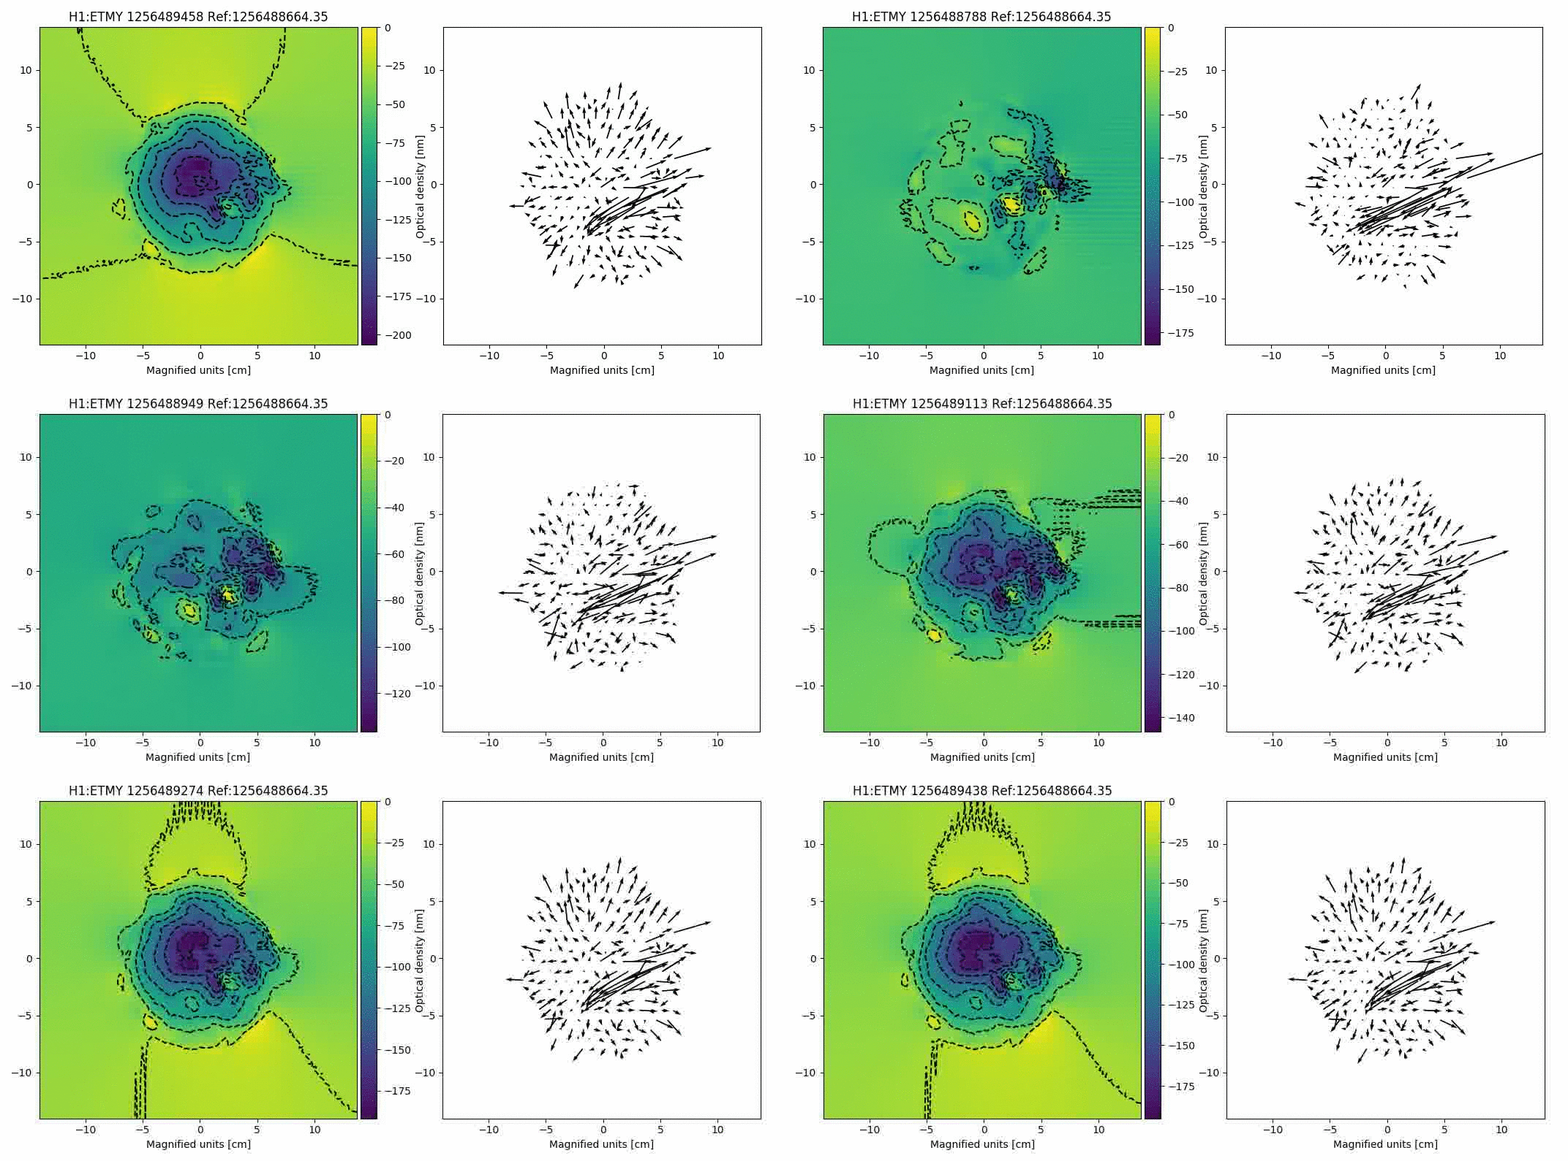
ETMY still doesn't look good. There is still a flipped sign reversing the optical density in these images, but even with that aside, something else must be wrong. In the below gif you can see some sort of heating going on, but what looks to be the point absorbers are in a straight line. Unlikely.


ITMX still has some invaccuum clipping going on, so we are unable to get images for that optic. ETMX didn't seem to be giving me anything that I could understand either. This is part of the motivation for the new source at EY.


Images attached to this report
H1 SQZ
daniel.sigg@LIGO.ORG - posted 10:32, Thursday 31 October 2019 - last comment - 15:40, Thursday 31 October 2019(52832)
OPO length noise

Nutsinee, Daniel

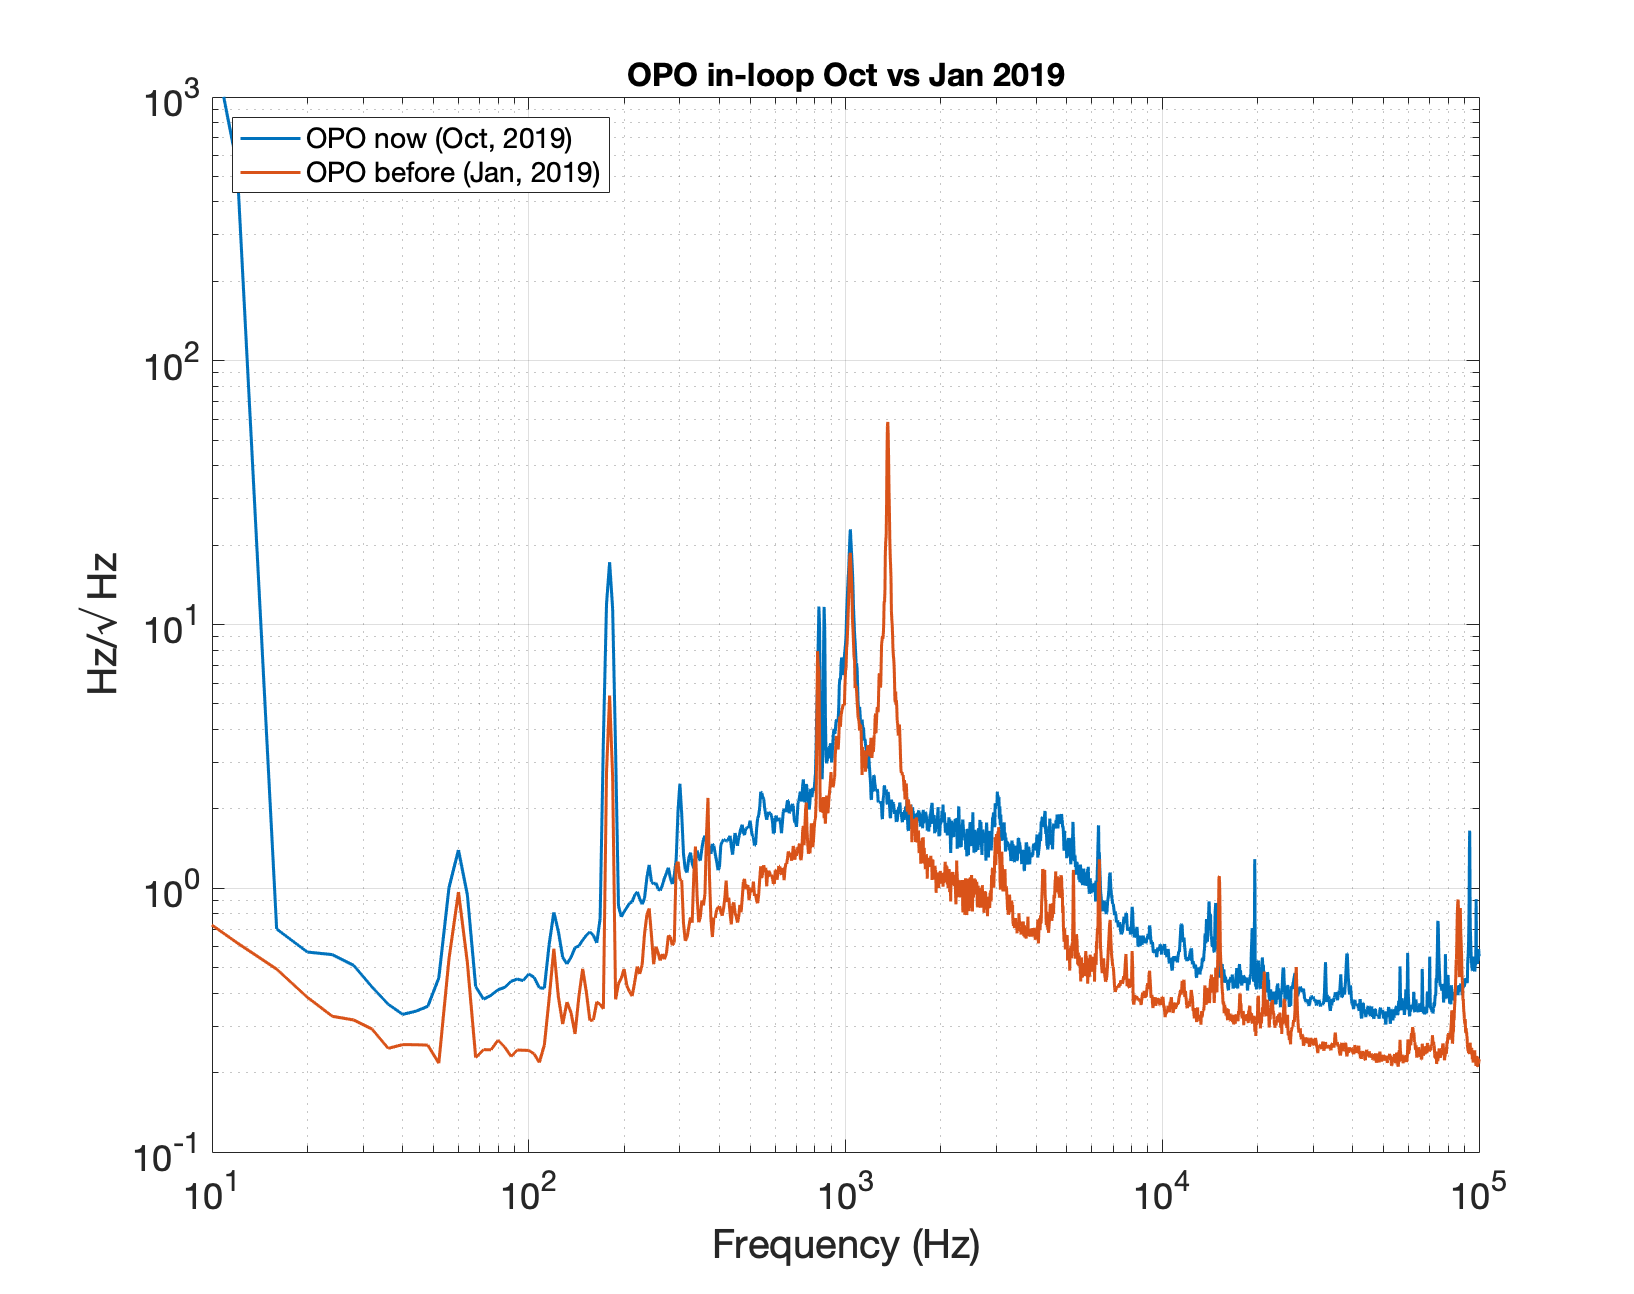
When we remeasured the OPO length noise, we noticed that the second of our two peaks at 1 and 1.4kHz was gone. We traced this back to the maintenance day on 4/9/2019.

During this Tuesday we changed the laser current (alog 48361) and replaced a few pieces of electronics (alog 48353). At this point, I suspect the PZT driver.

Comments related to this report
nutsinee.kijbunchoo@LIGO.ORG - 15:40, Thursday 31 October 2019 (52842)

Attached the quick OPO in-loop measurement from January and now (October). Not sure what's going on with the overall higher noise. It's likely that I don't know the old calibration all that well. 


Images attached to this comment
Displaying reports 37801-37820 of 89089.Go to page Start 1887 1888 1889 1890 1891 1892 1893 1894 1895 End