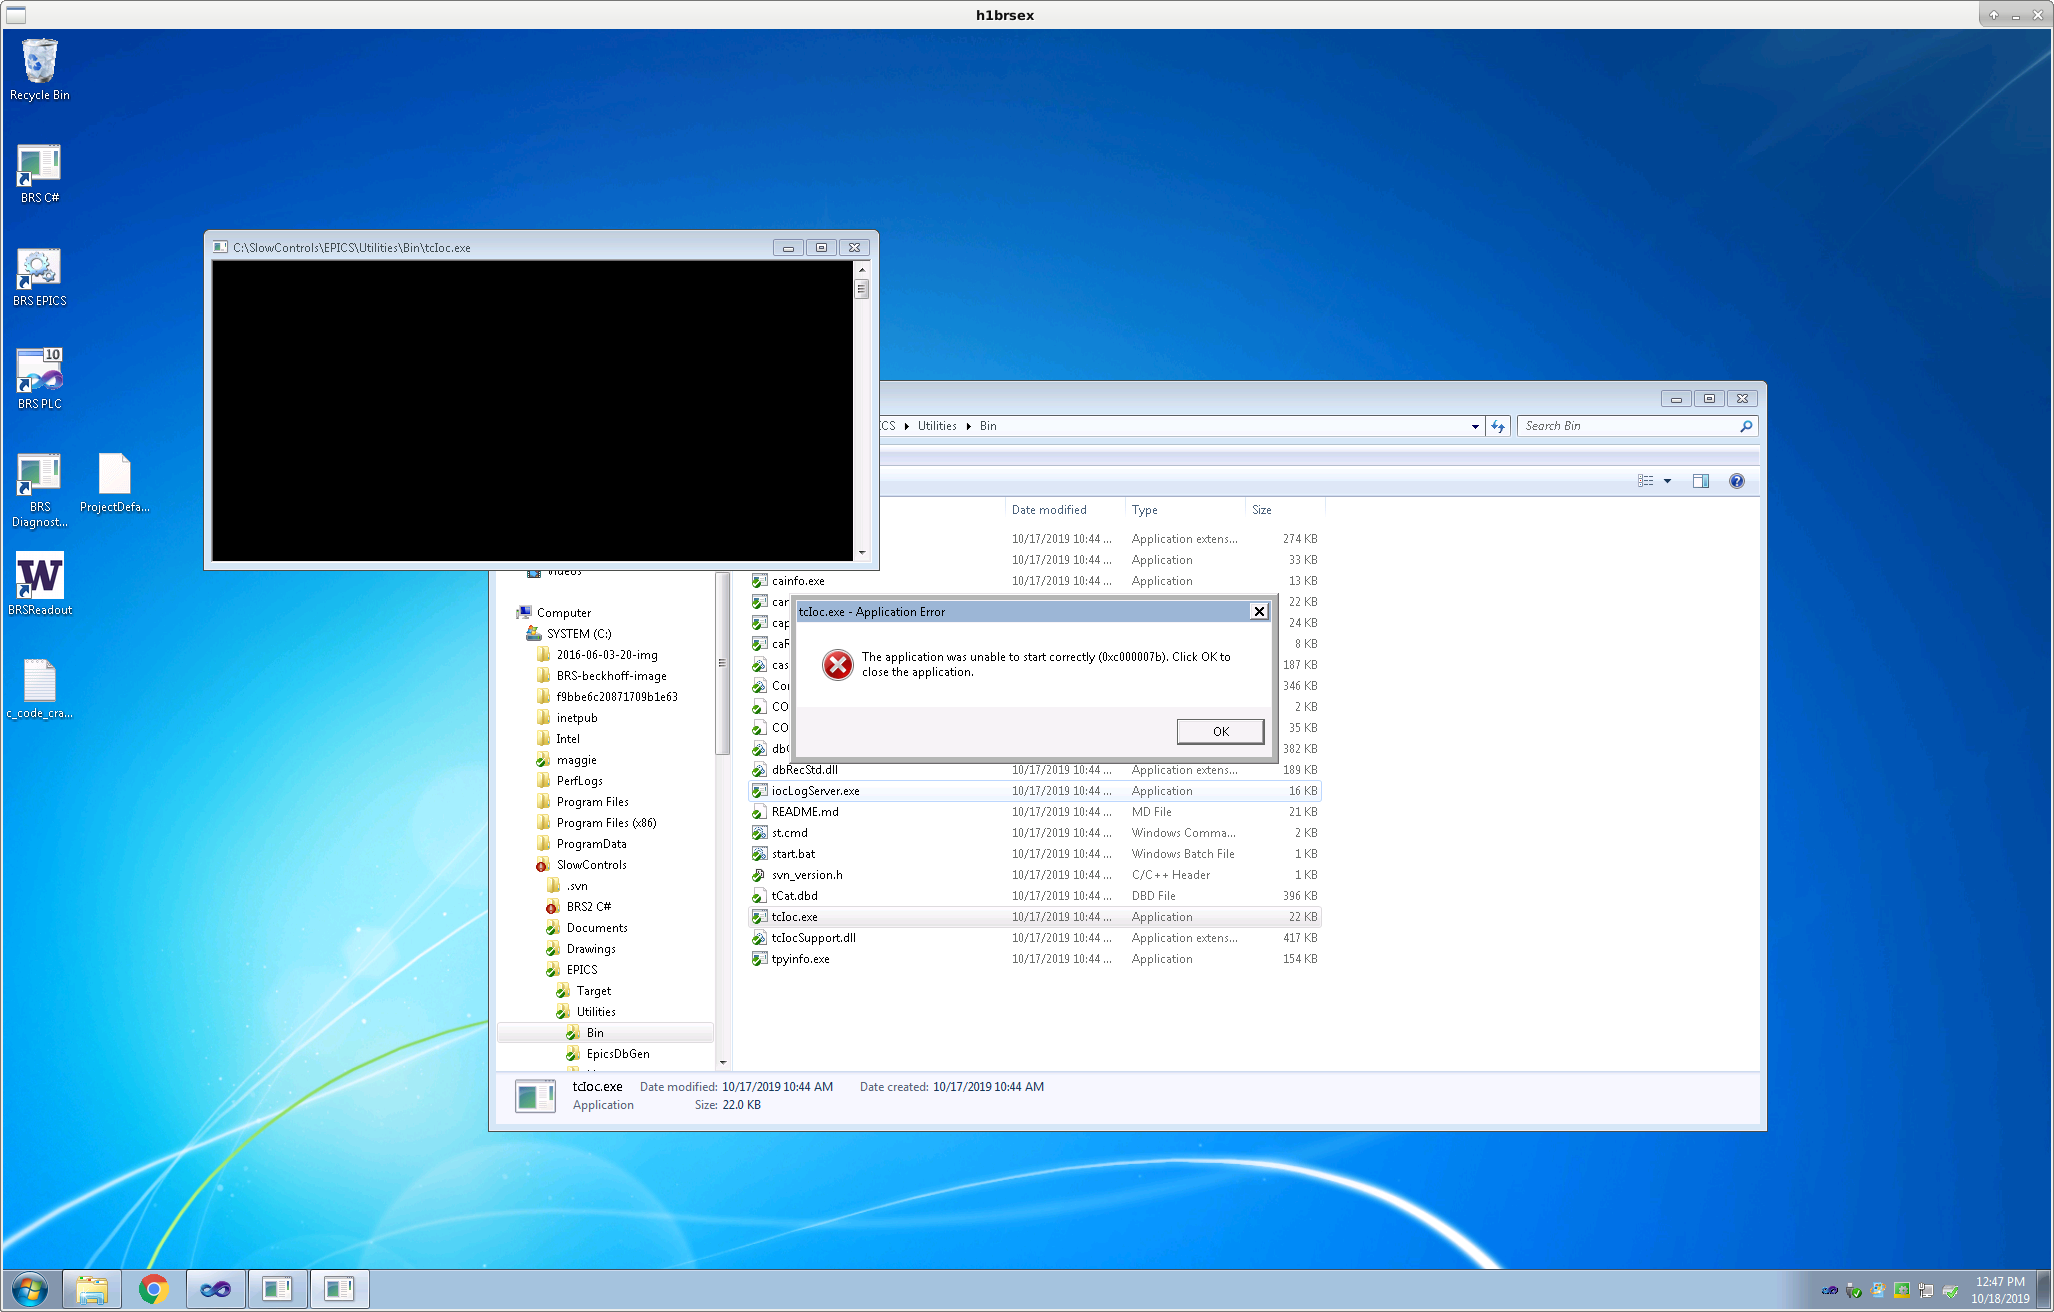
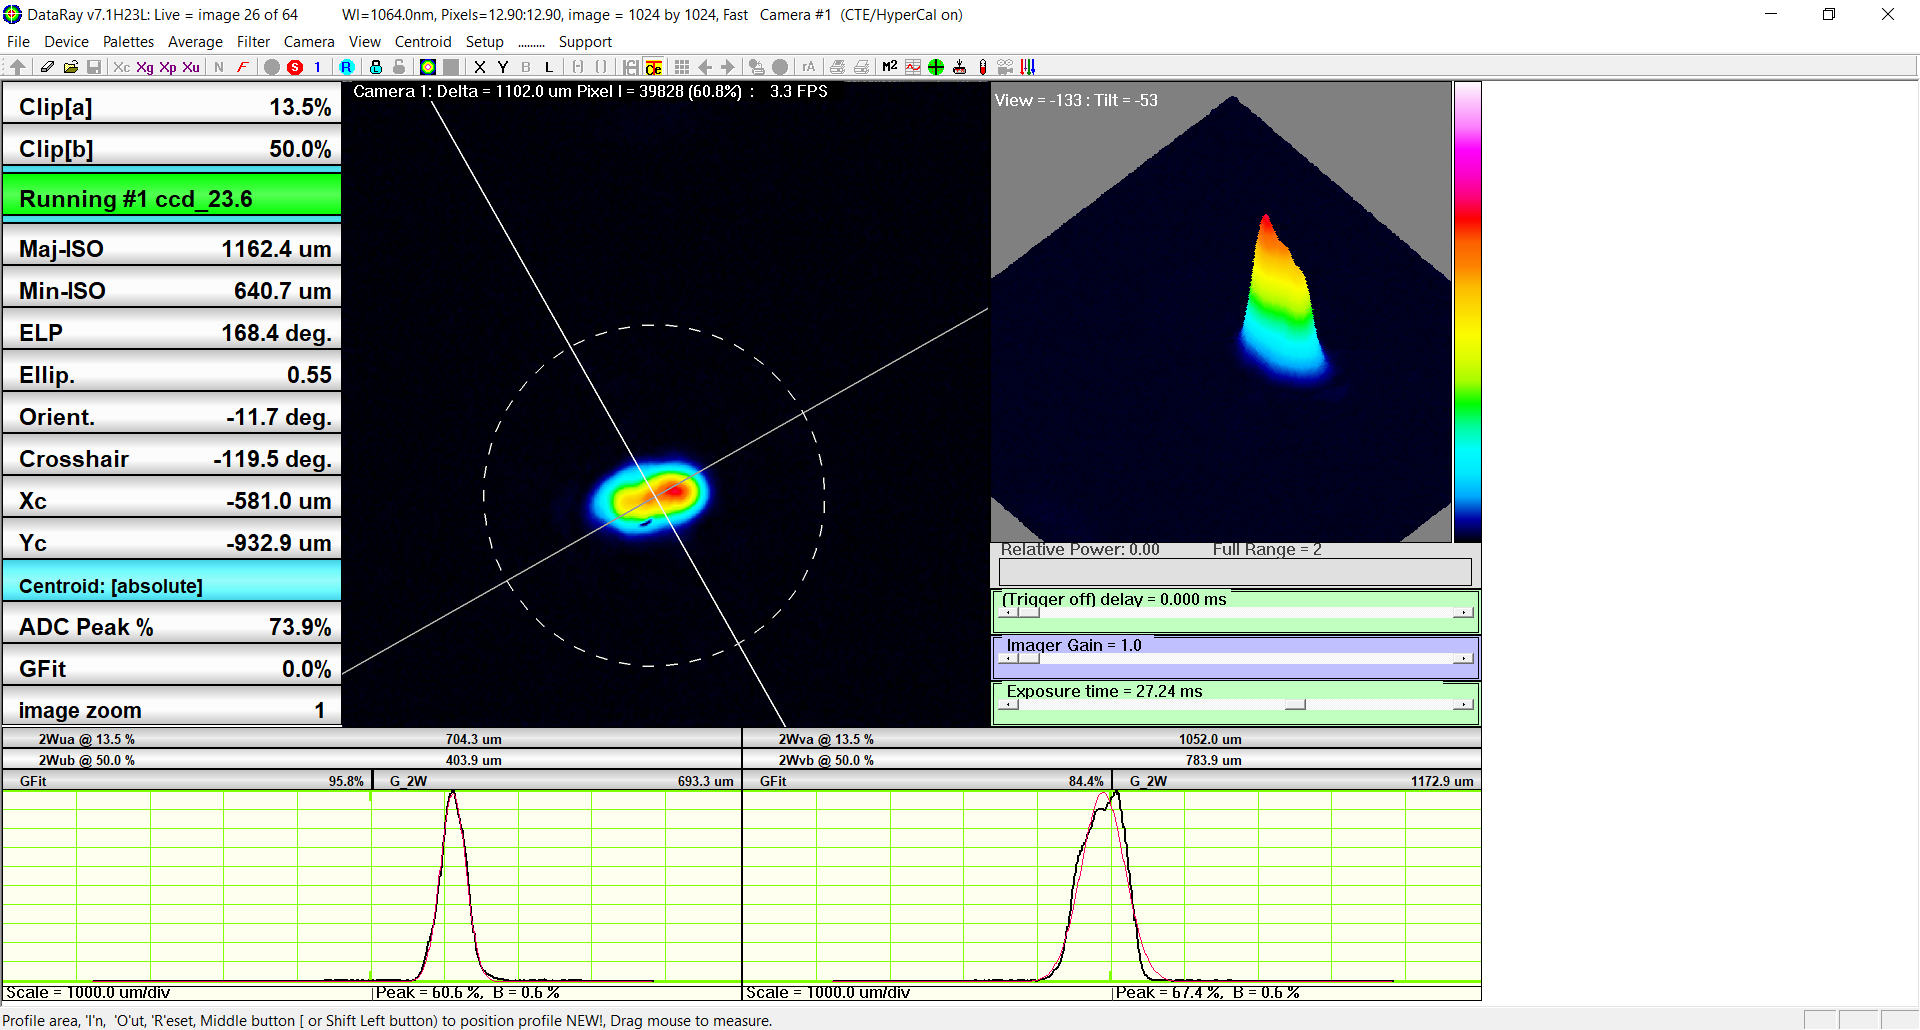
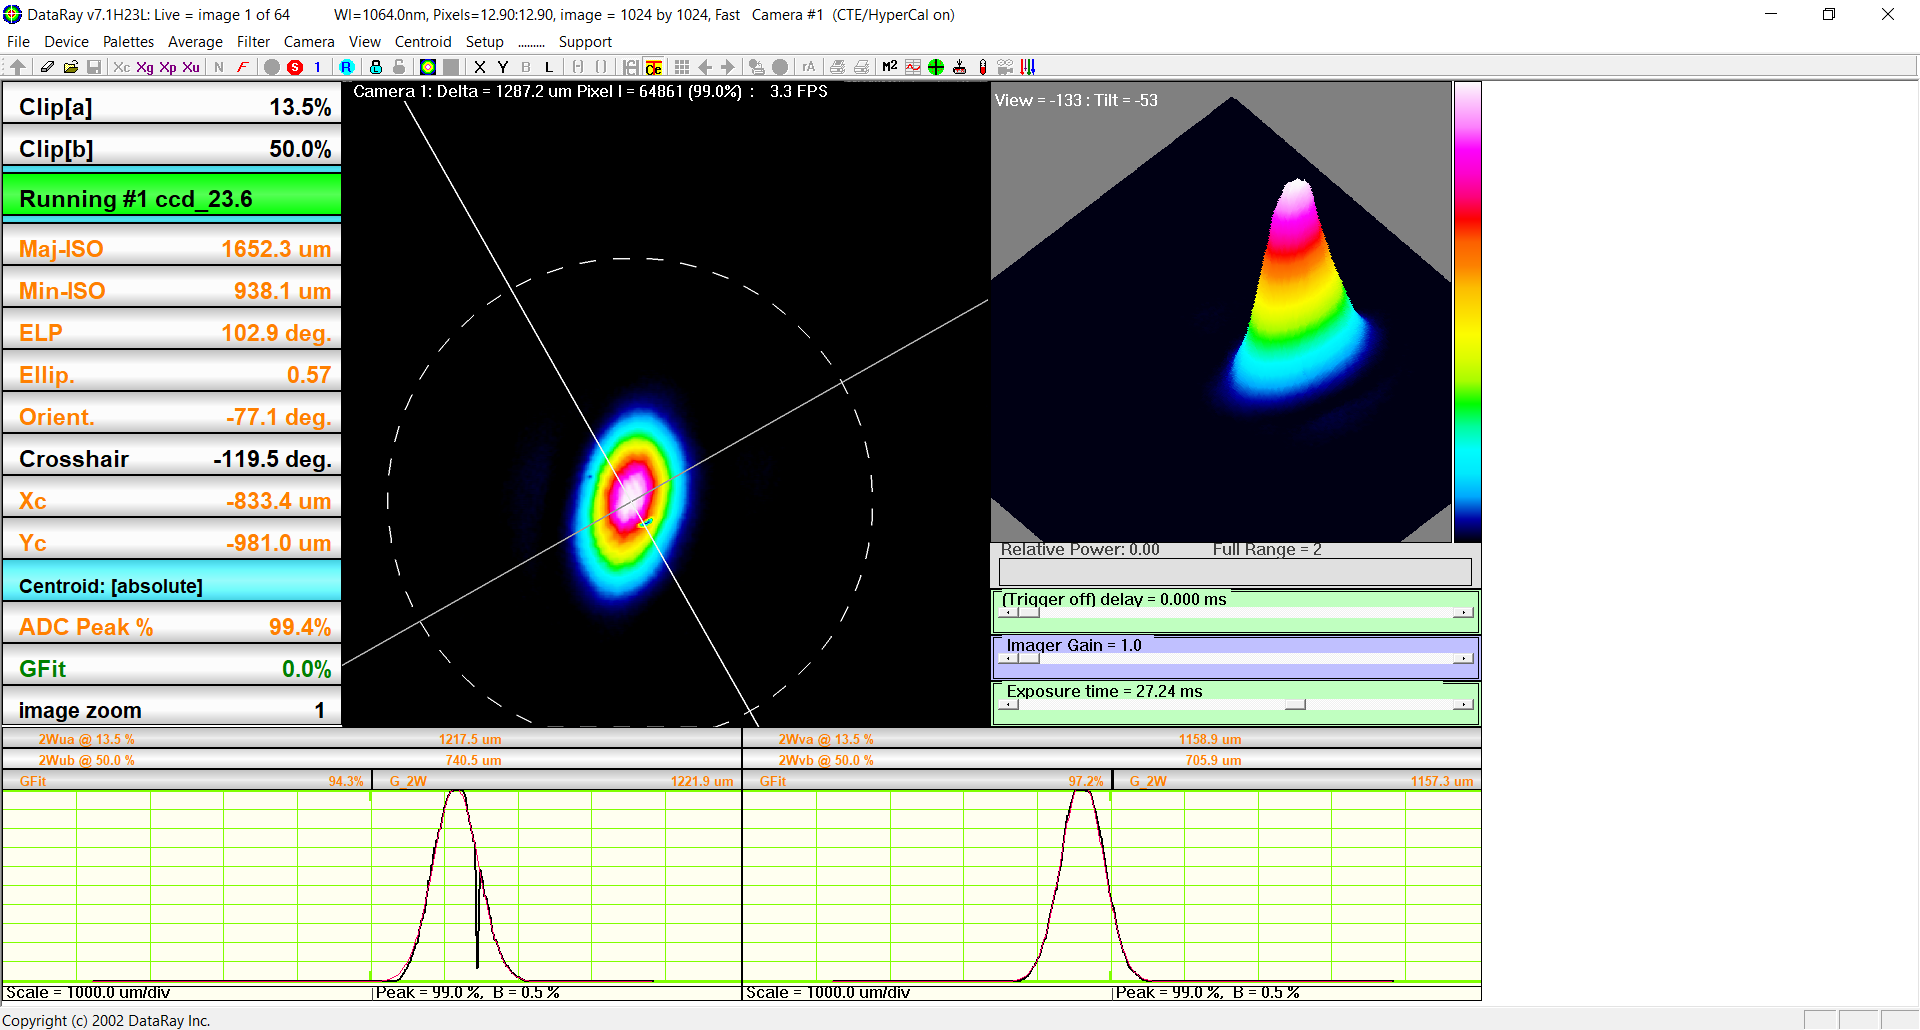
Oct. 18 - 22 2019 h1brsex: After I ran svn update on C:\SlowControls the applications in trunk/EPICS/Utilities/Bin gave the error in the attached screenshot. I have reverted the working copy of this directory to revision 4189 to get the EPICS IOC to run. I scanned for the Beckhoff terminals that Filiberto installed and added them to the IO in the solution. I added the PLC variables and code for the addition of the heater and linked the variables to the added IO terminals as instructed by Eyal. There was some confusion because the size of the HEATCTRLOUT PLC variable and the EL4134 channel it links to do not match. Only the first 16 bits of the PLC variable are linked. I removed from svn the files in trunk/TwinCAT3/BRS/H1BRSEX that are automatically generated. I fixed the paths in brsxEPICS.bat and brsxEPICS.cmd. These were pointing to an old copy of the code that is not in svn. I added lines to brsxEPICS.cmd to generate the ini and req files. I installed WinSCP and copied the generated ini and req files to /opt/rtcds/userapps/release/ecat/h1brsex. h1brsey: I ran svn update. On this computer the applications in trunk/EPICS/Utilities/Bin ran without error. The additional Beckhoff terminals have not yet been connected at this station so I only added the PLC code. I removed from svn the files in trunk/TwinCAT3/BRS/H1BRSEY that are automatically generated. I changed the names of the ini and req files in brsyEPICS.cmd to h1brsey.ini and h1brsey.req. I installed WinSCP and copied the generated ini and req files to /opt/rtcds/userapps/release/ecat/h1brsey.
Added terminals and links for h1brsey.
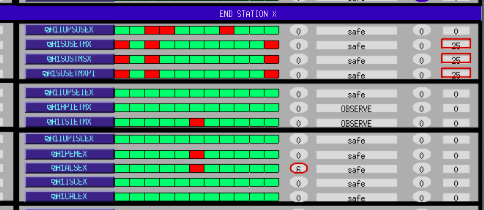
TITLE: 10/22 Day Shift: 15:00-23:00 UTC (08:00-16:00 PST), all times posted in UTC STATE of H1: Planned Engineering LOG: h1susex down upon arrival 14:53 UTC Karen to end Y 14:58 UTC Set SEI_CONF to SC_OFF_NOBRSXY 15:08 UTC Jeff B. to LVEA to retrieve dust monitors and contamination control kits 15:15 UTC Paradise Water through gate 15:22 UTC Jeff B. back 15:30 UTC Vanessa to mid X and end X 15:41 UTC Dave investigating h1susex 15:44 UTC Dave restarting h1susex 15:49 UTC DOE well sampling through gate 15:52 UTC Timesh to end X for NCAL drilling 15:57 UTC Dave power cycling h1susex after taking out of Dolphin 15:59 UTC Karen done at end Y 16:10 UTC Christina driving down arms to collect Norco receipts 16:17 UTC Dave done bringing h1susex back 16:23 UTC Timesh back 16:30 UTC Corey to optics lab 16:35 UTC I started work on h1brsey 16:40 UTC Ken to LVEA looking for ladder 16:40 UTC Travis to cleaning area, putting plastic box back 16:44 UTC Filiberto re-enabling HAM6 HV 16:46 UTC Travis back 16:54 UTC HV back on 16:55 UTC DOE is done well testing 17:04 UTC Vanessa done at mid and end X, going to LVEA 17:11 UTC Karen to LVEA 17:11 UTC LN2 delivery 17:40 UTC Nutsinee to squeezer area 17:41 UTC Tyler at end X starting drilling for NCAL 17:42 UTC Timesh to end X 17:51 UTC Niko to optics lab 17:59 UTC Georgia and Keita to end Y 18:00 UTC Niko out of optics lab 18:29 UTC Chris to LVEA to retrieve rotohammer 18:28 UTC Dave restarting TCS model 18:31 UTC Jim taking corner BSCs offline in prep for model restarts 18:32 UTC Dave, Jim restarting h1isiitmy, h1isibs, h1isiitmx 18:43 UTC DAQ restart 19:08 UTC Ken to LVEA looking for extension ladder 19:16 UTC Dan to ISCT1 to retrieve equipment Greg: DMT OS upgrade WP 8435 19:53 UTC Keita and Georgia back 20:05 UTC Richard and Ken to LVEA to search for ladder 20:08 UTC Corey and Hugh to HAM7 20:08 UTC Filiberto to end Y (WP 8440) 20:12 UTC Richard and Ken back 20:16 UTC Nutsinee to squeezer bay 20:16 UTC Phillipe and Ian to end stations, magnetic coils 20:18 UTC Dave to end Y 20:40 UTC Dave back from end Y 21:29 UTC Corey back from LVEA 21:48 UTC Hugh back from LVEA 21:58 UTC Dan to ISCT1, installing equipment for phase camera 22:03 UTC Tyler done 22:11 UTC Timesh and Gavin to end X to bolt NCAL anchor in place 22:27 UTC Kyle called to report that the rooms he has been in appear warmer than usual 22:30 UTC Nutsinee back. Dave restarting DAQ. 23:06 UTC Phillipe and Ian back
New BSC ISI, SEIPROC and CALCS models
Jenne, Jim, Dave:
New models were installed for h1isiitmx, h1isibs, h1isiitmy, h1seiproc, h1calcs. A DAQ restart was required.
WP8309 Removal of temporary TCS fast channels
Dave:
I modified TCS_MASTER.mdl to remove the eight temporary 2kHz channels for the CO2_QPD_B segments (four segments for each itm). DAQ restart was required
DAQ Restart
Dave:
I restarted the DAQ for today's model changes. We thought about adding the new BRS-EX and EY channels but ran out of time for today's restarts.
WP8435 DMT OS upgrade, Scientific Linux 7.7
Greg:
Upgrading the OS on the production machines h1dmt[0,1,2]. Note that h1dmt3 (test machine) was upgraded some weeks ago.
mid afternoon we had one more round of h1seiproc model changed followed by a DAQ restart.
During this morning's h1susex remote power cycle I discovered that h1susey's management port was not working. I did the following to diagnose and fix it:
No idea why the mgt board gummed up like this, with link lights on the ethernet port but no service, but luckily a cold reset fixed it.
Keita, Georgia
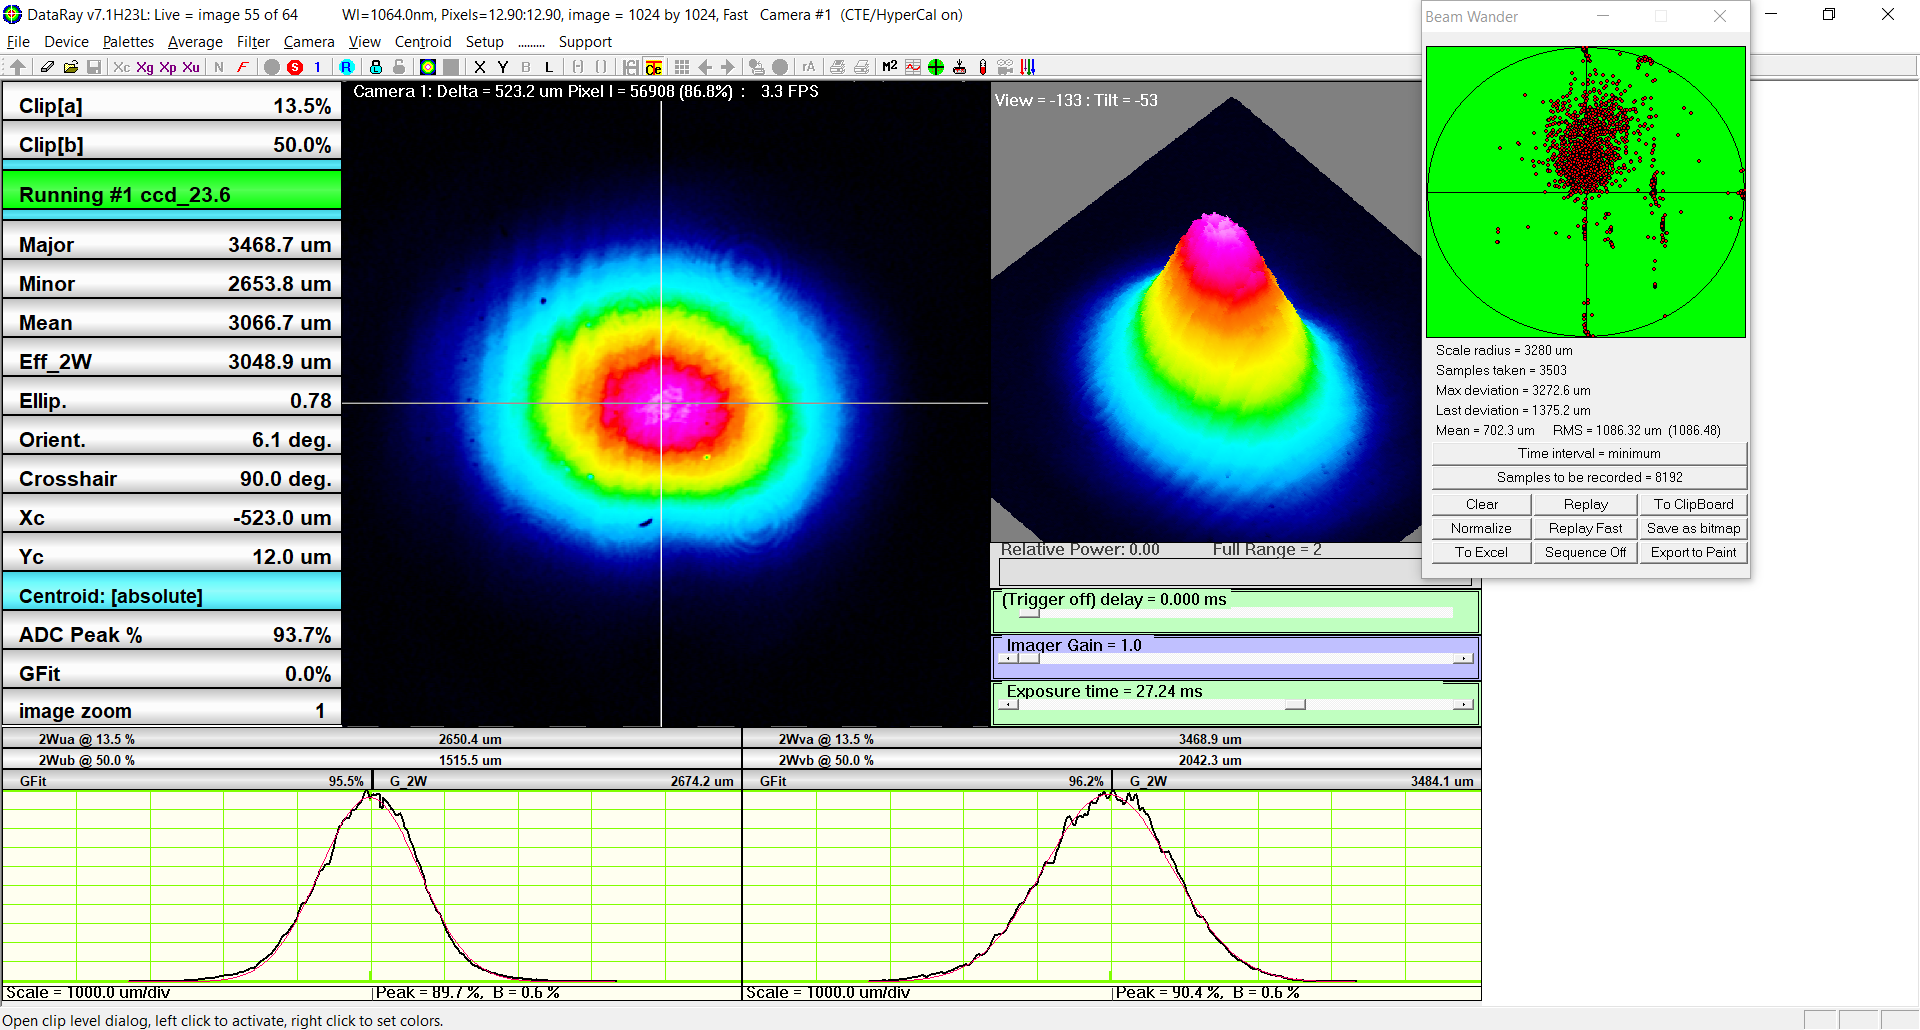
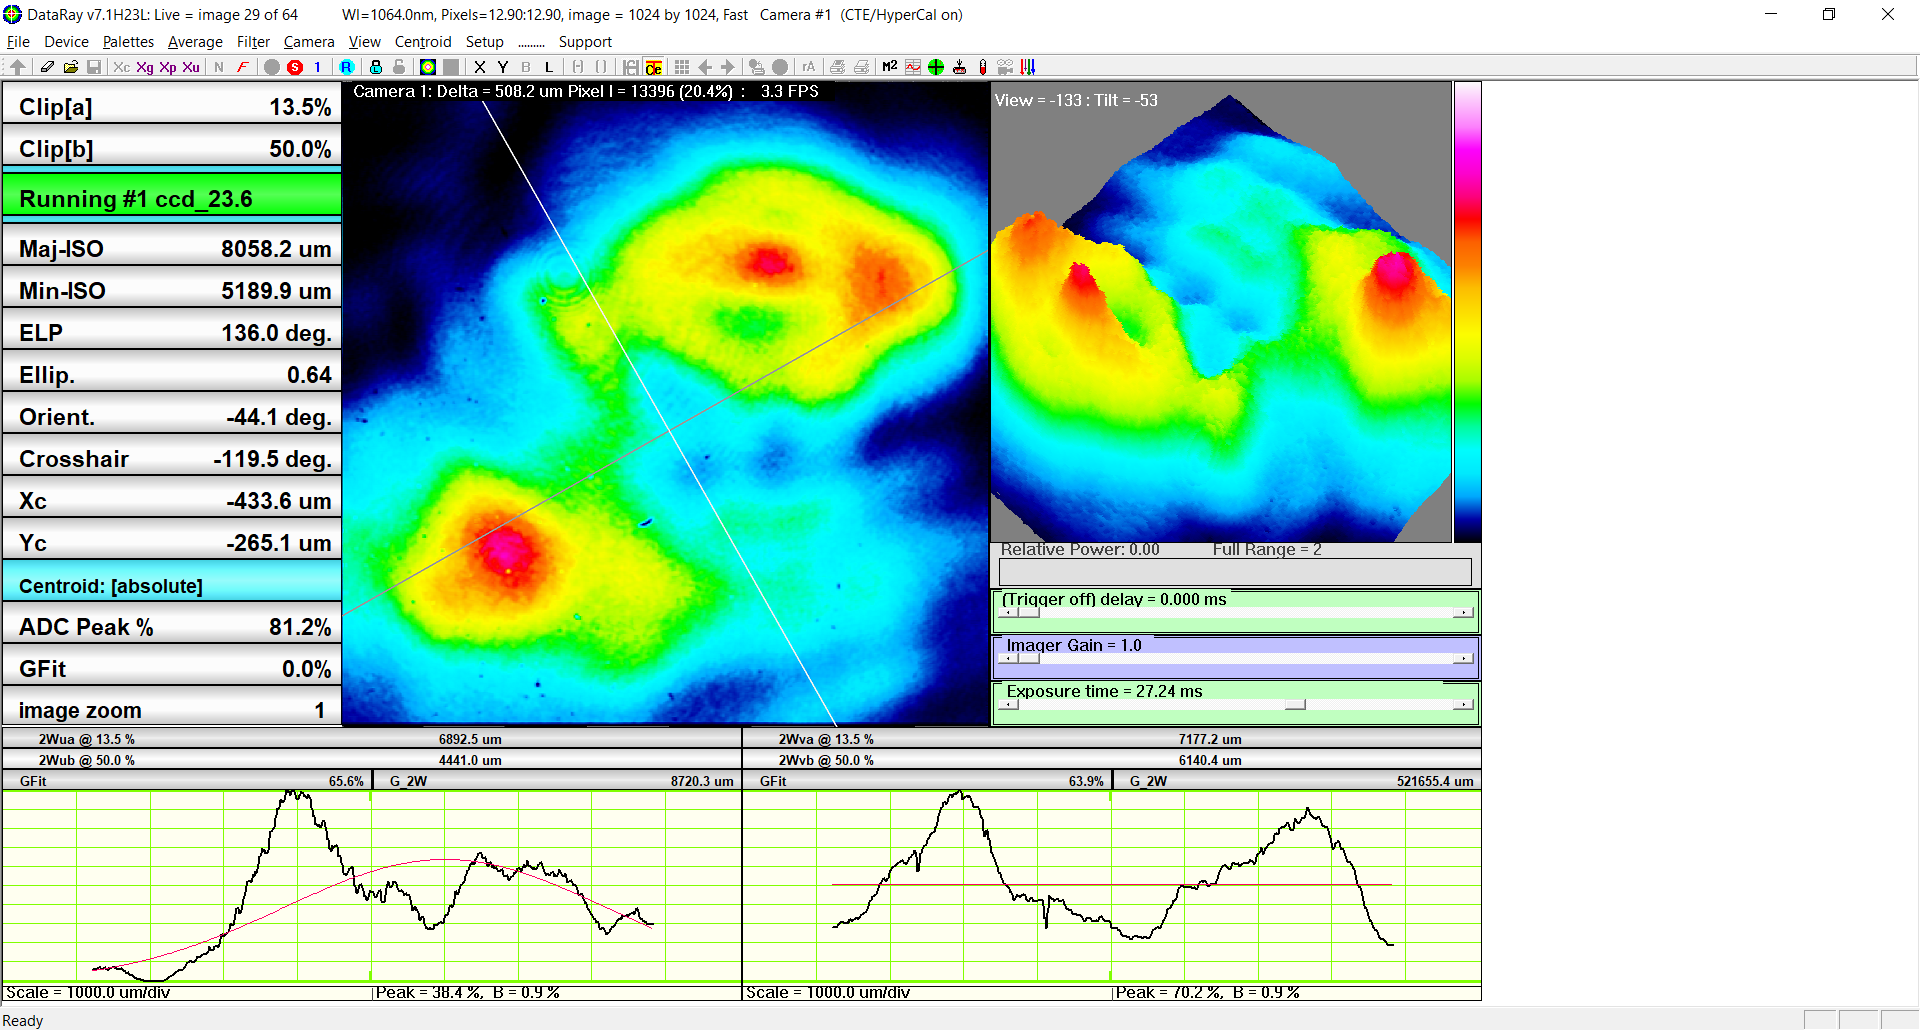
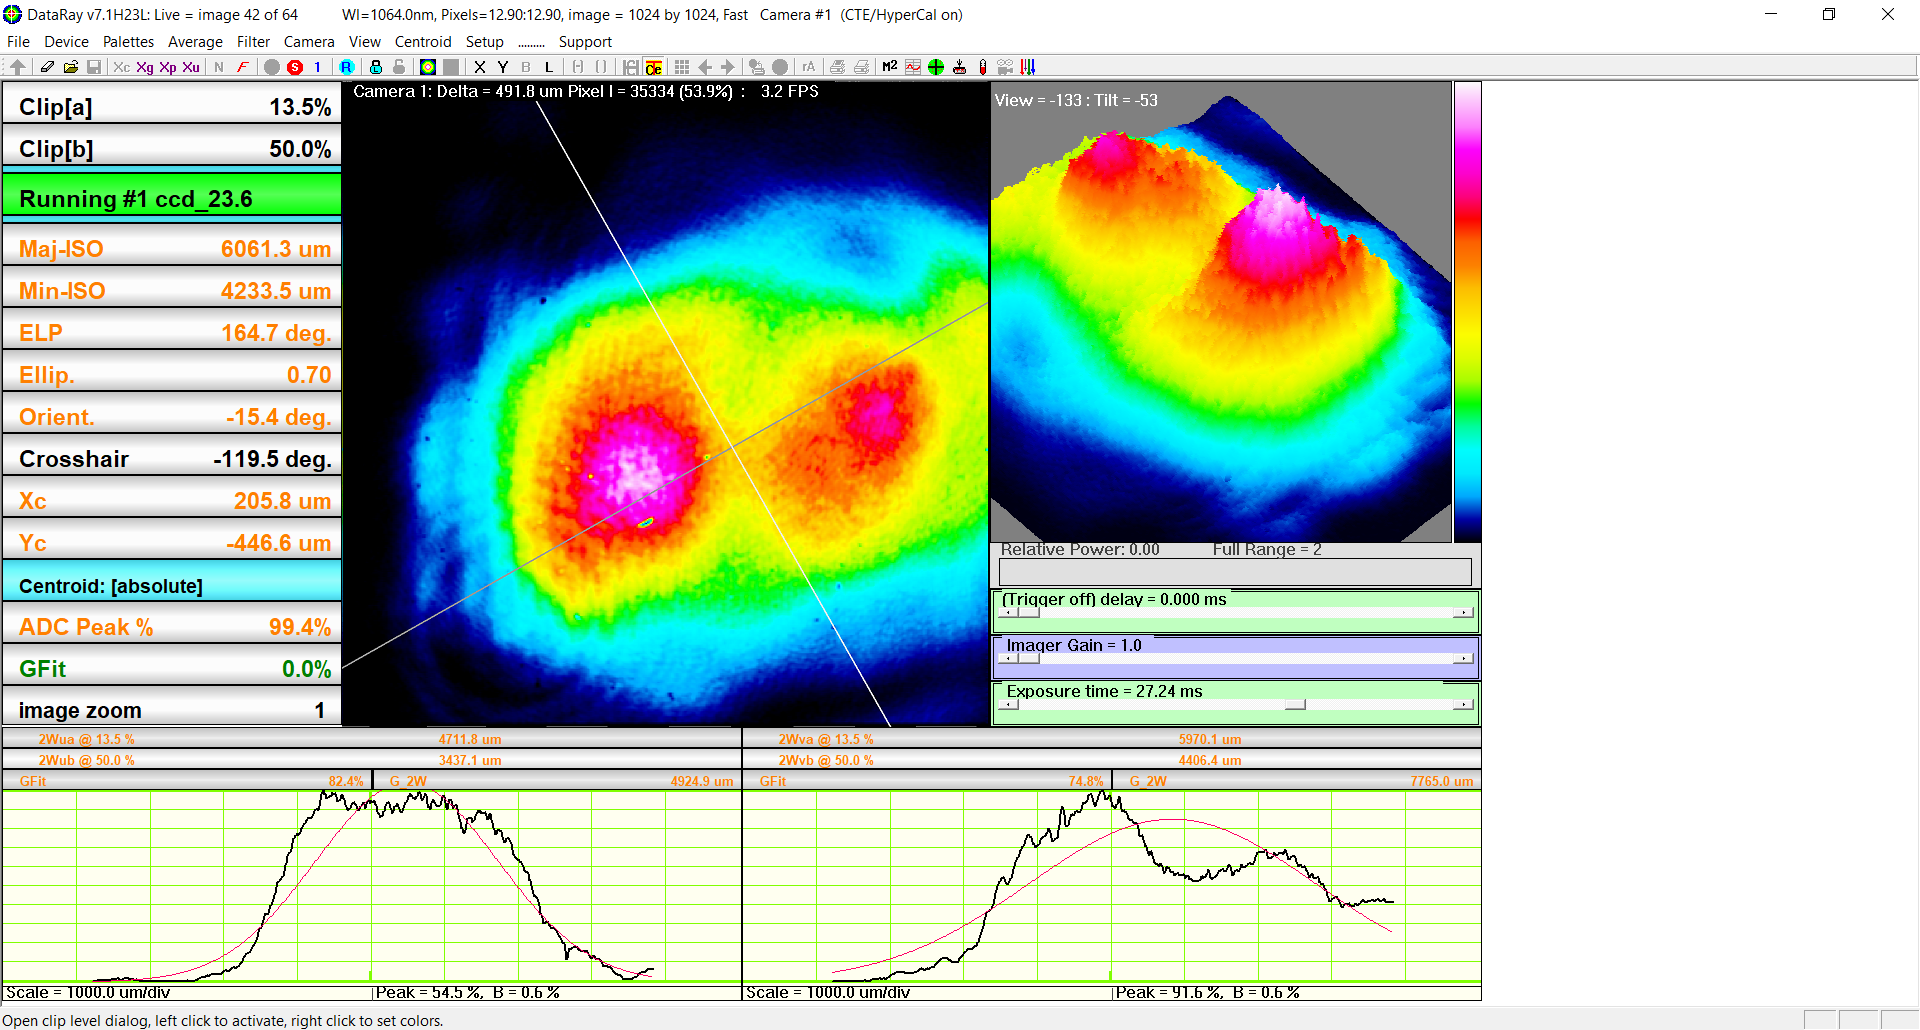
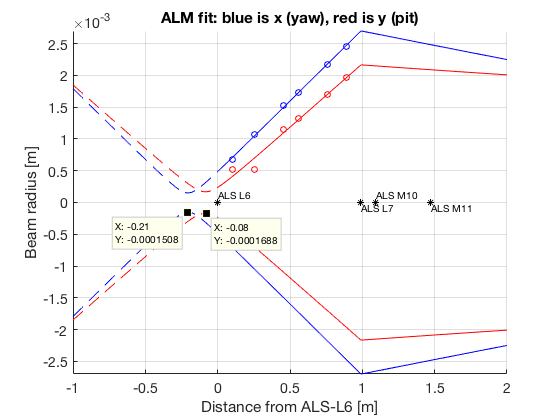
Today we went to End X to take a look at the ALS beam on ISCT EX as a comparison with end-y where the mode matching from the green beam to the arm is bad. At end X the input and reflected beams are much less clean than end Y.
| Holes from ALS L6 | X diameter [um] | Y diameter [um] |
| 4 | 1038 | 1337 |
| 10 | 1645 | 2145 |
| 18 | 2299 | 3057 |
| 22 | 2650 | 3468 |
| 30 | 3412 | 4354 |
| 35 | 3923 | 4902 |
Jenne, Chiara.
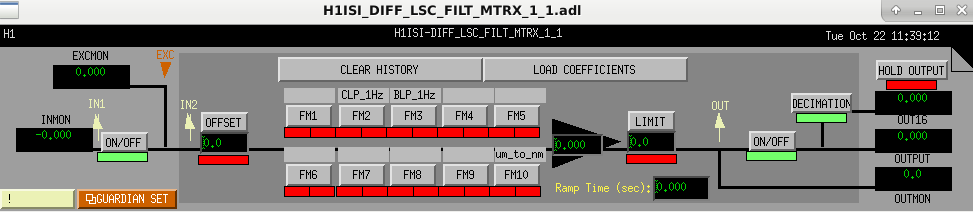
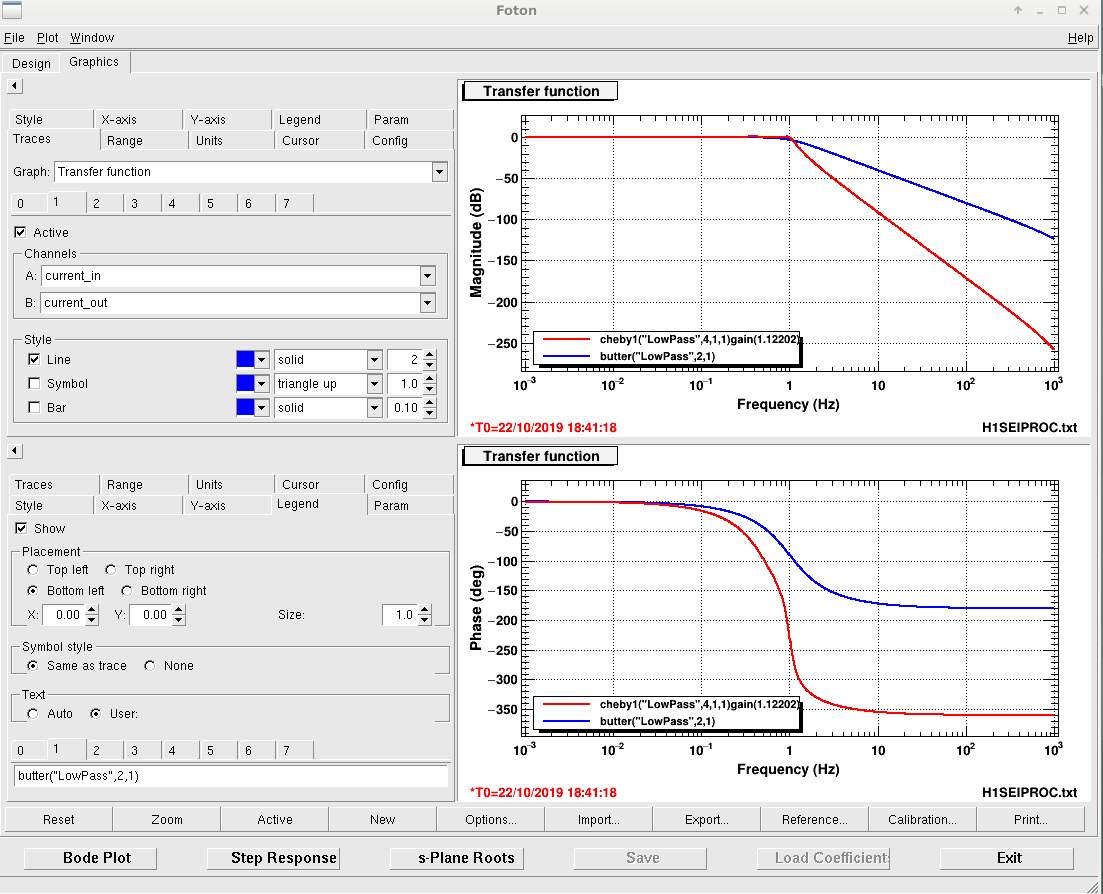
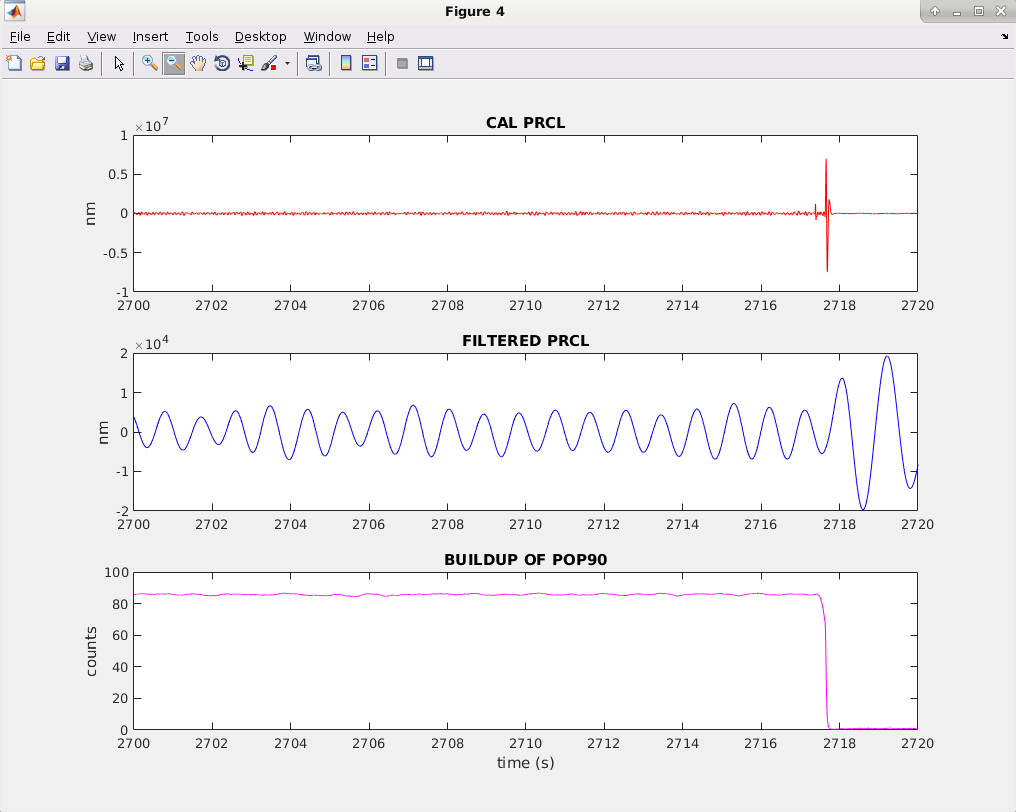
Yesterday we started to test to see what would be the actuation on the ISI CPS diferential configuration for PRCL using the LSC signals: the aim was to look at the forseen actuation. We tried to look at the output from the filters in real time but it did not succed because we found out that we were using an "unknown" calibrated PRCL signal (from OAF model, unused anymore; the proper ones have to be taken from CAL_CS model); so we decided to test the filters receiving the CAL_CS LSC signal (first pic): these filters are two low pass filters shown in second pic.
In Matlab, we chose a time when a lockloss happened and the calibrated PRCL data have been taken from H1:CAL-CS_PRCL_DQ. To be sure that we were choosing a lockloss moment, we used data from H1:LSC-POPAIR_B_RF90_I_ERR_DQ: this is a signal from a photodiode showing the amount of light in the cavities. When a lockloss happens, the signal on the phododiode drops off.
Calibrated PRCL is given in um, so we made sure we were working in the same units of measure, chosen to be nm because this is the unit of seismic loops. We applied the filters to the calibrated PRCL time series and we got the results in third pic: during a lockloss, calibrated PRCL shows a high frequency pulse, which is successfully low passed when filters are applied. This shows that if we use this filters, the actuation to apply would be such that the ISI would move of what shown in FILTER PRCL trace.
However, during lockloss the actuation would be around 20um, which is not bad, but maybe more that we want. So, this value could be lowered by a trigger that detects a lockloss and ramps off the LSC drive to the ISI. The trigger has been installed and we are going to use it once we are ready to push on the ISI.
TLDR: CO2X looks misaligned on the HWS and phase camera images. Whether we want to realign it is up for discussion as CO2X is kept on during lock. This was because it helped RF and carrier builds up at the time.
Over the weekend with DRMI we were doing some phase camera tests. We decided to have a look at what effect the CO2s would have on the sidebands and see if what the phase camera is outputting makes sense. We had the phase camera running to take pictures of all the sidebands every 20s. We then dropped the power of CO2Y to 0W left if for 20 mins, increased it to 2W, waited, then returned it to nominal. We repeated the same with CO2X. We had DRMI ASC runnning during this process.
Looking at the raw phase camera images isn't particularly enlightening, unless something is completely wrong. One aspect that needs to be worked on is how we process and display the phase camera data in a usable manner. As we have both the amplitude and phase of each sideband we figured the best idea to try first is do a higher-order Hermite gaussian decomposition and analyse the change in mode content of each field. Ideally we would do this decomposition in the PRC mode propagated to the phase cameras position, however we don't actually know what that is in practice. Instead we just have to pick some beam basis that is something not too dissimilar to the beams we are seeing. I did a rough least-square fit for a gaussian HG00 to the data and got beam parameter values of:
X: w0=0.001362, z=6.688 Y: w0=0.001478, z=8.384
so the beam basis we are using here is slightly astigmatic. This doesn't necessarily mean the PRC mode is astigmatic, just that the beam at the phase camera is. We then run a decomposition of the 9 and 45 fields, plotted is the 1st and 2nd order mode changes to start with. Shown is that the 2nd order mode content of the beam varies as we change the CO2 power, as we'd expect. CO2Y has an ideal response, all we see is 2nd order changes, pretty much equal in amount between X and Y, so CO2Y looks well aligned.
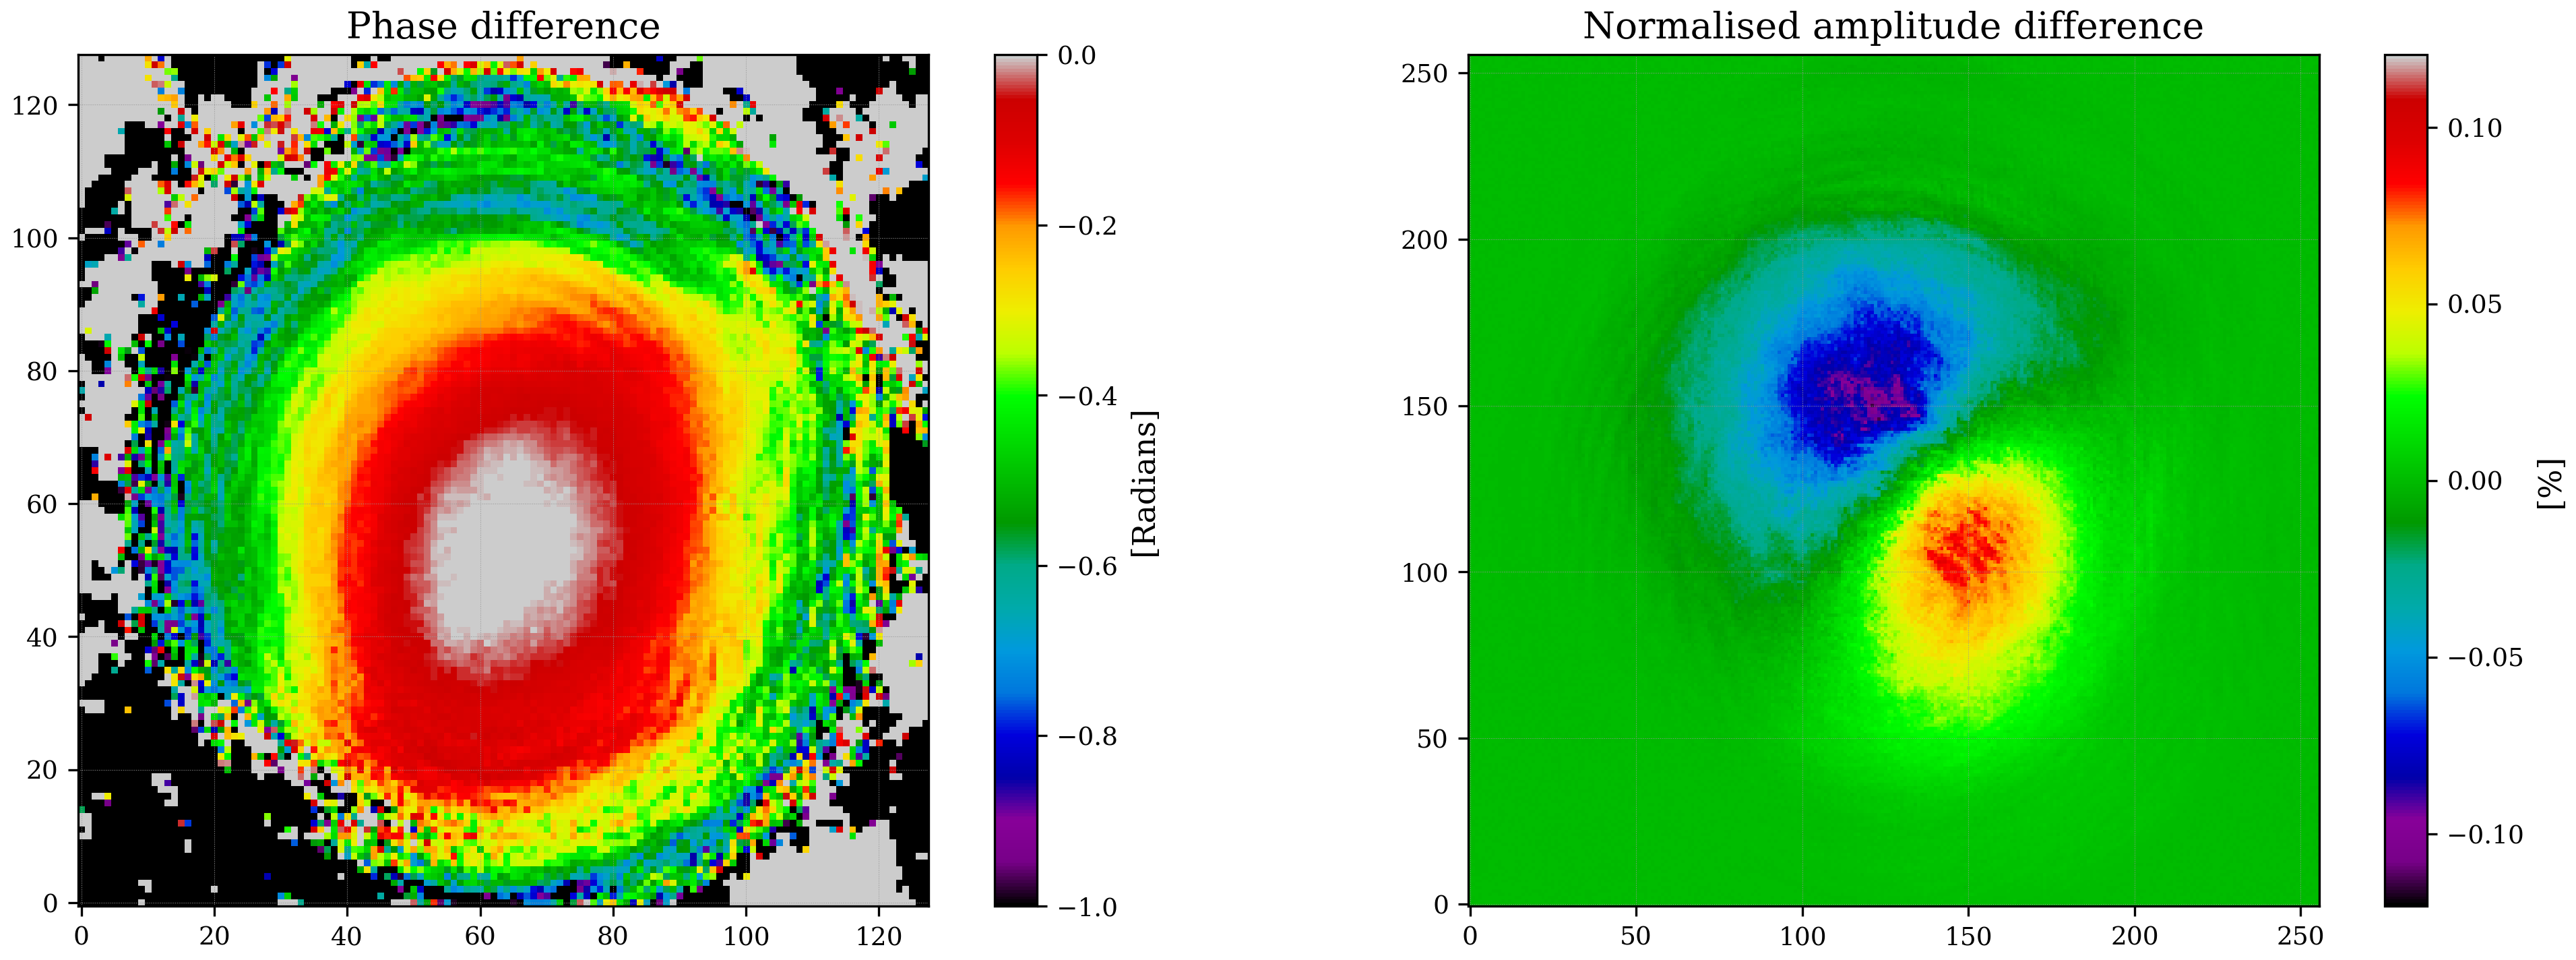
However, CO2X looks more problematic. It induced both a 1st and 2nd order mode content change. It moves the fields diagonally and also creates a more astigmatic field. An image of the difference in shown here at the peak of the CO2X effect. The shape change (at the phase camera position) is mostly in the radius of curvature of the field and the misalignment mostly translation.
Averaging the upper and lower sideband I compare the 9 and 45 mode changes in figure. We can resolve a different shape between the 9 and 45 sidebands. The sidebands experience a different misalignment when CO2X is changed, the X displacement (HG10) change is different between the two. We can also see the lensing experienced in X is also different between the sidebands.
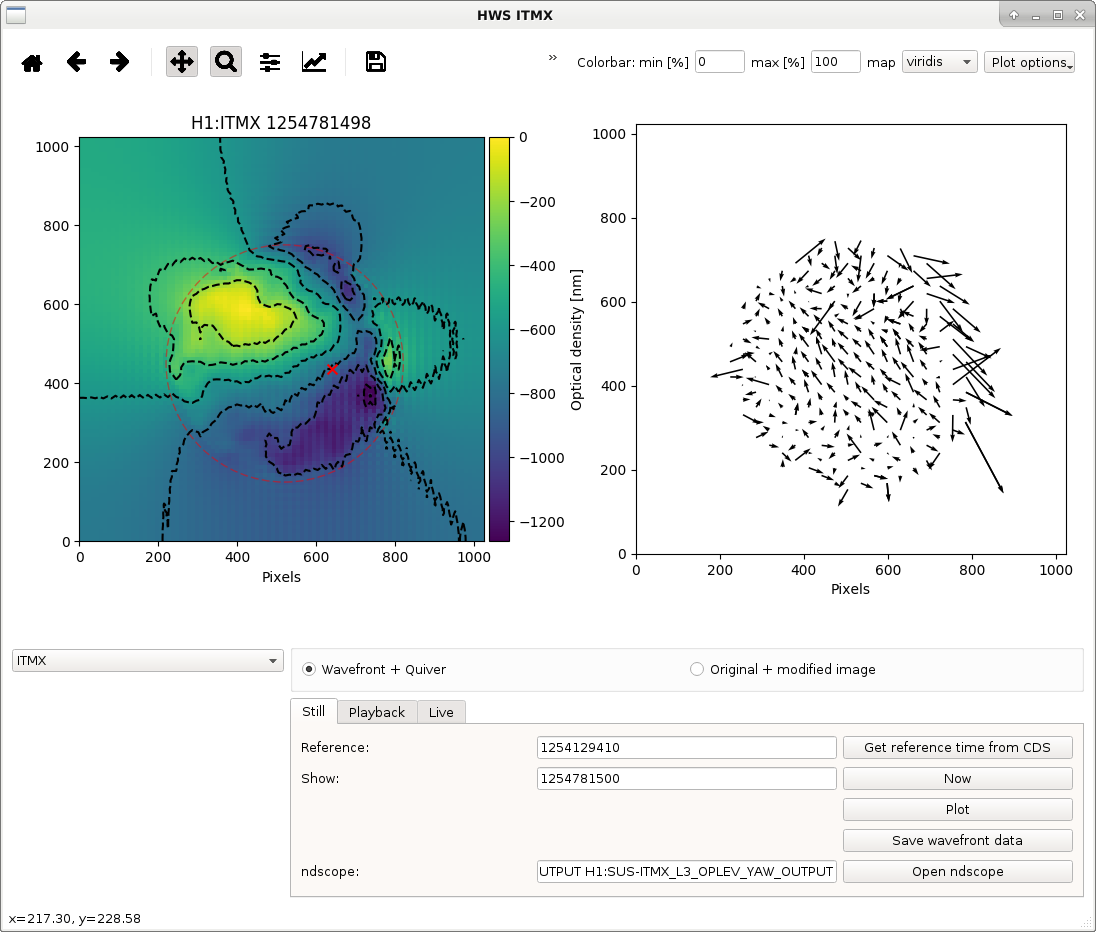
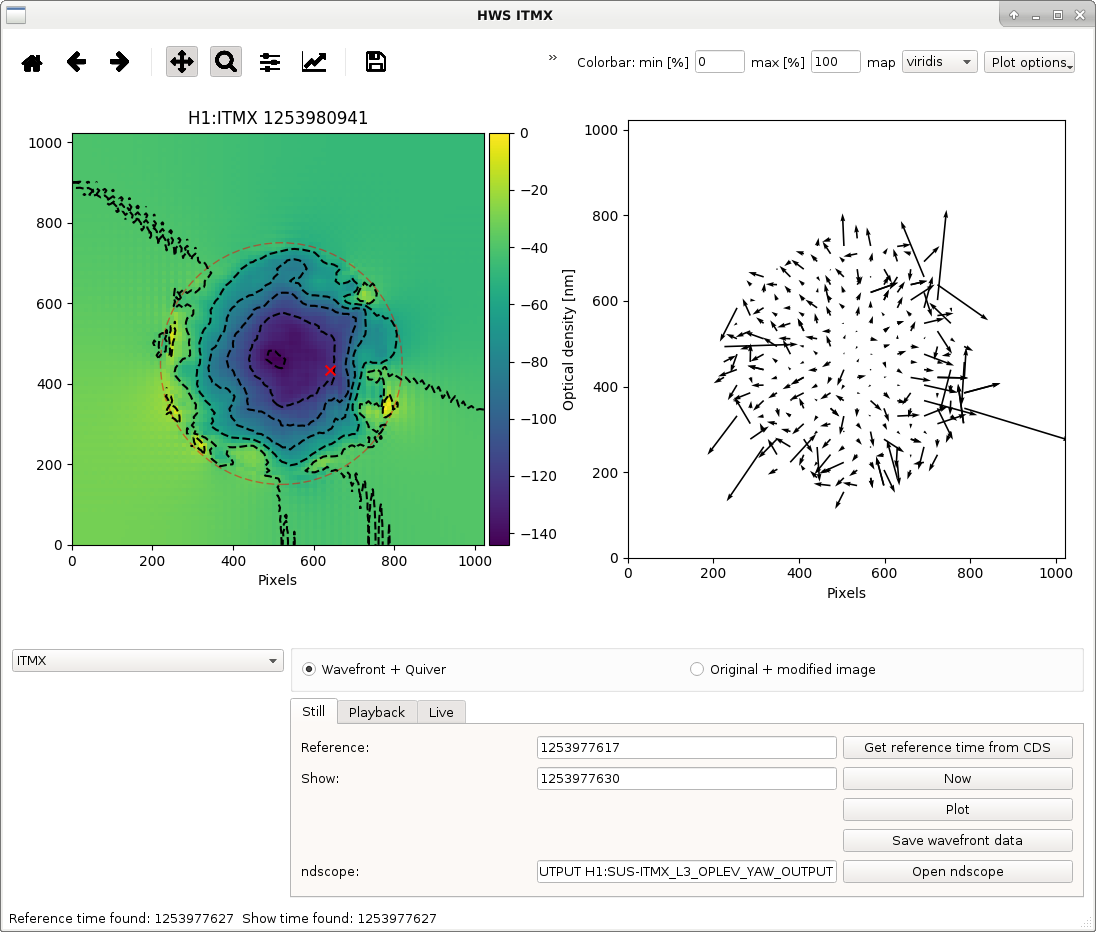
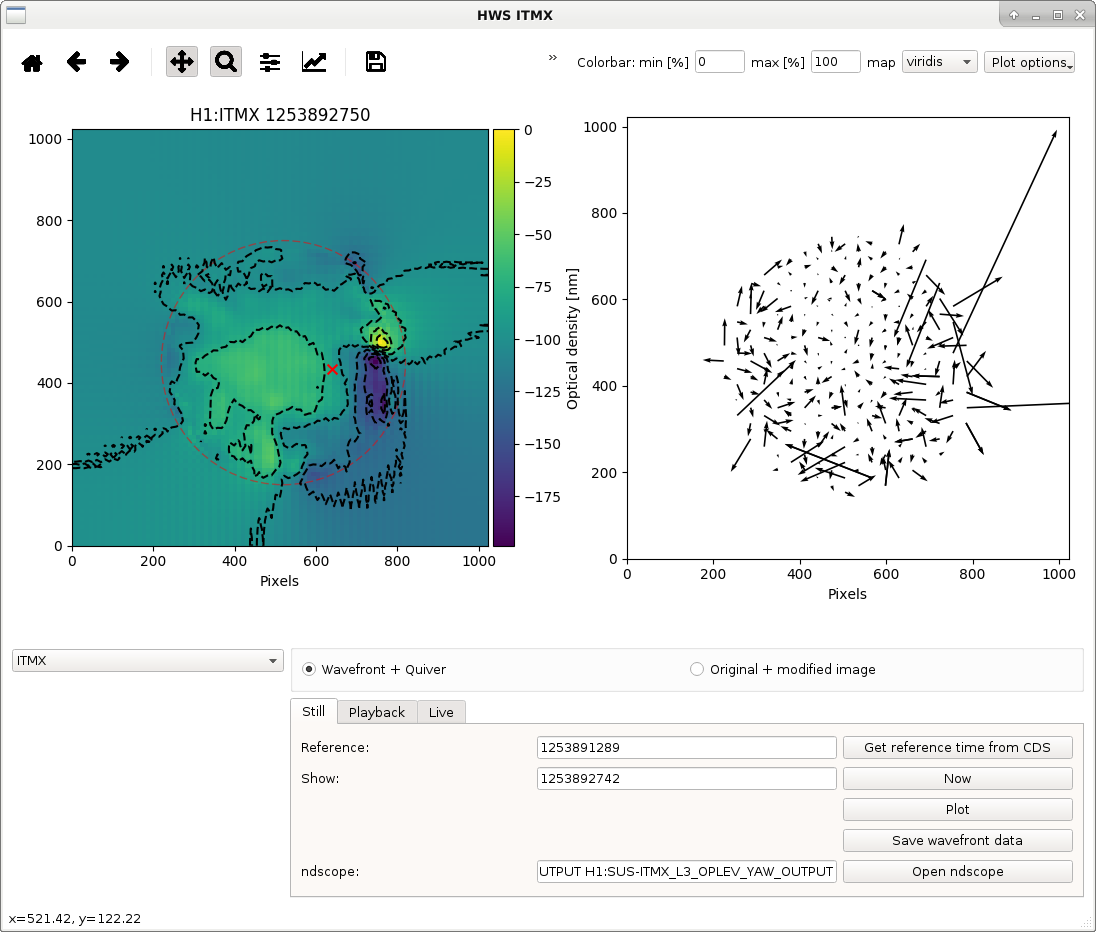
For reference I looked back at the HWSX images during this change. Not much can be seen from the weekend images. Comparing the CO2X switch on a week or so ago (with ring heaters off), we get this image. Comparing this to the cooldown of the IFO at the start of the commissioning break, we can see they not well centered. Looking at a power up at the end of September a dead pixel is causing an issue, but we can kind of see a deformation centered around 500, 400. Either way these don't look well aligned.
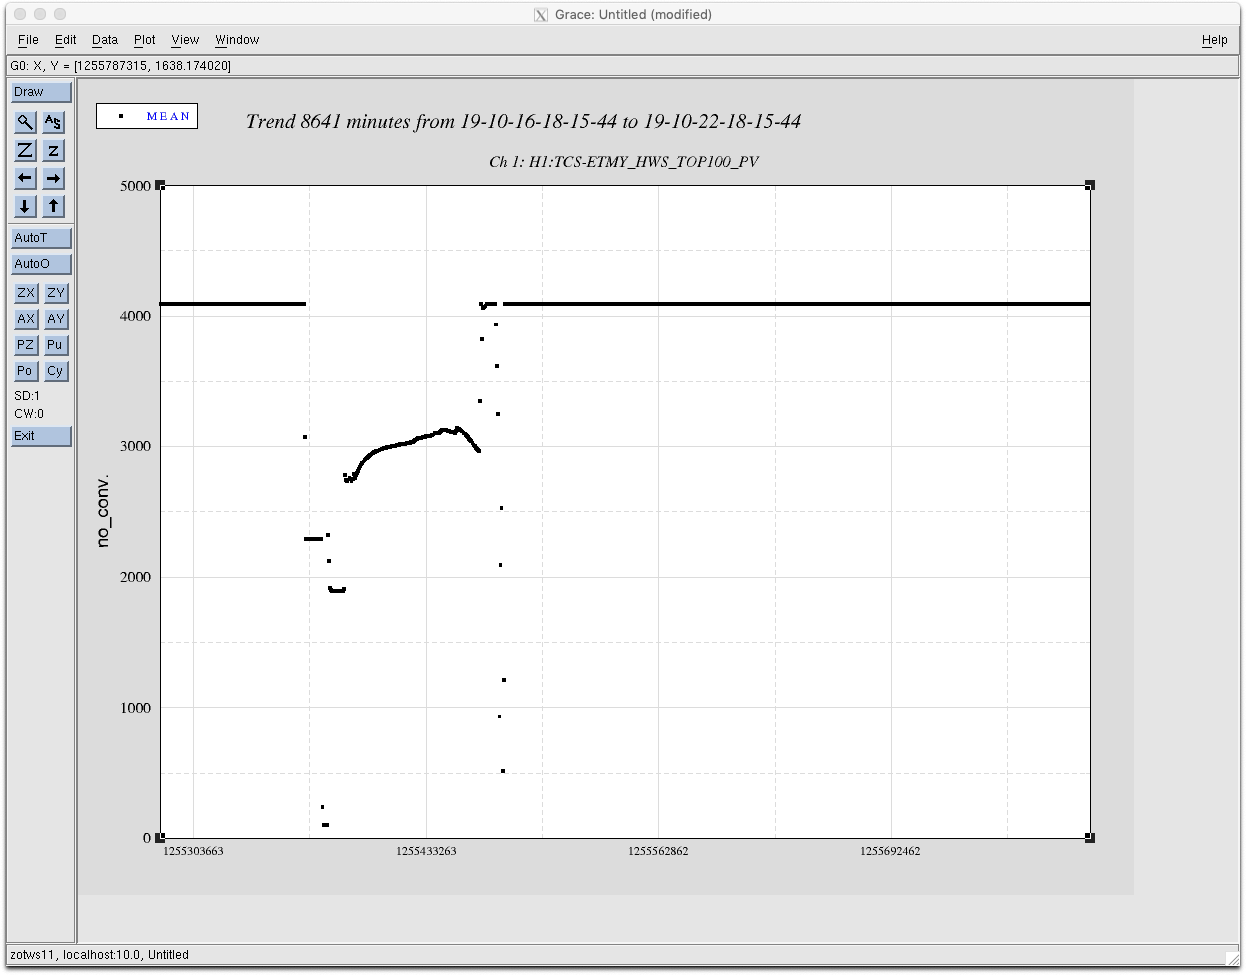
The ETMY HWS is now saturated by the ALS laser leakage into the HWS path. It's been like this since the ALS laser was energized last Friday (see attached plot of mean value of the peak 100 pixels on the HWS). We might be able to notch out the 532nm ALS laser using a notch filter.
I reset both PSL power watchdogs at 17:06 UTC (10:06 PDT). This completes FAMIS 10733.
Filiberto has re-enabled the HAM6 HV. It may trip again, but there is currently no time for it to be diagnosed.
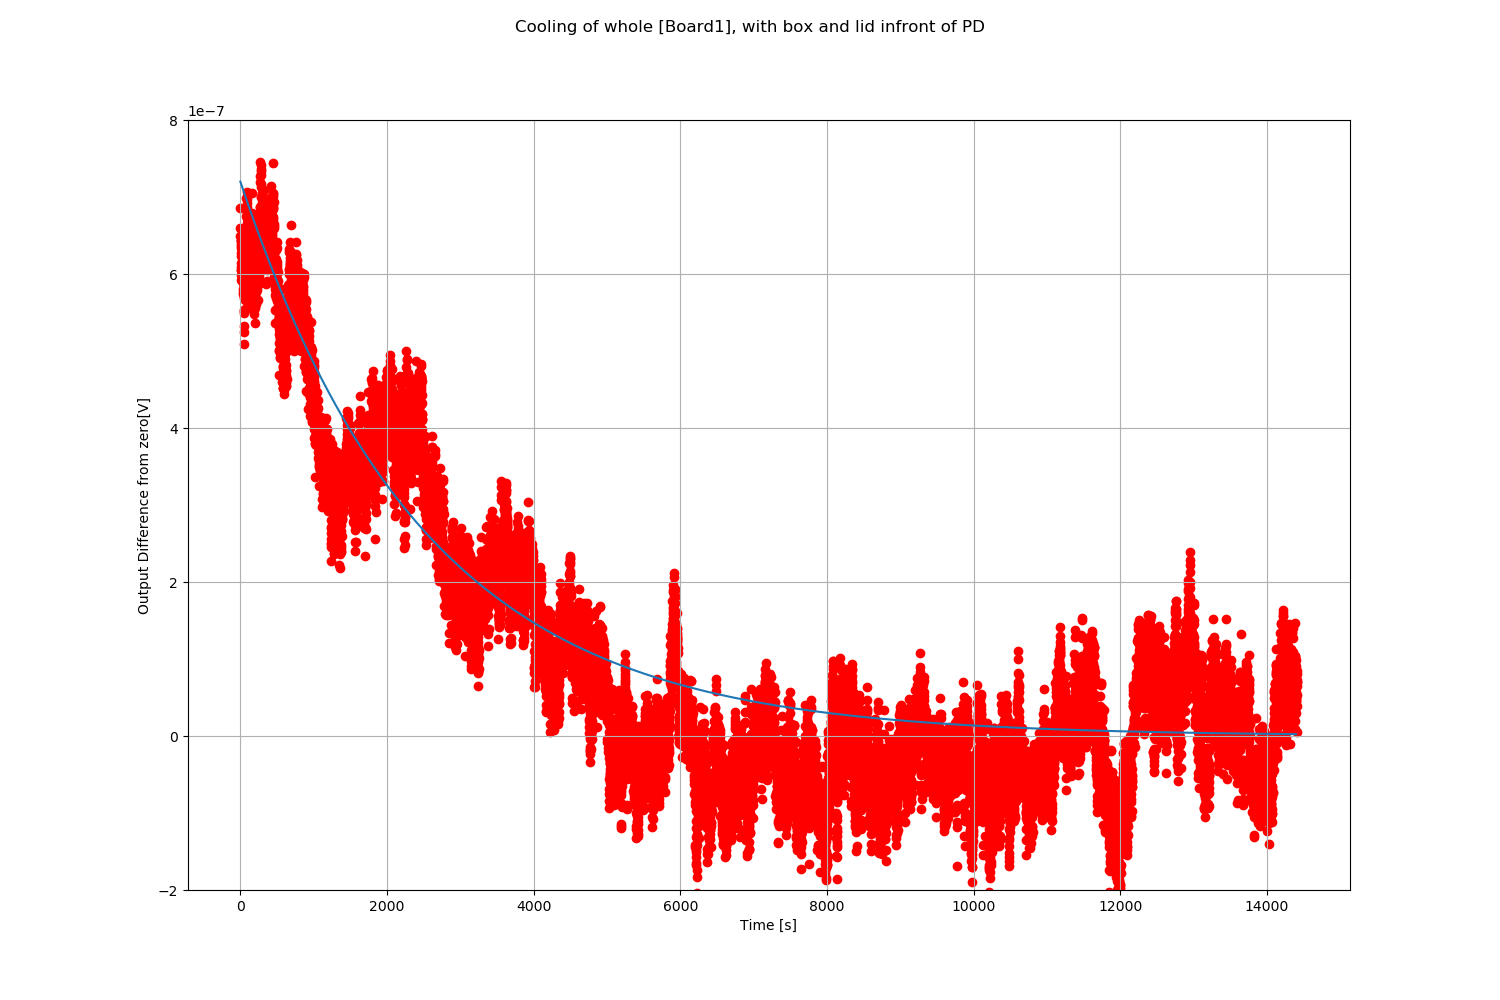
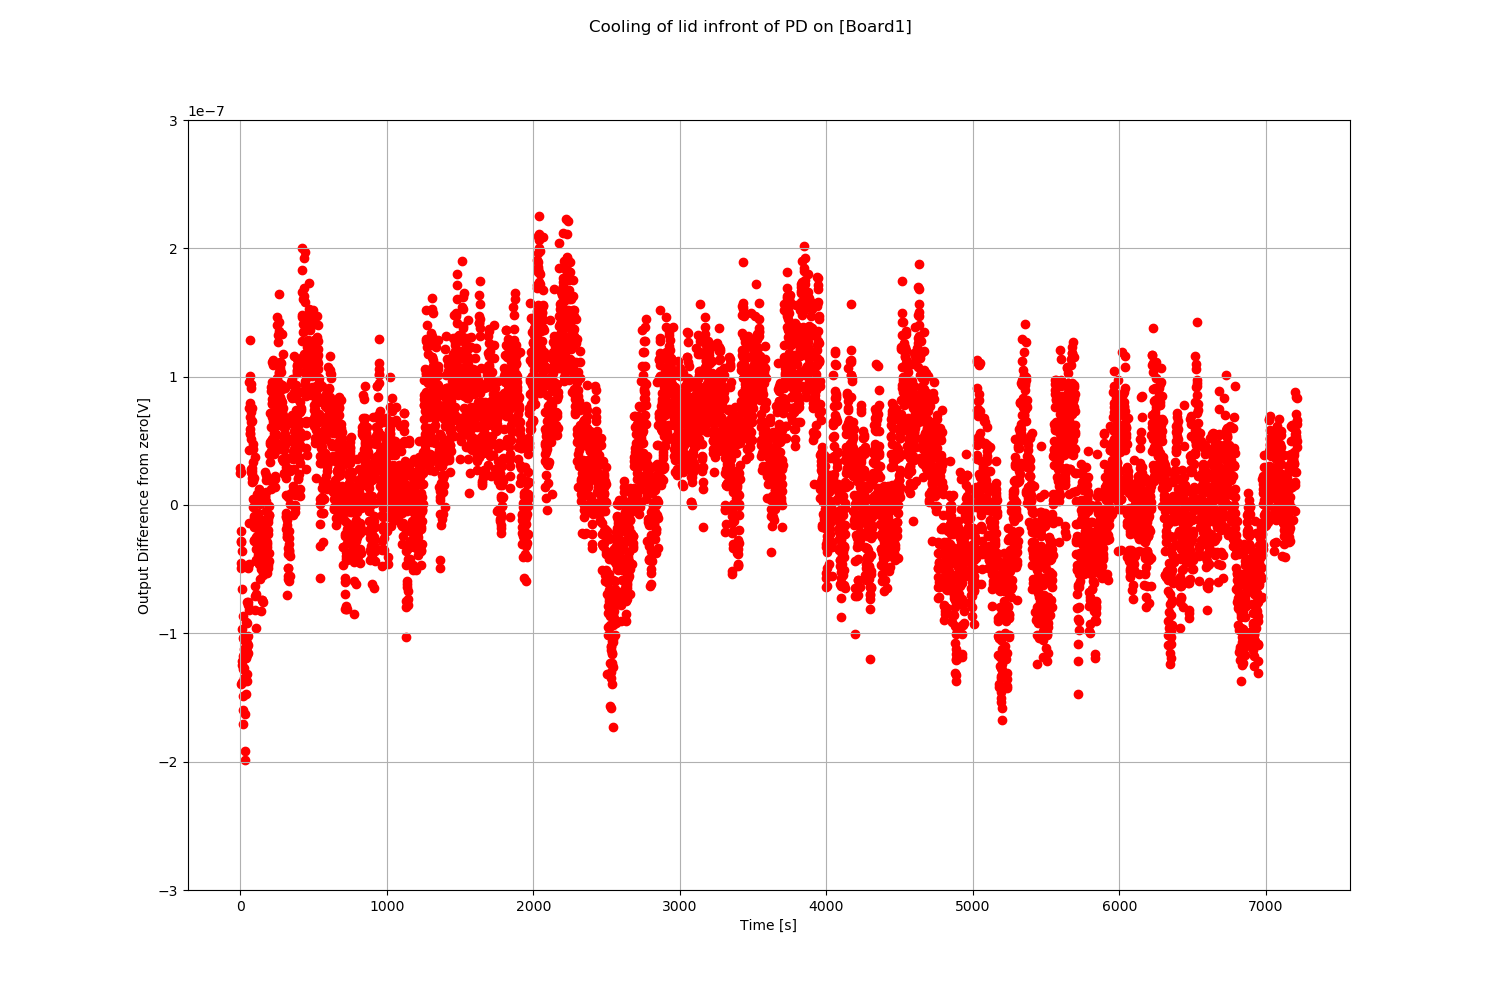
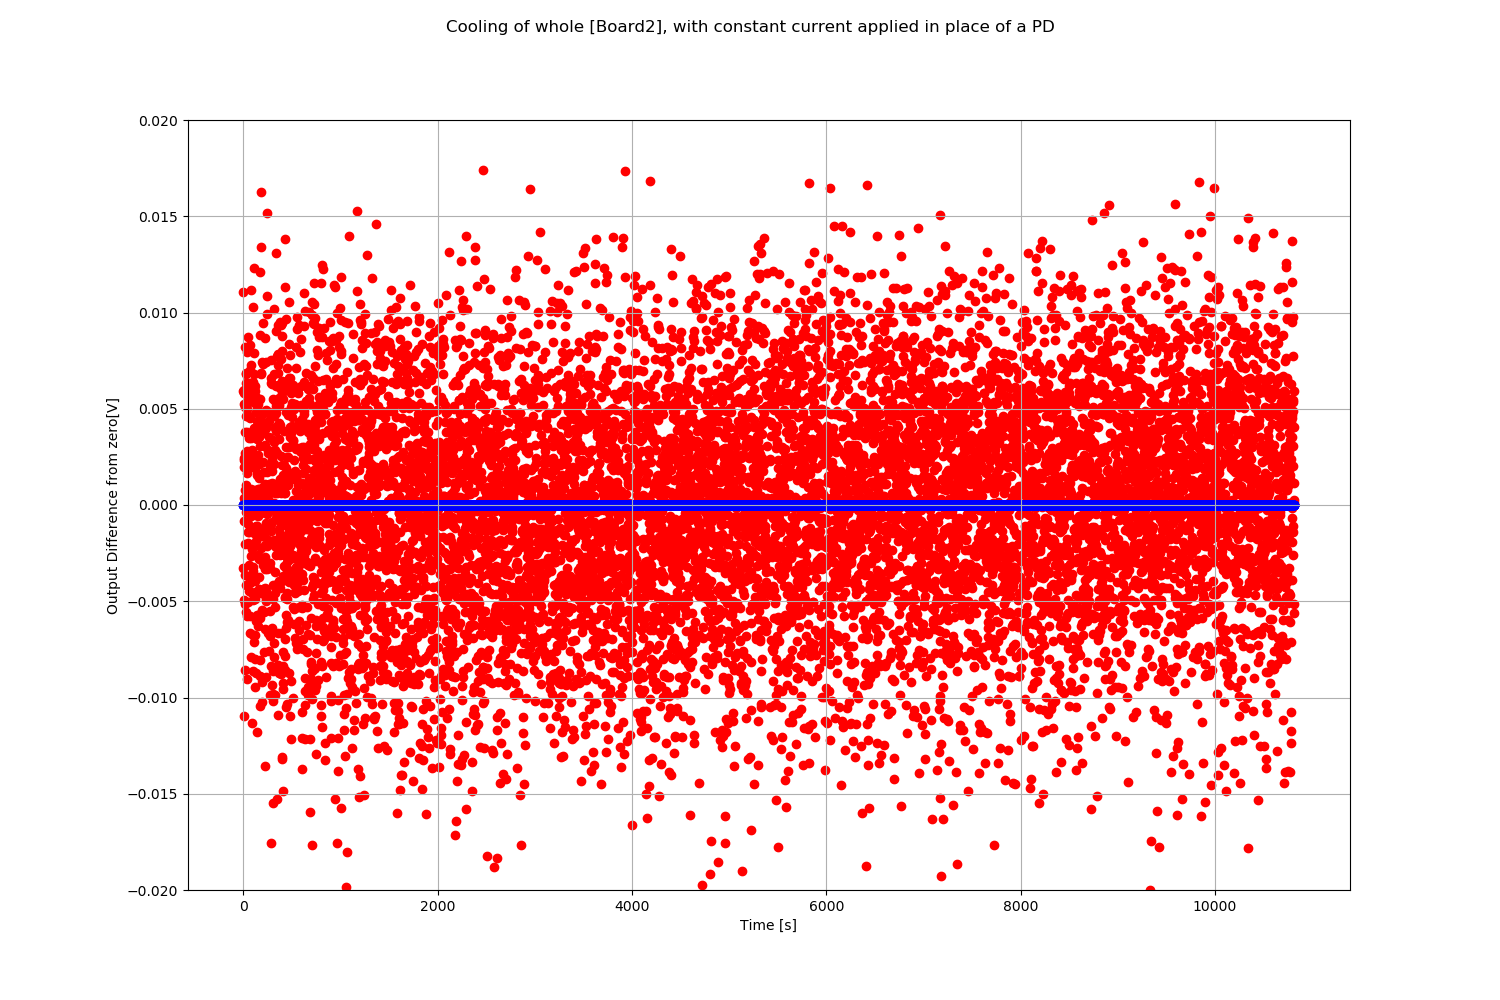
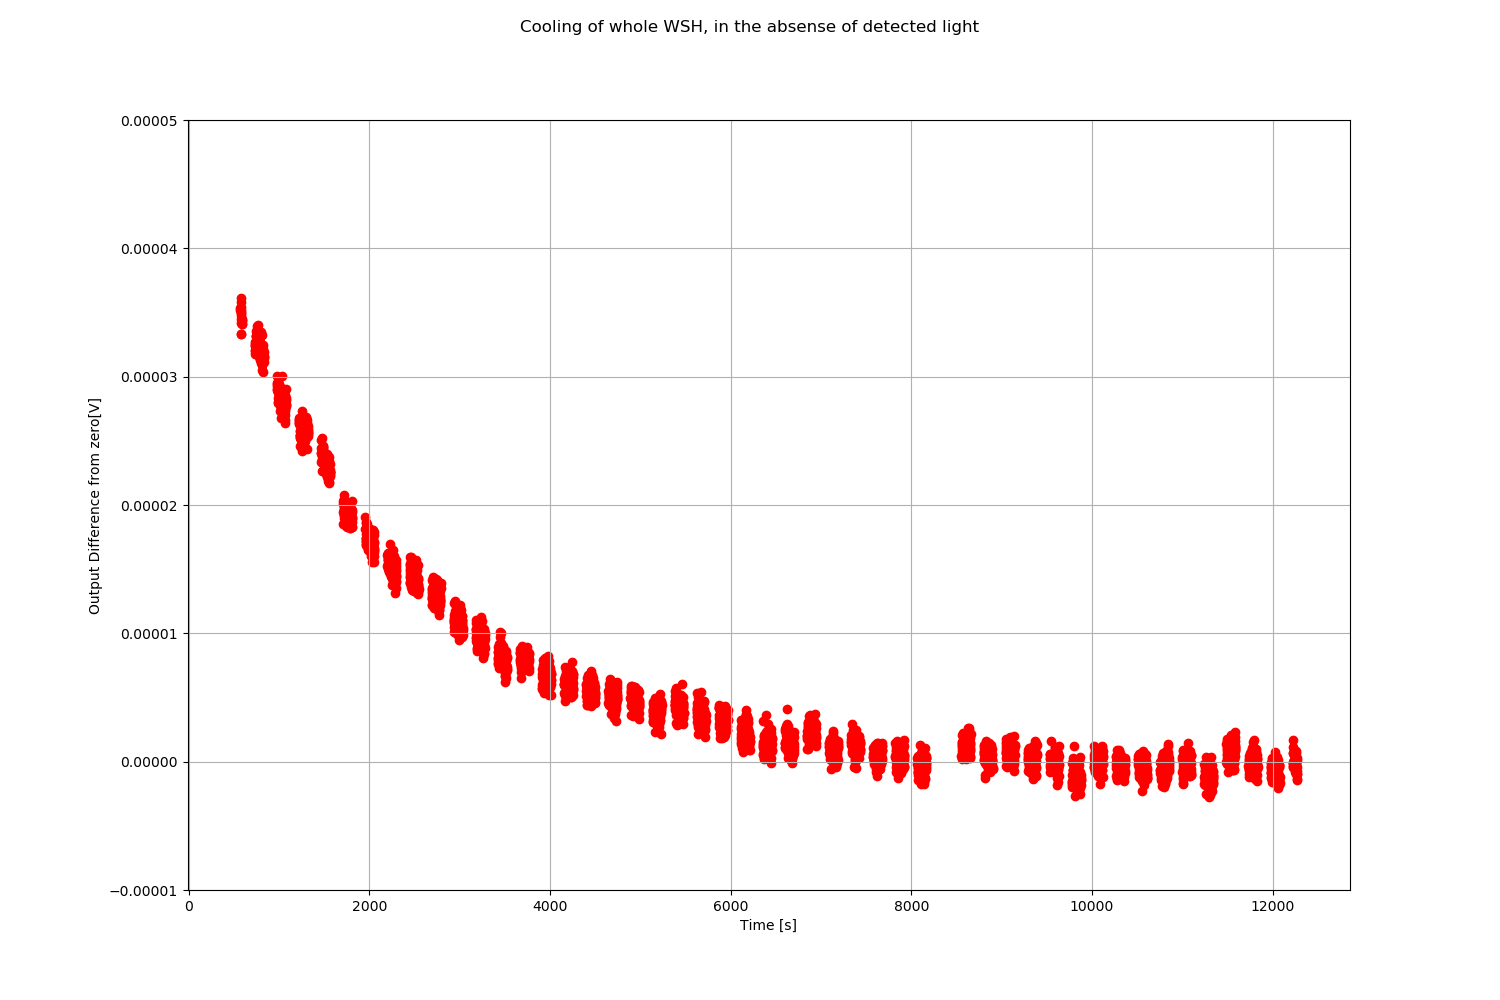
Vlad and Niko We have tasked ourselves to some of the backup hardware to search for what causes apparent temperature dependence on the output of the photodetectors used in integrating spheres for the Gold and Working standards (GS and WSx, x is the site for which the instrument is for) for calibrating optical power in all of the GW detector sites. We are trying to explain the temperature dependence seen in [Zero_light_voltage_change.png], and [Normal_operation_voltage_change.png], in both images the DC offset has been subtracted. Temperature dependence was observed with no laser input to the integrating sphere with the cap attached to the front, and also when in normal operation when the whole integrating sphere was heated to 35 deg. C and allowed to cool. The magnitude of Voltage change due to temperature when there is laser light also incident on the detector is about 100x more. We have two available circuits for this initial test. [Board1], with only the photodiode (PD), which requires an external transimpedance amplifier (set to 50 times the gain of the GS) to get a voltage output. [Board2], with no PD, which requires an external current source (set to the typical current seen in Pcal measurements) to get a voltage output. We first looked at the output of the PD alone: [Exp1.png]: We heated up the whole box containing [Board1] to 35 deg.C, and looked at the response. This setup observed significantly better noise performance than the GS (roughly 10 times less noise, when the data was corrected to equivalent gains), which We observed some temperature dependence, and the solid line plotted is the predicted dark current from the PD as it is set up, while the box is cooling [caveat: function for solid line was estimated from documentation of a different but similar PD. The data sheets for our PD have no information at all about its performance in photovoltaic mode (zero bias voltage)]. The good fit makes us confident we know the source of this signal, and is much smaller than what was seen in the experiments done in the past [Zero_light_voltage_change.png]. [Exp2.png]: We heated up the lid in front of the PD to the box containing [Board1] to 35 deg.C Vlad predicted the PDs should be sensitive to changes in the black body radiation of objects close the to PD - unfortunately no change in output was seen in this experiment. This rules out his theory, unless PD behaves differently somehow when illuminated with some optical power (some non linear output behavior). Looking at the data, one could argue that the PD warmed up some time after placing the lid in front of it, giving a slight change to the response, but this could easily be some ambient effect. Next we look at the output given a constant current instead of a PD, to the circuit board, [Board2]: [Exp3.png]: We heated up the whole box containing [Board2], and looked at the response. The data from [Board2] is in red, and the data from the GS is in blue, and DC offsets have been subtracted. Unfortunately our experiment is swamped with noise (roughly 10^6 times more peak rms noise than the GS), and the effect we are looking for is somewhere deep in that noise. Our box also cooled much faster than experiments done before since it was sitting on a table (completely cool in about 10 minutes). In the future we will lift it to make the cooling slower. The noise should not be due to the current source, going by it's specifications and our measurements of its output before the experiment. The board has a different Op.Amp., with a capacitor missing on its power supply, at the output point of the circuit, compared to the specification in D1300210. Talking with Niko, all the boards were put together by the same company and should be identical, unless this is some weird experiential board. Future plan: 1)Resolve Noise issue of [Exp3]: a)Niko will chase up circuit boards assembly company to double check what is on the circuits and if some were different b)We can check frequency of noise in [Board2]- if high frequency could be due to the missing capacitor c)Maybe one board had faulty components and was set aside? d)Open a Working standard to check and compare is the last option 2)Repeat [Exp3] and see if we get the temperature dependence that we expect, with a noise level at least comparable to the GS 3)If we see the expected temperature dependence from [Normal_operation_voltage_change.png]: we can use preheated tools to apply pinpoint heat to individual components and find what is most susceptible to temperature dependence 4)If we do not see anything on [Board2], we go back to [Board1] and repeat [Exp1] and [Exp2] in the presence of optical light (ie mounted on an integrating sphere) to confirm the outcomes of [Exp1] and [Exp2] in the presence of an optical signal. 5)If we still see nothing - perhaps temperature dependence is not what we should be looking at. Ethan Payne (fellow who was looking at some of this data before me) makes a point that what we see could be a humidity dependance, though testing that is much more difficult.
[Board2] got a new Op.Amp and capacitor after some excellent soldering by Niko. Noise is gone, and we'll continue what we were doing tomorrow.
Energized HAM5/HAM6 AIPs, Valved-in IP14, Valved-in IP4, IP3, IP2 and IP1.
Curriously, IP1 and IP2 indicate a 4-channel sum of ~1.6mA @ ~7000V while IP3 and IP4 indicate a 4-channel sum ~4mA @ ~7000V (15 minutes after changing valve status') and their respective controllers.
Any correlation with chevron baffles? I can't remember which IPs have them and which don't.
1105 hrs. local -> Valved-out Vertex Turbo
I ran a few hours today with only IP14 pumping on HAM6 to see if shutting down the turbo+backing cart would be an option (Daniel S. keen on elilminating noise). The pressure looked like it might "turn the corner" at 5 or 6 x 10⁻⁶ torr but I aborted the exercise in observance of our default policy of not sacrificing equipment life expectancy. HAM6 back on turbo only until further notice.
Sorry C for the late response - I think that IP1 and./or IP2 have UV baffles while IP3 and IP4 do not.
Update - I noted that this disparity remained even after valving-out the Vertex turbo later on.
At 06:45 PDT the models on h1susex crashed with a timing error. The IO Chassis can still be seen by the front end, I'm restarting the models.
IOP model is not starting. dmesg output is shown in attached text file.
I have power cycled h1susex:
The IOP model is now running, but with a slight negative IRIGB excursion. I'm waiting for this to clear, while this is in effect IPC and DAQ data have timing errors.
Timing is good, handing over to Patrick to complete the recovery.