oli.patane@LIGO.ORG - posted 10:18, Sunday 31 August 2025 - last comment - 11:33, Sunday 31 August 2025(86662)
Lockloss
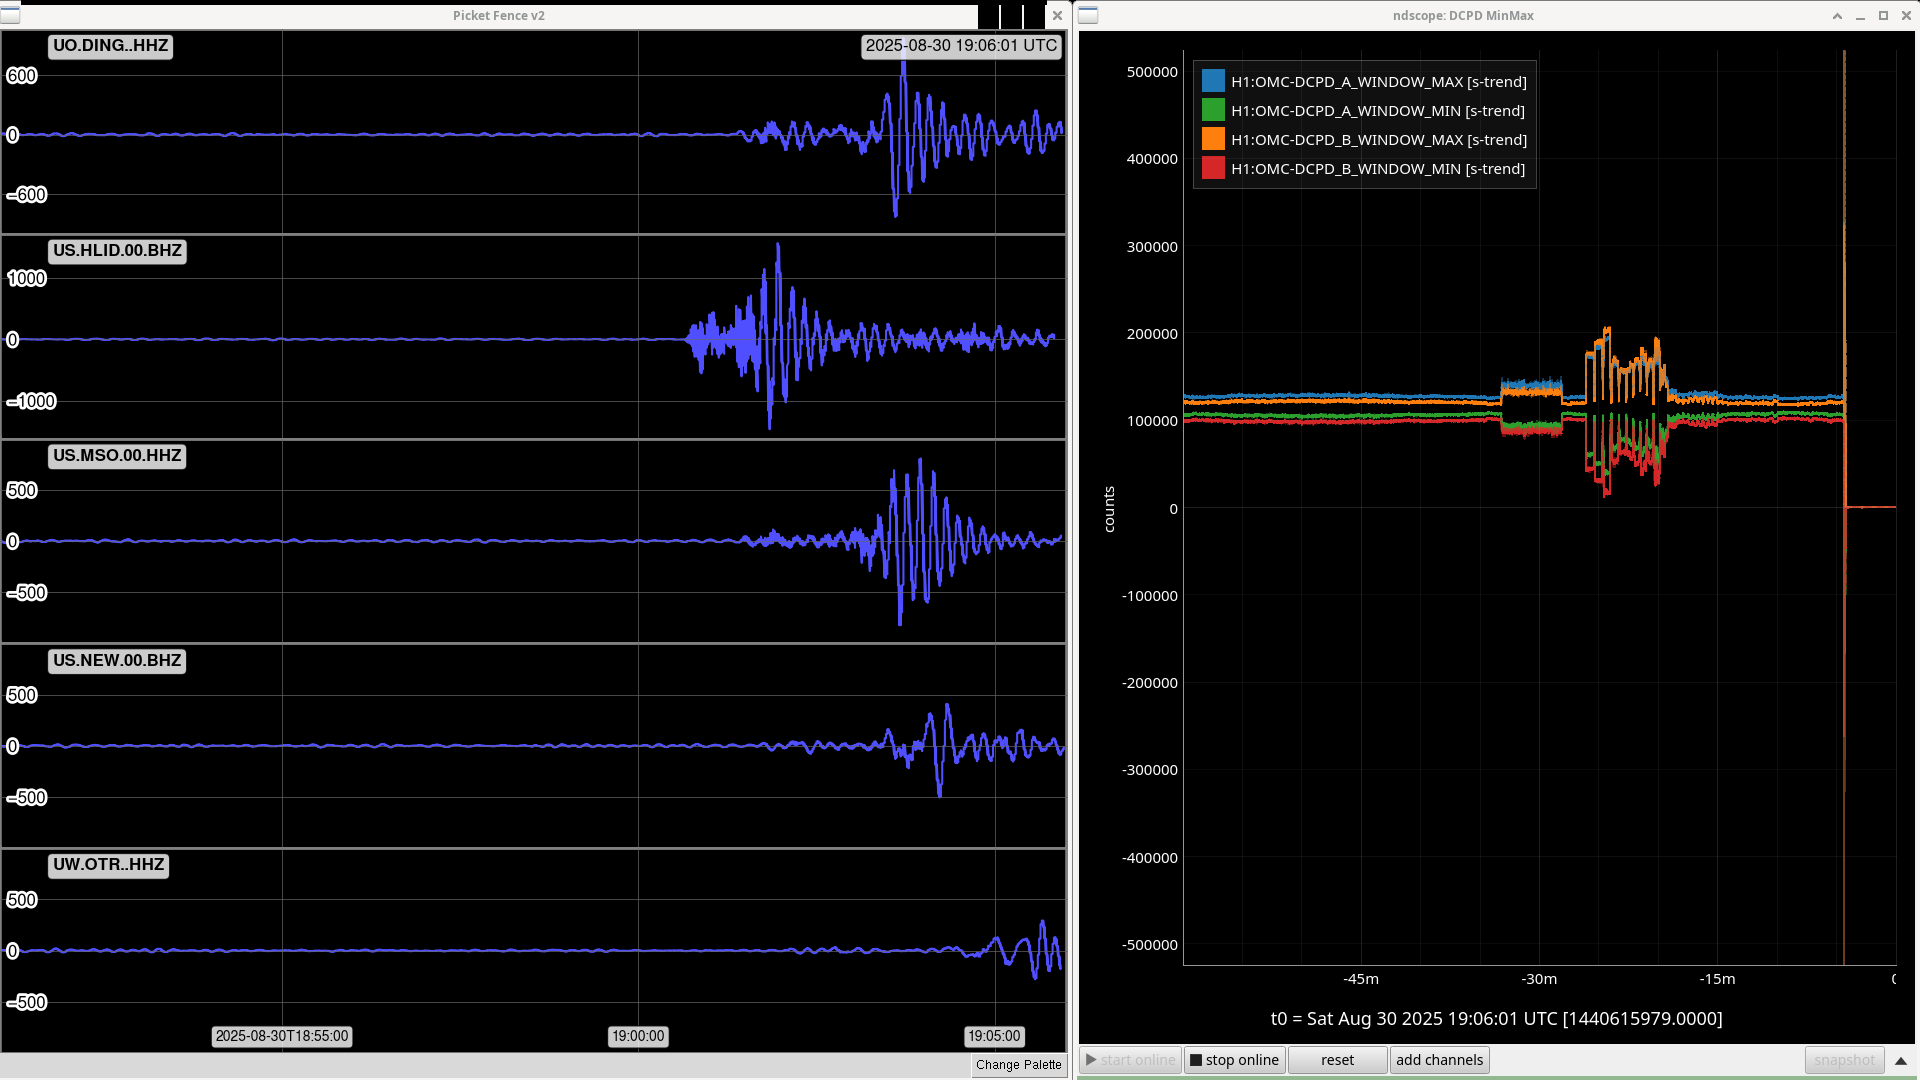
Lockloss at 2025-08-31 17:17 UTC after 5.5 hours locked
Lockloss at 2025-08-31 17:17 UTC after 5.5 hours locked
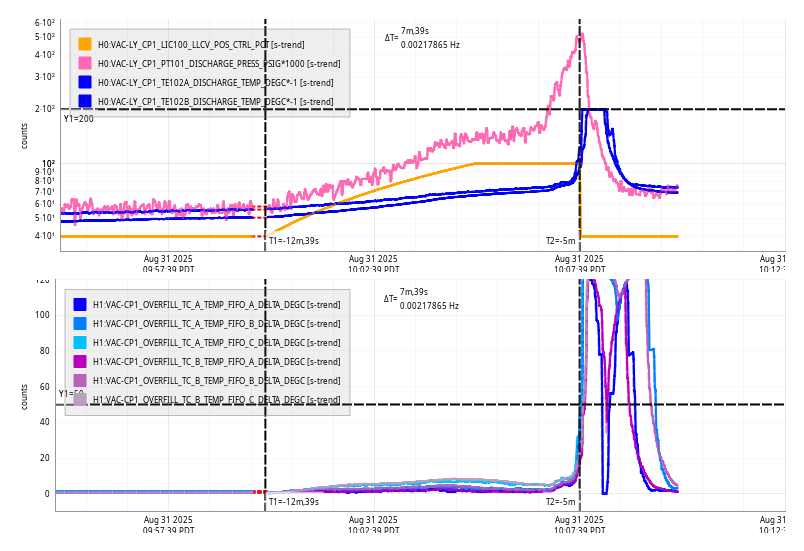
Sun Aug 31 10:07:39 2025 INFO: Fill completed in 7min 35secs
TITLE: 08/31 Day Shift: 1430-2330 UTC (0730-1630 PST), all times posted in UTC
STATE of H1: Observing at 157Mpc
OUTGOING OPERATOR: Tony
CURRENT ENVIRONMENT:
SEI_ENV state: CALM
Wind: 4mph Gusts, 2mph 3min avg
Primary useism: 0.01 μm/s
Secondary useism: 0.11 μm/s
QUICK SUMMARY:
Currently Observing at 156 Mpc and have been Locked for almost 3 hours.
TITLE: 08/30 Eve Shift: 2330-0500 UTC (1630-2200 PST), all times posted in UTC
STATE of H1: Observing at 158Mpc
INCOMING OPERATOR: Tony
SHIFT SUMMARY:
H1 has been locked entire shift and NO drops from Observing (H1 locked for 7.75hrs). Did not get to run Simulines due to L1 also being UP the whole time.
LOG: n/a
TITLE: 08/30 Day Shift: 1430-2330 UTC (0730-1630 PST), all times posted in UTC
STATE of H1: Observing at 158Mpc
INCOMING OPERATOR: Corey
SHIFT SUMMARY: Observing at 158 Mpc and have been Locked for 2.5 hours. Relocking after the earthquake knocked us out was pretty easy - I just had to run an initial alignment after we lost lock in START_TR_CARM from a bad alignment.
LOG:
14:30 UTC Observing and Locked for over 13.5 hours
16:23-16:27 Small plane flying overhead Tagging DetChar
18:31 Out of Observing for Calibration suite
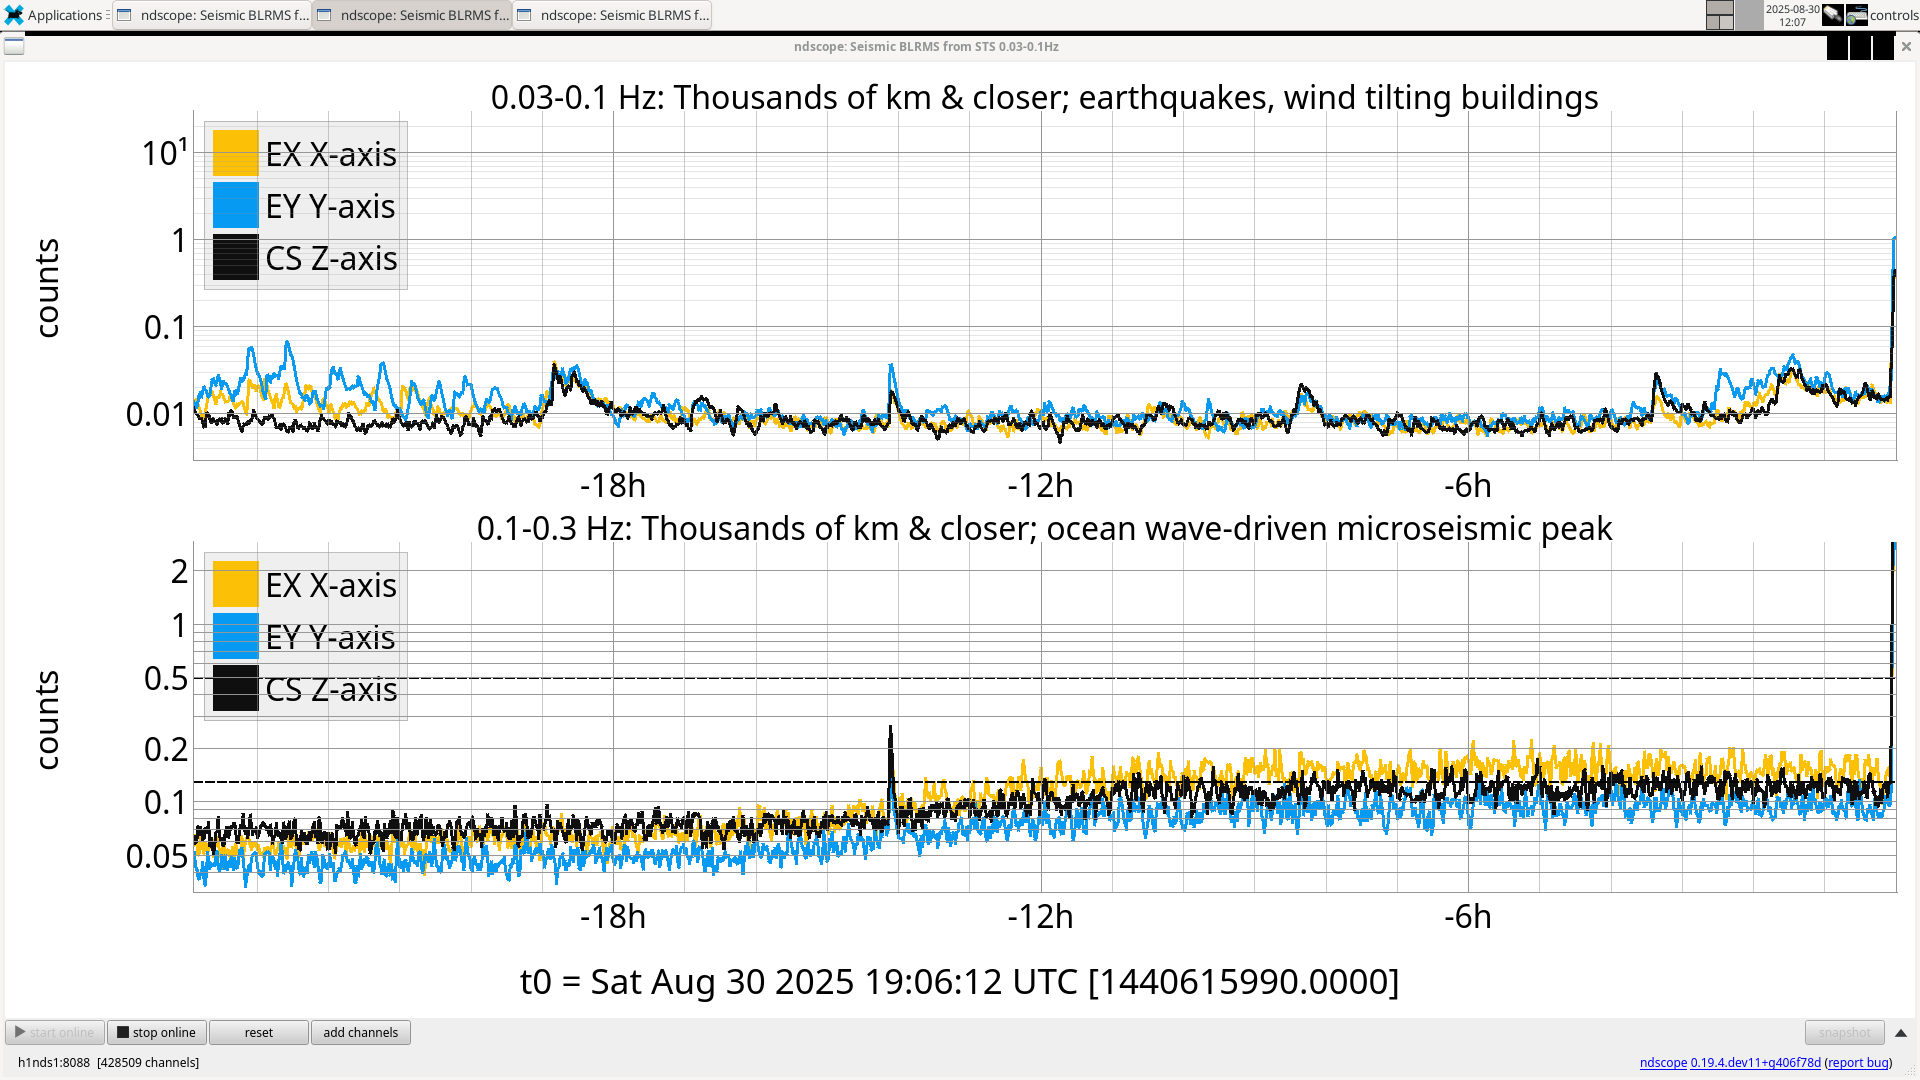
19:01 Lockloss during calibration sweep due to sudden local earthquake
- Initial alignment run
21:10 NOMINAL_LOW_NOISE
21:13 Observing
TITLE: 08/30 Eve Shift: 2330-0500 UTC (1630-2200 PST), all times posted in UTC
STATE of H1: Observing at 158Mpc
OUTGOING OPERATOR: Oli
CURRENT ENVIRONMENT:
SEI_ENV state: CALM
Wind: 11mph Gusts, 5mph 3min avg
Primary useism: 0.01 μm/s
Secondary useism: 0.13 μm/s
QUICK SUMMARY:
Handoff from Oli was straightforward. I'll monitor L1 for downtime, in case H1 can have an opportunity for a Simulines Calibration opportunity (simulines failed earlier due to the Nevada EQ). H1's currently been locked for 2.5hrs (almost thermalized).
At the time of this measurement, we had been Locked for over 17.5 hours and so we were well thermalized. Close to the very end of simulines (4 excitations still running), we had a lockloss due to a local earthquake, so we only have the broadband measurements.
Broadband
2025-08-30 18:32:35 - 18:37:53 UTC
/ligo/groups/cal/H1/measurements/PCALY2DARM_BB/PCALY2DARM_BB_20250830T183242Z.xml
Lockloss at 2025-08-30 19:01 UTC due to sudden local earthquake (picket fence, ndscope) right near the end of running simulines. We had been Locked for just over 18 hours.
21:13 UTC Back to Observing
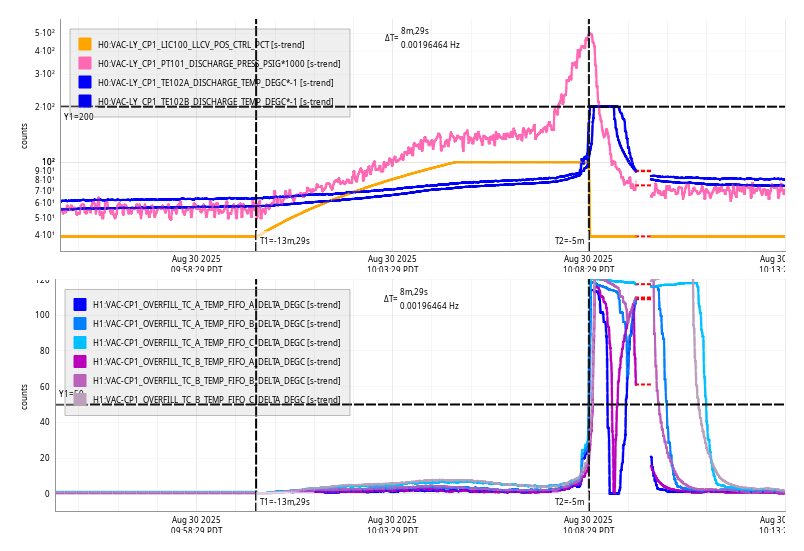
Sat Aug 30 10:08:29 2025 INFO: Fill completed in 8min 25secs
TITLE: 08/30 Day Shift: 1430-2330 UTC (0730-1630 PST), all times posted in UTC
STATE of H1: Observing at 156Mpc
OUTGOING OPERATOR: Tony
CURRENT ENVIRONMENT:
SEI_ENV state: CALM
Wind: 1mph Gusts, 0mph 3min avg
Primary useism: 0.01 μm/s
Secondary useism: 0.13 μm/s
QUICK SUMMARY:
Observing at 156 Mpc and have been Locked for over 13.5 hours.
Early this morning at 10:24 UTC we had Superevent S250830bp come in on Tony's OWL
TITLE: 08/30 Eve Shift: 2330-0500 UTC (1630-2200 PST), all times posted in UTC
STATE of H1: Observing at 157Mpc
INCOMING OPERATOR: Tony
SHIFT SUMMARY: One lockloss with an easy recovery, we've been locked for 4 hours.
LOG: No log.
01:01 UTC Observing
03:27 UTC Superevent S250830m
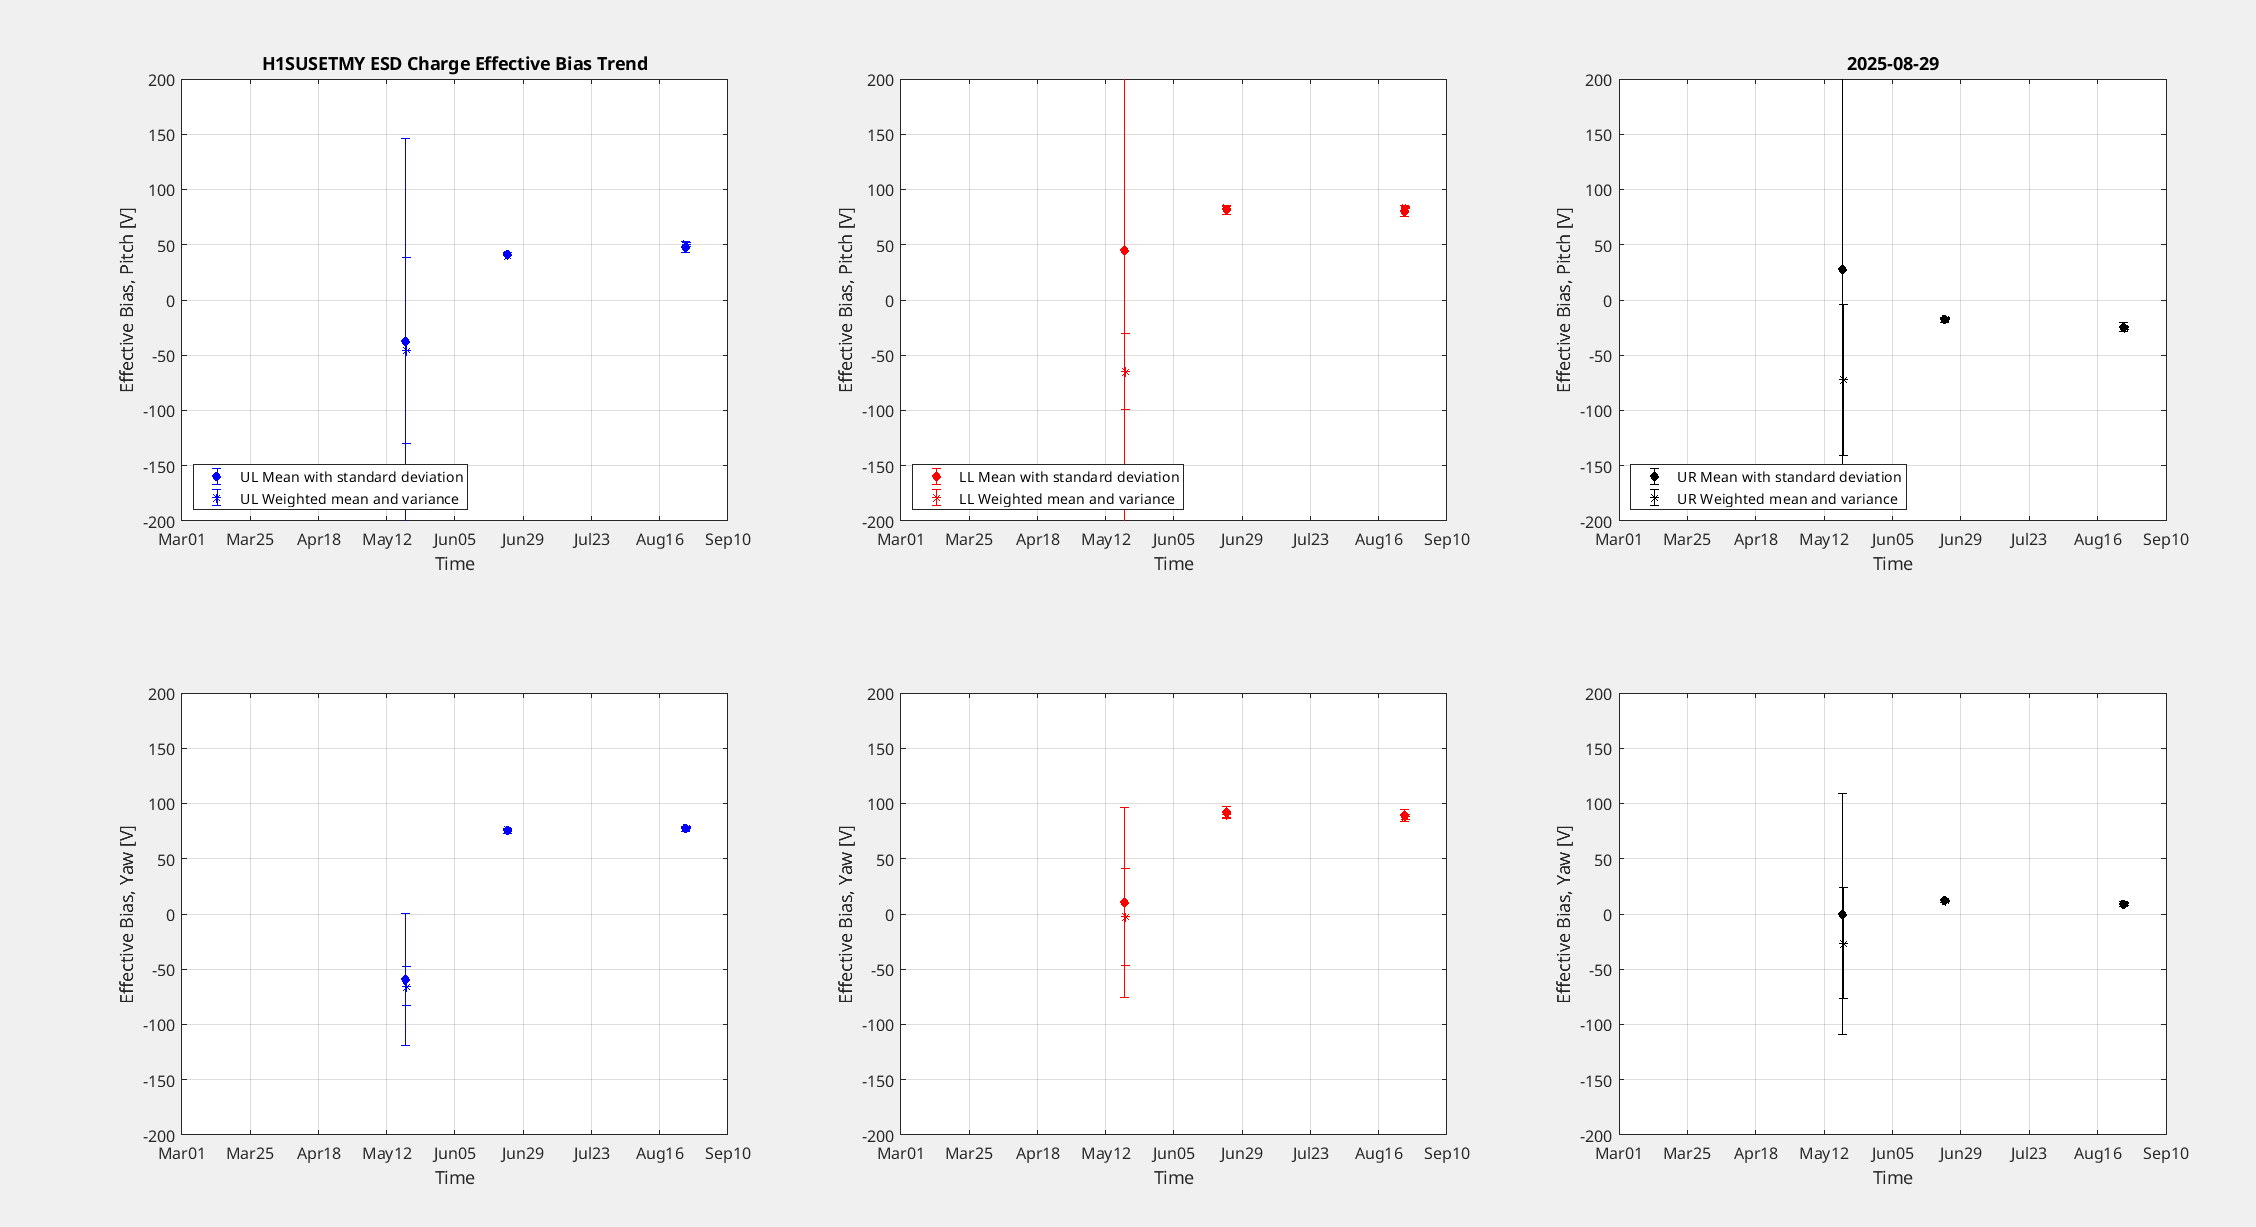
I processed the OPLEV charge measurments that Rahul took on the 26th.
The charge on ETMY looks stable and low. The charge on ETMX appears high, the error bars are quite large but even with those each quadrant has increased since the last measurement.

23:31 UTC lockloss
01:01 UTC Observing
TITLE: 08/29 Day Shift: 1430-2330 UTC (0730-1630 PST), all times posted in UTC
STATE of H1: Observing at 154Mpc
INCOMING OPERATOR: Ryan C
SHIFT SUMMARY:
IFO is (still) in NLN as of 21:48 UTC Aug 28 (25 hrs 30 mins) and OBSERVING
Nothing has changed in the last 9 hours.
LOG:
| Start Time | System | Name | Location | Lazer_Haz | Task | Time End |
|---|---|---|---|---|---|---|
| 17:14 | OPT | Jeff | Optics Lab | Local | SPI Inventory and Photography | 17:57 |
| 20:52 | OPT | Camilla | Optics Lab | Local | Class B Part Work | 21:31 |
TITLE: 08/29 Eve Shift: 2330-0500 UTC (1630-2200 PST), all times posted in UTC
STATE of H1: Observing at 151Mpc
OUTGOING OPERATOR: Ibrahim
CURRENT ENVIRONMENT:
SEI_ENV state: CALM
Wind: 7mph Gusts, 4mph 3min avg
Primary useism: 0.01 μm/s
Secondary useism: 0.06 μm/s
QUICK SUMMARY:
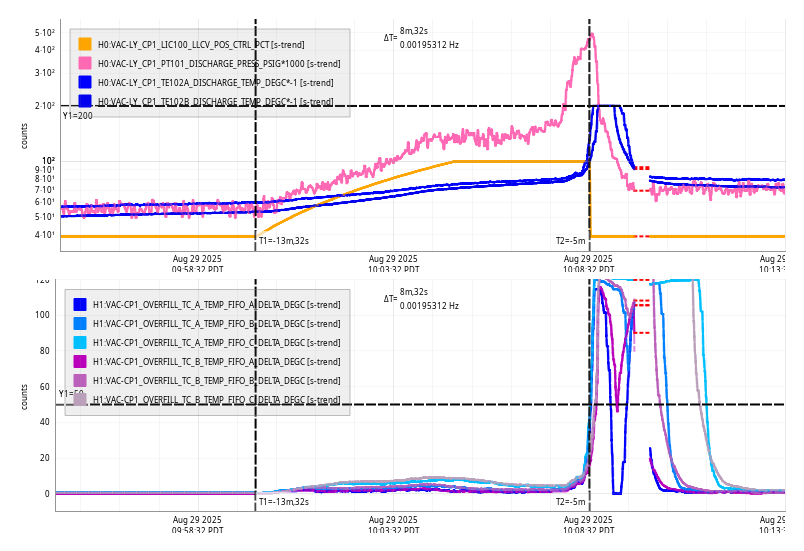
Fri Aug 29 10:08:32 2025 INFO: Fill completed in 8min 29secs
Gerardo confirmed a good fill curbside.
(Jordan V., Tony S., Gerardo M.)
Late entry
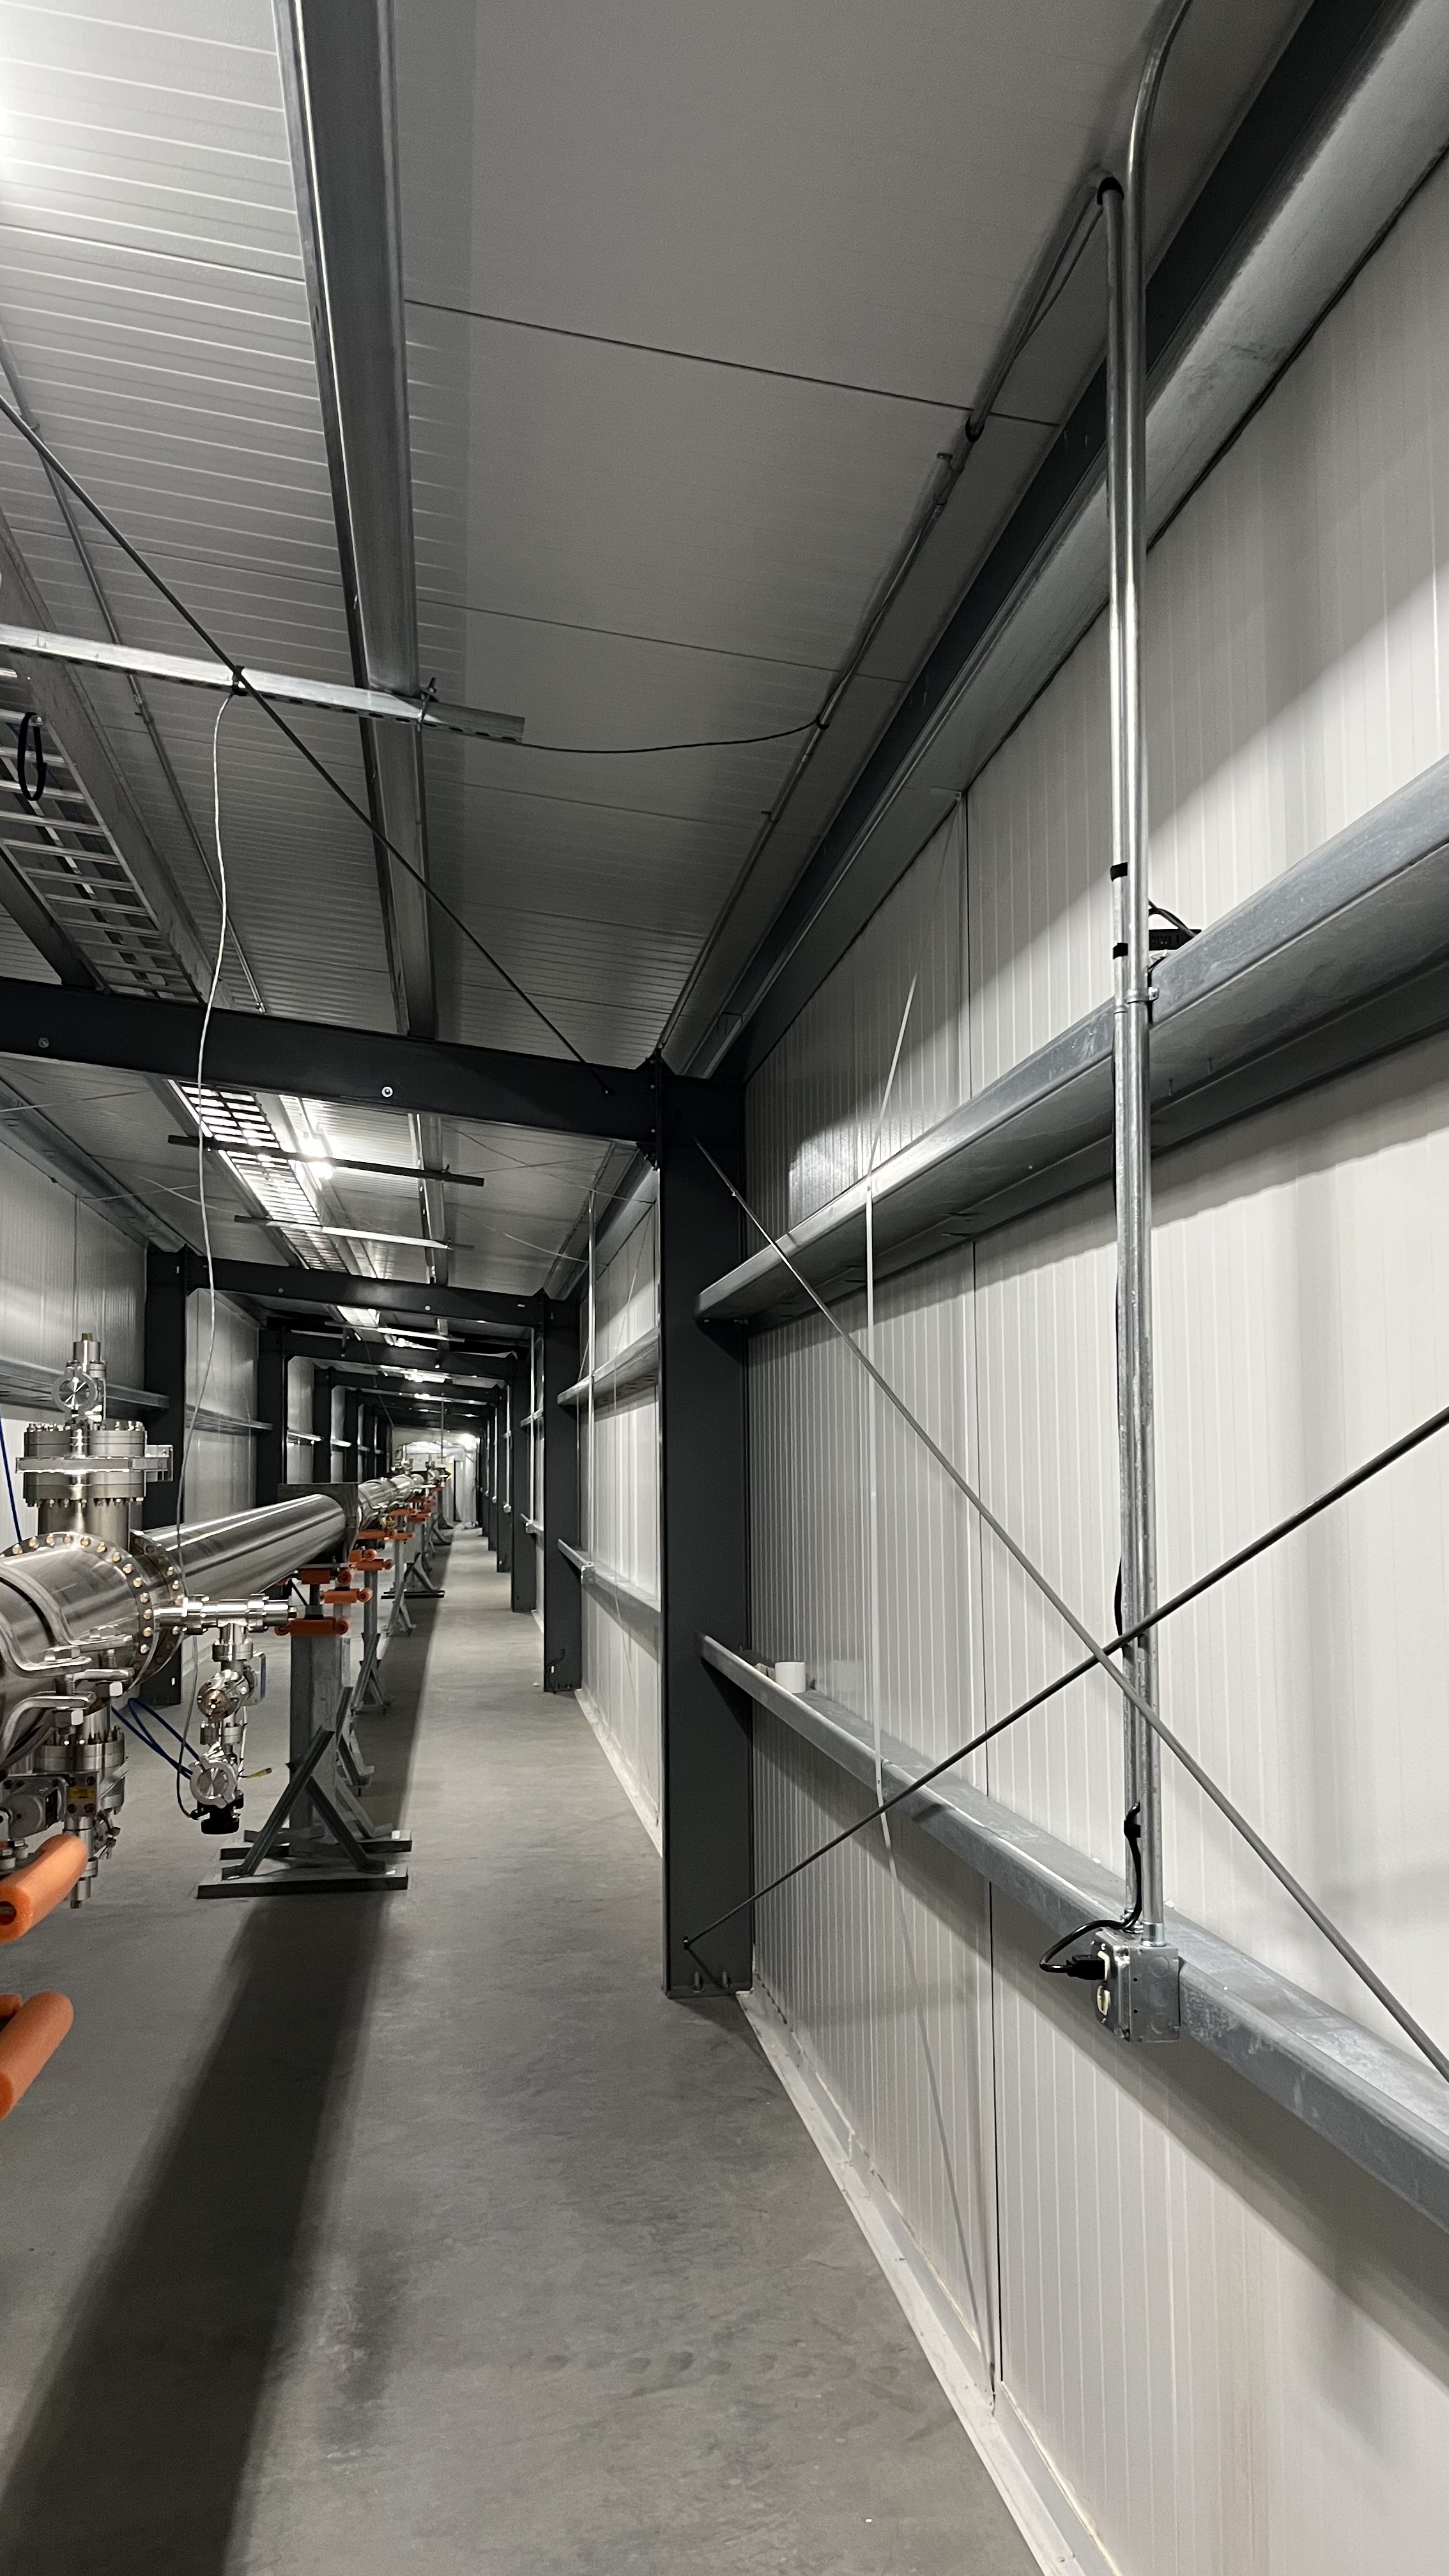
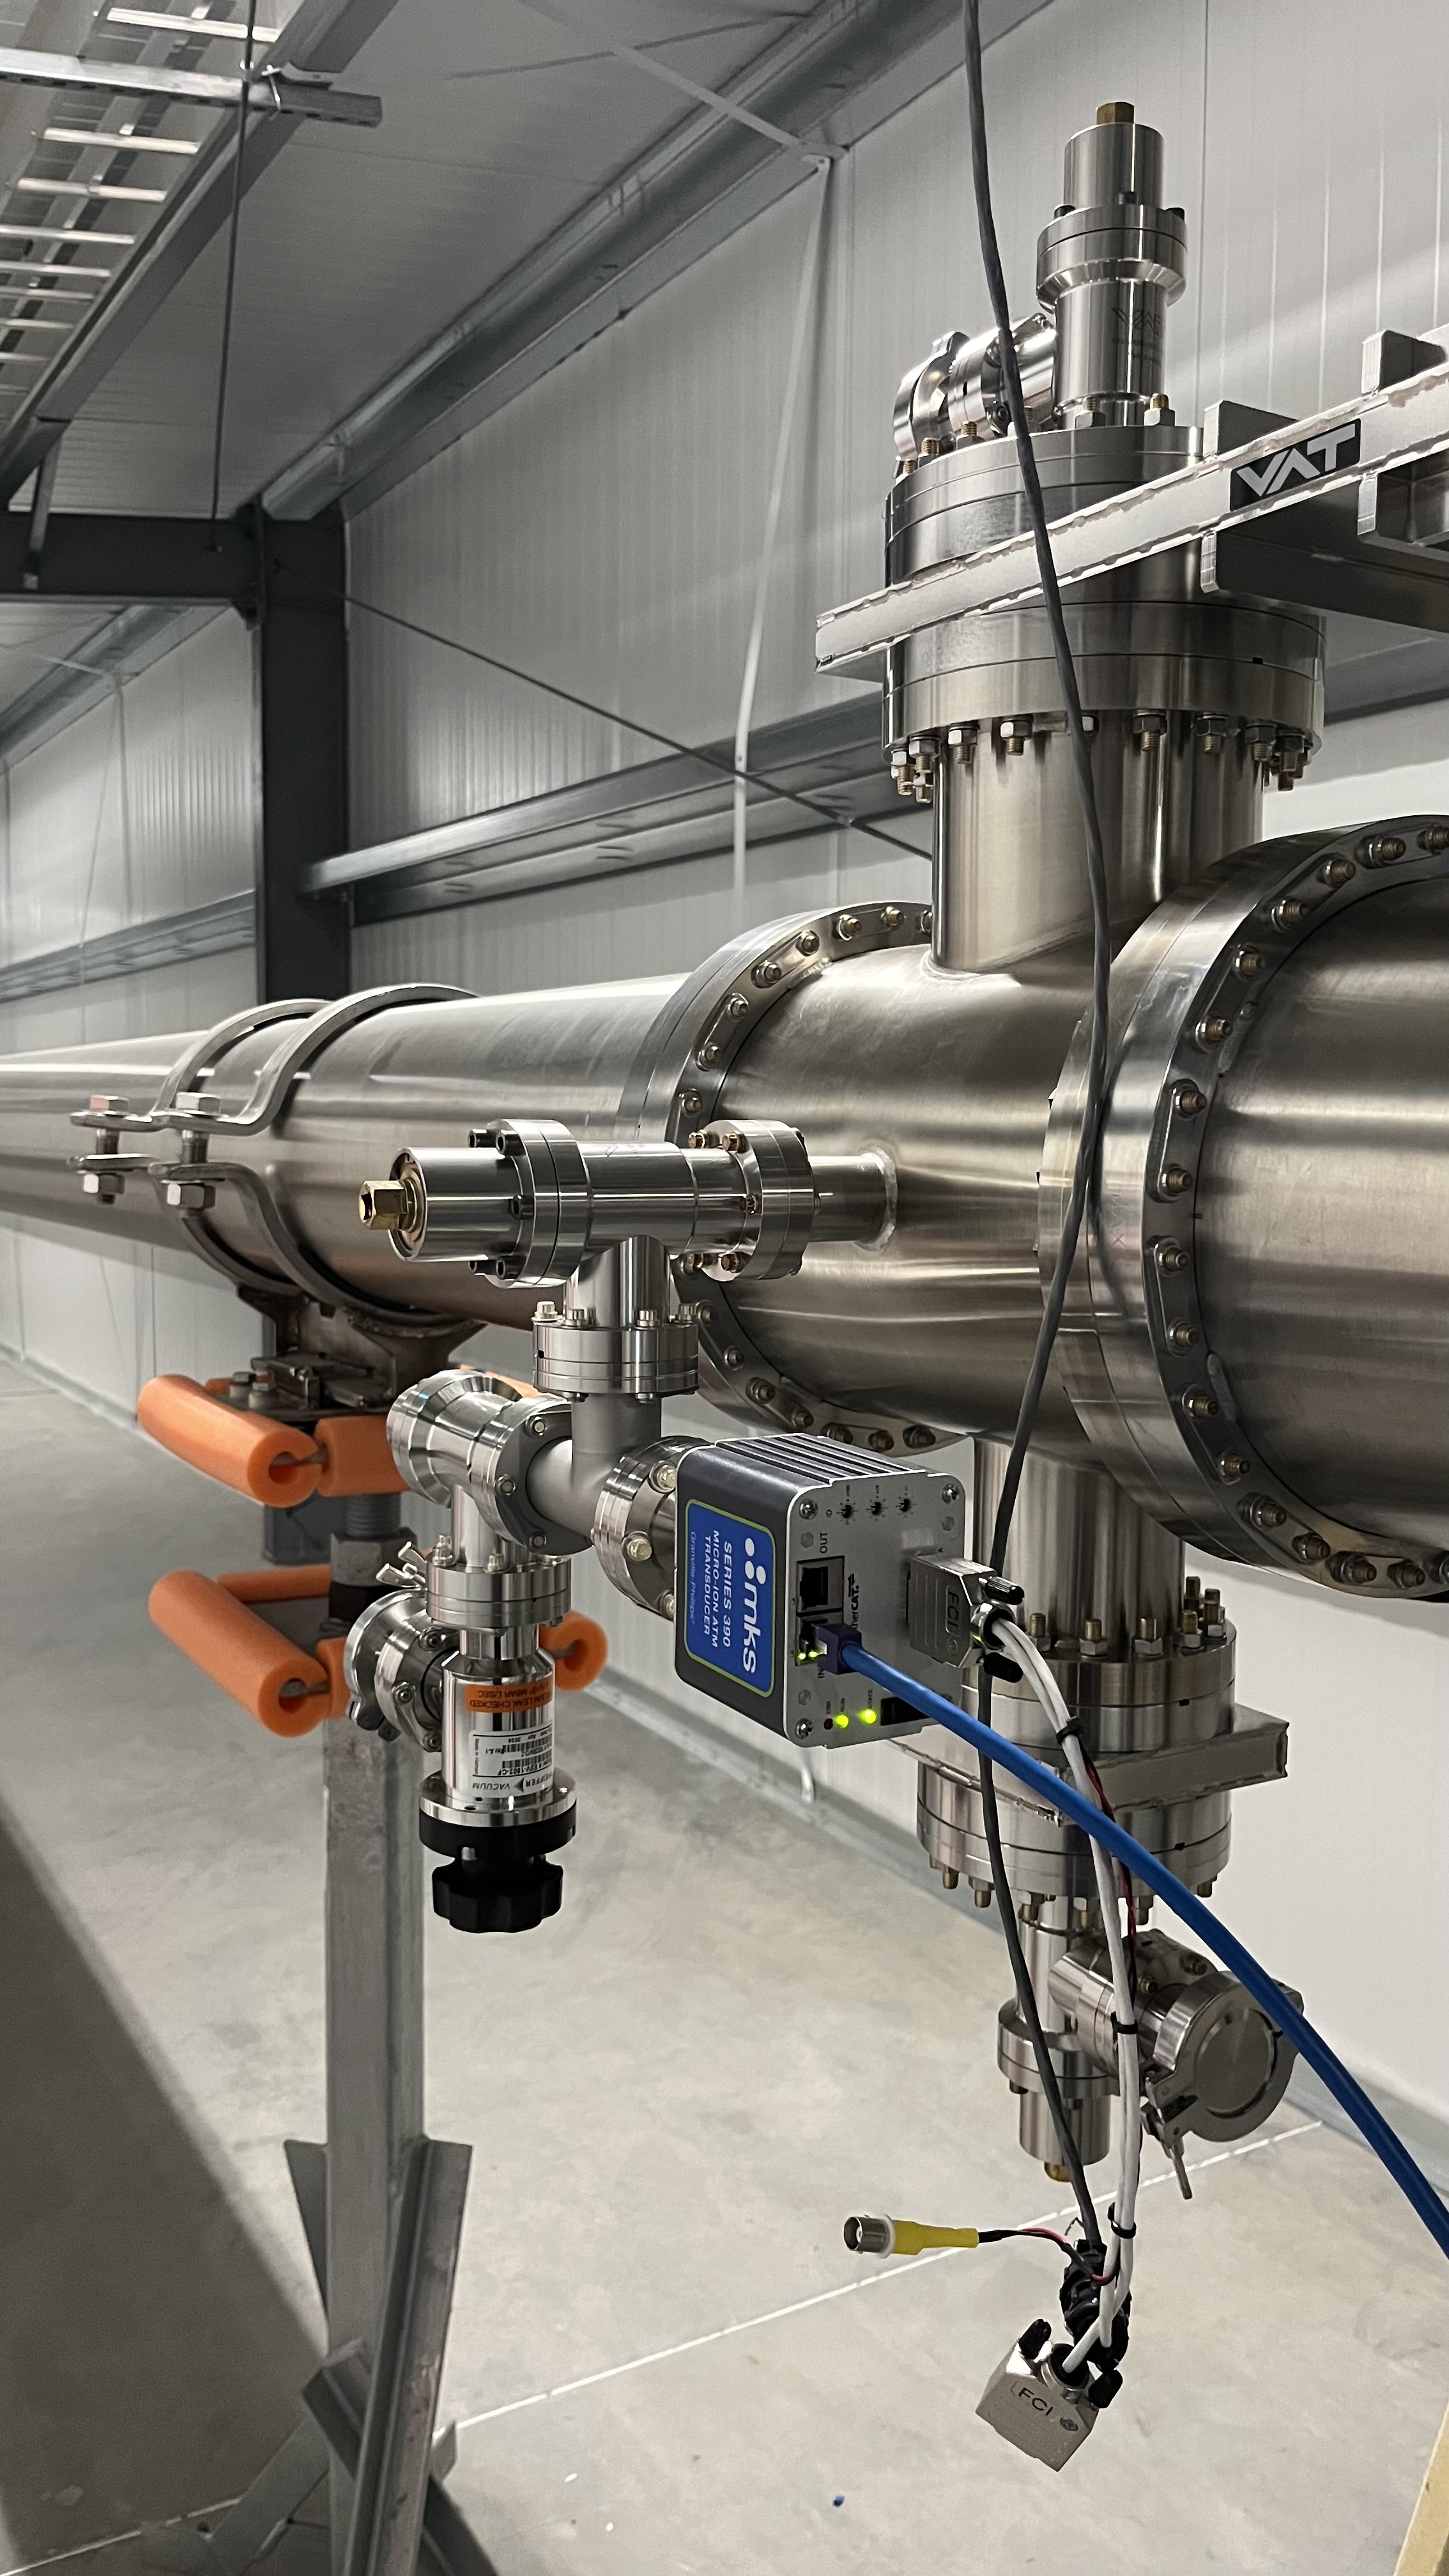
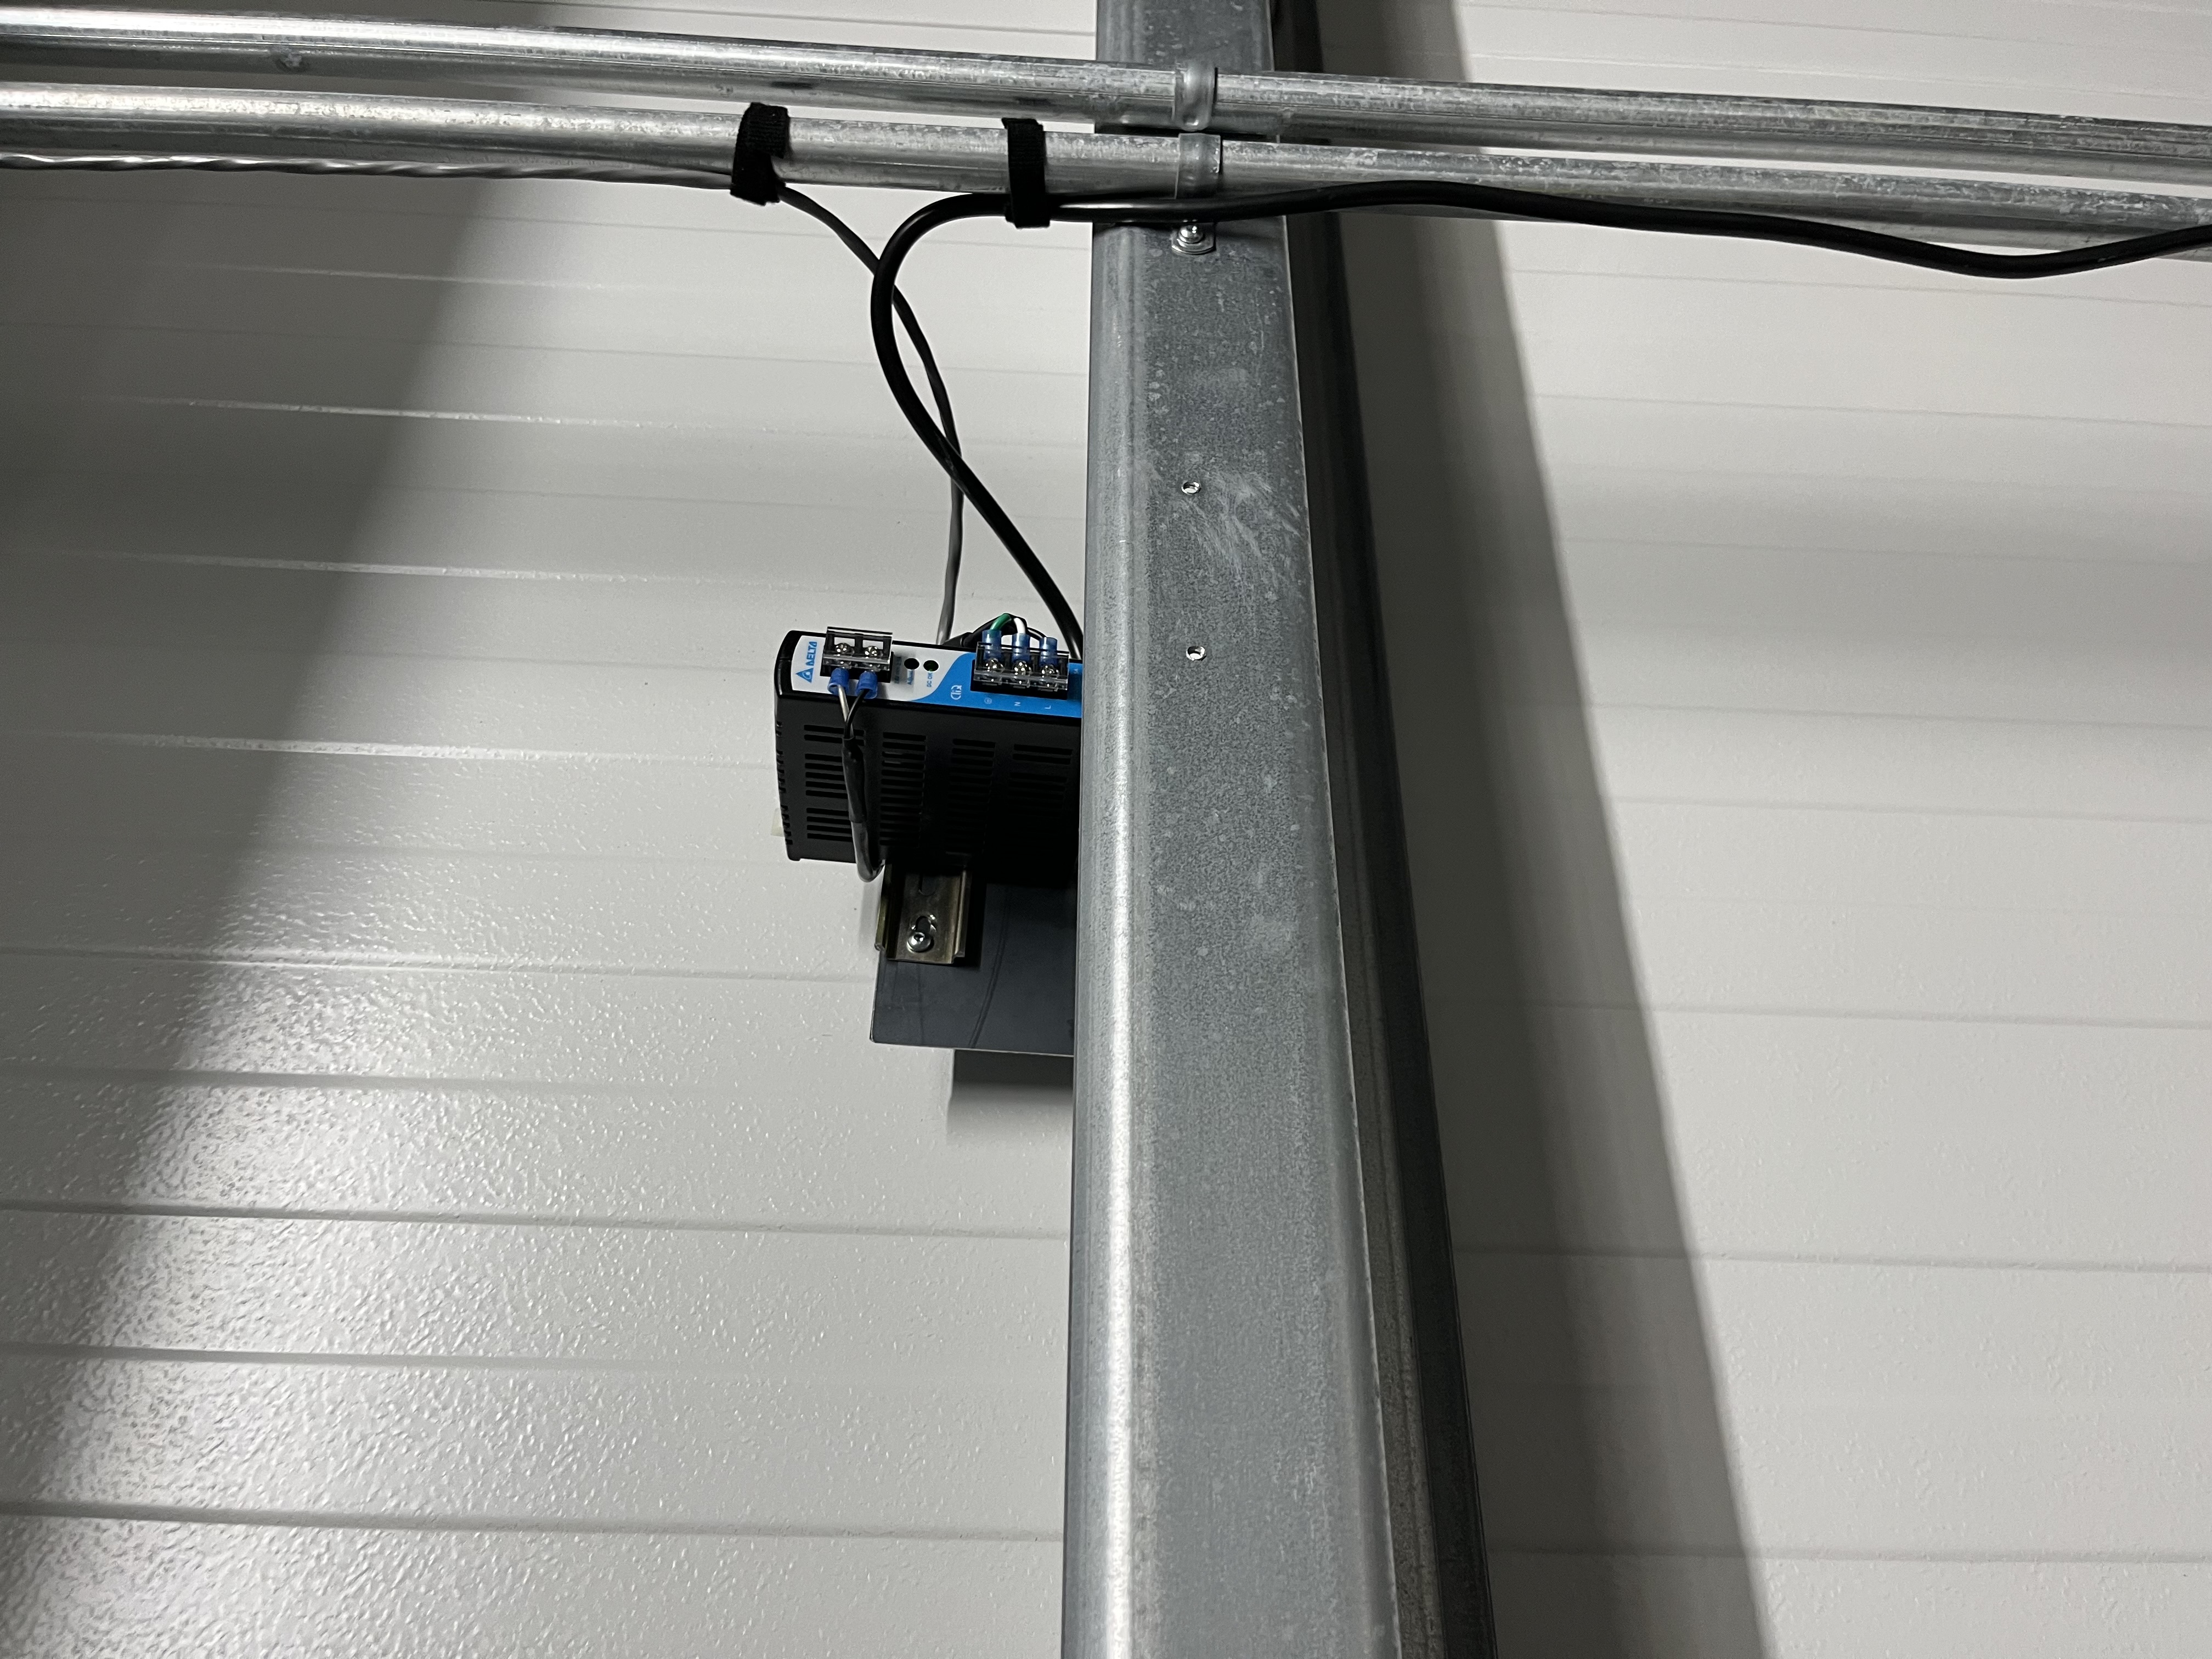
To get the gauge working at the filter cavity tube cross C7 we pulled the EtherCAT cable from cross C7 to cross D1, this allowed us to daisy chain the gauges at both crosses. To land the EtherCAT cable both ends were terminated, thanks Tony. To get power to the gauge we used one of the outlets in the filter cavity enclosure and a small din rail mountable power supply, the supply provides 24 VDC. Patrick took care of the software, see his aLOG here.
Currently we have the following items valved out along the filter cavity, two ion pumps;IPFCC6, IPFCC8, and the gauge PTCC7. We plan to incorporate them to the main vacuum volume on the next couple of weeks. Pressure at the gauge is low, thus we need to pump its volume down using an aux cart and a small turbo pump.
Last tuesday I was able to valve in the last two ion pumps into the filter cavity tube envelope, two of the 10" isolation valves at section C were closed to achieve this, then as the internal pressure of the filter cavity tube settle the isolation valves were opened.
Something to note with the performance of the HV cable for IPFCC8 (ion pump a the filter cavity cross 8) is a bit noisy, I noticed that the controller got noisy when I touched the HV cable, but will check both at a later time, maybe cable, grounding and/or controller issue.
(Anna I., Jordan V., Gerardo M.)
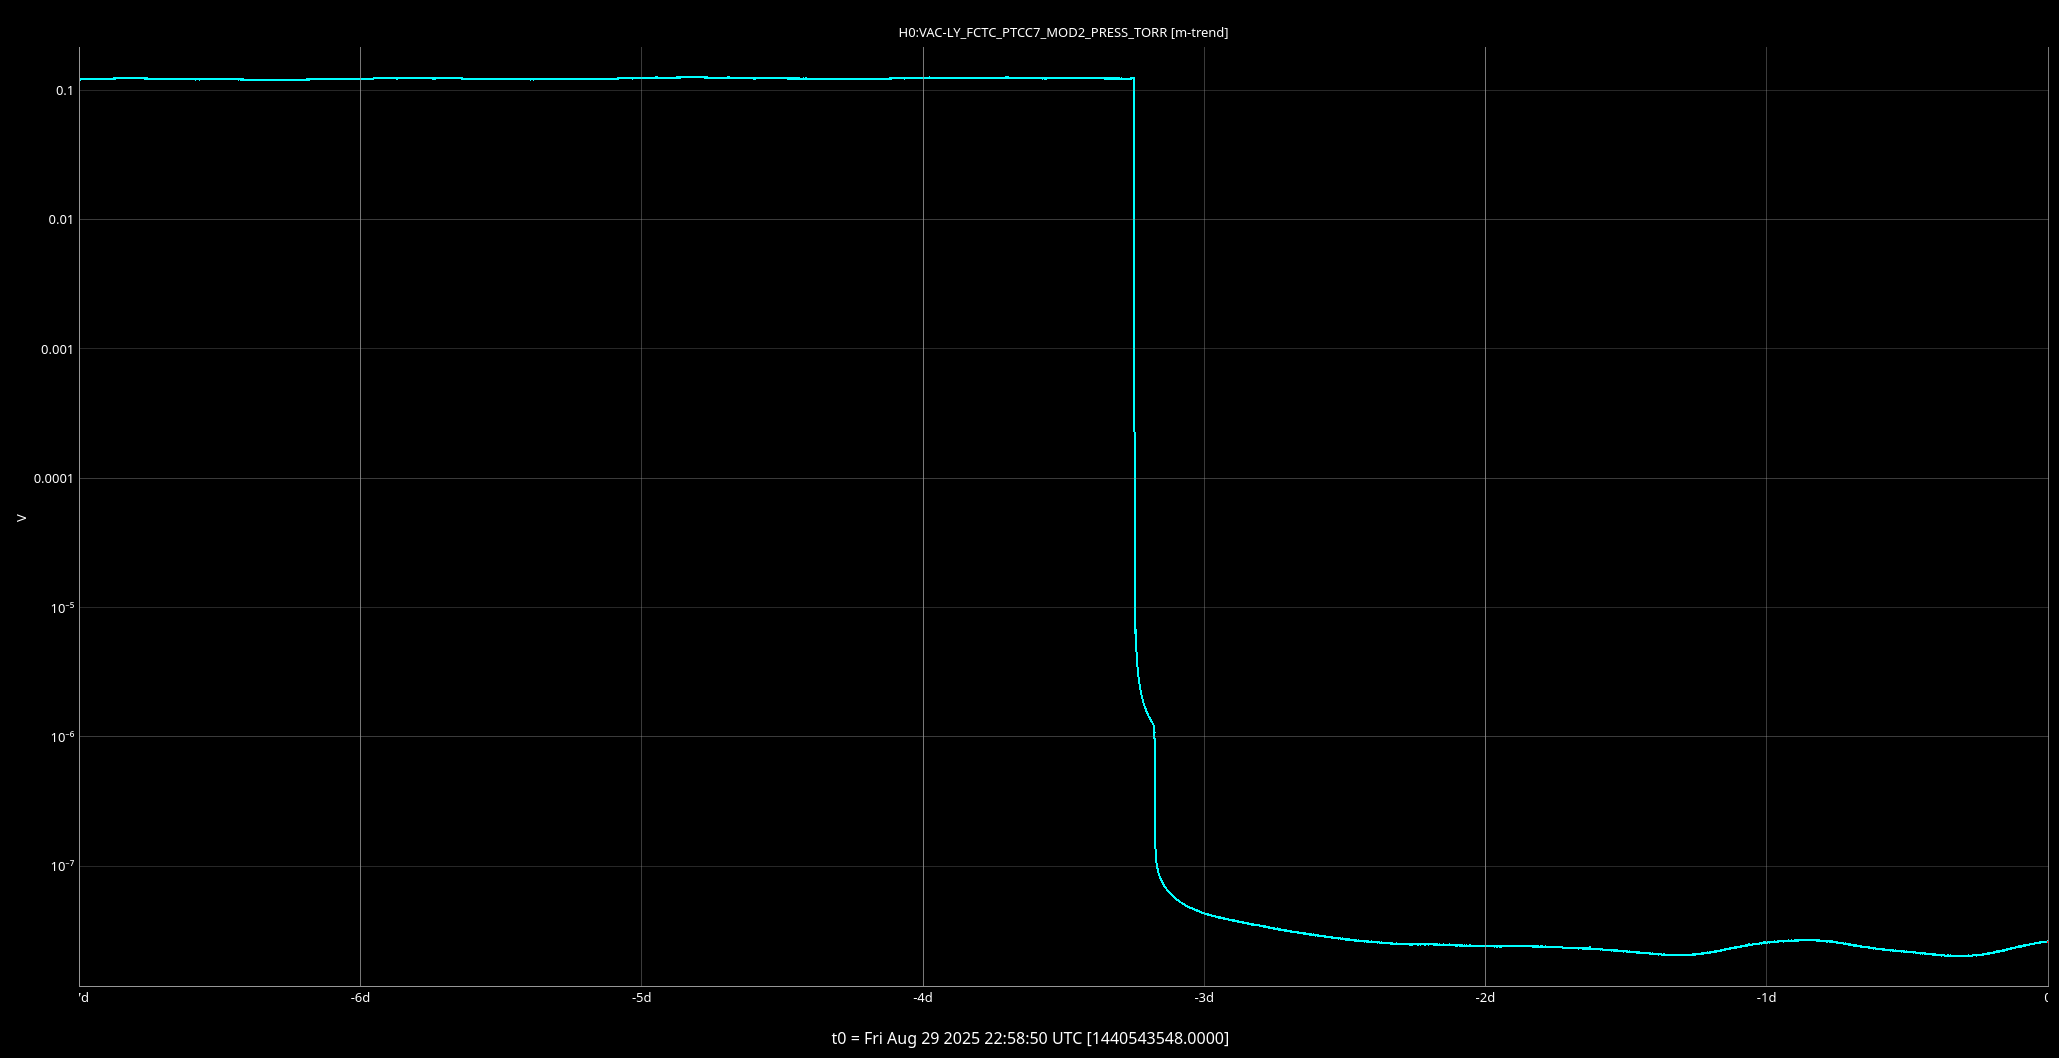
Last tuesday we valved in a gauge to the filter cavity tube vacuum volume.
We pumped the dead volume down until the pressure reached high 10^-07 torr, then introduced the gauge to the "short" volume of the filter cavity tube, we had closed two isolation valves, we waited about 10 minutes, then the isolation valves were opened. No issues to report.
18:33 UTC Back to Observing