TITLE: 05/02 Day Shift: 15:00-23:00 UTC (08:00-16:00 PST), all times posted in UTC
STATE of H1: Lock Acquisition
OUTGOING OPERATOR: Corey
CURRENT ENVIRONMENT:
Wind: 11mph Gusts, 9mph 5min avg
Primary useism: 0.02 μm/s
Secondary useism: 0.10 μm/s
QUICK SUMMARY: Lost lock right before I showed up, ALSX seems to have good power (~1.05) but the WFS will pull it away after they engage. The polarization is around 20% and cannot be reduced, I'm sure this isn't helping. Aquired PMRI though so we should be okay.
TITLE: 05/02 Owl Shift: 07:00-15:00 UTC (00:00-08:00 PST), all times posted in UTC
STATE of H1: Lock Acquisition
INCOMING OPERATOR: TJ
SHIFT SUMMARY:
130-sec-period ASC yaw oscillation continues. Attaching ASC ndscope (template from "Locking" medm) which shows the oscillation seen on ASC PRC1 and noisiness seen on ASC DC1 & 2 (which don't quite line up with each other). This has probably already been looked at, but just posting for kicks.
ALSx & y are no longer on DIAG_MAIN (see earlier alog).
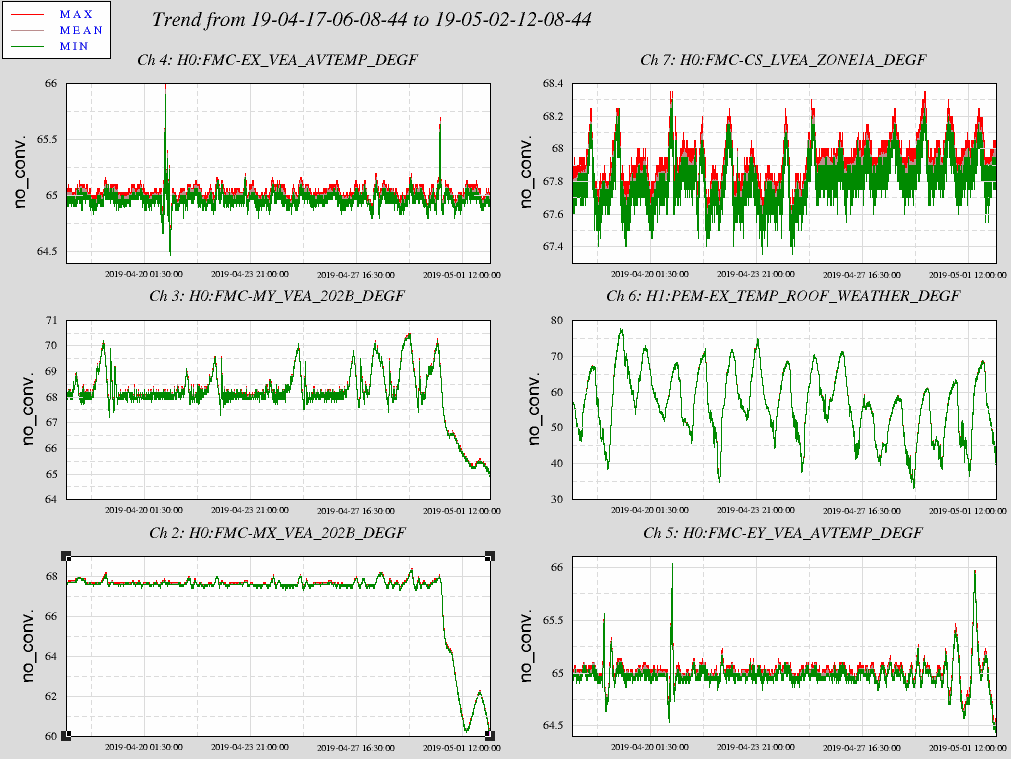
Temperature issues observed at mid stations and EY (Bubba notified and commented on my entry).
LOG:
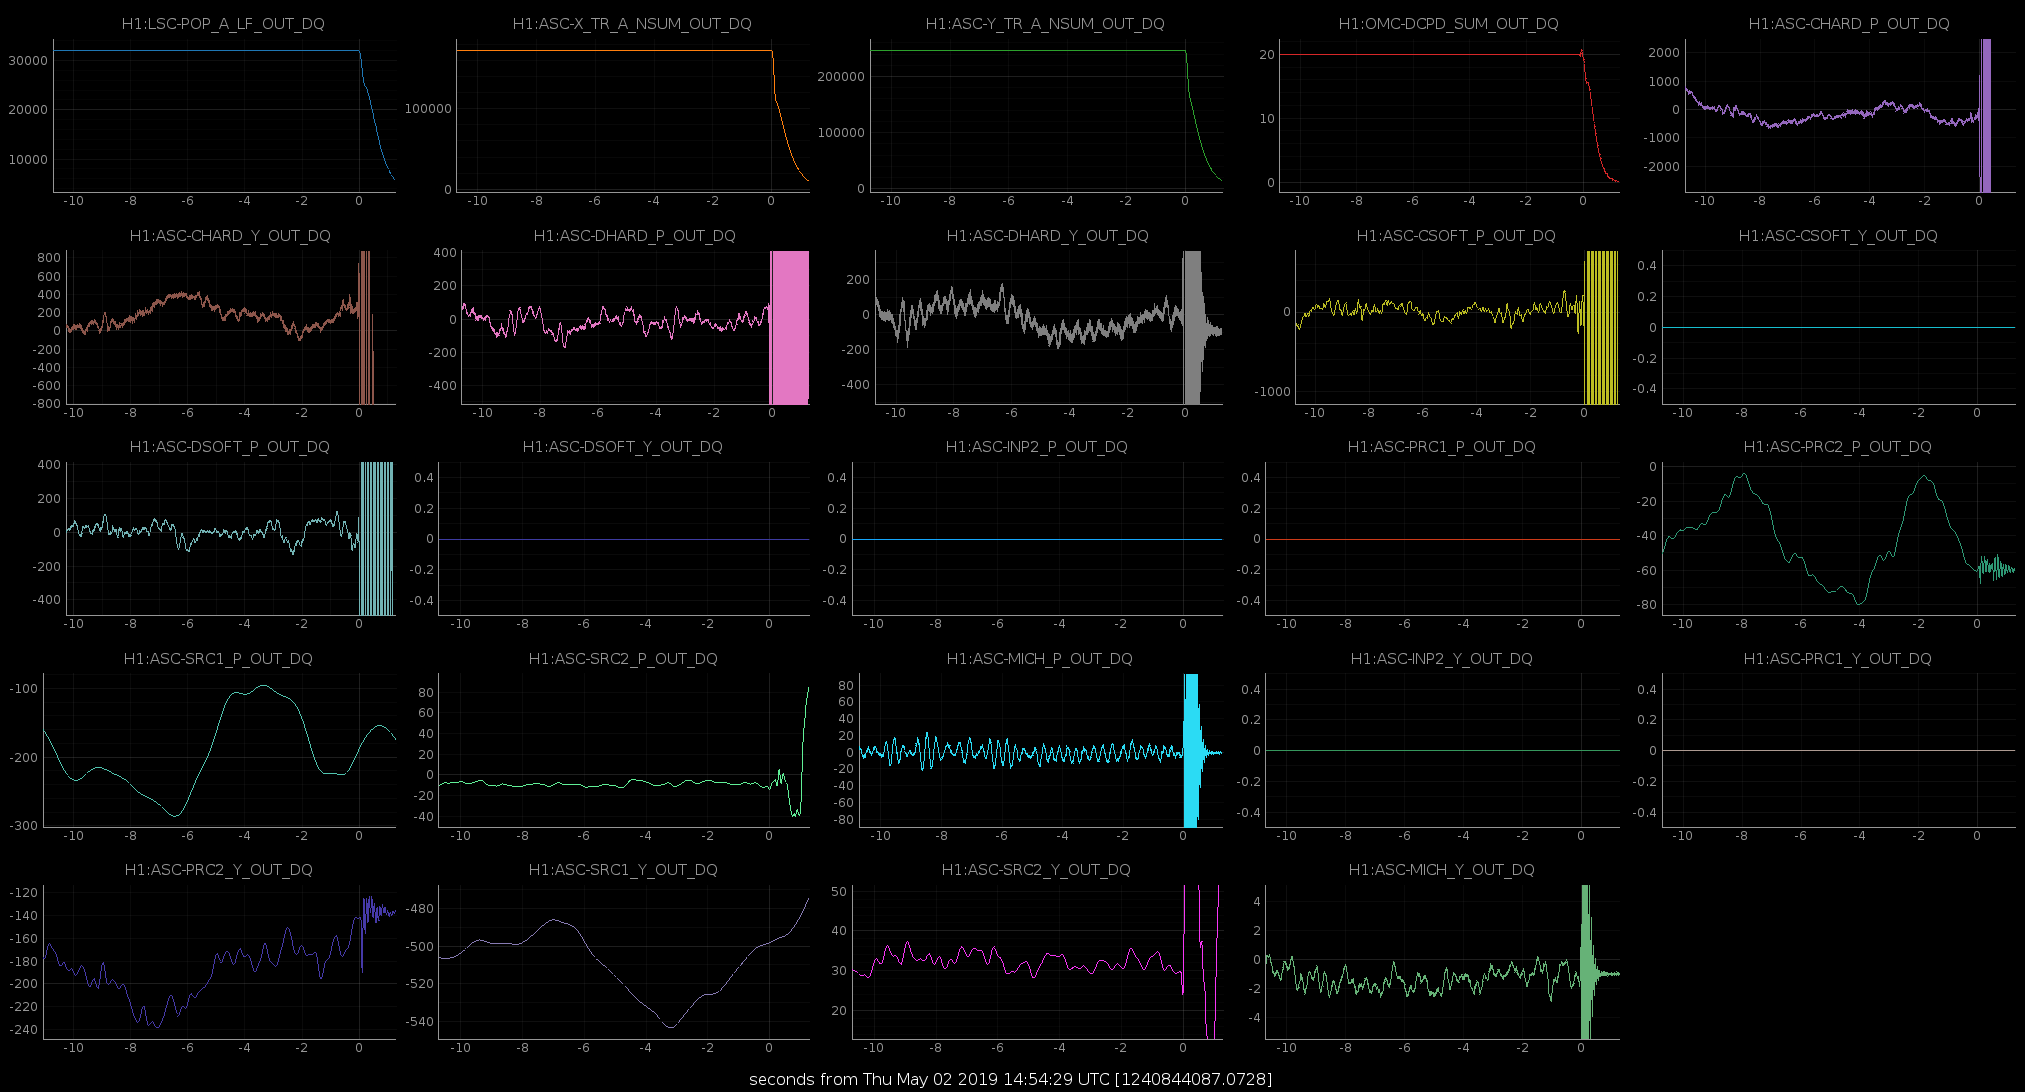
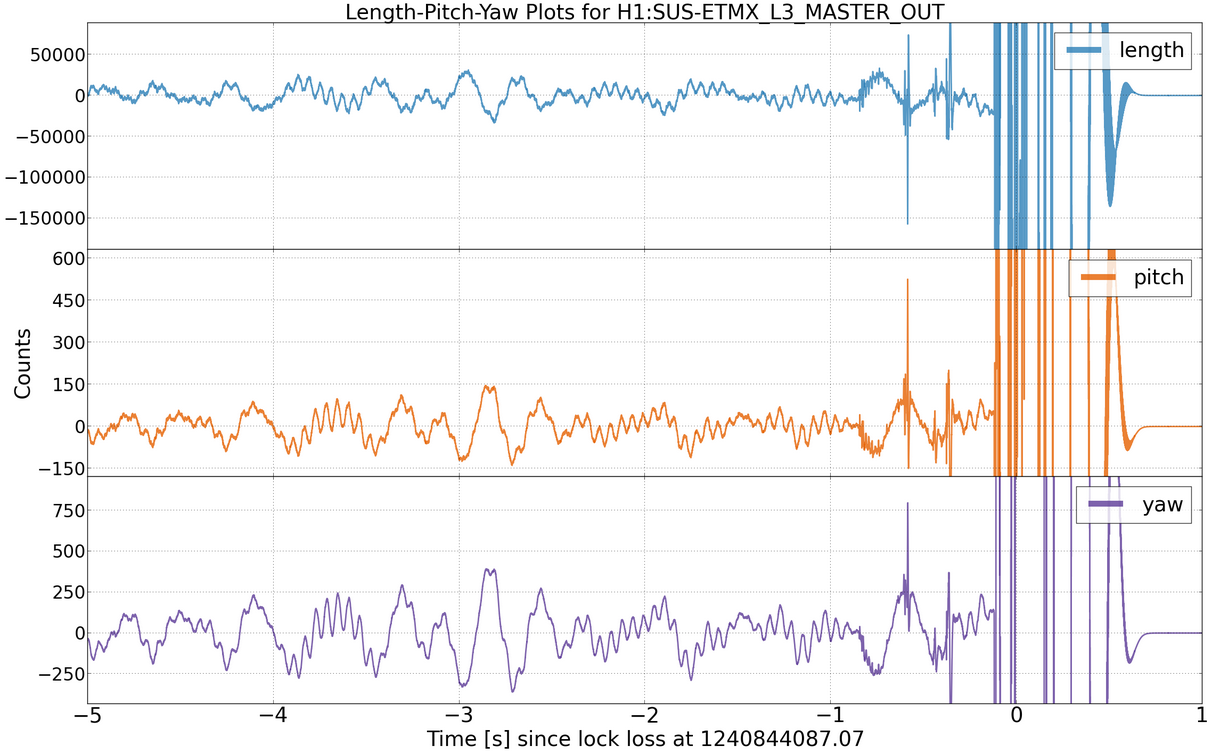
Here's a few interesting things I found for the lock loss:
1st attachment - Doesn't show any signs of struggle really.
2nd attachment - Bit of a glitch right before the lock loss?
On the lock loss page there are a few signals that are looking suspect a few seconds before the lock loss (IMC WFS, LCS_REFL_A_LF, more), but nothing that I can make a inference about.
On Tues at between 10am-noon PDT noticed temperature issues in outbuildings, MX & MY took a step down in temperature (8 degF for MX & 4 degF for MY). MX has started its LOW temp alarms this morning just after 5am.
Thank you Corey for this observation, we are not trying to hold the mid station temperatures to the same tolerances as the end and corner stations. We performed maintenance on the HVAC systems on all buildings on Tuesday morning which may be the reason for the fluctuation in temps at the end stations. According to my FMCS monitoring, the temperatures in the buildings where the instrument is located seem to have stabilized after the maintenance period.
H1 in OBSERVING for last 2hrs45min. Noticing 130sec-period oscillation on ASC/LSC signals (as others have posted?). Winds died down about 2hrs ago.
Wanted to post some info on the Injection situation.
5:23utc: Verbal Alarm says, "CW injections have stopped"
This put a red Excitation light on H1CALINJ on the CDS Overview. (Nothing is red on H1CALINJ when you look at its medm window.)
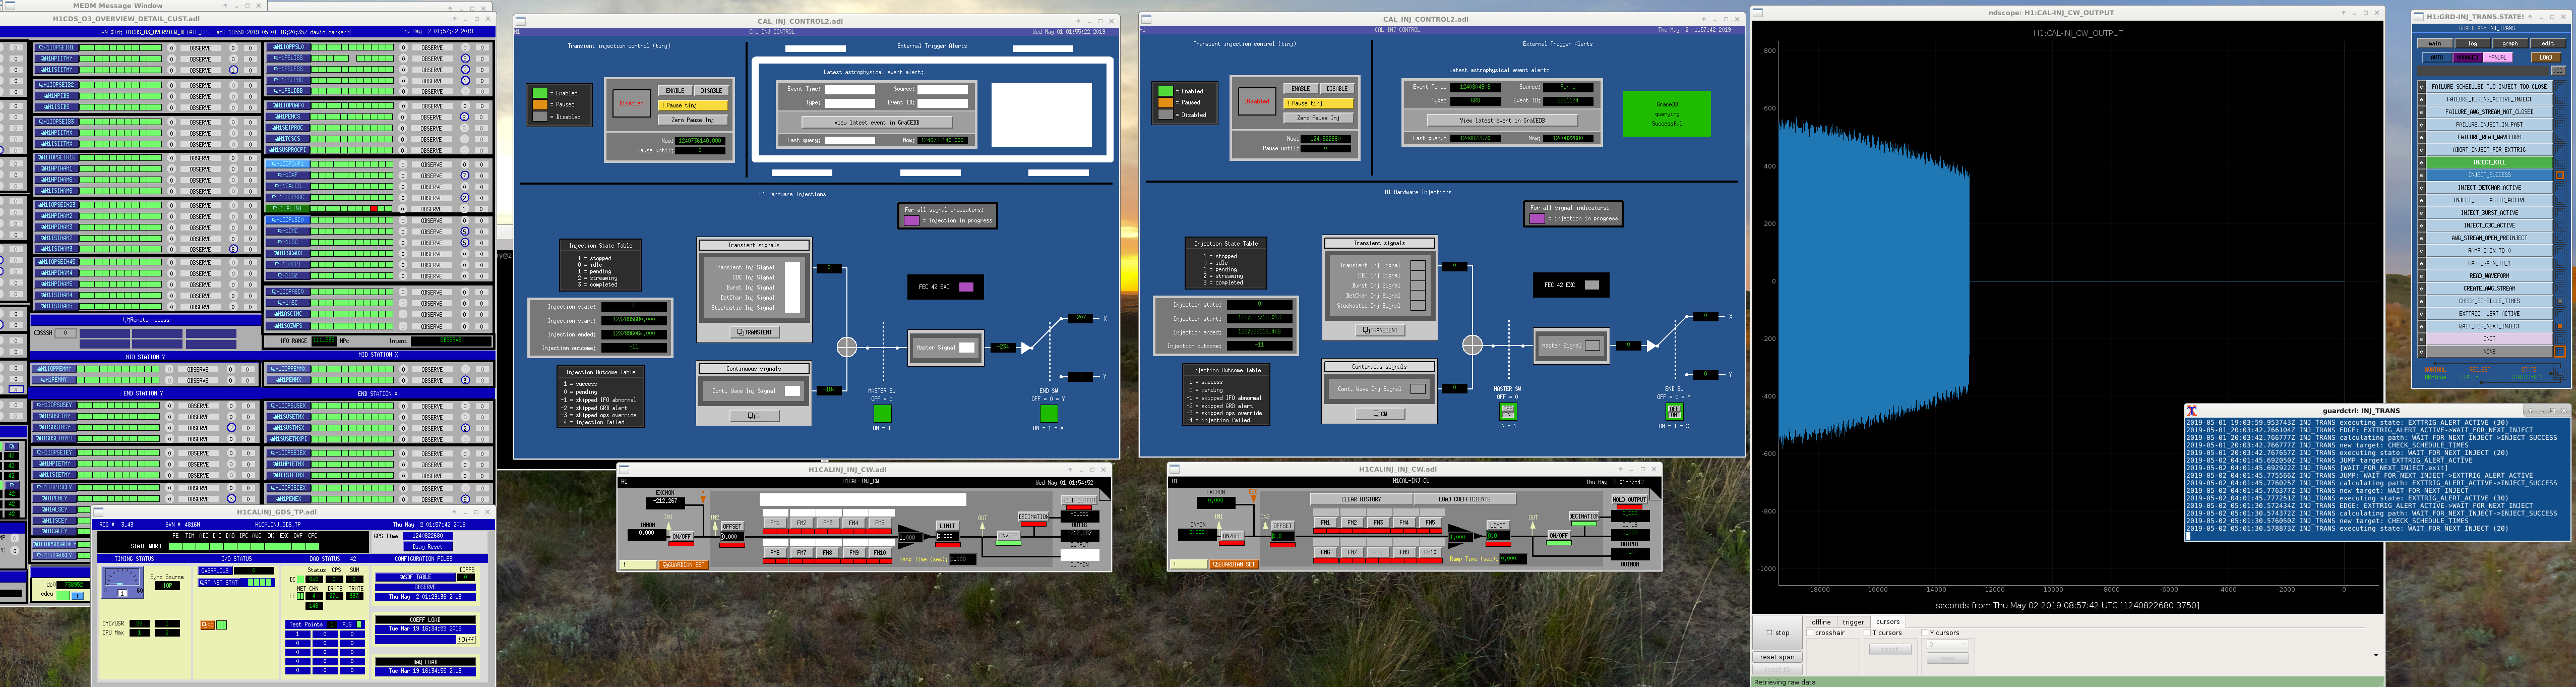
On the CAL_INJ_CONTROL2.adl medm (via sitemap/CAL/HWINJ CTRL), there's nothing RED or alarming for CW. When opening the CW button you get its filter bank, and on this only the OUTPUT is ON and all three OUTPUT channels are zero. A Time Machine of this CW filter bank from 24hrs ago shows same state for OUTPUT only being on, but you can see that the OUTMON does have a signal....this signal (and also the Calibration Injection Master Output signal) also go to zero at 5:23utc. Since there is nothing obvious I can do via the filter bank, I'm assuming this is an issue off-site and so I will leave this for others to address.
Attached is a screenshot of relevant screens to this:
A check at LLO shows CW injections still going on (attached). Unlike the Burst/CBC injections the CW injection use local resources. Now perhaps they have run out of pre-generated data. Yes we need to update our screen to use FEC 42 instead of FEC 117 for injection monitoring.
I restarted psinject (CW) at May 02 2019 15:01:58 UTC. H1 was out-of-lock at the time.
To clarify, CW injections are computed on the fly, in 20-second buffers. There are no off-site file transfers or long-term storage of strain data involved. I believe Dave will be implementing an automatic restart of crashed injections, as exists at LLO.
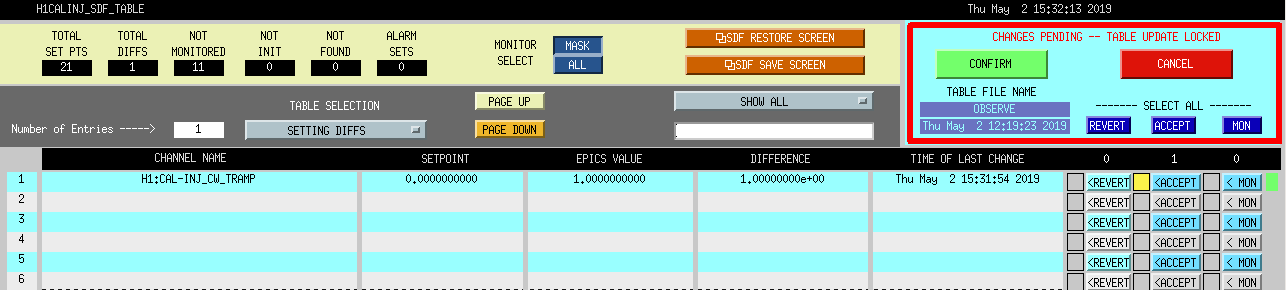
Dave and I changed ours to CAL INJ TRAMP to 1sec.
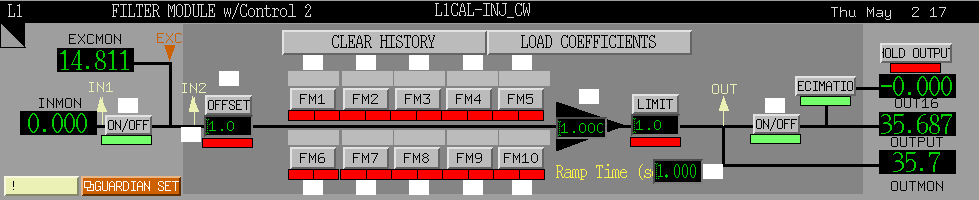
LHO should add ramping to the CW excitation. At LLO, we are using 1 second Ramp Time for L1CAL-INJ_CW (first attachment). However LHO, has a 0-second Ramp Time for H1CAL-INJ_CW (second attachment). This is why the CW injection cut off so abruptly. Both sites have a 2-second Ramp Time on the TRANSIENT. This likely got missed in the upgrade to dedicated CALINJ model.
Notes:
Out of Observing for just under 2-hrs. Lockloss covered shift change/handoff. Here are locking notes:
Started shift with DIAG_MAIN notifications for polarizations greater than 20% for X & Y! So I set up for remotely lowering these.
Powered ON interface and clicked RESTORE.
ALSy: After restore, it dropped from 26 down to 13. I then took it down to 1. GOOD
ALSx: After restore, it went up from 25 to 26. All I could do for this was take it down to 22. Still has DIAG_MAIN notification. NOT GOOD
TITLE: 05/02 Owl Shift: 07:00-15:00 UTC (00:00-08:00 PST), all times posted in UTC
STATE of H1: Lock Acquisition
OUTGOING OPERATOR: Jeff
CURRENT ENVIRONMENT:
Wind: 18mph Gusts, 14mph 5min avg
Primary useism: 0.02 μm/s
Secondary useism: 0.10 μm/s
Microseism well below 50th percentile with slight breezes.
QUICK SUMMARY:
Got the handoff from Jeff. H1 had just had a lockloss and I will be working on that ASAP. H1CALINJ has a RED indicator and this is due to an INJECTION issue ("Hardware Injections stopped").
NOTE: BOTH ALSx & y have notifications of fiber polarization greater than 20% (I remember one of the [x?] seems to always be near there & can't be improved from the Control Room). ALSy has not been locking for Jeff, perhaps this is a reason. Will investigate this.
Philippe, Sharan, Kara, Anamaria, Robert
The HVAC reduces our range by 3 or 4 MPc (https://alog.ligo-wa.caltech.edu/aLOG/index.php?callRep=48649 ). Shutting down the various stations showed that the corner station is the worst culprit but there also appears to be some coupling at EX. Figure 1 shows that the HVAC is affecting DARM in the 30-90 Hz region. The lower plot in Figure 1 shows that, at the corner station, the HVAC increases ground and septum motion above a few Hz. This is in the frequency band that we can shake with the big shaker, so we would hope to be able to reproduce the HVAC effect, though, of course, local shaking would differ some from the more global shaking produced by the HVAC.
A preview of the LVEA vibration coupling summary from the recent PEM injection program suggests that the strongest coupling site in the 30-90 Hz band is in the HAM5/6 area (Figure 2a). Impulse injections narrow the coupling site down to the septum (https://alog.ligo-wa.caltech.edu/aLOG/index.php?callRep=48886 ). Figure 2b suggests that the noise from the motion of the septum when the HVAC is on would be a factor of about 3 below the DARM floor. This would be enough to produce the several percent change in DARM when the HVAC was turned off and the septum motion was reduced by a factor of 1.5 to 2.
IFO is locked at NLN and Observing, with 110.9Mpc of range. The wind is up into the mid teens with a few gusts topping 20mph. Primary microseism is elevated as well. All else appears normal at this time.
J. Kissel
As a part of the review of the DARM loop model and the real-time / low-latency calibration pipeline, we've begun to make plots that assess the impact of various systematic errors as they creep in from step to step on the way to producing the astrophysically consumed h(t). The places where systematic error can be incurred are:
(1) Measurement to pyDARM model reproduction -- we fail to model what we've measured in the DARM loop (e.g. the L2A2L PUM problem, or the acausal phase rotation with SRC optical spring)
(2) pyDARM model to CAL-CS / Front-end reproduction (real-time IIR filters) -- due to limitations of foton and any real-time digital system, we fail to reproduce pyDARM in the front end
(3) pyDARM model to GDS reproduction (low-latency FIR filters) -- due to the limitations if FIR filtering and limits of low-latency, we fail to reproduce pyDARM
(4) pyDARM model to time-dependent correction factor production -- due to errors in producing pyDARM at the calibration line frequencies, or limitations of averaging over long time-scales, we fail to properly correct for real time-dependence.
This aLOG quantifies (2) for H1.
In summary,
- the reproduction of (the inverse of) the sensing function, C, has been done very well, and thus incurs very very little systematic error.
- the reproduction of the various stages of the actuation function, A, are good but not awesome, and thus incur a frequency-dependent systematic error "wiggle" at the 0.5% / 0.5 deg level between 5 and 100 Hz, with some sharp features at ~100 Hz that arise from poor modeling and lack of implementation of the UIM high frequency dynamics.
These are sufficiently small, and within current uncertainty estimates, so we won't do anything about it in the near term.
But, you read that right: the UIM is the biggest contributor to influencing the systematic error in the overall response function (OK, at the 0.5% / 0.5 deg level) up to ~200 Hz. This is understandable -- because the other two actuator stages, PUM and TST, are "in-band" and have had more pressing, larger systematic errors to-date -- we've not used any person power on improving it since O2. Thus, it remains essentially an O2 reproduction of an O2 loop model that did not have any high-frequency dynamics included, which also are known to have changed since O2 anyways. But, alas, I get ahead of myself.
For all the below comparisons, I've measured the transfer function of the real CAL-CS system (driving where DARM_ERR and DARM_CTRL enter in to the system, and measuring the response just before all stages are combined), and then multiplied it by the same correction factors from pyDARM that produce the GDS FIR filters (and thus I do not incur error for step 3 listed above). This is a repeat of LHO aLOG 48215, but needed because we'd not re-measured after installing the now-running O3 parameters/filters (installed on 2019-04-04, LHO aLOG 48378). I'll add a comment that documents the DTT templates and processing scripts for this data set.
Check out the attached plots.
- 2019-05-01_H1_C_pyDARM_vs_CALCS.pdf
This is the comparison between the installed, measured CAL-CS (inverse) sensing function -- multiplied by pyDARM produced GDS corrections -- and the full pyDARM model of (inverse) C. One can see there is MUCH less than 0.1% / 0.1 deg systematic error between these two. Nice!
- 2019-05-01_H1_CALCSvspyDARM_actuation.pdf
Page 1: This is a "big picture", side-by-side comparison between the pyDARM model and CAL-CS measurement (* GDS Corrections) of each actuator stage and total to give you a feel for the complexity of the functions, and to show where the broadband measurement was limited and turns in to noise -- i.e. above ~200 Hz.
Page 2: Here we show the standard comparison and residual (i.e. ratio of) between "quad bode plot" of the CALCS (* GDS corrections) measurement and pyDARM model for the overall actuation function. One can see there is residual between the measurement and model, i.e. CAL-CS (* GDS corrections) has not accurately reproduced the pyDARM model and thus the CALCS real-time system has error at the 0.5% / 0.5 deg level between 5 and 200 Hz.
Page 3: How this systematic error impact the overall response function, of course, depends on the DARM loop shaping, so here, we plot the ratio of two response functions, R = (1 + C*D*A) / C; one with the systematic error, and one without,
from modelparams_H1_20190416 import modelPars
[D, C, A, G, CLG, R, sensProd, actProd] = computeDARM(modelPars(), freq)
delA = actProd.calcs2gdsResidActFiltOut_NoDAQDownSample
R_pyDARM = R
R_CALCSGDS = (1.0 + C * D * (calcs_A_tf*delA) ) / C
sysErr_R = R_CALCSGDS / R_pyDARM
In this plot you see a response function systematic error, sysErr_R, that roughly follows the shape of the actuator systematic error below the DARM UGF (at ~60 Hz), and then -- because of the phase flaws and not-so fast roll-off of the actuator -- there is further influence and sharp features above the DARM UGF up to 200 Hz.
Since I measured the individual stages, I can compare each stage against model, to understand from where the dominant frequency dependent systematic error arises.
Page 4: The TST stage. Looks great, very little systematic error incurred. Flat, less than 0.1%/0.4 deg error between 5 and 200 Hz. Odds are that the phase error that's increasing with frequency is a result of the GDS corrections in pyDARM errantly excluding the super-Nyquist poles from the ESD driver electronics; a known bug that's on the to-do list: LHO aLOG 12689.
Page 5: The PUM stage. Looks great, very little systematic error incurred. Flat, less than 0.1%/0.2 deg error between 5 and 200 Hz.
Page 6: The UIM stage -- with its magnitude residual zoomed out to show the large amount of error -- 10 % by 40 Hz, a factor of 2 by 90 Hz, leading up to the high-Q resonance just down-right missing the from the CAL-CS reproduction of the pyDARM model. These high Q features are the source of the high Q features that make their way all the qay in to the systematic error in the response function.
Page 7: The UIM stage -- with its magnitude residual zoomed in to what should be a reasonable range of 5%. No bueno.
One should note, that in addition to this type (2), pyDARM model to CAL-CS implementation, systematic error, there is already some type (1), measurement to pyDARM model, systematic error in the pyDARM model of the UIM that is not shown.
Remember -- all QUADs have UIM to TST force-to-length transfer functions that don't fall as 1/f^6 as one might naively expect (see LHO aLOG 38295).
The current dynamical model that is the source of all the high Q features in pages 6 & 7 was updated in O3 with the fit informed by measurement of the O2 high frequency dynamics of the ETMY UIM stage just to get *something* functional to use in the estimate of the UIM actuator strength.
Though there are measurements in-the-can of the O3, they've not yet been fit or used to update the dynamical model.
Anyways -- again -- we won't DO anything about this, at least in the short term, but we can now safely say that this particular systematic error is well-characterized, and is sufficiently within our uncertainty estimate.
Some further details about gathering and processing the data:
^ = local check out of calibration repo = /ligo/svncommon/CalSVN/aligocalibration/
Templates for measurement of CAL-CS:
^/trunk/Runs/O3/H1/Measurements/CALCS_FE
2019-05-01_H1_CALCS_actuation_model.xml
2019-05-01_H1_CALCS_sensing_model.xml
These *can* be done during nominal low noise, but do not have to be. However, one should turn off the input to the CAL-CS filters, just upstream of the excitation points, and clear all history of filters down stream before starting the measurement.
Scripts to process the data:
^/trunk/Runs/O3/H1/Scripts/CALCS_FE/
compare_CALCS_to_pyDARM_actuation_20190501.py
compare_CALCS_to_pyDARM_sensing_20190501.py
Details about how to export the data are written in comments in the script.
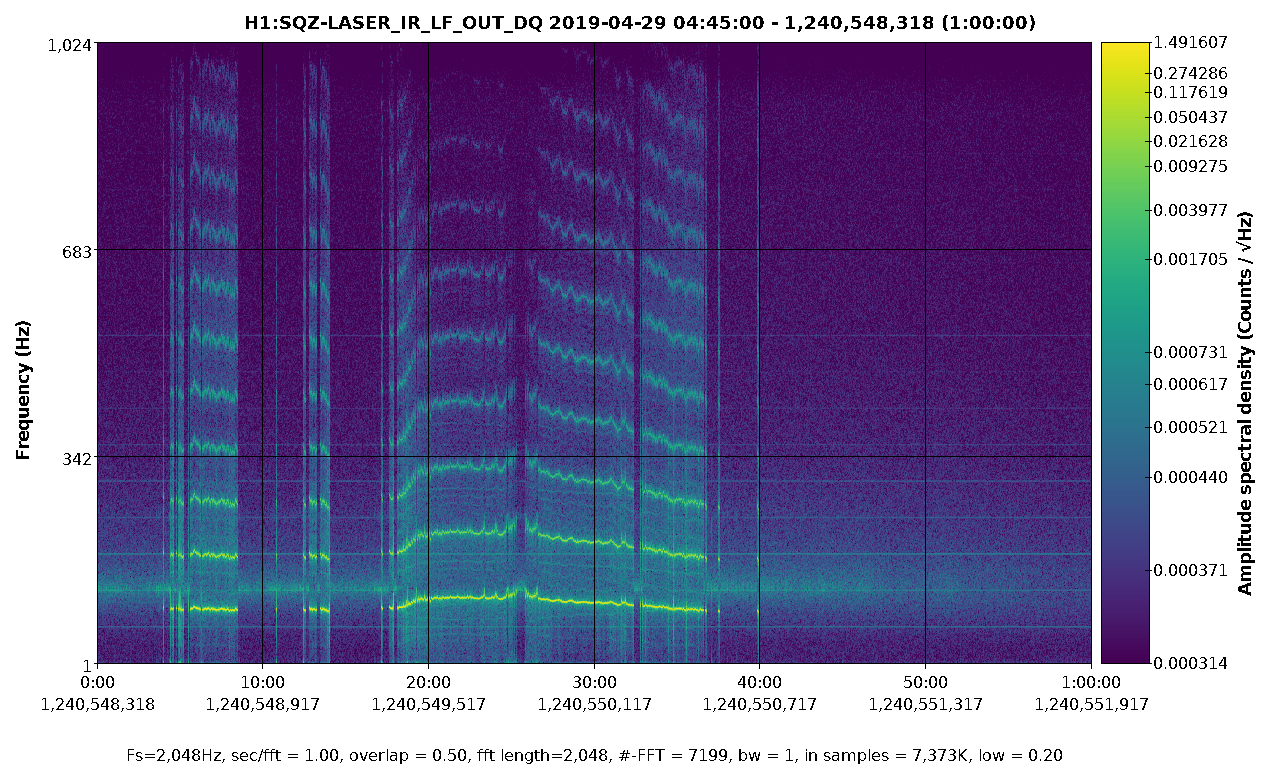
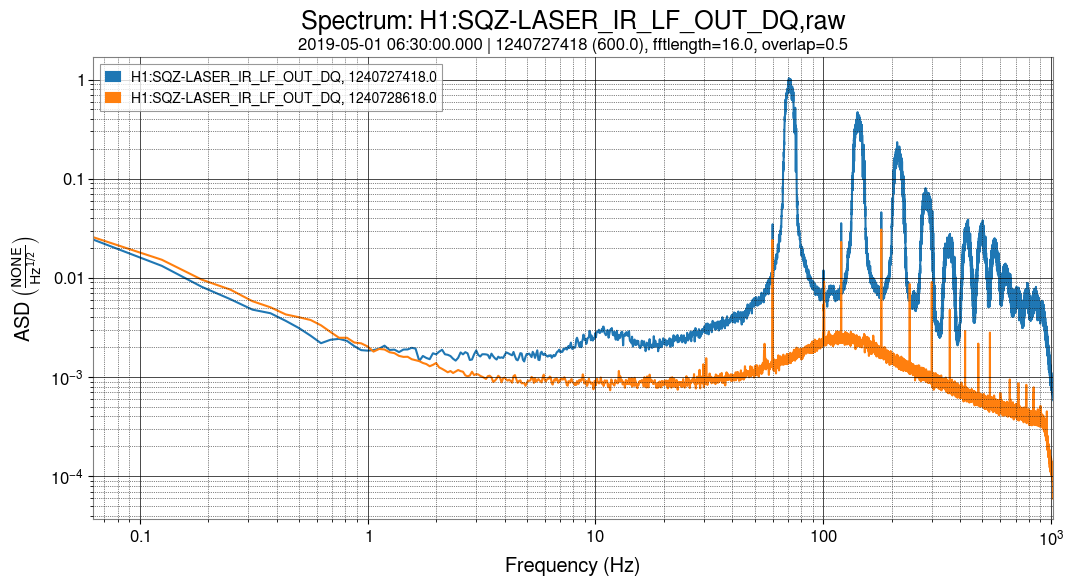
Andy, with input from Beverly, Laura, and Josh The strong wandering lines in h(t) caused by the squeezer are becoming more frequent and more severe. This seems like it could be quite a problem for the searches, so I'm putting some information here to hopefully push this to be diagnosed and resolved. The wandering line was noticed a week ago (alog 48772). It comes and goes, both in h(t) and in the squeezer channels. In the squeezer, it's an equally spaced comb of lines, with the first wandering from about 80 to 140 Hz. The line comes and goes quite suddenly. The first attachment shows what it looks like in one of the squeezer channels. This seems similar to the 200 Hz wandering line from the LLO squeezer. The solution (LLO alog 43837 was a highpass before the TTFSS. The attached PDF has spectra of several channels during the noise compared to a reference time. Nothing is visible on the fiber transmitted PD, but it is on the fiber PD, the IR laser LF, and a bunch of mixer channels. Also of note is that the CLF RF6 and REFL RF80 RFMONs both get much noisier when the lines appear. There's a very small bit of extra noise also seen on FIBR_SERVO_DEMOD_RFMON. I would speculate that this looks like a loop that's not quite stable, but everything is so coupled it's hard to tell where. Is it possible that the harmonics are generated by the noisy line going through the SHG and getting mixed with itself repeatedly?
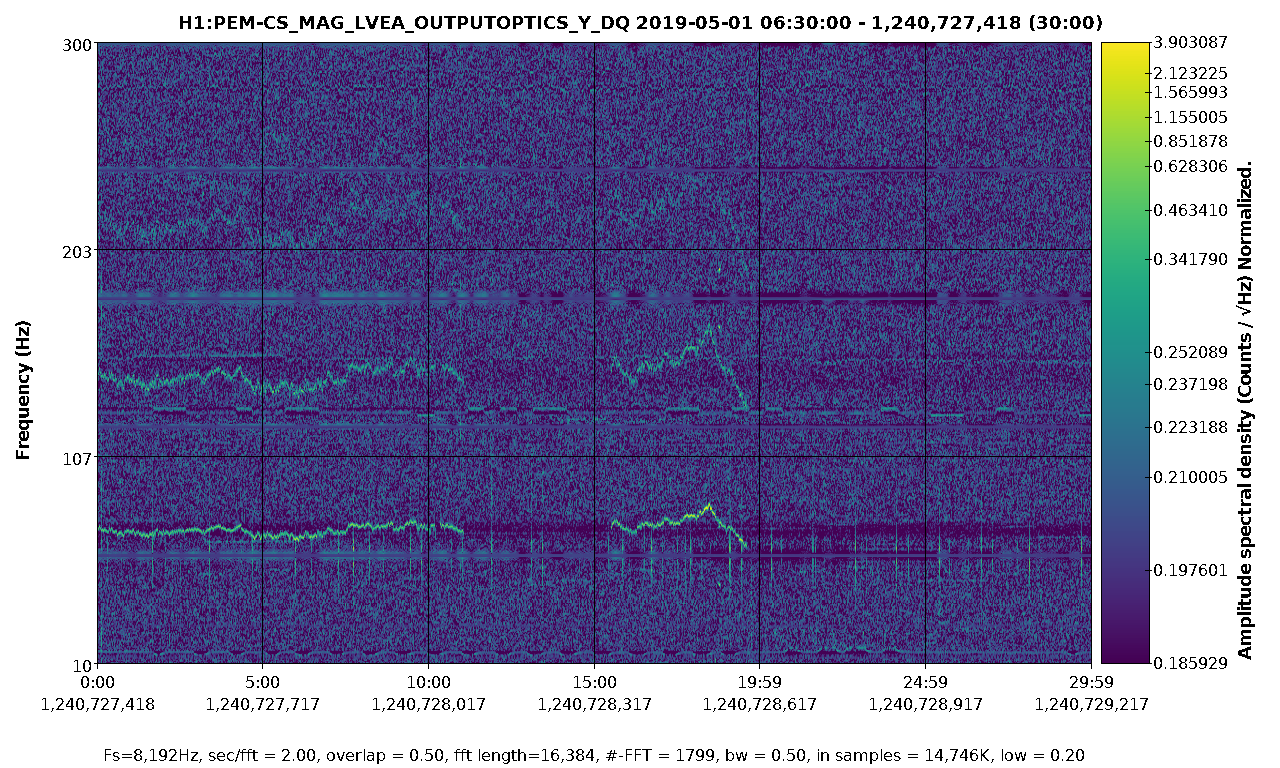
A couple of other things about this line. 1) When the line acts up, It is clearly visible in the OUTPUTOPTICS magnetometer channel which is the closest to ISCT6 2) Yesterday, the line came back as soon as got to NLN after maintenance. With Jenne's help, we closed the SQZ beam diverter - to use it as an opportunity to confirm that the squeezer was causing it. Closing it causes the line to go away in DARM, although the line is still visible in the magnetometer channel and some of the squeezer channels. The line came back when we turned it back on a minute later. Relevant spectrograms in slides 10 - 13 of the attached pdf
The high pass filter in TTFSS was added at LHO, alog 47296.
The real solution at LLO was to disable the laser noise eater on the SQZ laser. The high-pass allowed us to make that switch without other consequences.
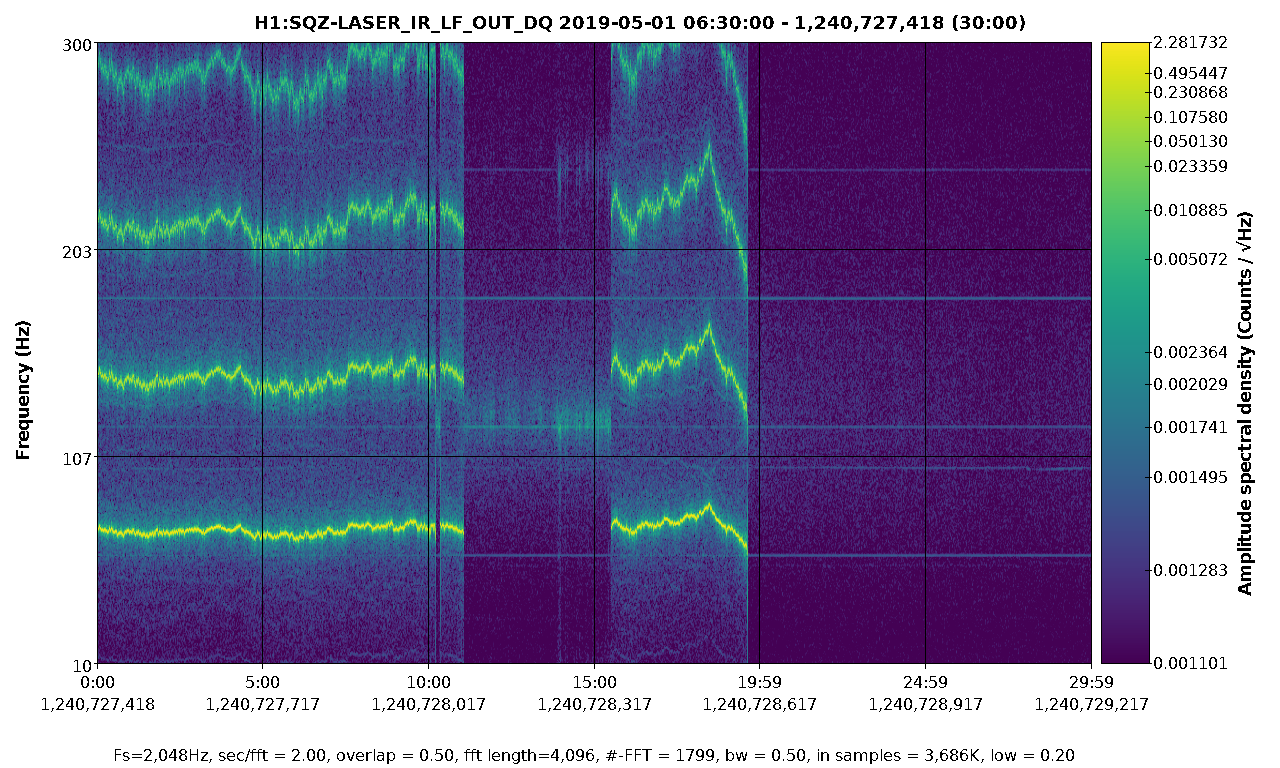
The lines aren't the only excess noise. LASER_IR_LF has a jump in the broadband noise floor when the lines appear. I've attached a spectrogram and a spectrum. The magnetometer sees the main line and its first two harmonics. They disappear instantly whenever the lines in the squeezer do - see third attachment. It seems like this is more likely to be pickup from a problem in the squeezer, because having all of the line harmonics be EM noise seems unlikely, and there would also likely need to be broadband noise. Was there any change to the outputoptics magnetometer during maintenance yesterday? The coupling of the squeezer lines into the magnetometer is much stronger starting from the first lock after maintenance.
No, I don't think there was any change either with the squeezer or the magnetometer.
The noise eater could be toggled off and on again, using the switch on the controller mounted on top of ISCT6. It looks just like the noise eater switches on the PSL and ALS laser controllers. (Toggling it might not fix the problem, it might need to be off but it’s probably worth trying to toggle it first.)
Jenne and I went in to the LVEA and discovered the noise eater control on ISCT6 was hooked up to a remote system. Jenne toggled it off from the control room, and turned it back on ~ 30 seconds later at 16:14:55 UTC. Lets see if it works!
The noise came back, and doing an on/off test a few times indicated clearly that turning the SQZ laser noise eater off made these lines go away, so the noise eater is now off.
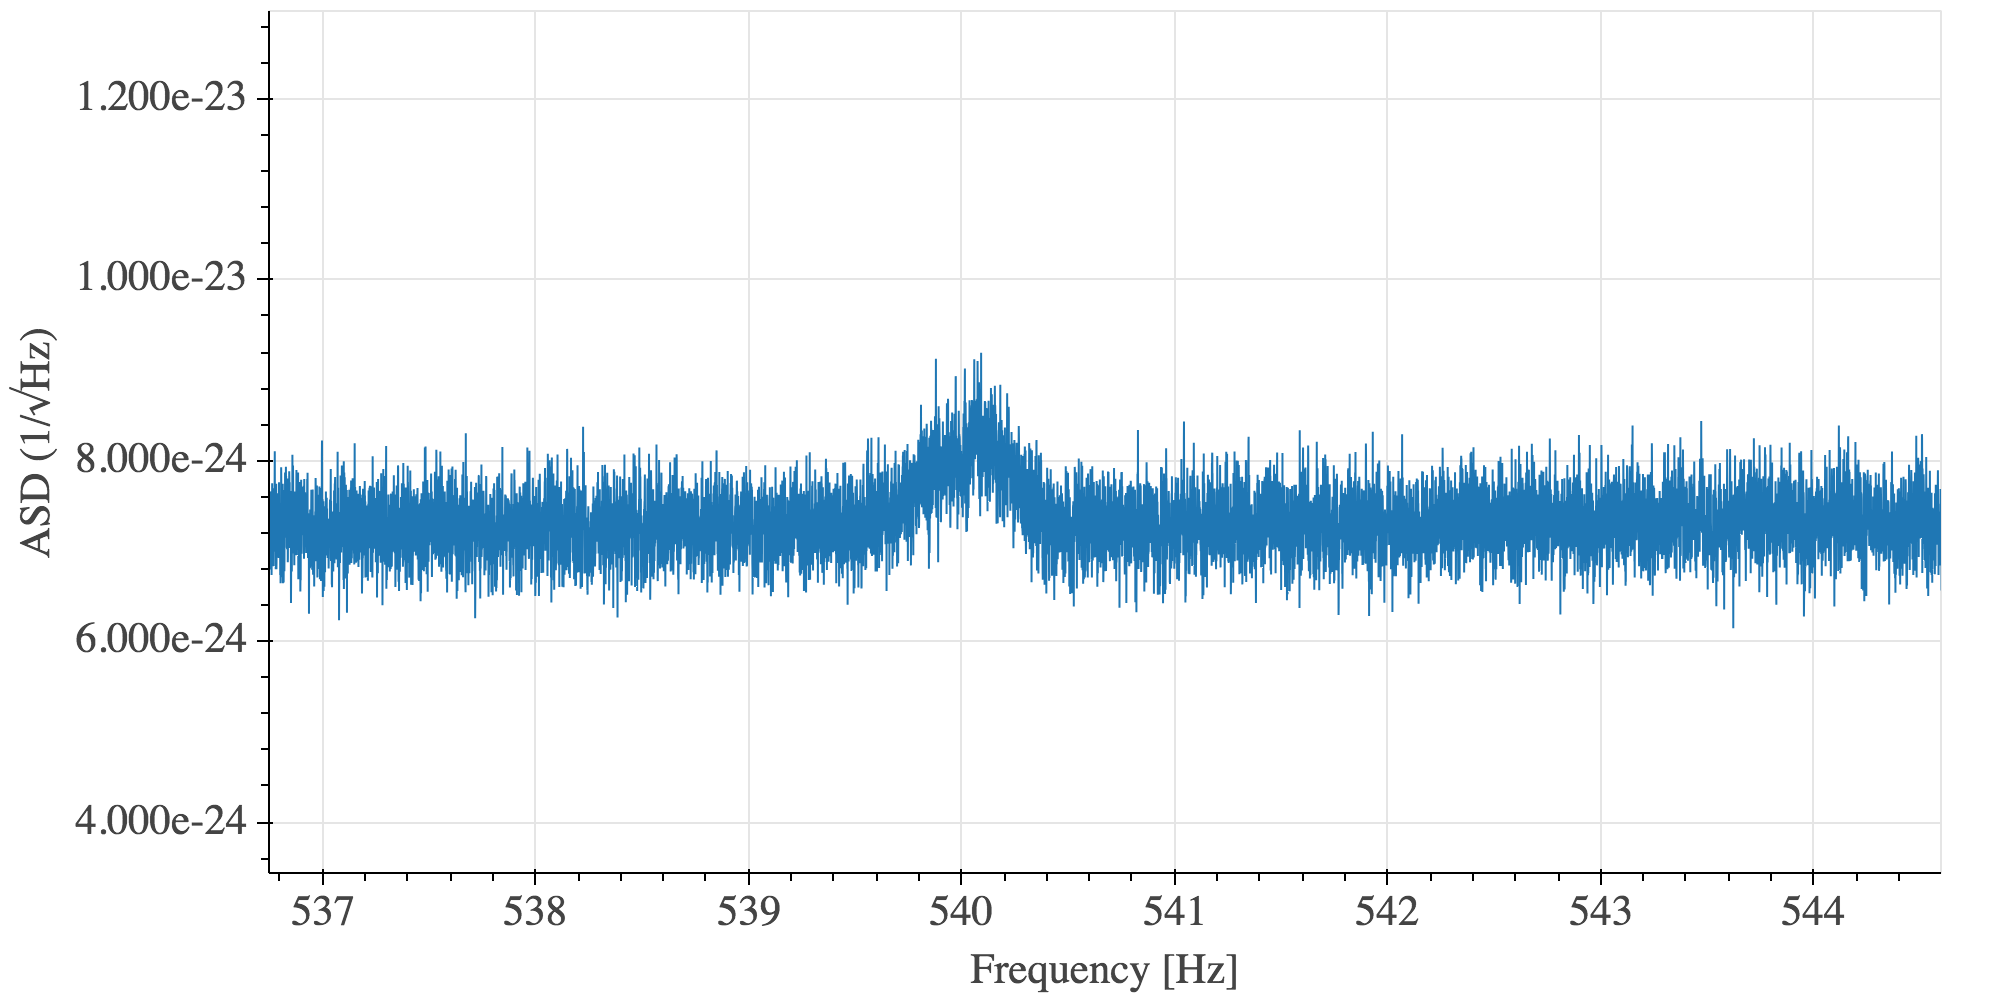
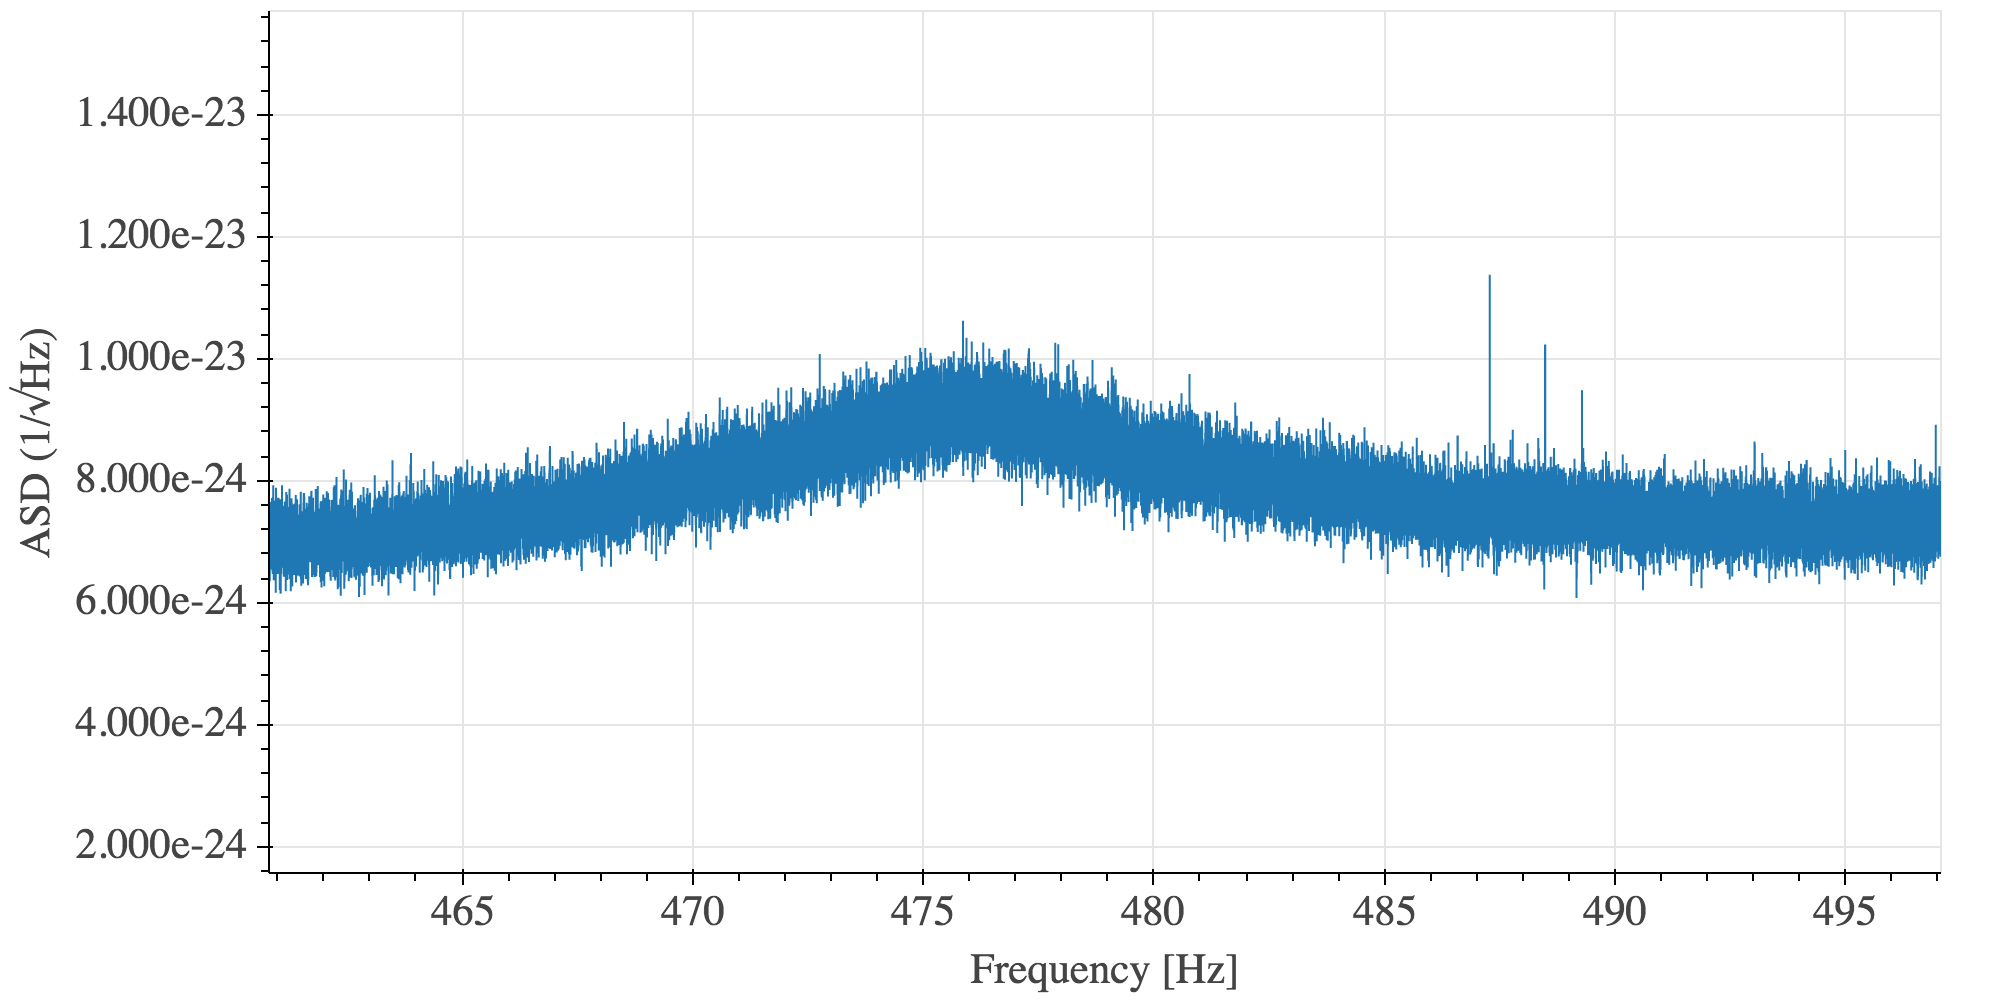
I've been looking at the bump around 540 Hz which can be seen with long integrations (1800 s), see first attachment.
I ran a BruCo job to try to find coherences (results here https://ldas-jobs.ligo-wa.caltech.edu/~pep.covas/bruco/bruco_1240272018/), and some channels related to PSL (ISS), HPI and ISI showed high values. These are the top 20 channels found by BruCo and their coherence:
| 540.12 | HPI-HAM1_TT _L4C_Z_DQ (0.79) |
ISI-HAM6_GS13INF _H1_IN1 _DQ (0.78) |
HPI-HAM1_TT _L4C_RX_DQ (0.78) |
ISI-HAM6_BLND _GS13RZ _IN1_DQ (0.77) |
PEM-CS_ADC _5_18_2K_OUT _DQ (0.77) |
PSL-ISS_PDB _REL_OUT_DQ (0.77) |
PSL-ISS_SECONDLOOP _RIN _CTRL_OUT _DQ (0.77) |
PSL-ISS_SECONDLOOP _OUTPUT _DQ (0.77) |
HPI-HAM1_TT _L4CINF_V2 _IN1_DQ (0.77) |
PSL-ISS_SECONDLOOP _RIN _ERR1_OUT _DQ (0.77) |
HPI-HAM1_TT _L4CINF_V3 _IN1_DQ (0.77) |
PSL-ISS_SECONDLOOP _ERR1 _DQ (0.77) |
ISI-ETMX_ST1 _L4CINF_V3 _IN1_DQ (0.76) |
ISI-ETMX_ST1 _MASTER_H1 _DRIVE_DQ (0.76) |
ISI-ETMX_ST1 _L4CINF_H3 _IN1_DQ (0.76) |
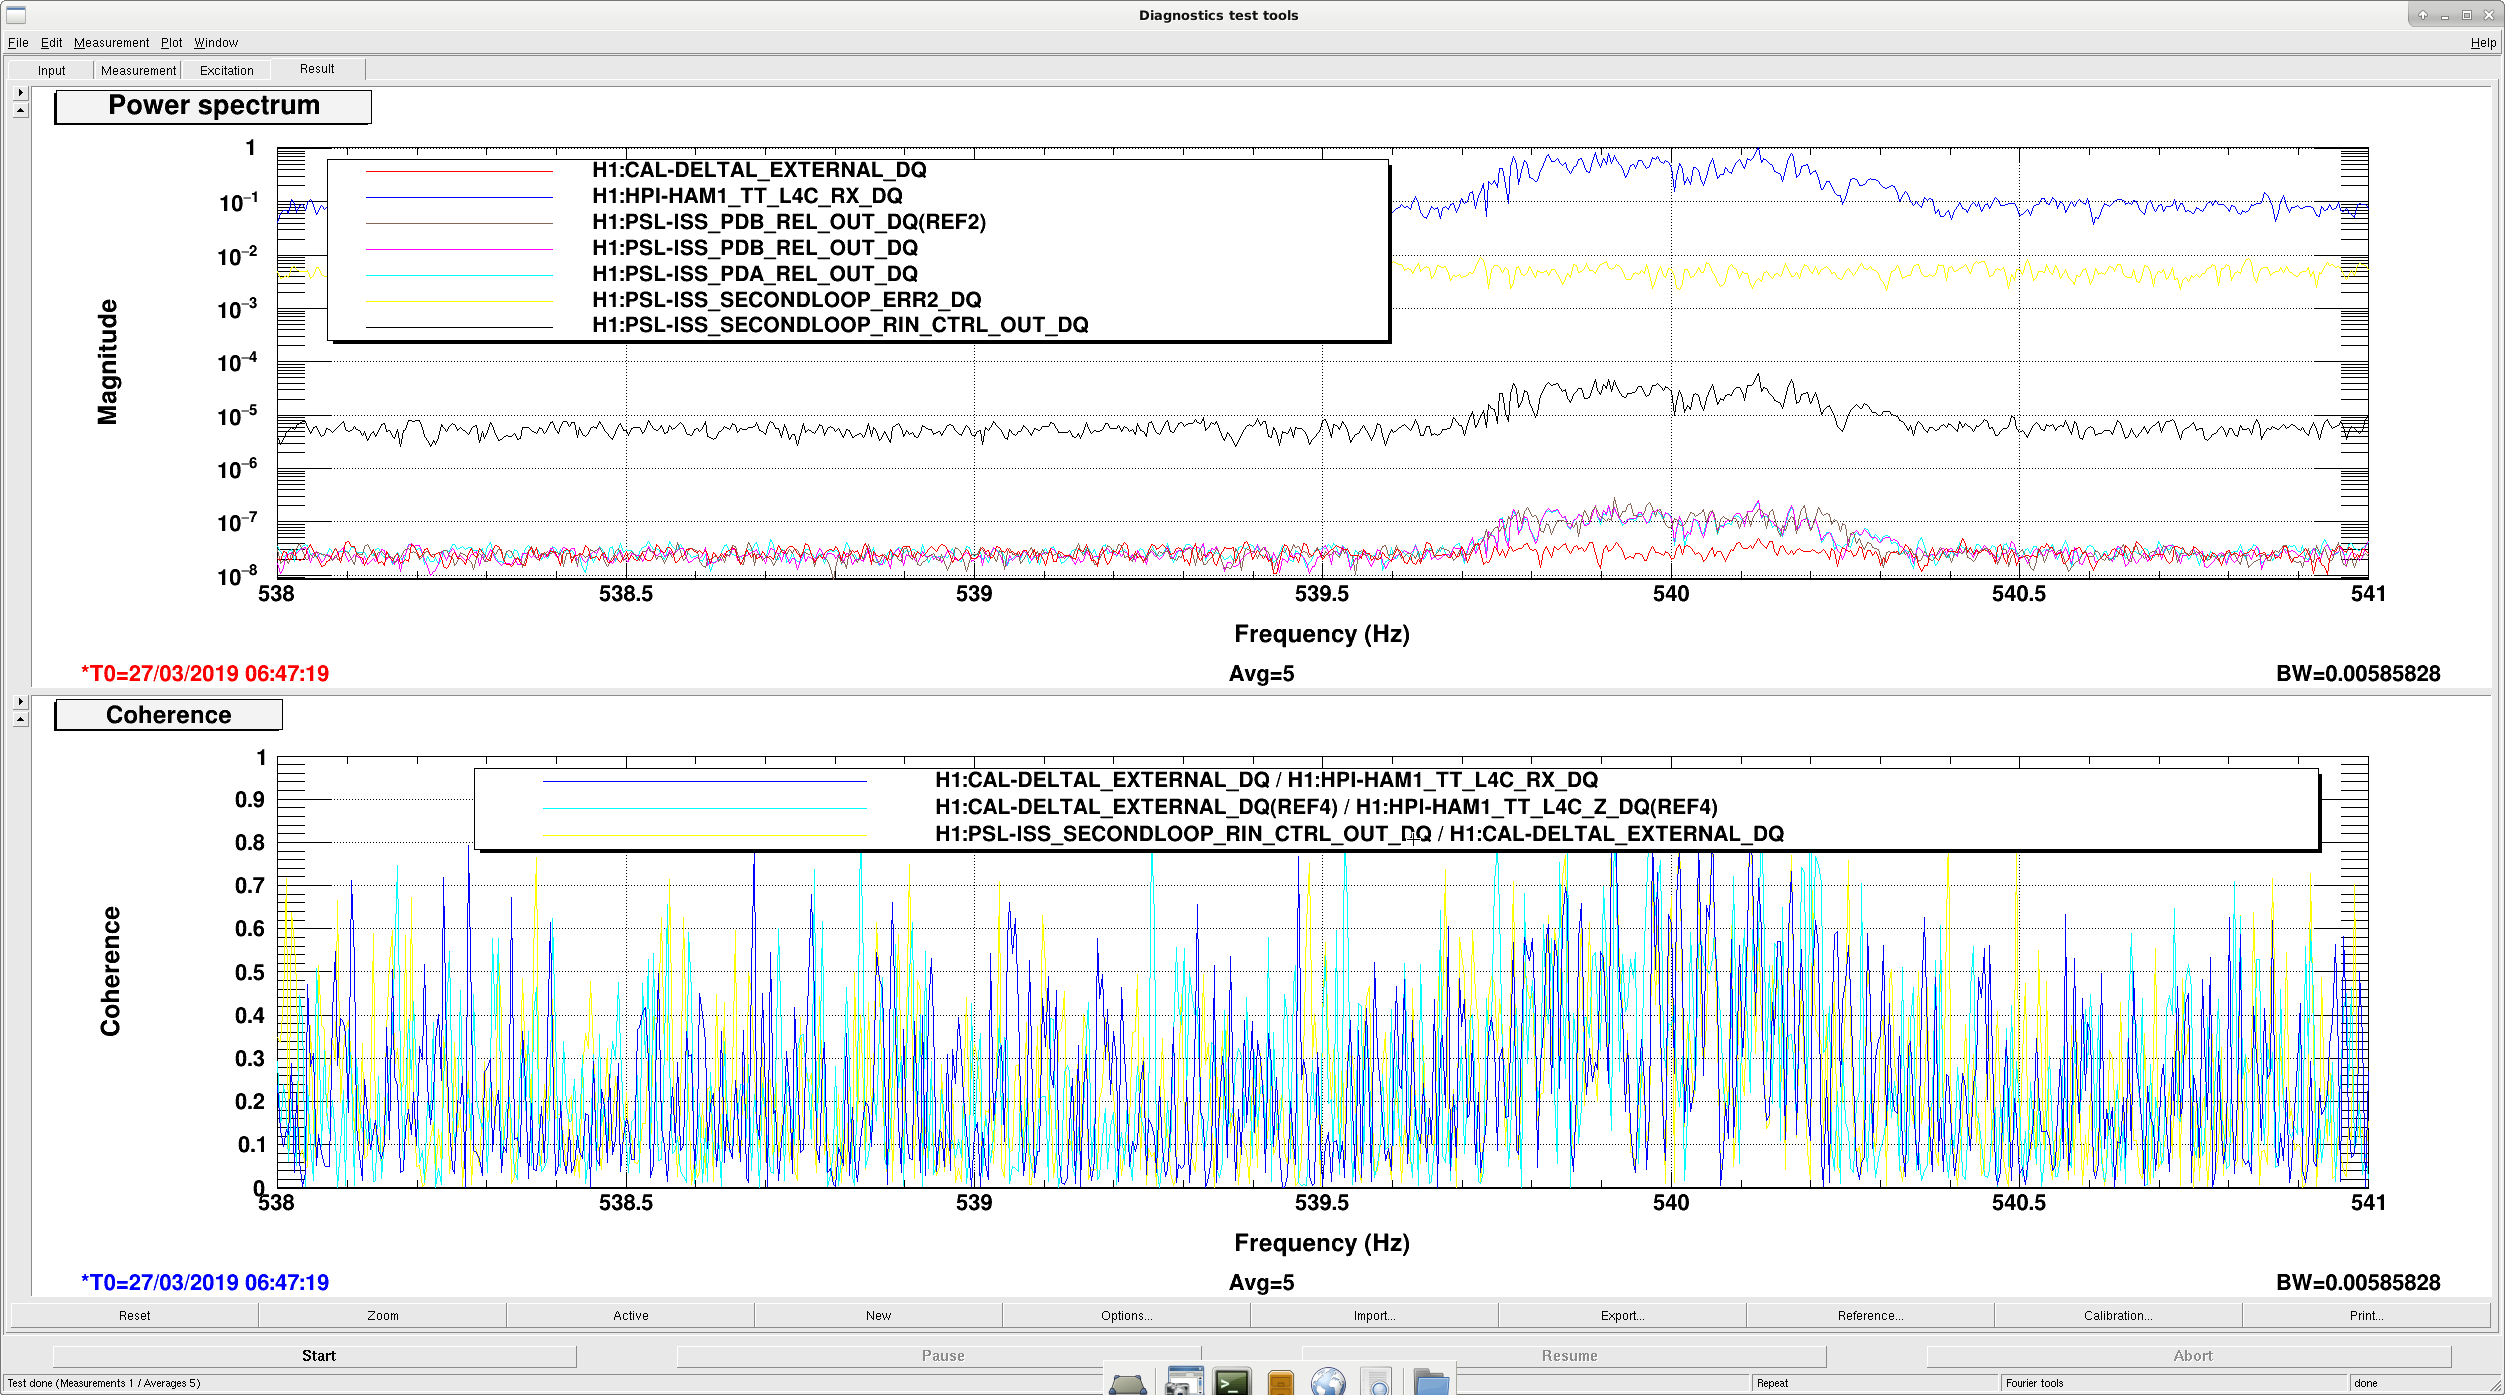
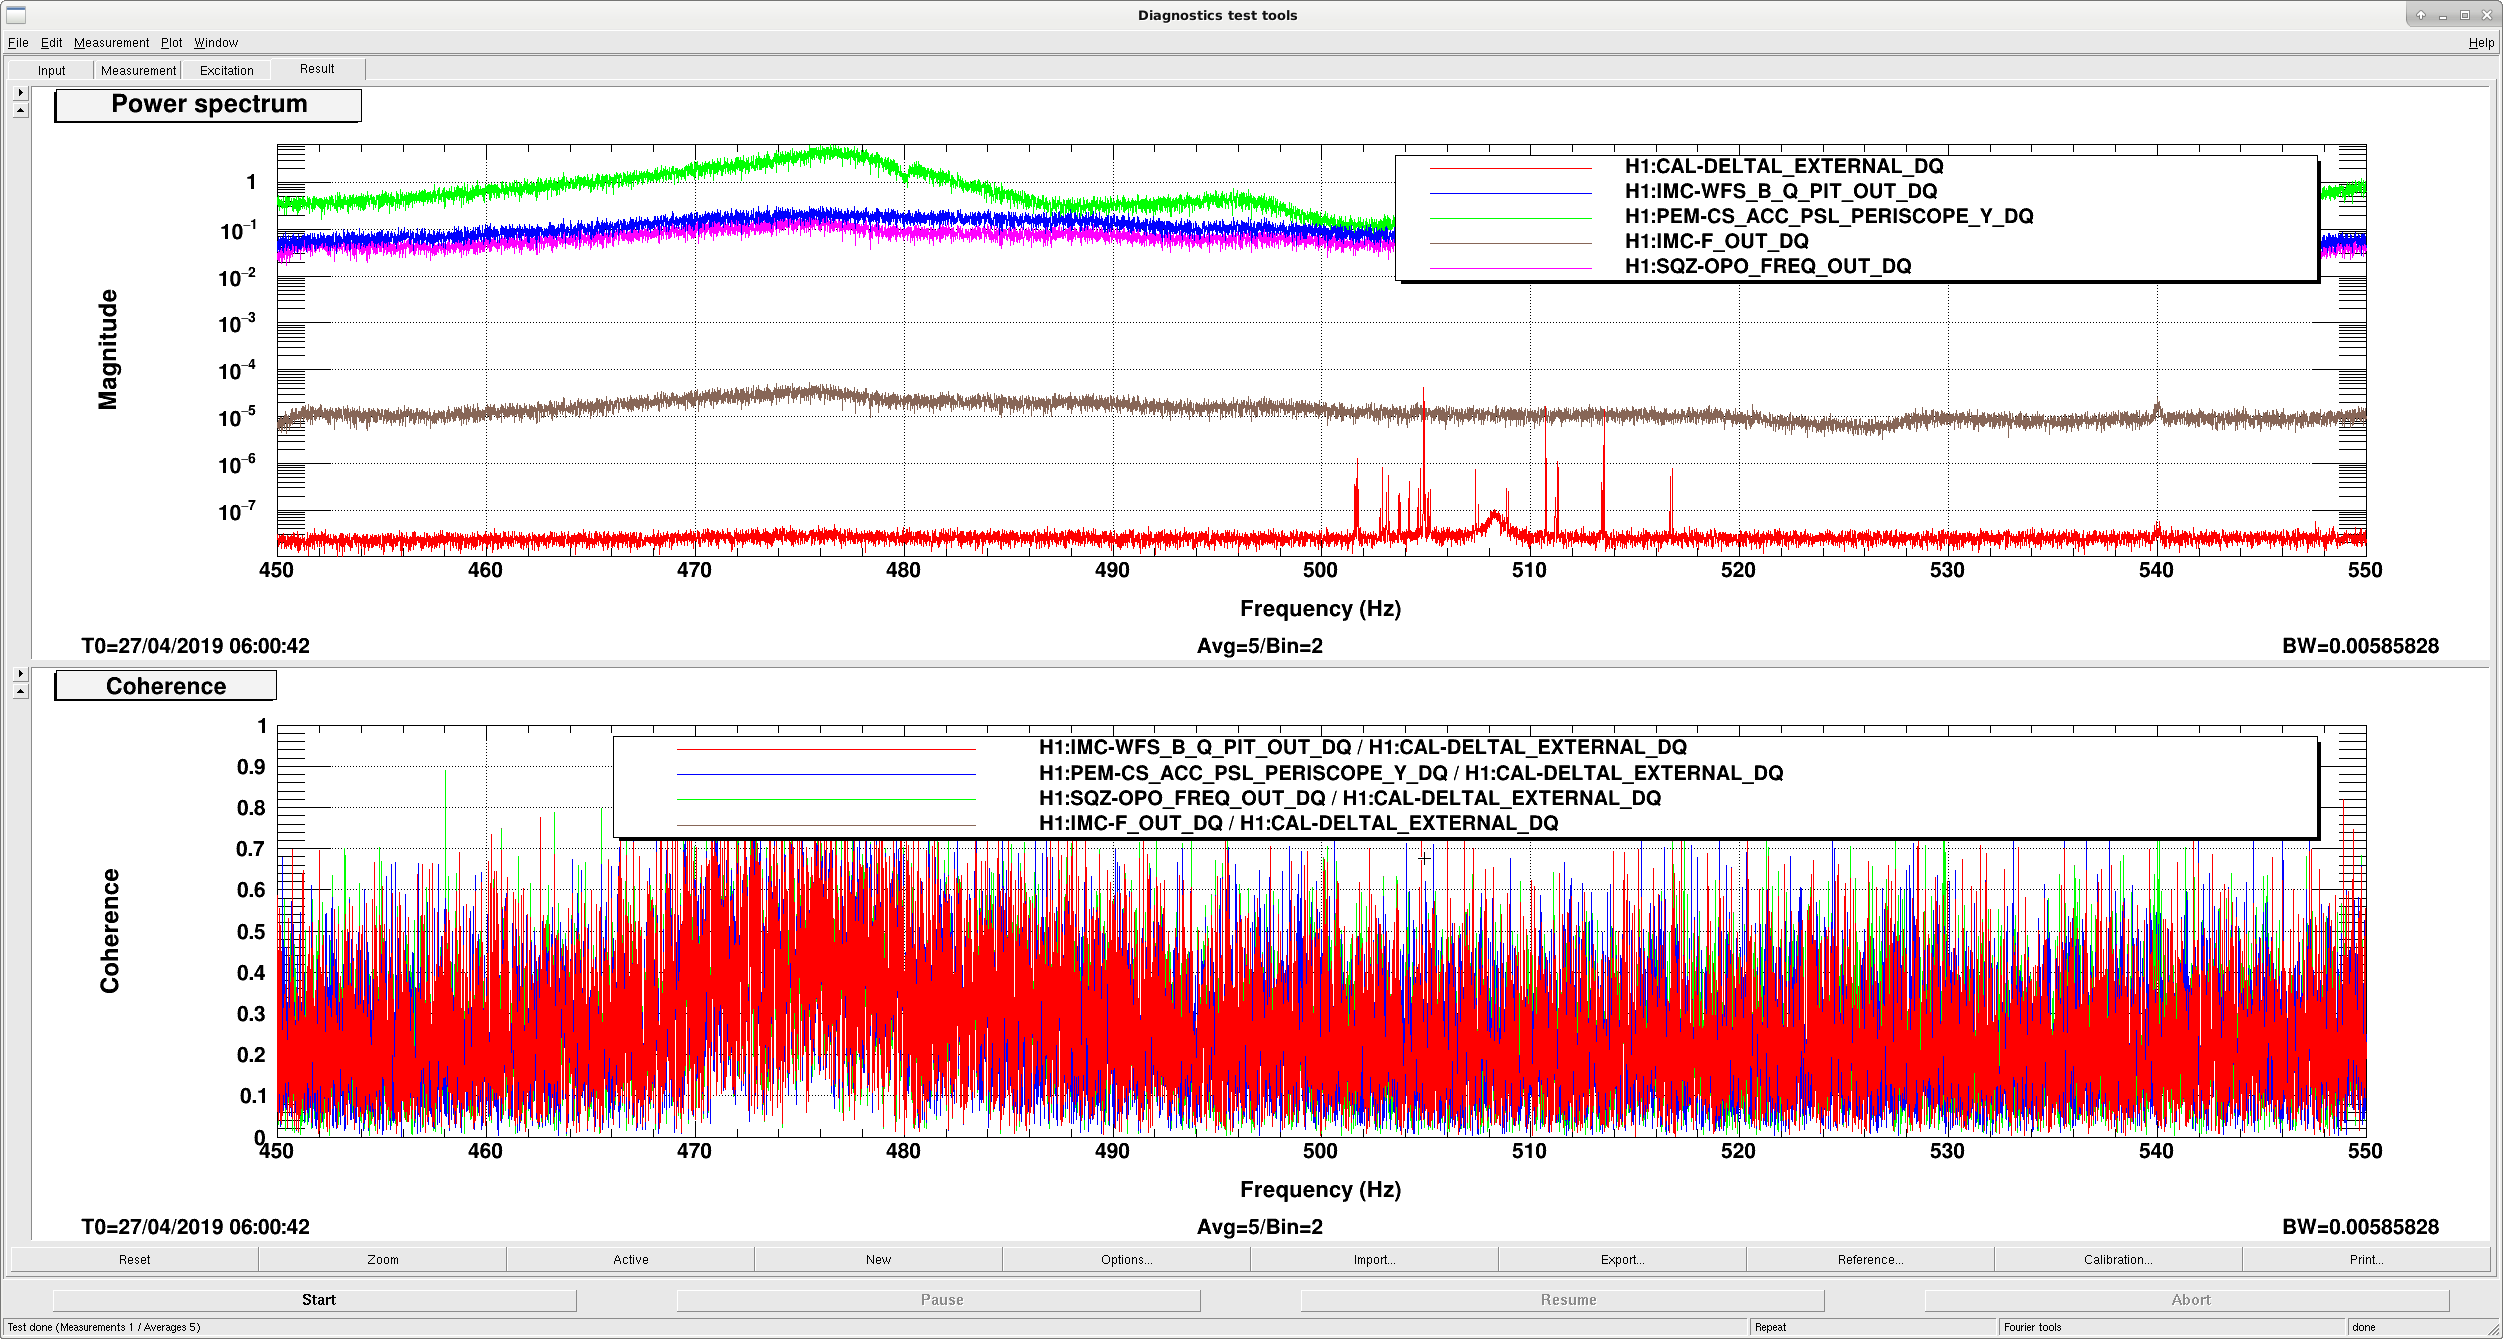
The second attachment shows a DTT plot showing some power spectrums and some coherence traces. A region of high coherence between approximately 539.7 and 540.3 Hz can be seen, and also a bump at these channels at the same frequencies as in DARM. It shows both curves from 27 March and 27 April (refs), which show very similar features. This bump seems to be a stable feature in DARM
A similar but much wider bump between 465 and 485 Hz (first attachment) also has coherence with some other channels, for example:
| 476.62 | IMC-WFS_B_Q _PIT_OUT_DQ (0.70) |
IMC-WFS_B_Q3 _ERR_DQ (0.70) |
IMC-DOF_4_P _IN1_DQ (0.68) |
IMC-WFS_B_DC _PIT_OUT _DQ (0.68) |
IMC-WFS_B_Q4 _ERR_DQ (0.68) |
IMC-WFS_A_DC _PIT_OUT _DQ (0.68) |
IMC-WFS_A_DC _YAW_OUT _DQ (0.67) |
PEM-CS_ACC _PSL_PERISCOPE _X_DQ (0.67) |
IMC-WFS_B_Q _YAW_OUT_DQ (0.66) |
IMC-WFS_B_Q1 _ERR_DQ (0.65) |
PEM-CS_ACC _PSL_PERISCOPE _Y_DQ (0.65) |
IMC-WFS_B_Q2 _ERR_DQ (0.64) |
IMC-WFS_B_I4 _ERR_DQ (0.63) |
PEM-CS_ACC _PSL_TABLE1 _Z_DQ (0.62) |
IMC-F_OUT_DQ (0.61) |
| 476.75 | IMC-WFS_B_Q _PIT_OUT_DQ (0.78) |
PEM-CS_ACC _PSL_TABLE1 _Z_DQ (0.76) |
IMC-WFS_B_Q3 _ERR_DQ (0.76) |
IMC-WFS_A_DC _PIT_OUT _DQ (0.75) |
IMC-DOF_2_P _IN1_DQ (0.75) |
PEM-CS_ACC _PSL_PERISCOPE _Y_DQ (0.75) |
IMC-DOF_4_P _IN1_DQ (0.74) |
IMC-WFS_B_DC _PIT_OUT _DQ (0.74) |
IMC-WFS_B_Q1 _ERR_DQ (0.74) |
IMC-F_OUT_DQ (0.74) |
IMC-F_IN1_DQ (0.74) |
SQZ-OPO_FREQ _OUT_DQ (0.74) |
SQZ-PSL_FF _OUT_DQ (0.74) |
PEM-CS_ACC _PSL_PERISCOPE _X_DQ (0.74) |
IMC-L_IN1_DQ (0.74) |
The second attachment again shows the power spectrum and coherence with some channels. You can see an increase in coherence around this same frequency range, with all channels compared showing similar behaviour.
This being a 20 Hz wide feature, it would be interesting to try to do more studies in order to get rid of this, if possible.
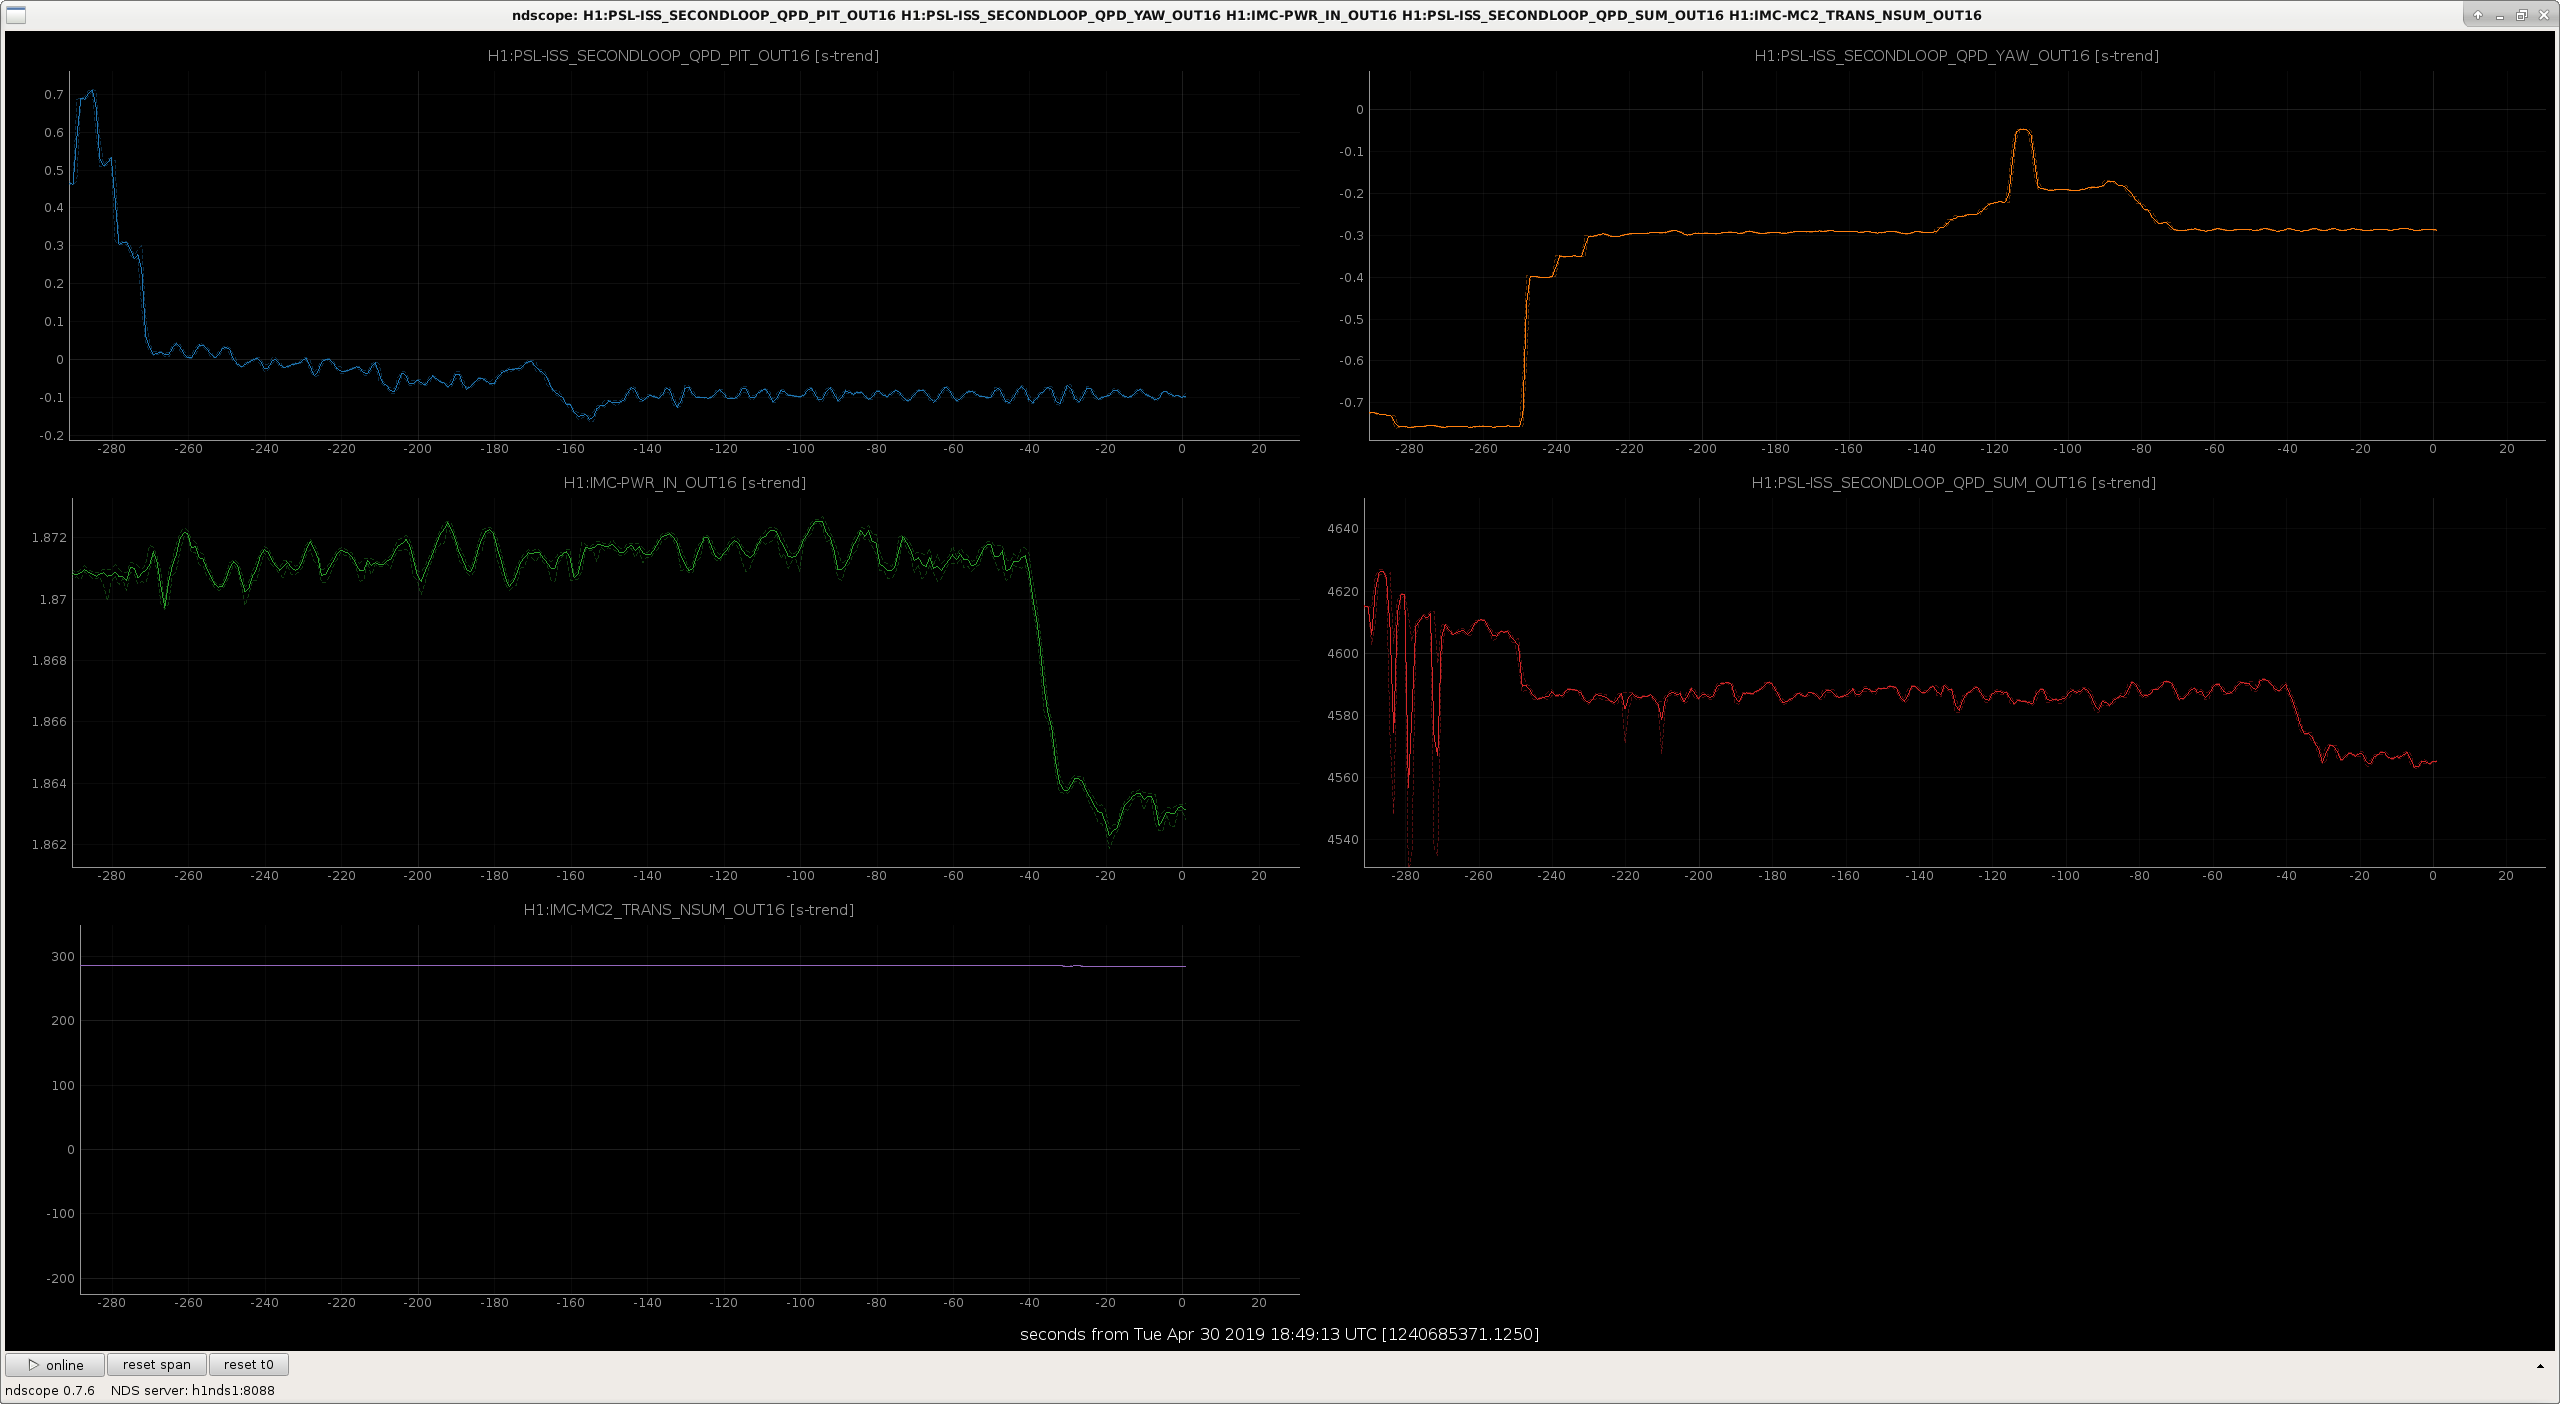
Particularly since the ISS channels are coherent with the ISI, Pep and I talked about this being potentially beam motion that is then coupling in to the ISS second loop, which is then putting it onto the 1st loop. The attached figure shows that while we're in lock, the second loop QPD is near one of the edges in pitch. Note however that when we have just the IMC and not the full IFO that the QPD doesn't look centered. So, I want to move the spot during an IMC-only time the amount that I think it needs for full lock - I don't want to actually center the beam while we have IMC only.
[Pep, Jenne]
We move the picomotors in front of the ISS second loop array by +0.8 in pitch and +0.47 in yaw, such that the beam should be centered when we're in full IFO 35W lock. On the HAM2+oplev picomotor controller, we mostly used the picomotor channel 8 (PSL ISS QPD/PD (PM5)) to do the centering, and then checked with channel 1 (PSL ISS QPD/PD (PM1)) that there was no change in the SUM if we moved a few fractions of a beam diameter. This check helped us feel more confident that the beam is not clipping. Pep will check if there is an improvement in this coupling, once we're relocked.
After the changes made this Tuesday, the noise floor has improved (see here https://ldas-jobs.ligo-wa.caltech.edu/~pep.covas/O3/AfterPSLPicomotor/Comparison.png), but it could be better. We have used again the picomotors (mostly in YAW) while at 35 W to try to make a better improvement.
When locking DRMI, I couldn't improve POP18 more than 55 or so. I decided to move on, and there was no dip in this signal even after engaging the ASC, but it broke lock at the DARM_TO_RF state. I'm going to run and initial alignment and see what it looks like after. If this works well, then I've had to run an initial alignment after every lock loss this week...