travis.sadecki@LIGO.ORG - posted 14:19, Wednesday 10 April 2019 (48396)
Observing at 21:19 UTC
Will be in Observing for ~1 hour, then back to TCS measurements.
Will be in Observing for ~1 hour, then back to TCS measurements.
Topped off Crystal Chiller with 150mL. Diode Chiller OK.
NOTE: The white funnel and meausuring cup were strewn about on the floor.
Wednesday 03apr2019 - Monday 08apr2019: No restarts
Tuesday 09apr2019:
2019_04_09 11:42 h1ioplsc0
2019_04_09 11:42 h1lsc
2019_04_09 11:44 h1edc
2019_04_09 11:44 h1lscaux
2019_04_09 11:44 h1omc
2019_04_09 11:44 h1omcpi
2019_04_09 11:44 h1sqz
2019_04_09 12:03 h1broadcast0
2019_04_09 12:03 h1dc0
2019_04_09 12:03 h1fw0
2019_04_09 12:03 h1fw2
2019_04_09 12:03 h1nds0
2019_04_09 12:03 h1tw0
2019_04_09 12:03 h1tw1
2019_04_09 12:03 h1tw3
2019_04_09 12:04 h1fw1
2019_04_09 12:05 h1nds1
Maintenance. Unexpectedly had to restart h1lsc0's models following a timing glitch. New h1sqz model code. New h1edc channel configuration. Associated DAQ restart.
But not in Observe for injections.
M. Wade, A. Viets
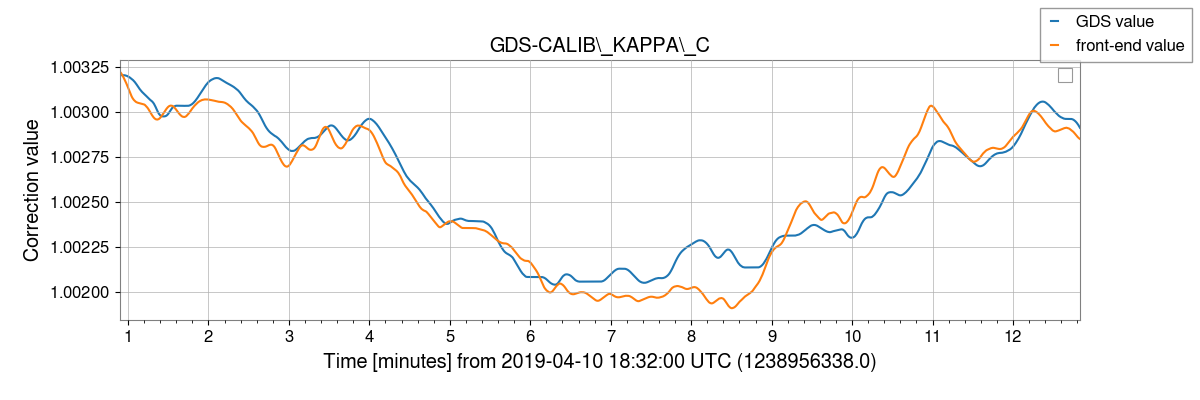
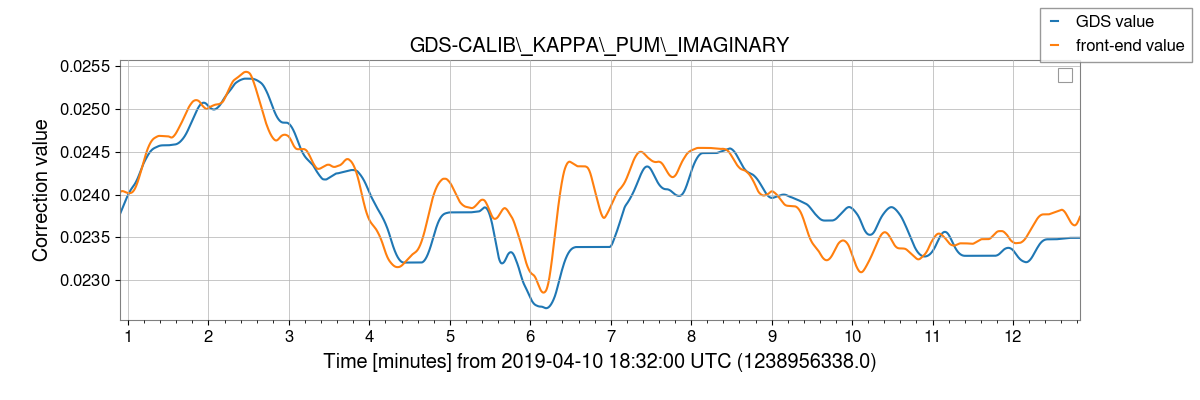
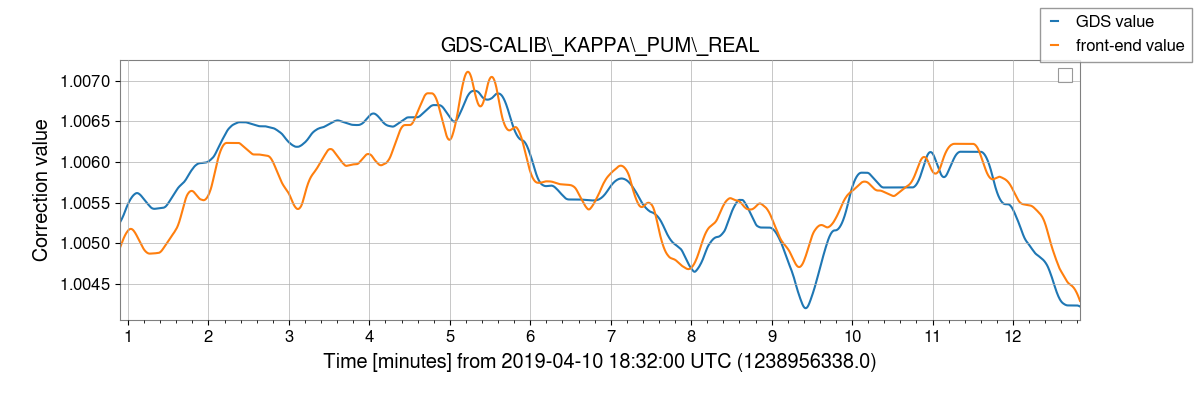
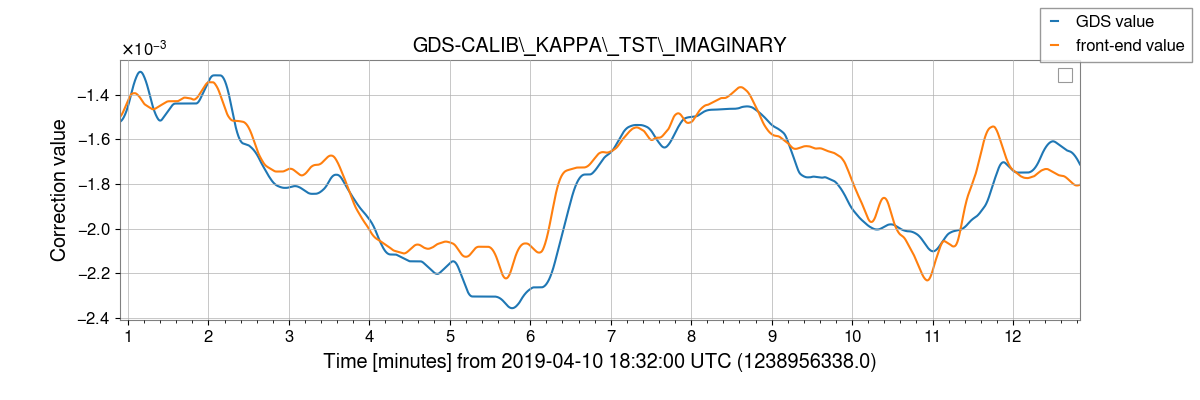
I have made new filters file for the GDS calibration pipeline based on the model params file aligocalibration/trunk/Runs/O3/H1/params/modelparams_H1_20190404.py in svn r7188. The new filters are located in
aligocalibration/trunk/Runs/O3/GDSFilters/H1GDS_1238952670.npz
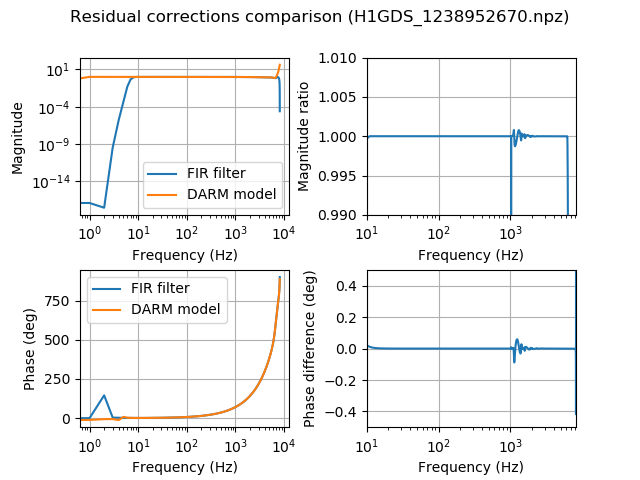
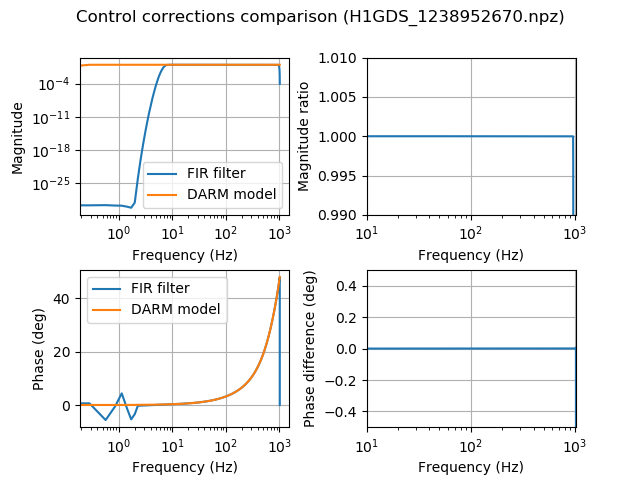
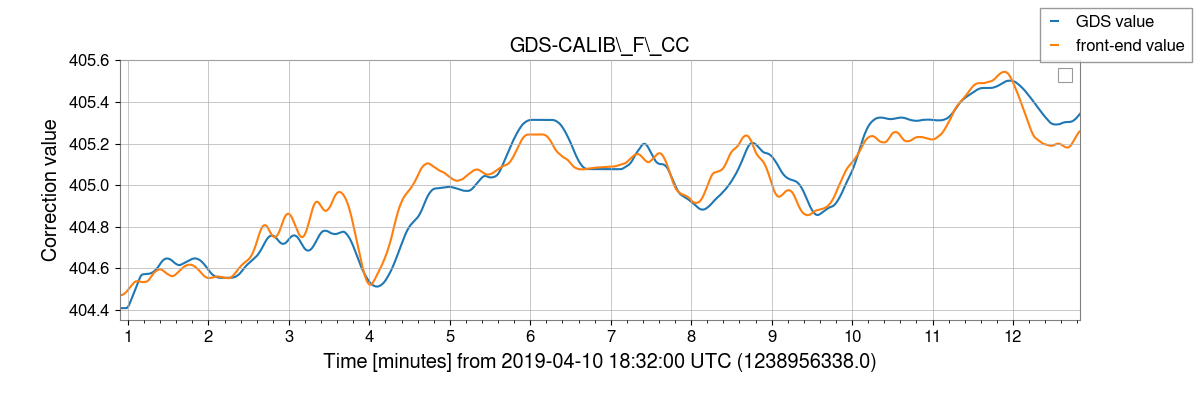
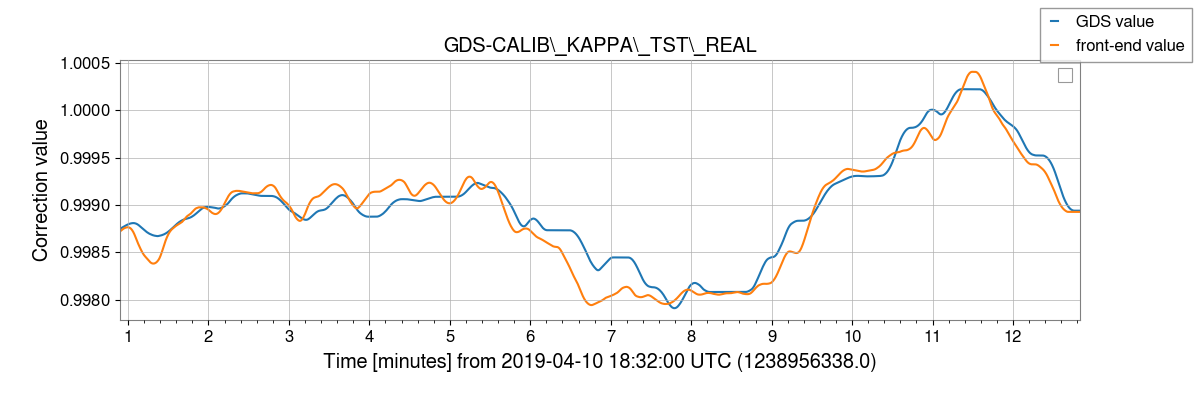
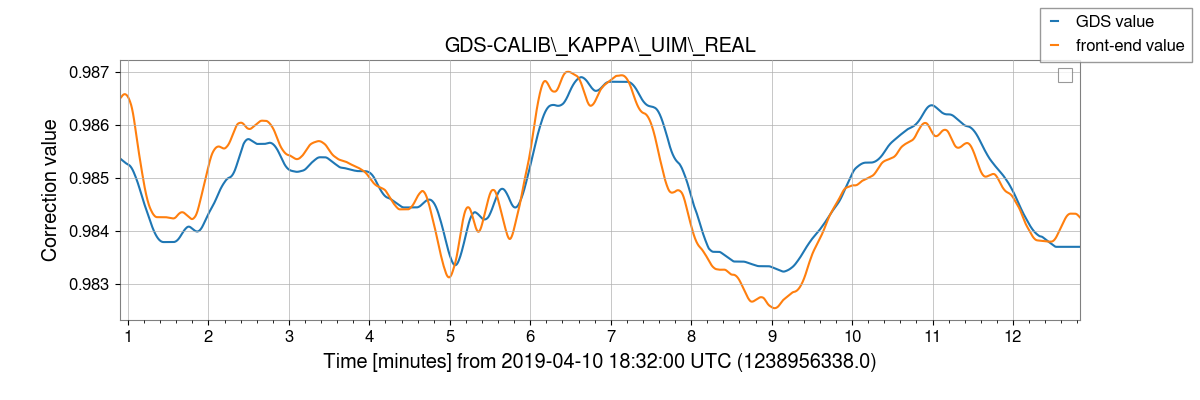
I have attached results from testing these filters as well as plots of the filters themselves. The tests were run on a lock stretch from earlier today (GPS times 1238956172-1238956672). For these tests I did
We see the expected level of agreement for all of these tests. I would like to investigate more the differences between the GDS and the CALCS CFTD strain channels, but this should not inhibit the installation of these new filters.
I have also created a new configuration file. The most significant change to the configuration is that we are now applying scalar corrections for kappa_TST and kappa_C and frequency-dependent corrections for the cavity pole frequency. Note that we are not yet applying scalar corrections for kappa_PUM or kappa_UIM. We have decided to hold off on this until the calibration lines are moved closer together, which increases the validity of these calculations. The configuration file can be found in the calibration SVN:
aligocalibration/trunk/Runs/O3/GDSFilters/H1GDS_1238952670.ini
I installed the new filters and configurations and restarted the calibration pipeline at approximately GPS time 1238962221 on both the production and redundant DMT machines.



M. Wade, J. Kissel
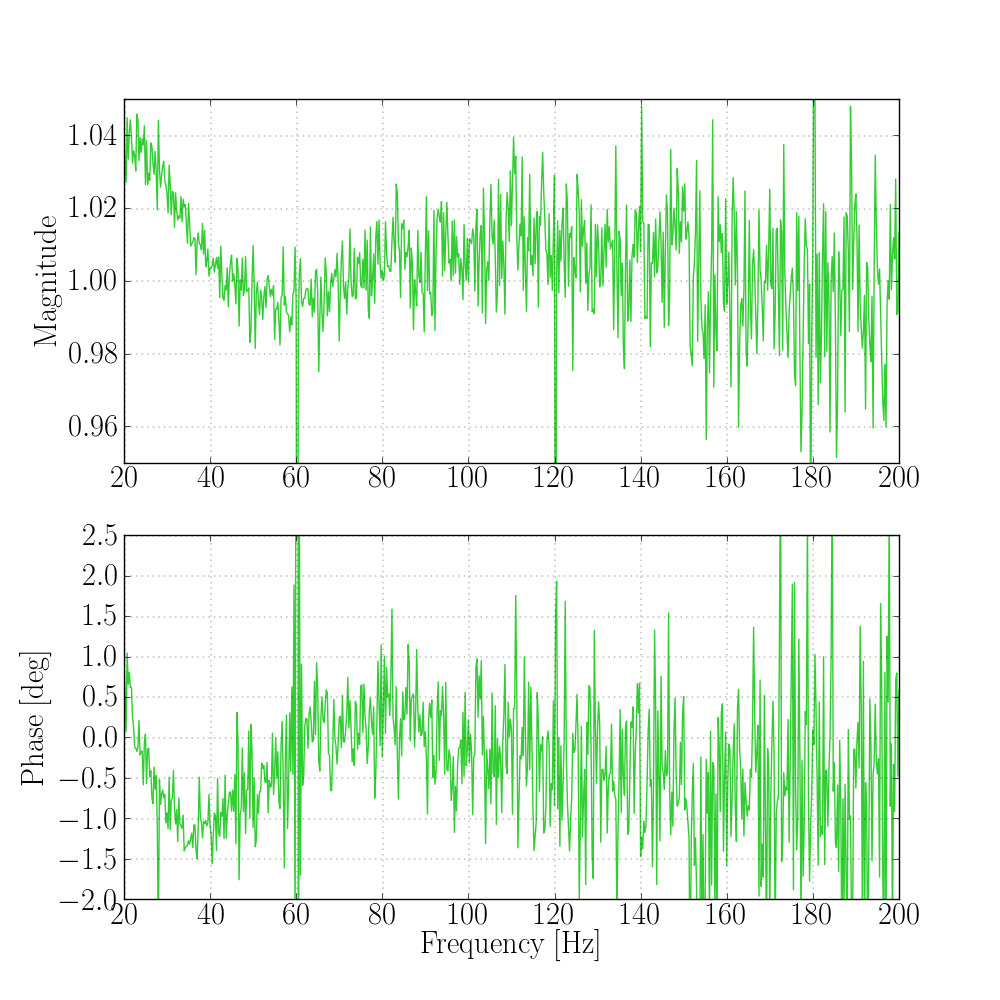
Jeff did a broadband PCAL sweep from 20:30:12 UTC to 20:31:58 UTC. I analyzed the transfer function of GDS / PCALY during this sweep. I've attached the results, which are consistent with our uncertainty budget in this frequency region (20 - 200 Hz). I applied the pyDARM PCAL correction factors as the calibration to the PCAL channel and applied a gain of 3994.5 to the GDS channel to bring both channels into units of meters.
WP8163
Jonathan, Dave:
While H1 was out of lock, I increased the mx_stream delay for h1susauxh34 (hosts h1edc) from 1mS to 3mS. LLO installed a 5mS delay yesterday, but given the larger data size of h1edc (it acquires more channels) we decided to err on the side of caution and try 3mS initially. If the error rate is found to still be non-zero we will go to 5mS.
Since installing h1edc in the DAQ on Tue 02apr2019 we have had three episodes of CRC errors from h1edc
Sun 07apr 04:45 PDT (qty 3)
Mon 07apr 04:30 PDT (qty 3)
Tue 09apr 19:00 PDT (qty 2)
Given the low frequency of this error, we will need to monitor for several weeks.
This morning the CO2 lasers were switched off in lock due to a safety system power failure. This was not a complete waste of time, as it gave us another data point about what happens when we lower CO2X.
I looked back at the same diagnostics as in alog 47958 (except for the AWG lines which are now turned off in observing). We see RF18 dropping: it looks like there is an initial fast decay and then a slower decay (maybe this corresponds to point absorber cooling, followed by substrate cooling?). Unfortunately it looks like the PCAL lasers were also affected, so we don't get any info about the cavity pole or Kappa_c.

We were in observation mode with a stuck excitation bit in h1sqz's STATE_WORD. We verified that there was no actual excitation running, the awg_tp_man excitation slot for H1:SQZ-LO_SERVO_EXC_EXC had gotten stuck following previous excitations of this channel. Daniel manually cleared this awg slot.
The DIAG_EXC guardian node had not reported this excitation (FRS12695)
18:11 UTC H1 into OBSERVE mode
18:52 UTC h1sqz EXC bit turned off
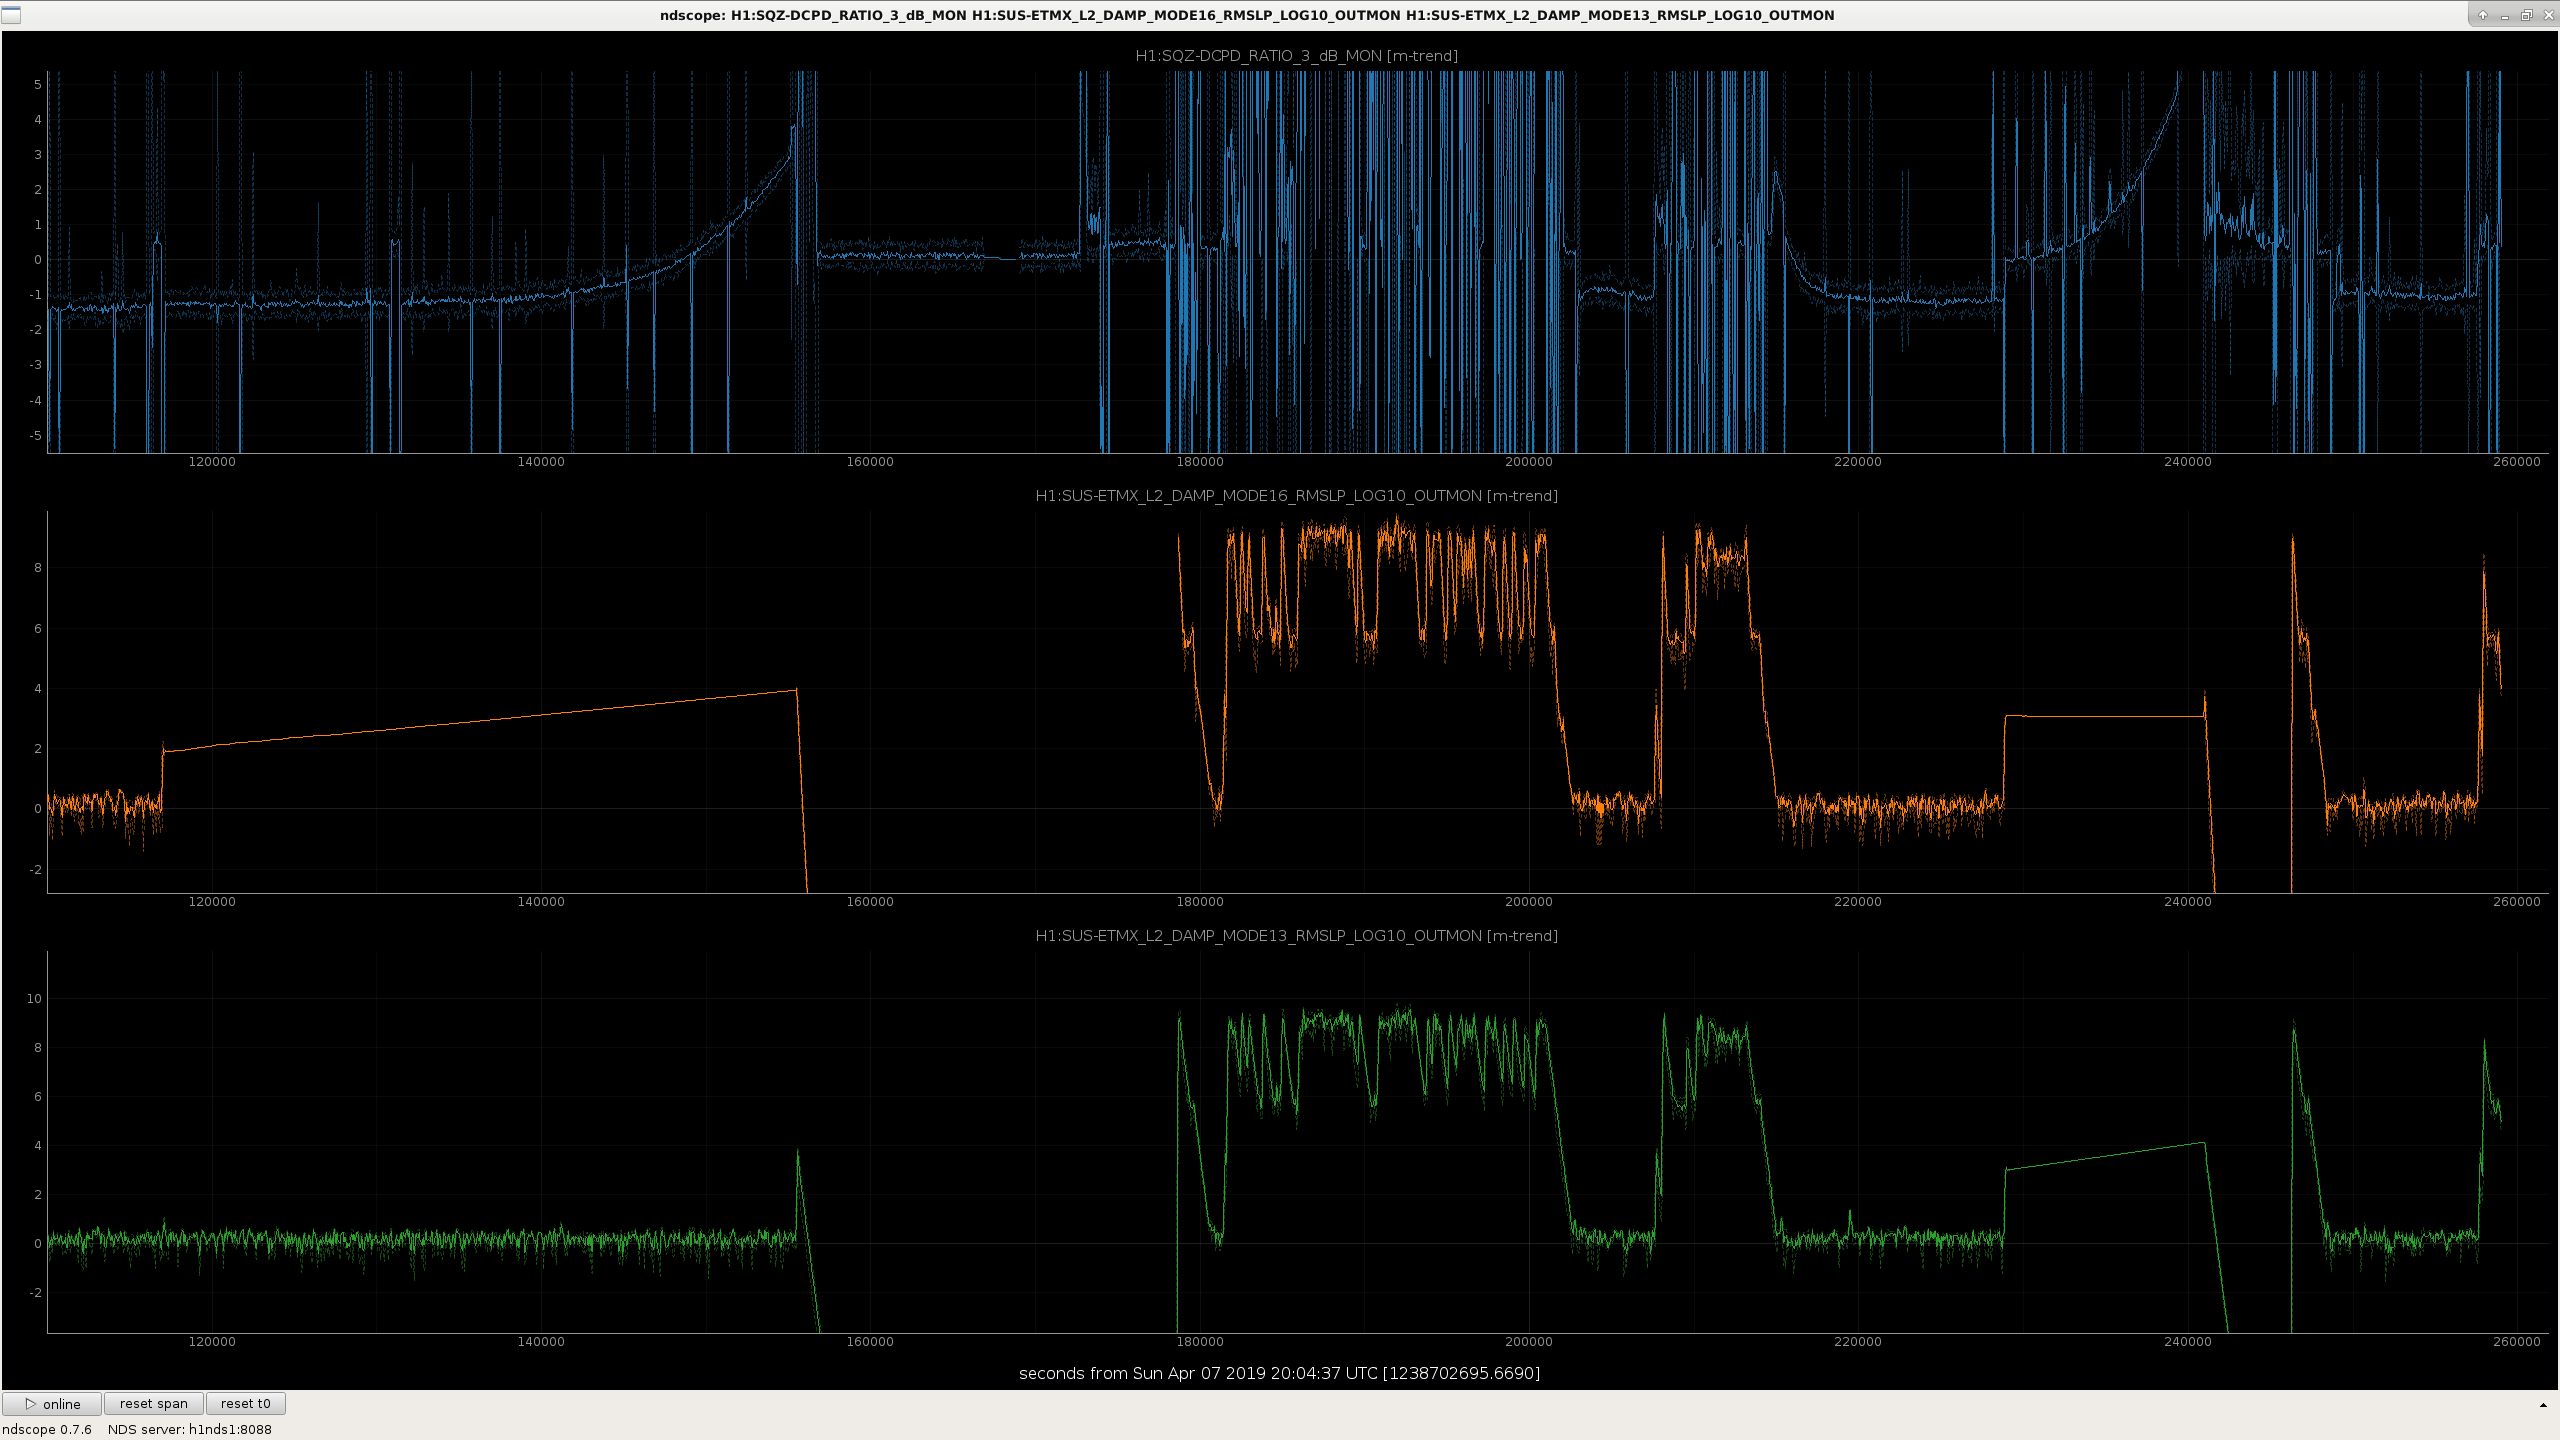
The squeezer blrms that is close to 1kHz has some notches for the 1kHz violin modes. However, in two recent locks modes on ETMX rang up enough to show up in the squeezer blrms anyway, and each time this happened we lost lock at a similar amplitude (see attachment).
It looks like we need to look into what is happening with these two modes, ETMX mode16 and mode13.
Also, while looking into this I made a change to the violin monitor ndscopes that are linked from the violin mode screen.
[Rick, Niko, Sharan]
Forgot to post last week's EY end station calibration measurement, so we're including both this week and last week's in this alog.
Last week's measurement showed some deviation from the trend of the previous four measurements. We later realized on Wednesday that the AOM needed adjusting and the beam alignment was slightly off (see 48206), which could have contributed to the deviation.
To double check, we went to EY again this week and took another measurement. The RX beam alignment looked good, and our result seems to agree with the trend from before last week's measurement to within a few hundredths of a percent.
| Sensor | Dec. 13 | Jan. 15 | Jan. 29 | Feb. 26 | Apr. 02 | Apr. 09 | Apr. 09 / mean of all prev. meas. | Apr. 09 / mean of prev. meas. skipping Apr. 02 |
|---|---|---|---|---|---|---|---|---|
| Tx (V/V) | -0.4808 | -0.4804 | -0.4809 | -0.4808 | -0.4792 | -0.4813 | 1.0016 | 1.0010 |
| Rx (V/V) | -0.7158 | -0.7154 | -0.7162 | -0.7153 | -0.7151 | -0.7157 |
1.00016 |
1.00002 |

No obvious or admitted cause.
For scheduled TCS measurements.
Following up on alog 48180 and the changes we did to the common mode readback channels, we find significant improvements in the spectra of CLF and LO. There is still limited coherence below ~10 Hz between most channels. Some of it is due to quantization noise, but at least for the ERR readback, it may still be slew rate limitations.
As a test, I lowered H1:OMC-ASC_MASTER_GAIN from 0.05 to 0.02 at 17:35 UTC during calibration sweeps. We have been having frequency glitches at 10-15 Hz for the last few weeks, I was wondering if reducing the control signal sent to the OMC would reduce these glitches.
Lowering the gain of the OMC ASC did reduce the control signal, although the rms of the QPD error signals don't seem to change much (attachment). Based on the DMT Omega monitor over the last half hour the low frequency glitches do seem to be reduced, This time doesn't show up on the summary page because the ISC_LOCK state was NLN_CAL_MEAS, not the nominal state.
I haven't put this into the gaurdian yet, but Travis has accepted the change in SDF for this observing segment. If the low frequency glitches do look better we can make this change permanent.
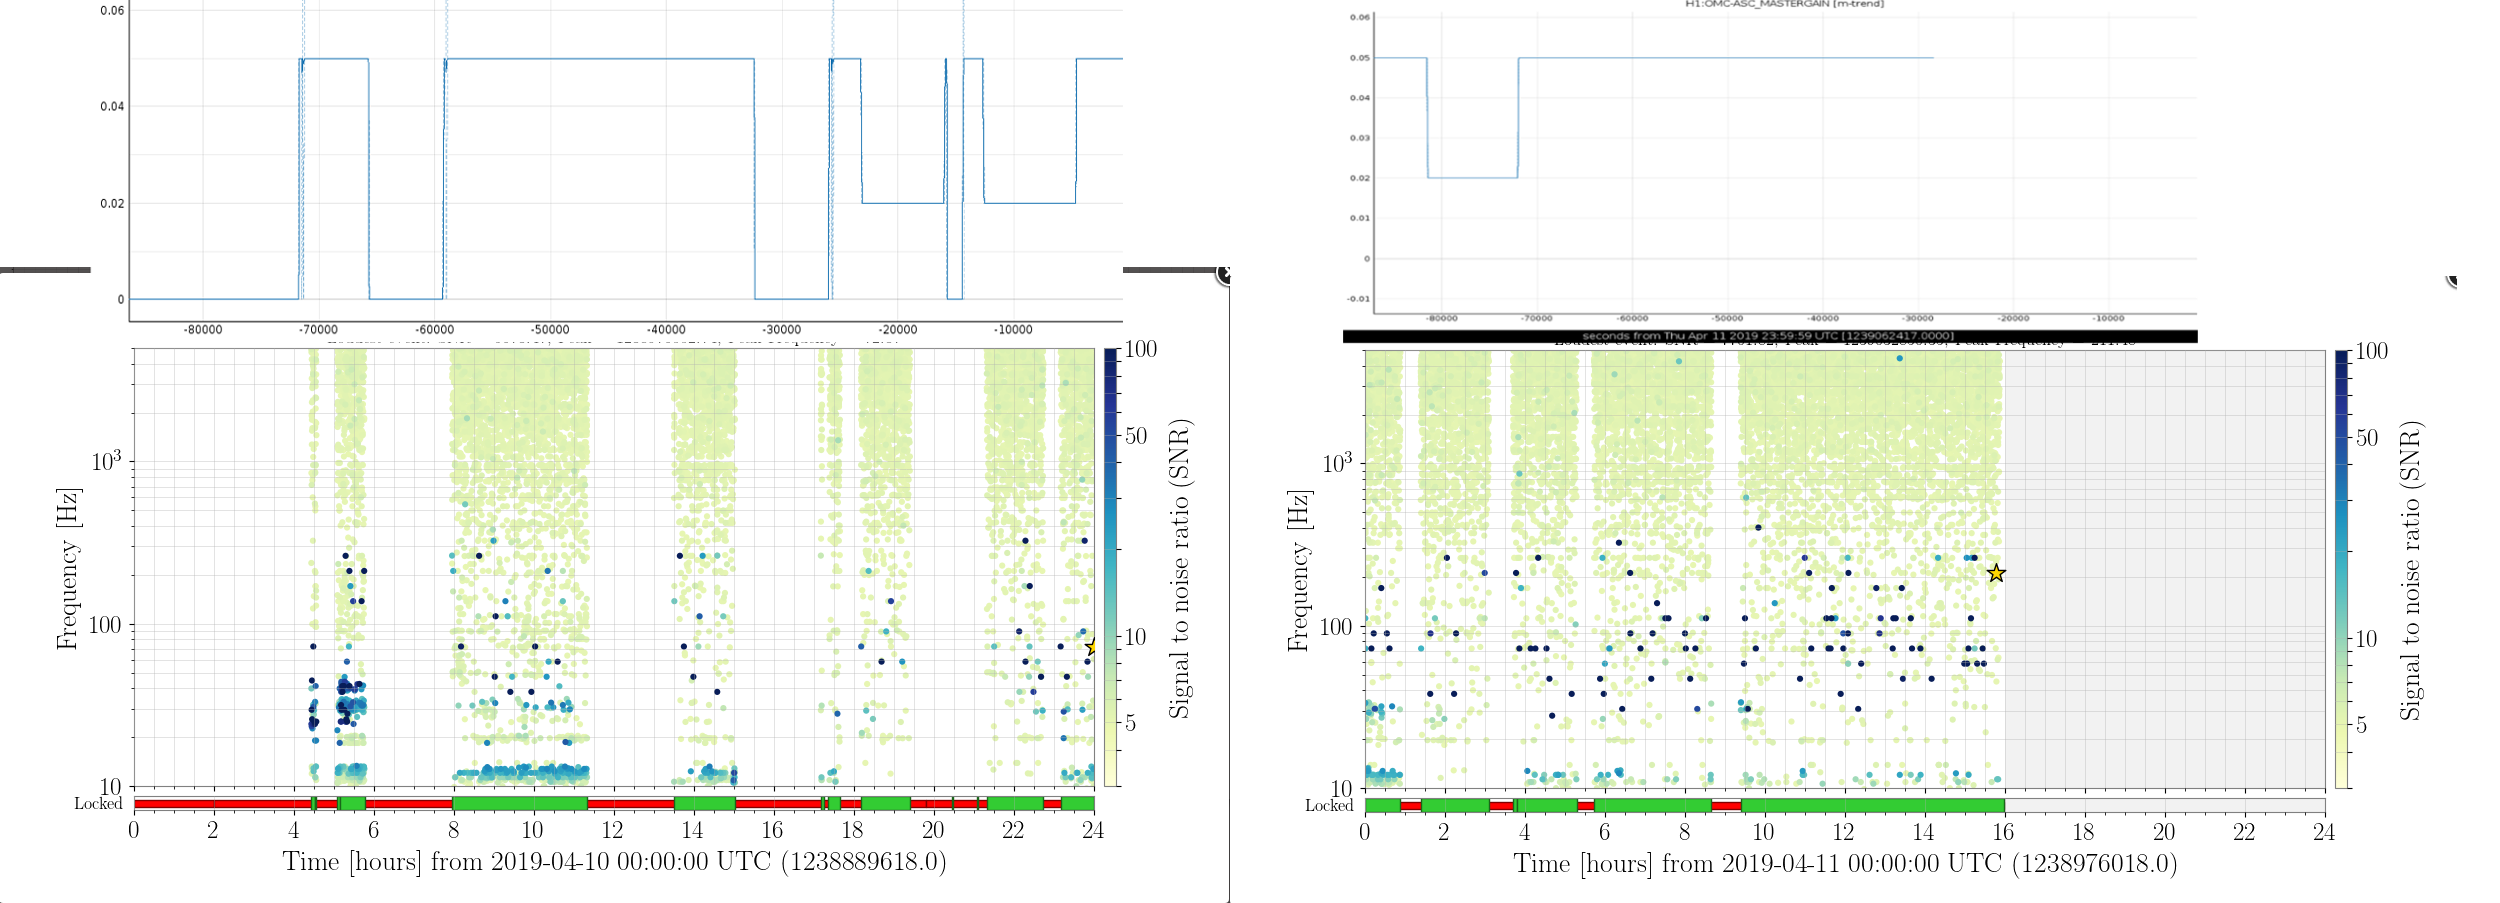
Update: Based on the summary pages there were fewer low frequency glitches while the gain was lowered, but the wind is also dying down simultaneously, so I've turned the gain back up at 19:35 UTC while we are out of observing for SR3 heater tests to see if they come back.The interferometer unlocked shortly after I increased the gain again.
The gain was set to 0.02 for the lock segment from 20:30 UTC to 22:44 UTC, when I set it back to 0.05.
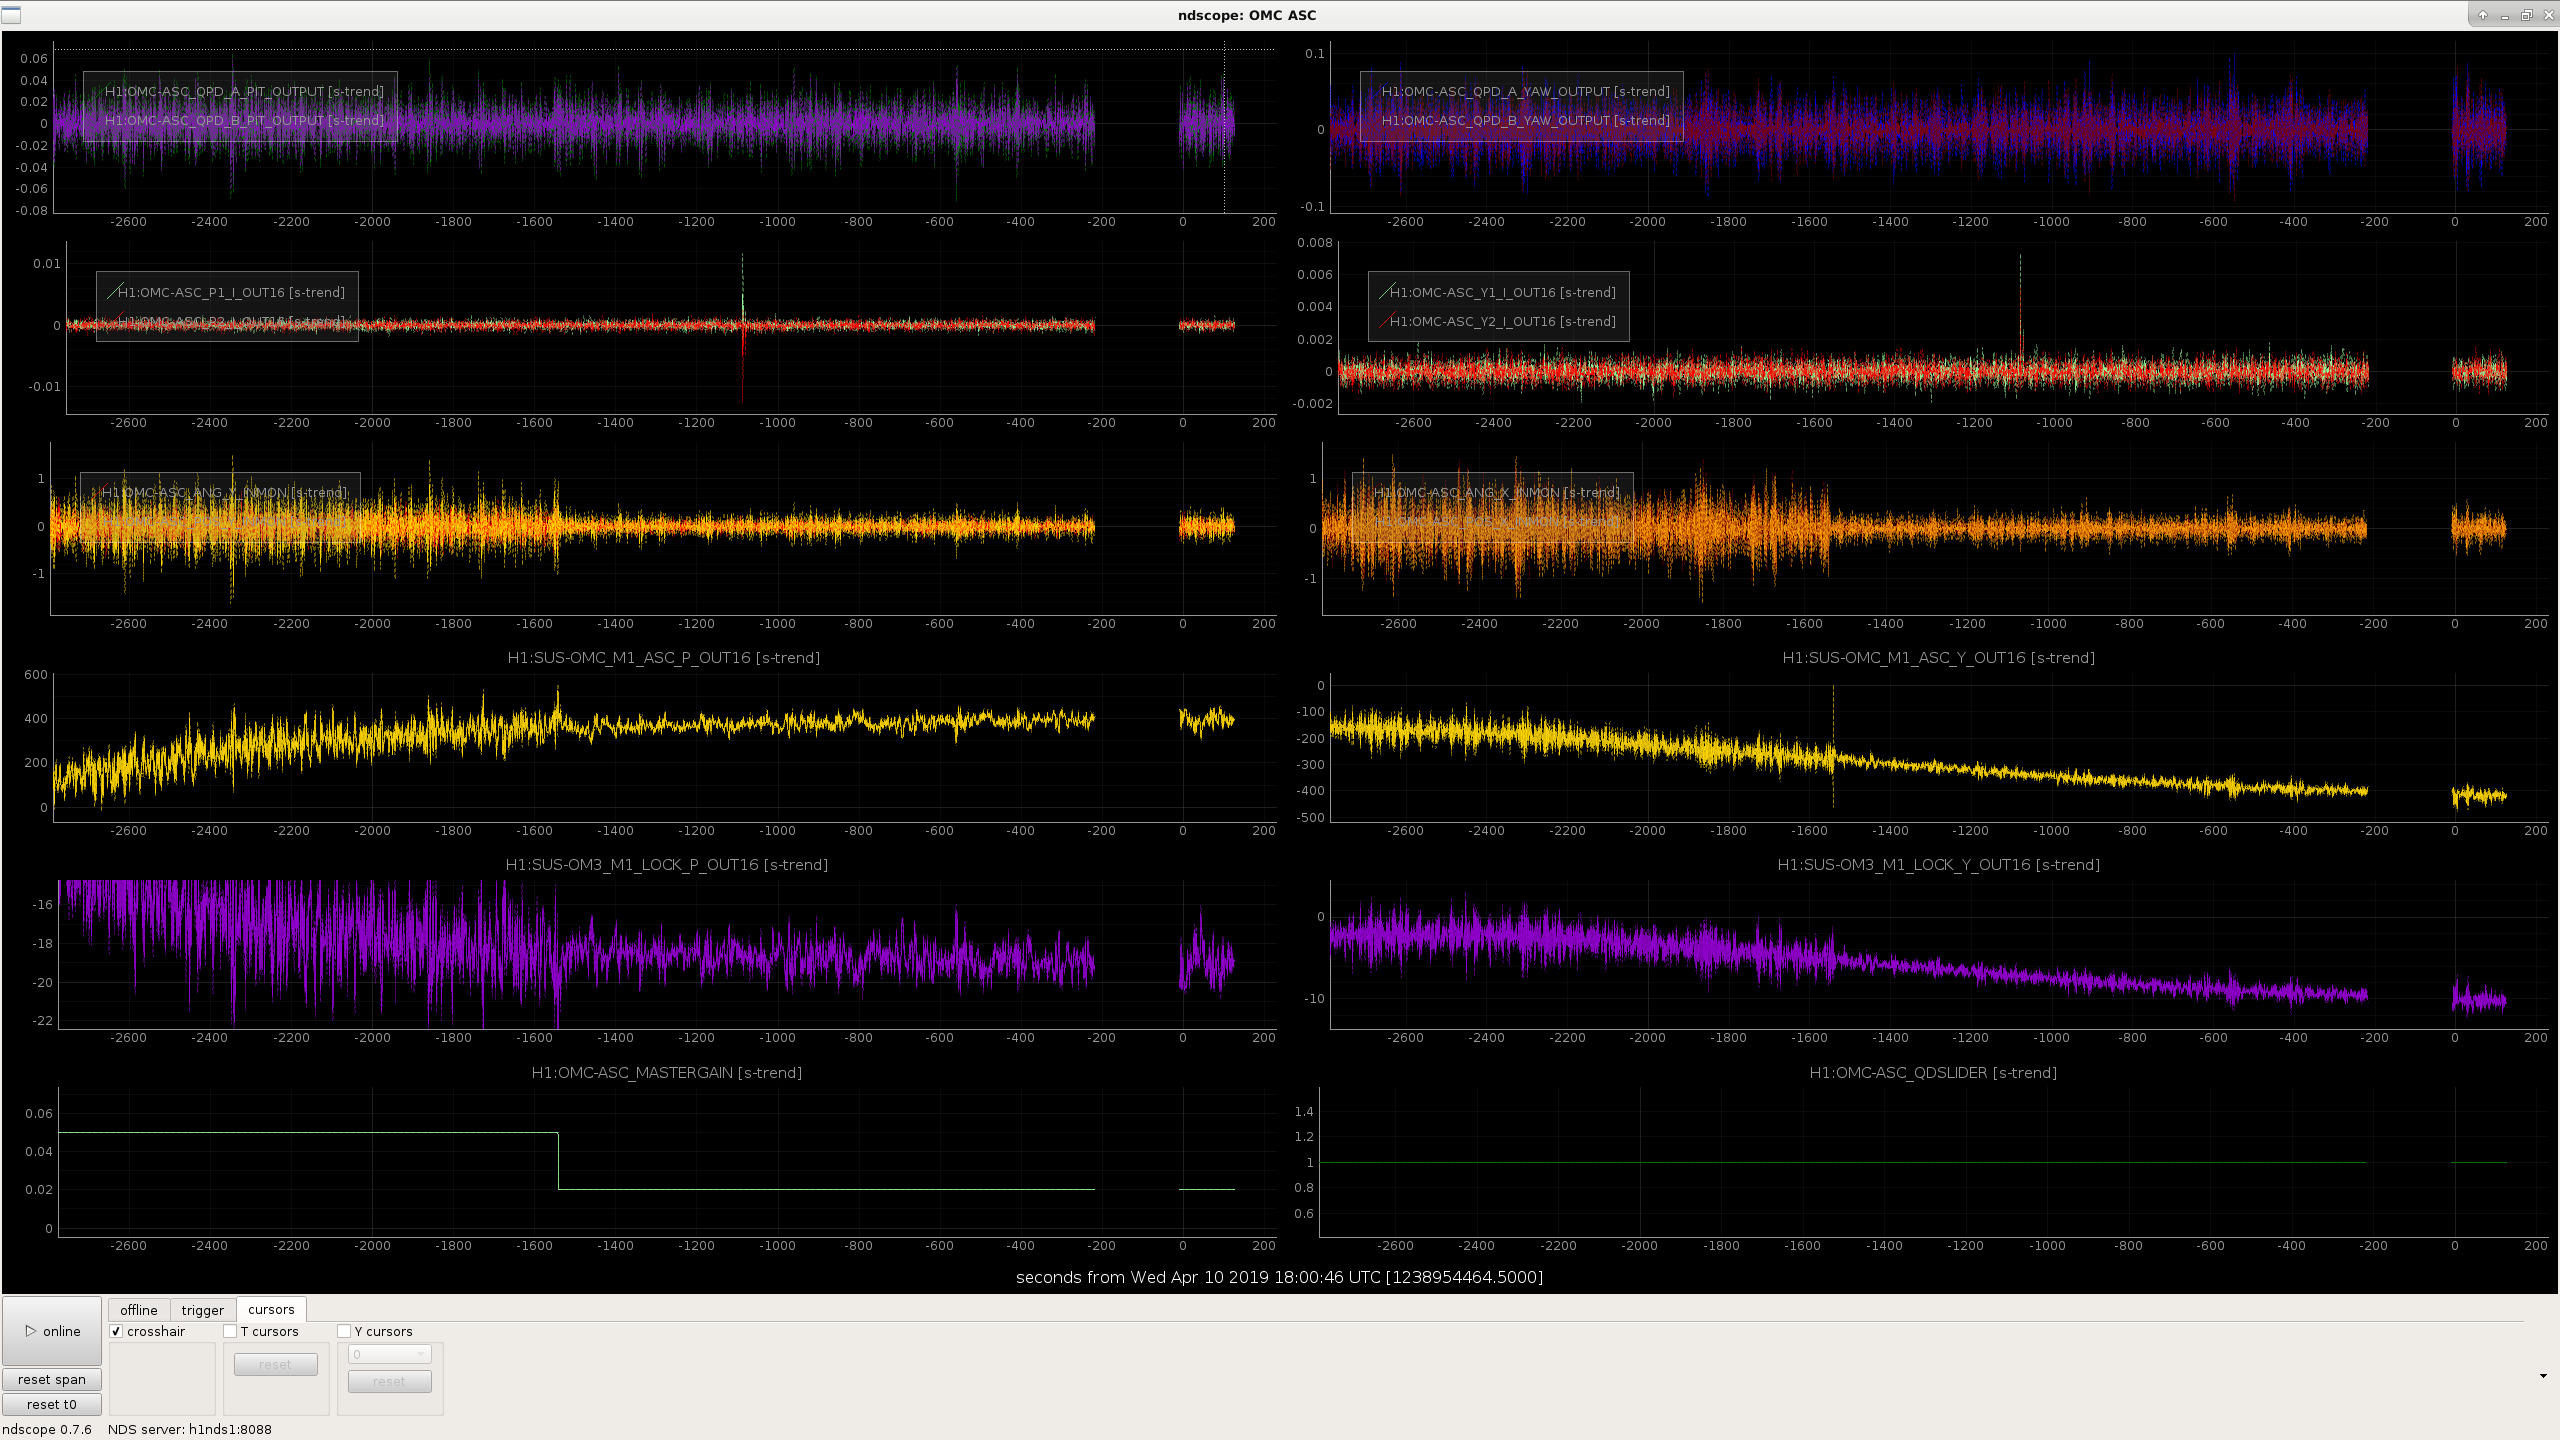
The SR3 heater crew continued to change this gain for different observing segments, and it does seem that lower OMC ASC gain reduces the low frequency scattering. I've lined up some screenshots in the attachment to show this. I will go ahead and put this into the guardian for now. It might be that we could further improve the situation by moving the OMC alignment back to the dithers, we were planning to try a test of that soon.
No problems relocking after Safety System issues this morning. Scheduled CAL measurements are complete. Will be in Observe until ~19:15 UTC at which time scheduled TCS measurements will begin.
[JeffK, Jenne]
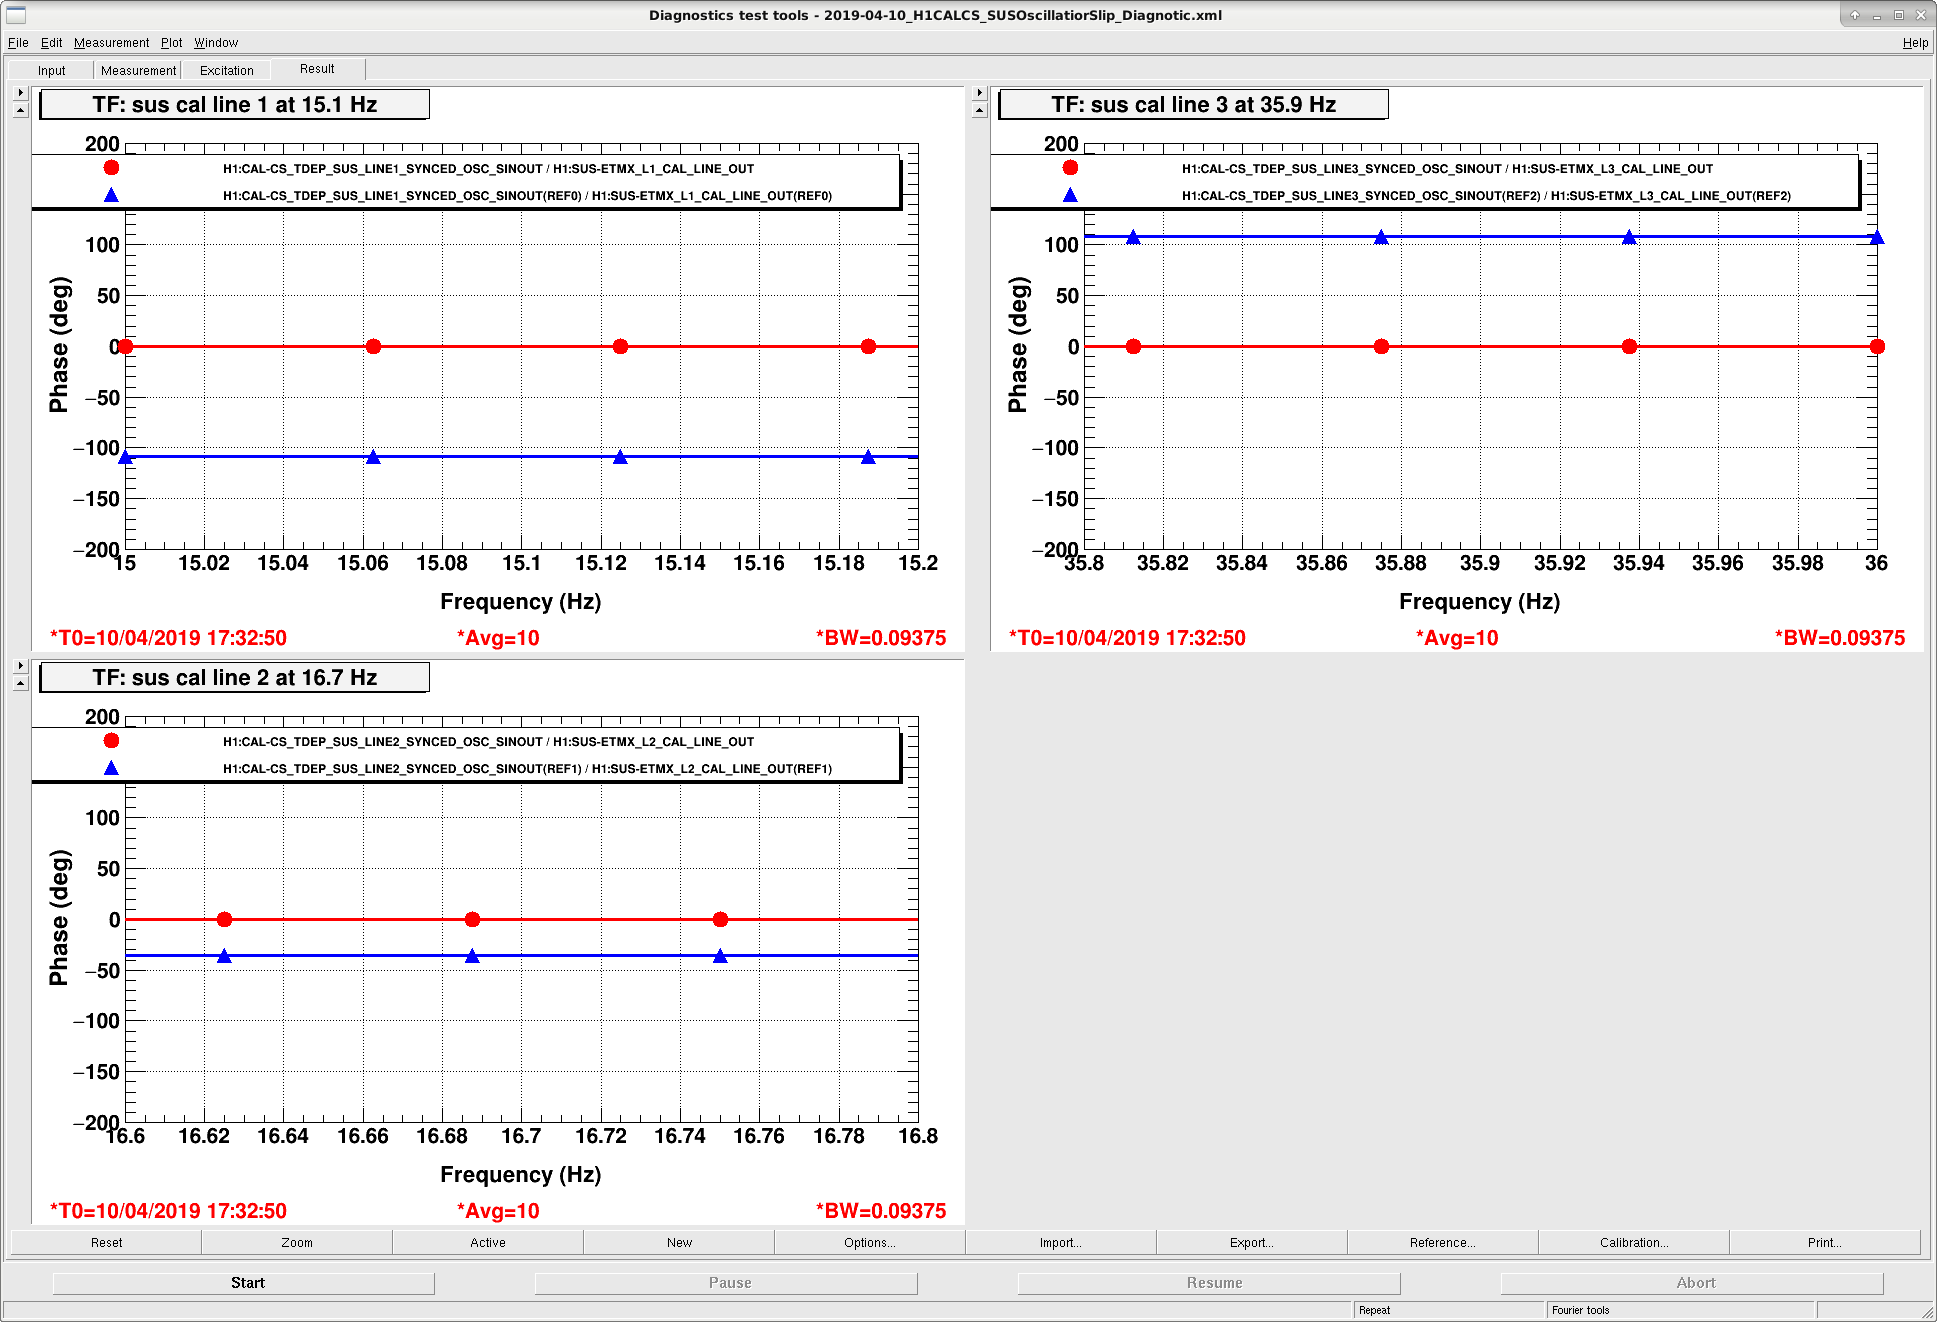
Jeff noticed that the actuator kappas looked funny, and determined that we had another timing slip between CAL CS and SUSETMX for the synced oscillators, like in alog 48129. I zero-ed the frequency of the oscillators and reset them to their nominal values, and that fixed the situation again.
Since I had forgotten to save a template last time, the template that generated the attached screenshot is at /ligo/svncommon/CalSVN/aligocalibration/trunk/Runs/O3/H1/Measurements/CALCS_FE/2019-04-10_H1CALCS_SUSOscillatiorSlip_Diagnotic.xml
Longer term, since Jeff's proposed solution from the FRS (12335) was successfully implemented at LLO (LLO 45007) yesterday, we'll make the same change here at LHO next Tuesday, and will hopefully never have to worry about these timing slips again.
Lilli S, Jeff K,
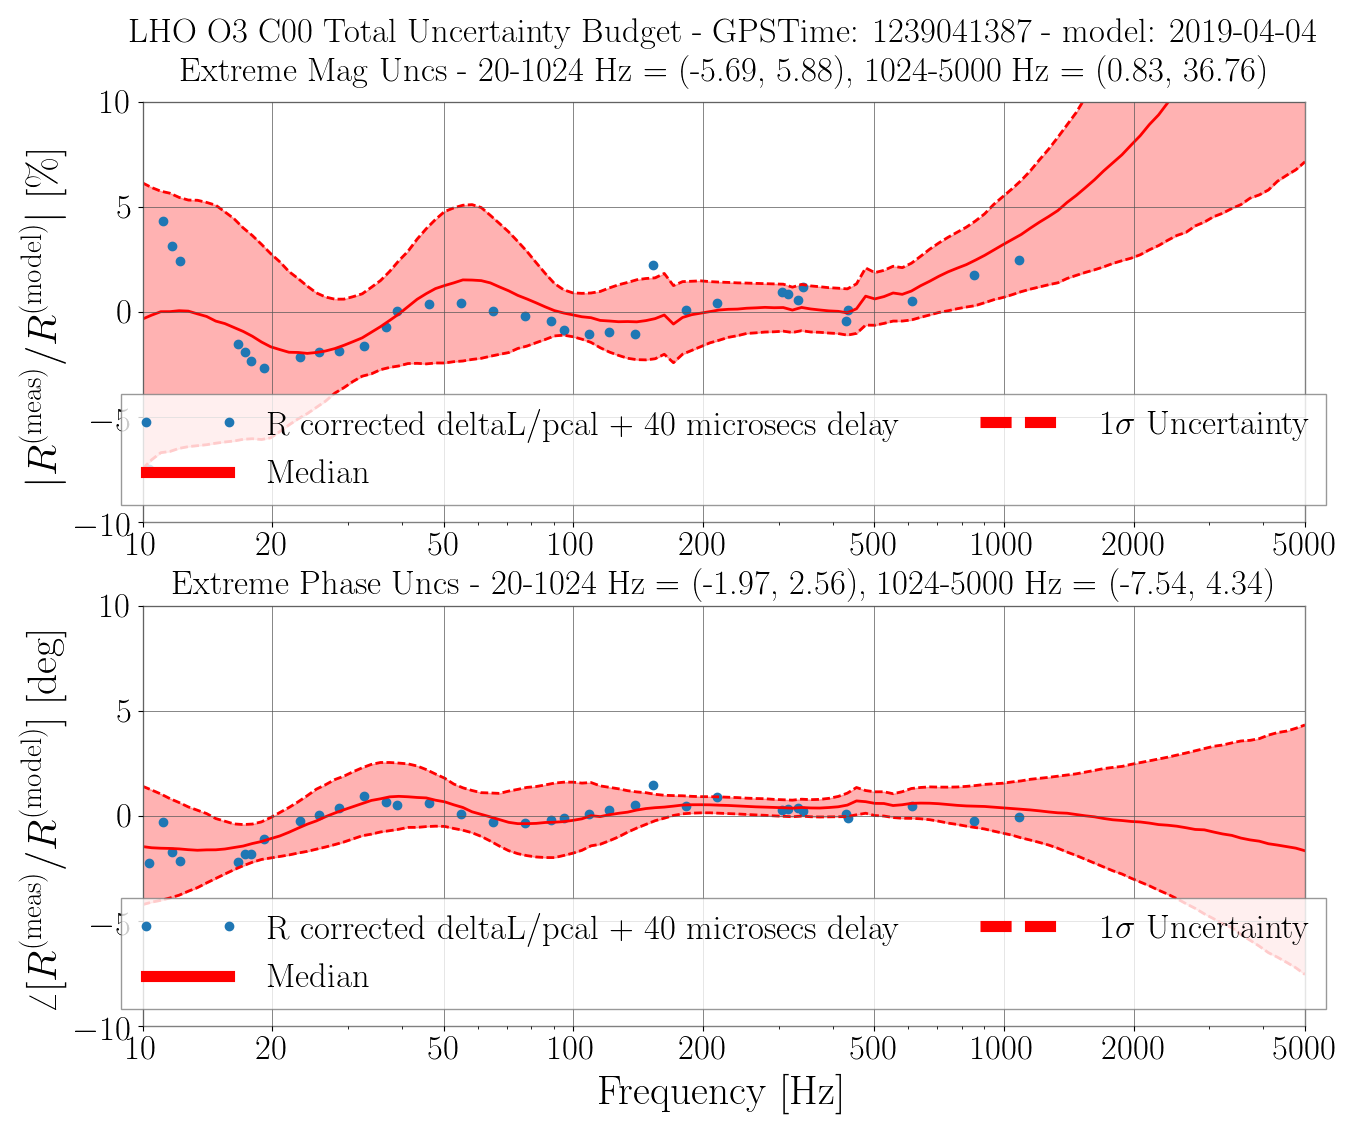
Lately we have tracked down some bugs and misunderstandings -- see more details in 48272, 48276. Now we have made a new model file /ligo/svncommon/CalSVN/aligocalibration/trunk/Runs/O3/H1/params/modelparams_H1_20190404.py, using the measurements taken on 2019-04-03. This new model has been validated and installed in CAL-CS.
--------------------------------------------------
The measurements used to create the model live in /ligo/svncommon/CalSVN/aligocalibration/trunk/Runs/O3/H1/Measurements
The processing scripts live in /ligo/svncommon/CalSVN/aligocalibration/trunk/Runs/O3/H1/Scripts
See attached pdfs for the fitting results. See the detailed fitting output below.
To validate the model, we processed the broadband + sweeps measurements taken last night -- /ligo/svncommon/CalSVN/aligocalibration/trunk/Runs/O3/H1/Measurements (2019-04-10)
The results are attached as BB_deltaL/pcal and SS_deltaL/pcal files. With the response correction factors and a 40-microsecond delay applied, the results (red dots) look good. (Scripts are/ligo/svncommon/CalSVN/aligocalibration/trunk/Runs/O3/H1/Scripts/CALCS_FE/process_broadband_pcal_20190410.py and /ligo/svncommon/CalSVN/aligocalibration/trunk/Runs/O3/H1/Scripts/FullIFOSensingTFs/process_sweep_pcal2darm_20190410.py)
--------------------------------------------------
We also did an estimate of the uncertainty for the reference model (i.e. all kappas set to 1).
The GPR fitting using multiple measurements are shown in multi-meas-GPR.pdf (4 meas for sensing and 2 meas for actuation); Script -- /ligo/svncommon/CalSVN/aligocalibration/trunk/Runs/O3/H1/Scripts/Uncertainty/process_allmeas_writeGPRHDF5_20190404.py
The uncertainty plot for the reference model is attached.
Fitting details are as below:
---------------------------------------------------------------------
Sensing
---------------------------------------------------------------------
Inverse Sensing FOTON values: [NB: SRCD2N zpk gain based on sensing sign in parameters file]
SRCD2N: zpk([410.5556;0.0428+i*4.4689;0.0428-i*4.4689],[0.1;0.1;7000],1,"n")gain(1997.42)
Gain: gain(3.077e-07)
Inverse Sensing without cavity pole FOTON values for CFTD path: [NB: SRCD2N zpk gain based on sensing sign in parameters file]
SRCD2N: zpk([0.0428+i*4.4689;0.0428-i*4.4689],[0.1;0.1],1,"n")gain(1997.42)
Gain: gain(3.077e-07)
Parameter | Quantiles (0.15, 0.50, 0.84)
---------------------------------------------------------------------
Optical gain, H_c (ct/m) | 3.249e+06, 3.25e+06, 3.252e+06
Cavity pole, f_cc (Hz) | 409.8, 410.6, 411.3
Detuned SRC spring frequency, f_s (Hz) | 4.425, 4.469, 4.513
Detuned SRC spring quality factor, 1/Q_s | 64.37, 52.19, 43.88
Residual time delay, tau_c (usec) | 0.5522, 0.9963, 1.438
------------------------------- OR ----------------------------------
Optical gain, H_c (ct/m) | 3.25e+06 (+1430,-1408) or (+0.04399%,-0.04333%)
Optical gain, H_c (mA/pm) | 4.34 (+0.001909,-0.00188) or (+0.04399%,-0.04333%)
Cavity pole, f_cc (Hz) | 410.6 (+0.7268,-0.7248) or (+0.177%,-0.1765%)
Detuned SRC spring frequency, f_s (Hz) | 4.469 (+0.04354,-0.04401) or (+0.9743%,-0.9847%)
Detuned SRC spring quality factor, Q_s | 52.19 (+275.5,-275.9) or (+18.94%,-18.92%)
Residual time delay, tau_c (usec) | 0.9963 (+0.4416,-0.4441) or (+44.32%,-44.58%)
---------------------------------------------------------------------
UIM
---------------------------------------------------------------------
The Force Coefficient "answer" in terms of ...
Force per count of longitudinal DAC request (just down stream of DRIVEALIGN bank):
Gain = 7.67e-08 (N/ct)
Force per actuator signal (current or voltage):
Gain = 1.634 (N/A)
All MCMC Results (w/ Uncertainty) for UIM Parameters:
Parameter | Quantiles (0.15, 0.50, 0.84)
---------------------------------------------------------------------
Actuator gain, H_c (N/ct) | 7.666e-08, 7.67e-08, 7.673e-08
Residual time delay, tau_A (usec) | 58.27, 61.05, 63.85
------------------------------- OR ----------------------------------
Actuator gain, H_c (N/ct) | 7.67e-08 (+3.684e-11,-3.709e-11) or (+0.04803%,-0.04835%)
Residual time delay, tau_A (usec) | 61.05 (+2.794,-2.786) or (+4.576%,-4.563%)
---------------------------------------------------------------------
PUM
---------------------------------------------------------------------
The Force Coefficient "answer" in terms of ...
Force per count of longitudinal DAC request (just down stream of DRIVEALIGN bank):
Gain = 6.036e-10 (N/ct)
Force per actuator signal (current or voltage):
Gain = 0.02947 (N/A)
All MCMC Results (w/ Uncertainty) for PUM Parameters:
Parameter | Quantiles (0.15, 0.50, 0.84)
---------------------------------------------------------------------
Actuator gain, H_c (N/ct) | 6.033e-10, 6.036e-10, 6.039e-10
Residual time delay, tau_A (usec) | 38.6, 40.88, 43.17
------------------------------- OR ----------------------------------
Actuator gain, H_c (N/ct) | 6.036e-10 (+3.143e-13,-3.131e-13) or (+0.05207%,-0.05187%)
Residual time delay, tau_A (usec) | 40.88 (+2.296,-2.276) or (+5.617%,-5.569%)
---------------------------------------------------------------------
TST
---------------------------------------------------------------------
The Force Coefficient "answer" in terms of ...
Force per count of longitudinal DAC request (just down stream of DRIVEALIGN bank):
Gain = 4.727e-12 (N/ct)
Force per actuator signal (current or voltage):
Gain = 4.427e-11 (N/V**2)
All MCMC Results (w/ Uncertainty) for TST Parameters:
Parameter | Quantiles (0.15, 0.50, 0.84)
---------------------------------------------------------------------
Actuator gain, H_c (N/ct) | 4.724e-12, 4.727e-12, 4.729e-12
Residual time delay, tau_A (usec) | 5.352, 5.947, 6.538
------------------------------- OR ----------------------------------
Actuator gain, H_c (N/ct) | 4.727e-12 (+2.411e-15,-2.393e-15) or (+0.051%,-0.05062%)
Residual time delay, tau_A (usec) | 5.947 (+0.5917,-0.5942) or (+9.951%,-9.993%)
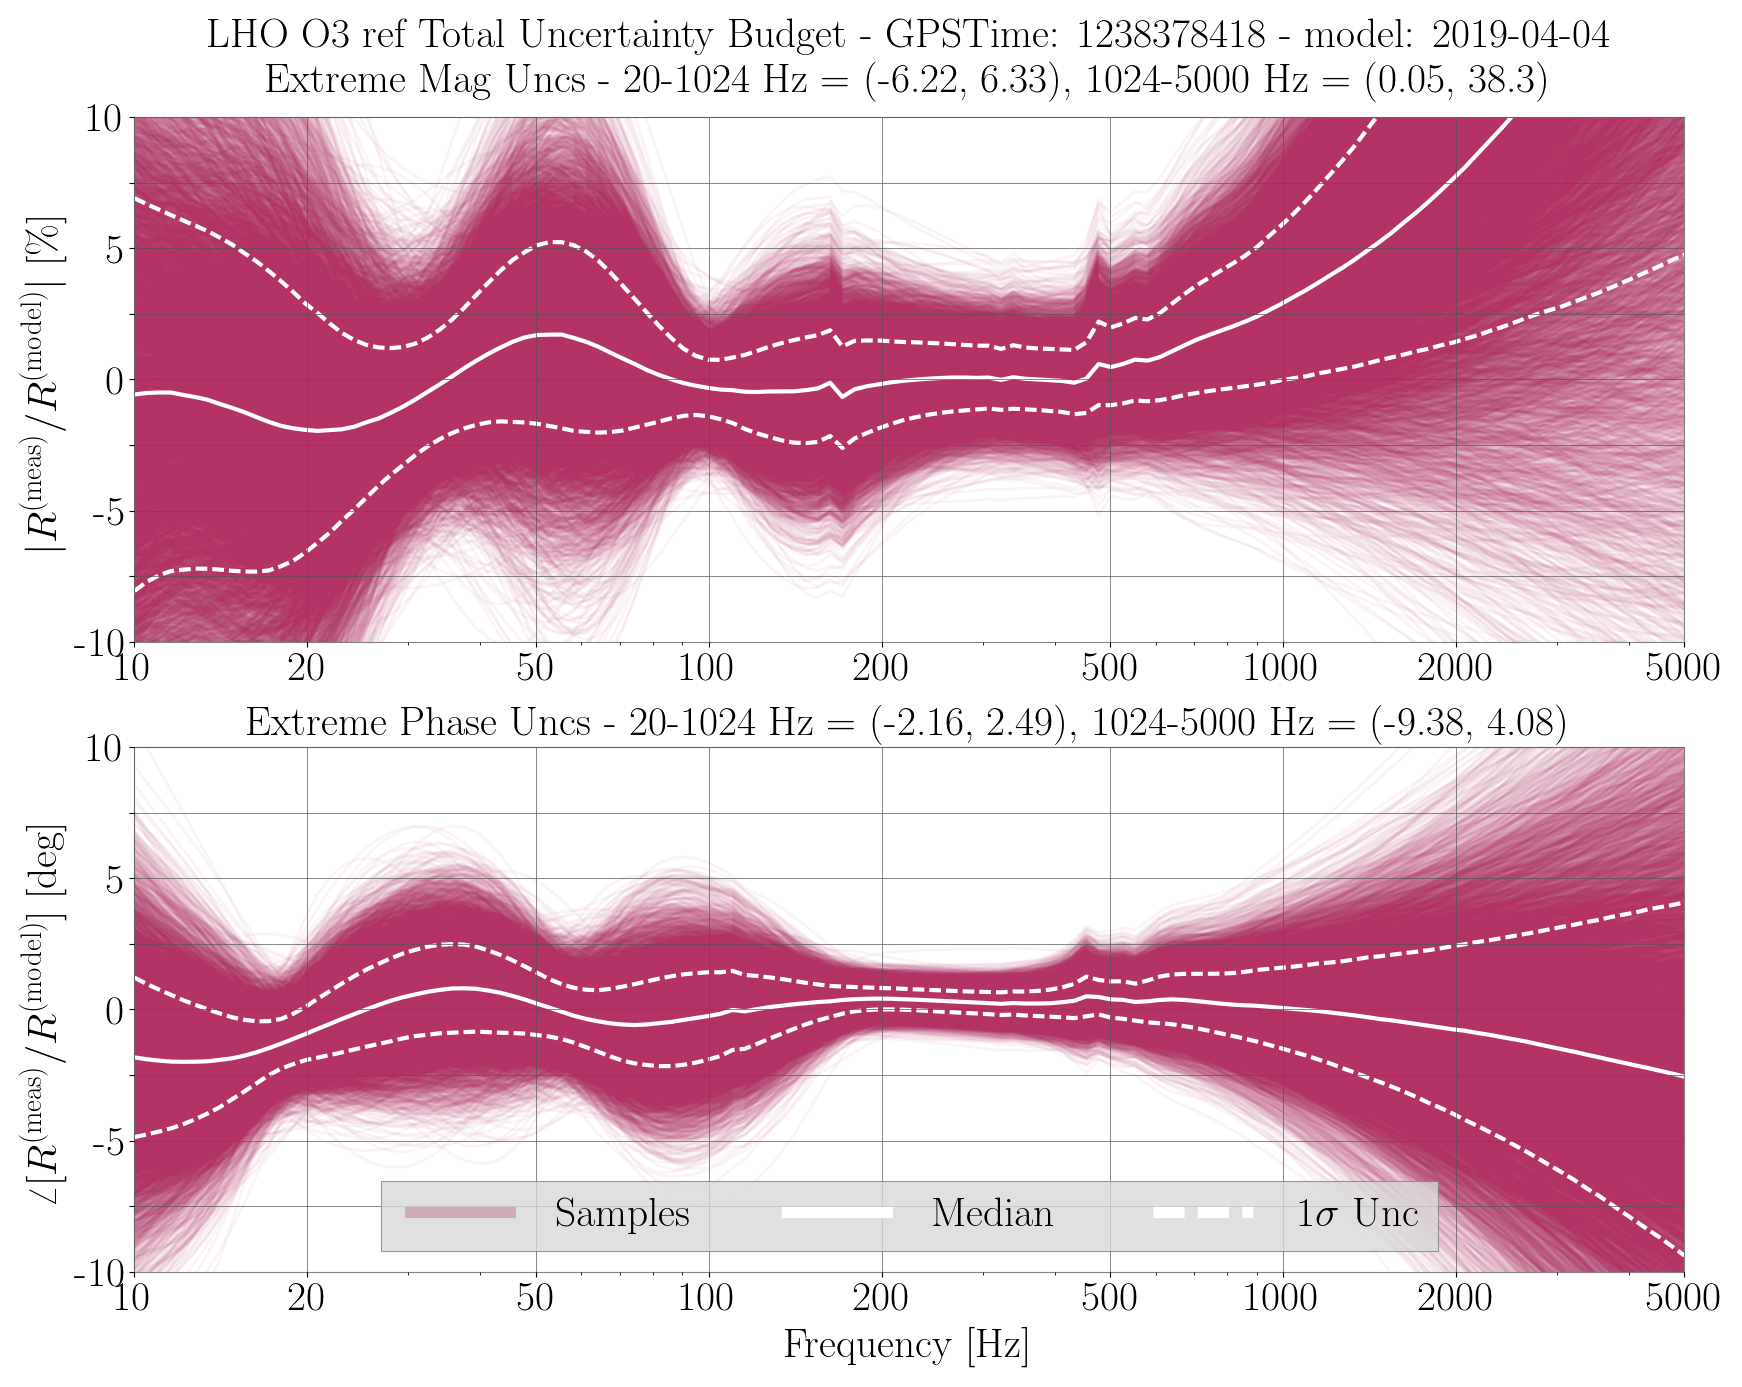
As a sanity check, I have plotted the corrected PCAL to DARM sweep measurements on top of the uncertainty curves. They are consistent with each other.
In an effort for robustness we had installed a UPS on the safety system power supply last year to help ride through any minor power bumps. This morning at 14:34 UTC the UPS failed and took down the lasers that are connected to it. We probably would not have been down as long but I misinterpreted the error message. It was a communication error the Term6-Term20. I took this to mean term 20 which is the TCS CO2 laser interlock had failed. Sure enough there were no link lights. Swapped out the module but still not link lights. So new interpretation is it was terminal through 20 not just 20. Went to the chassis in the LVEAj and power was off. The UPS that feeds the 24V power supply was off. Bypassed the unit for now and the system has been restored. Since we were down anyway rebooted the computer since it had been running for months. Reset all the systems and turned on all the lasers that were off. Finishing with EY ALS.
Laser that went down.
TCS CO2-X
TCS CO2-Y
SQZ-
ALS X
ALS Y
FRS 12699
Nutsinee Daniel
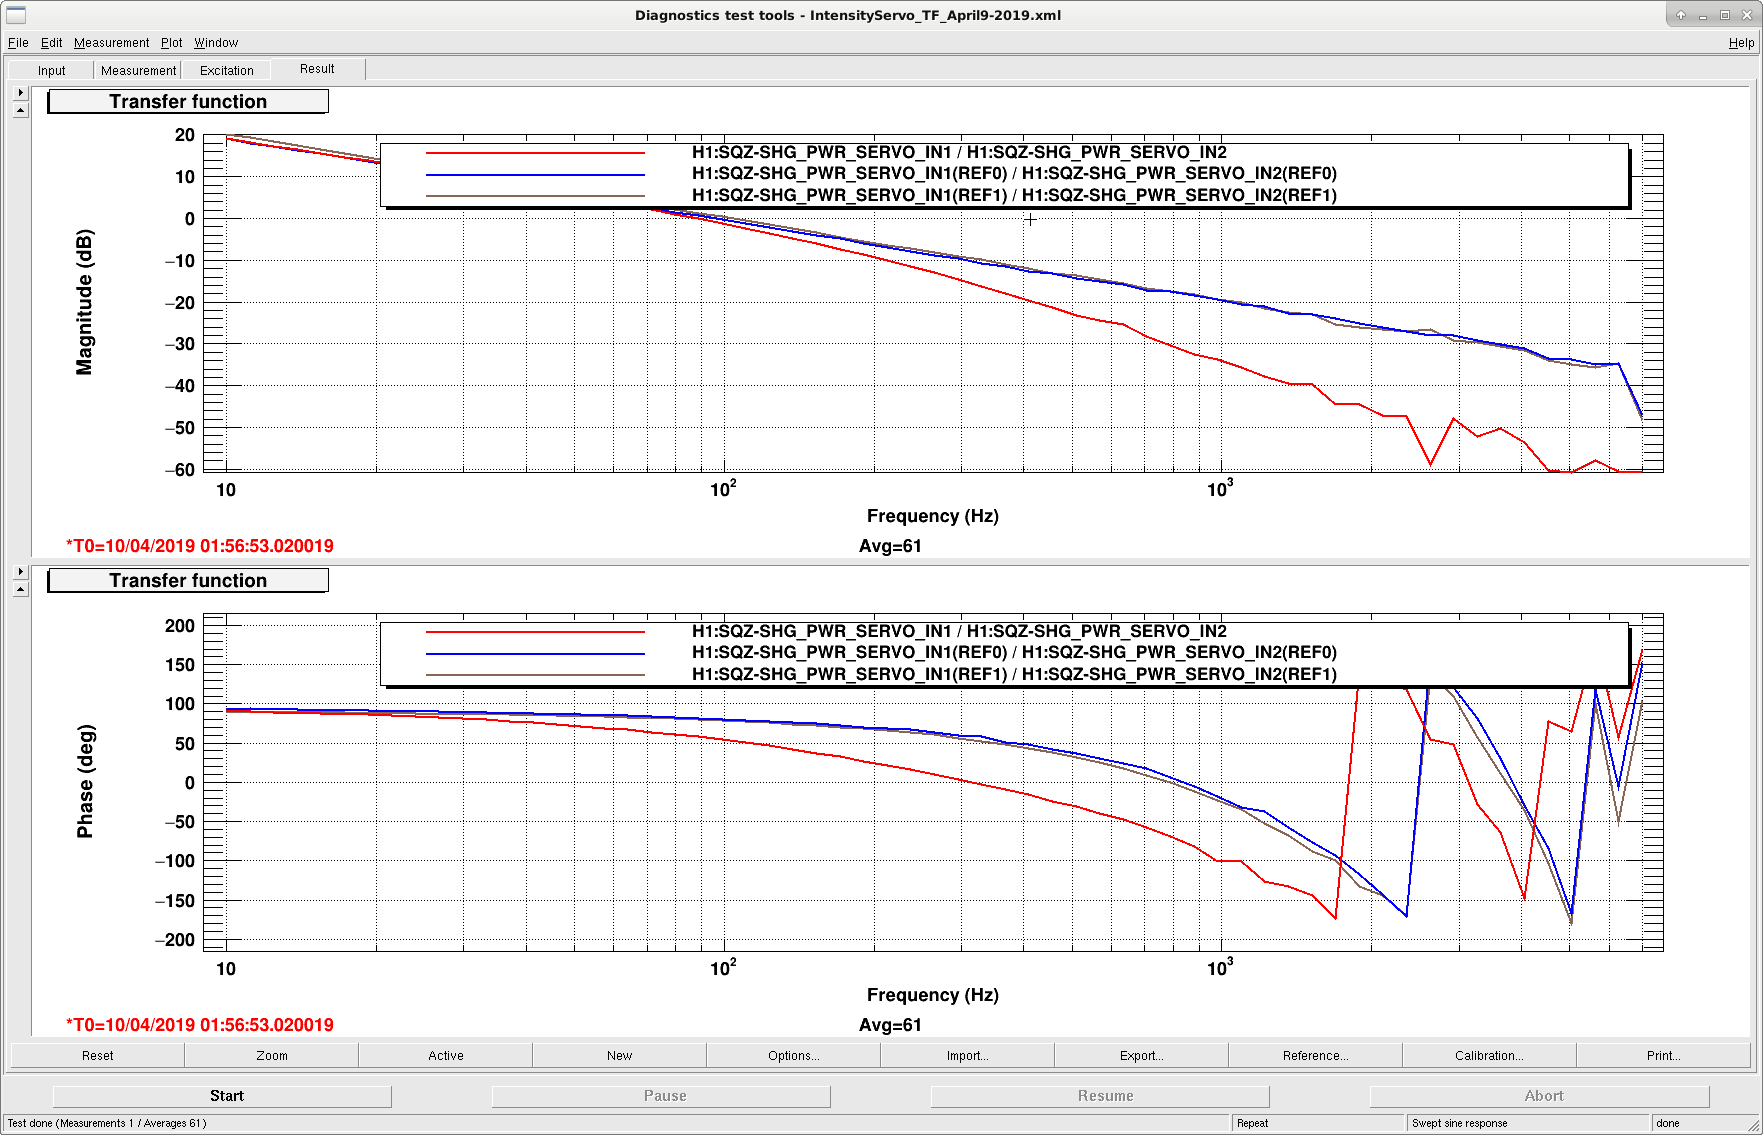
Plot 1 shows the open loop gain of the servo. Blue and brown represent the original TF using the OPO TRANS and REFL as error signals, respectively. Ugf is 100 Hz. The red curve is after we added a 200 Hz low pass filter to reduce high frequency noise.
Plot 2 shows the noise of the OPO TRANS and REFL photodetectors: the green curve shows the noise with the servo off, the red curve is with REFL as the error signal, the brown curve with TRANS as the error signal, and black represents the dark noise.
Plot 3: Coherence for the above spectra. There is a lot of uncorrelated noise below ~10 Hz.
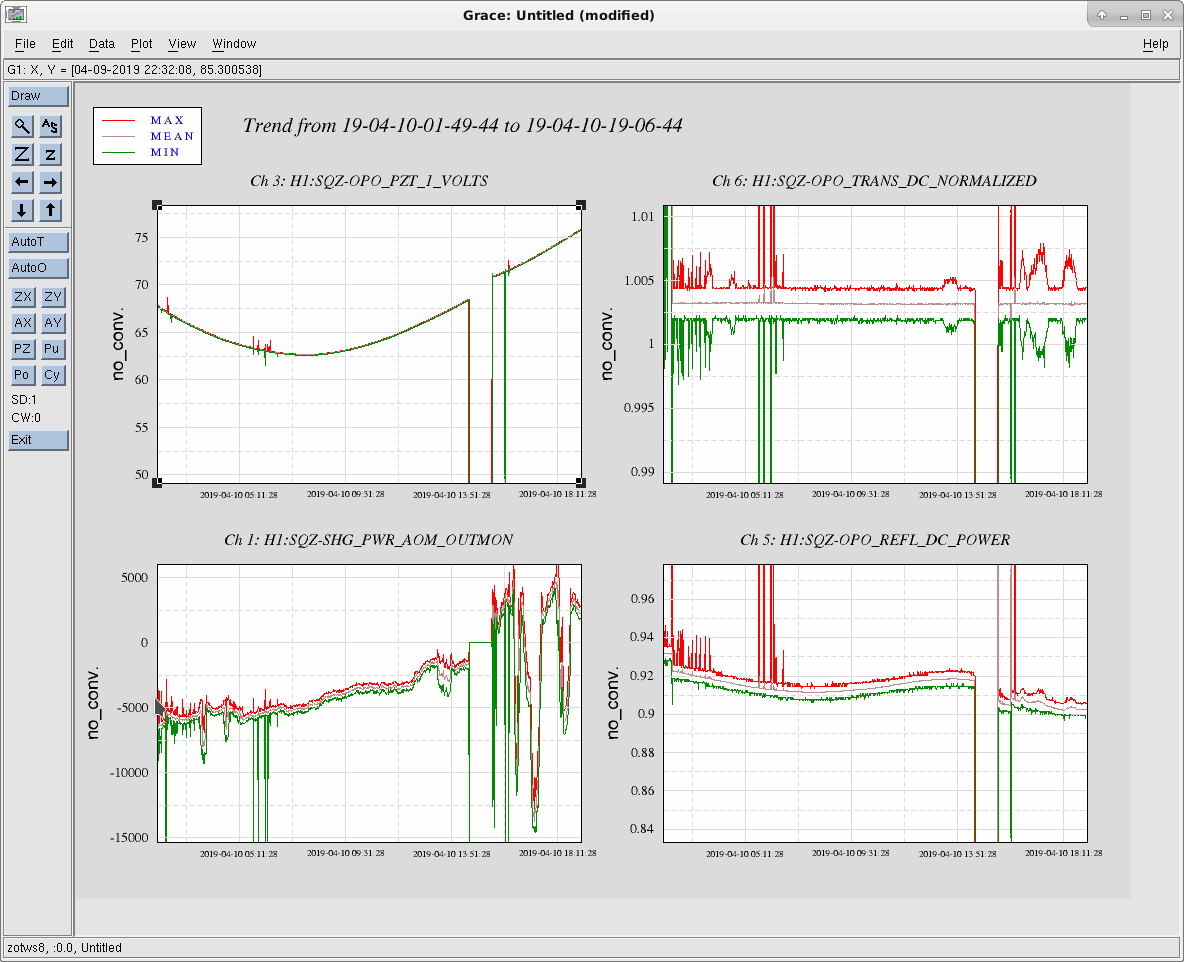
The default error signal is now the transmitted power of the OPO. Nominal power in transmission is 325 nW, and 0.945 mW in reflection.
Not surprisingly, the transmitted power is much more stable now.
There are several things that the CALCS calibration doesn't correctly calibrate, which are corrected later in the GDS calibration. As Jeff and Lili wrote in a dcc document yesterday, T1900169, if the real sensing function C = dC*C' where C' is the sensing function implemented in CALCS, and A=dA*A', then the correction that needs to be applied to the front end calibration R/R' = 1/delC*(1+CAD)/(1+CAD/(delA delC)) What is currently implemented (for example in the calibration of dtt templates) is just 1/delC, which is fairly different from the R/R' correction. The first attached pdf shows the difference between 1/delC and the full response function correction for the pyDARM model from April 2nd.
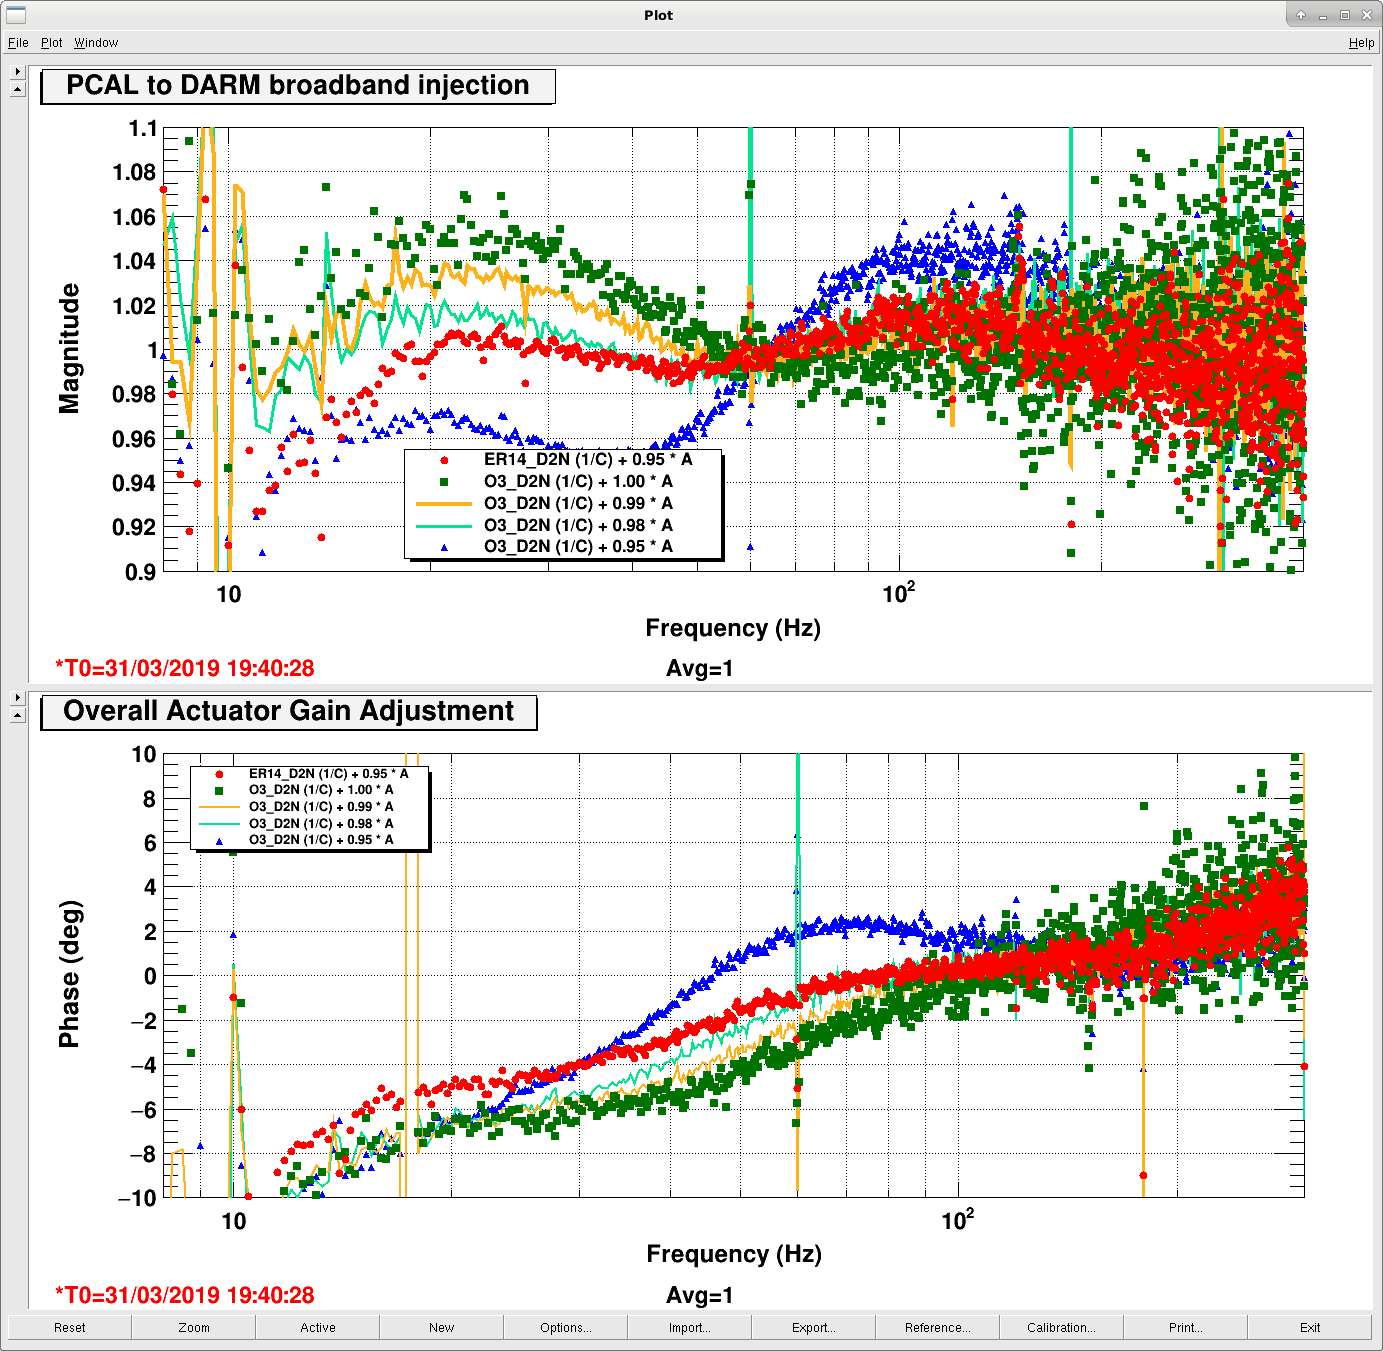
On March 31st, 48102 CAL CS filters based on the sensing and actuation measurements were installed, and checked with a boardband pcal to DeltaL measurement. (green squares in this plot). We are now very unsure about the calibration applied in this DTT template, but last week it was used to adjust the calibration, all the acutator gains were scaled by 0.95 to make the result from this template seem closer to 1 (red dots in the plot).
Today we took the data from the time of the broad band injection with the correctly fit CALCS filters installed, exported it with no calibration applied by dtt, and removed the whitening and 2 1Hz poles for the pcal response in meters, which results in the orage dots in the second pdf (delta L/pcal meters without correcting R). This reproduces the result from the dtt template fairly well, with an apparent 4% systematic error from 20-30 Hz, where the dtt template shows 5%. Applying the R/R' correction to this measurement, the apparent systematic error is reduced.
The script used to produce this plot is in the CALSVN /O3/H1/Scripts/CALCS_FE/process_broadband_pcal_20190331.py I have used the outputs of pyDARM for the corrections to the sensing function and the actuation function, but the calibration group has been checking these functions throughly, and Jeff is writing an alog right now about what they have found. Once we are confident about the corrections produced by pyDARM we can rerun this script.
For now it seems like we can take the 0.95 scale factor out of CALCS.
I've added an updated plot including the results of correcting 1/deltaC only.
There are two minor updates, which do not impact the overall results:
1) R/R' should be 1/delC * (1 + CAD delA delC) / (1+CAD) rather than 1/delC*(1+CAD)/(1+CAD/(delA delC)) [see T1900169]
2) Using the 20190328springfix model, the one installed in CAL-CS when taking the green BB measurements.
The actuation correction only curve explains why the green squares became blue triangles in this BB plot when tuning the actuation amplitudes. But the phase still does not match what we see in this BB plot.
Clarification: the last comment "R/R' should be 1/delC * (1 + CAD delA delC) / (1+CAD) rather than 1/delC*(1+CAD)/(1+CAD/(delA delC))" was wrong. I misunderstood the original parameters. Sheila's equation was the correct one. But the results are still the same.