Displaying reports 43361-43380 of 88618.Go to page Start 2165 2166 2167 2168 2169 2170 2171 2172 2173 End
Reports until 14:59, Friday 25 January 2019
H1 ISC (CDS, DetChar, ISC, Lockloss, OpsInfo, PEM)
jeffrey.kissel@LIGO.ORG - posted 14:59, Friday 25 January 2019 - last comment - 15:28, Friday 25 January 2019(46644)
What It Looks Like in ALS When External Comm Fiber Bundle (Including ALS Optical Fiber) Is Tapped -- Source of 'Rainy' Day Glitches?
J. Kissel, reporting for  F. Clara, R. McCarthy (Tappers), J. Driggers, S. Dwyer T. Shaffer (Witnesses), K. Kawabe (Photographer)

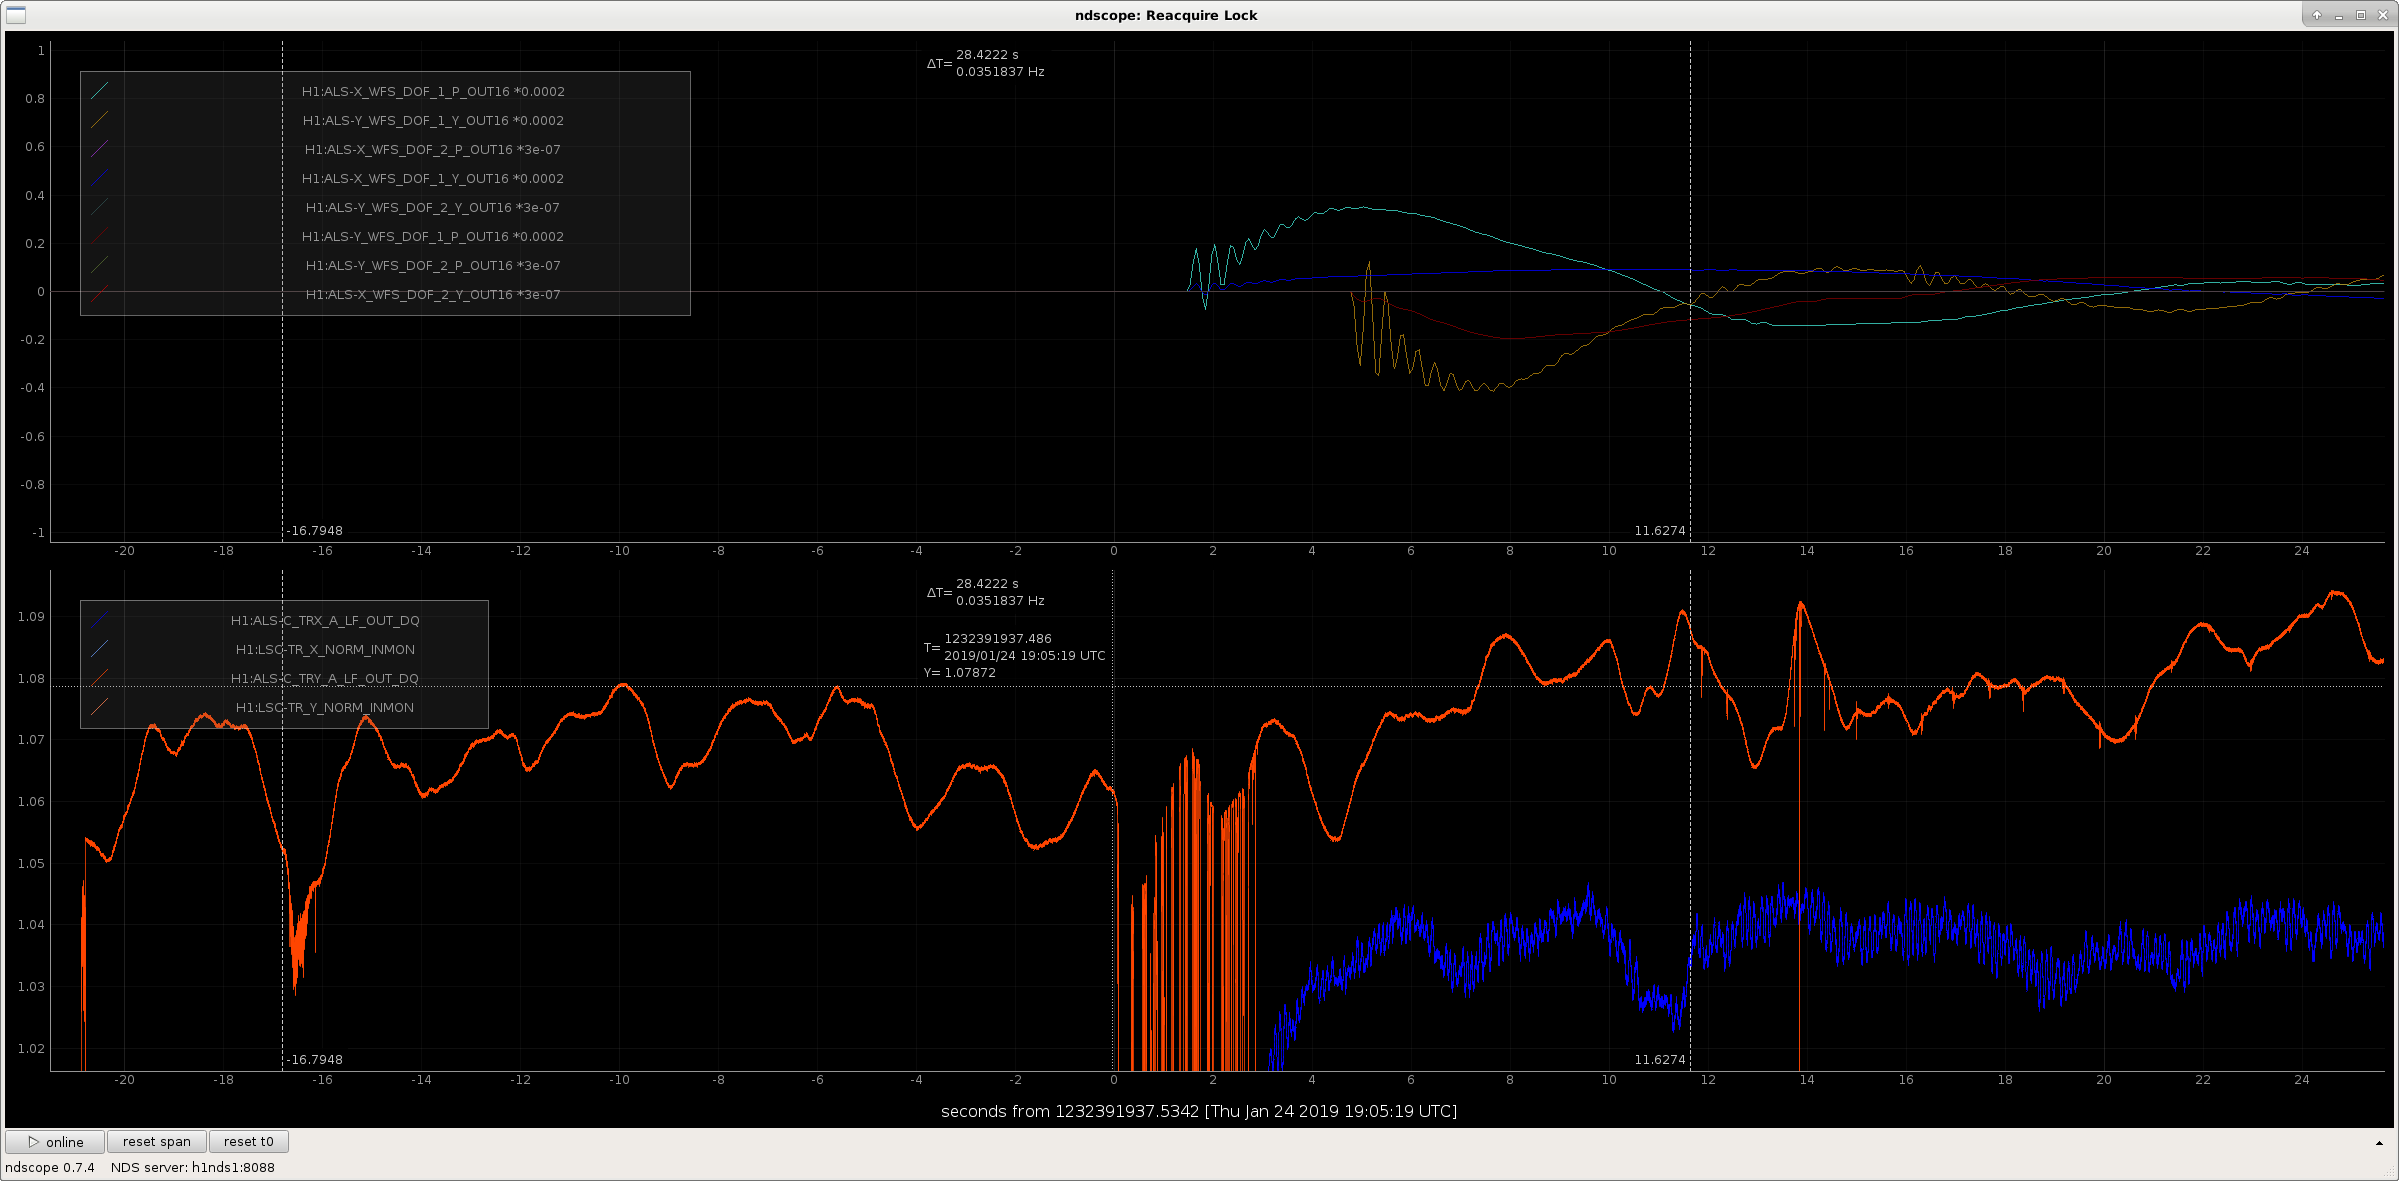
After pictured recently by Keita (LHO:46607), Richard and Fil drive down to similar spots along the exposed Y-arm communication fiber bundle -- which includes the PSL to ALS laser optical fiber connection -- and tapped on it while we happened to be locked on ALS.

The attached screenshot shows a time series of (among other things) the Y ARM power transmission in green laser power [Brightest Orange Trace], usually the canary in the coal mine when we're having "ALS glitches" and "it's raining." A T=16 sec are the beginnings of taps. At T=0 sec are the most invasive taps. At T=+11 sec there is more tapping. The times are all around 2019/01/24 19:05 UTC. These taps, and corresponding response of the Y arm transmitted power are representative of the range of impact that we've seen that impacts locking of ALS, which has cost us many an evening of frustration. 

This is likely the source of *some* (if not all) problems with ALS glitches, and was associated with rain (presumably the wind / rain would cause the same level of tapping Richard and Fil were inducing).

This issue is related to the following FRS Tickets: FRS:11113, FRS:12209

Previous reports of ALS Y vs. Rain: LHO:46554, LHO:46302, LHO:45924, LHO:45891
Images attached to this report
Comments related to this report
sheila.dwyer@LIGO.ORG - 15:28, Friday 25 January 2019 (46646)

Just looking at the time series that Jeff plots, these don't look convincingly similar to the glitches which we have when no-one is tapping the fiber. 

For some examples, see plots attached to 17576 22184 25523 36602  laser safety tag problem: 36645

Kara Merfeild is working on some code to try to look for corelation between glitches and weather.  

Another step that we could take is to make a script or some other easy way to do the test where we lock the green laser to the arm bypassing the PLL (making sure that we have a reasonable loop), so that next time we have a rainy day we can easily switch the configuration to test if the glitches go away when the fiber is not involved.  Setting this up would be a good Tuesday morning activity.  
H1 ISC (Lockloss)
jonathan.richardson@LIGO.ORG - posted 14:48, Friday 25 January 2019 - last comment - 17:51, Thursday 31 January 2019(46642)
Is dynamic range of ETMX ESD a source of glitching?

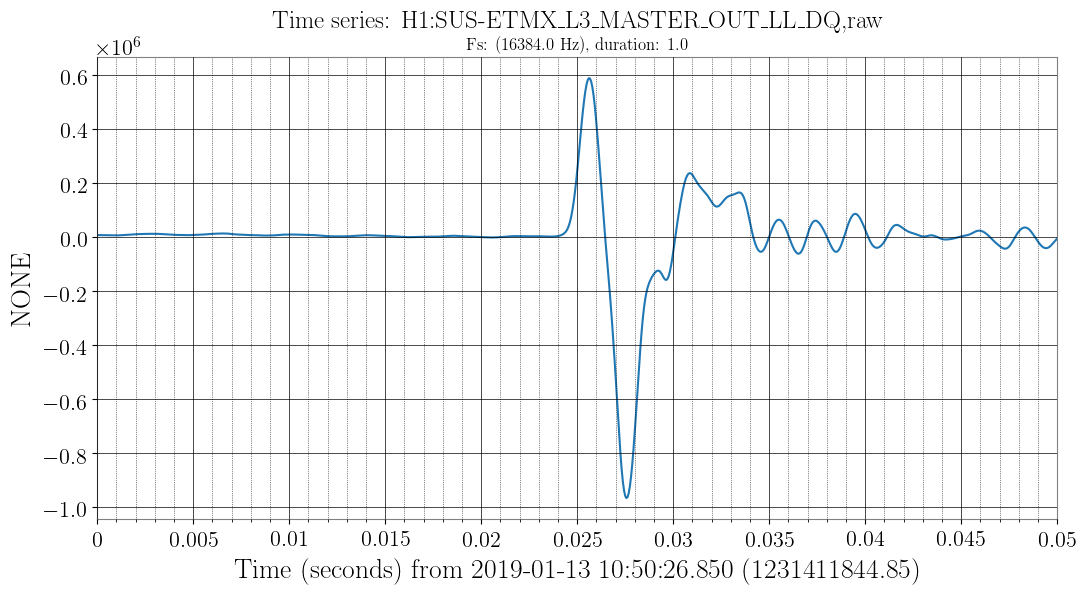
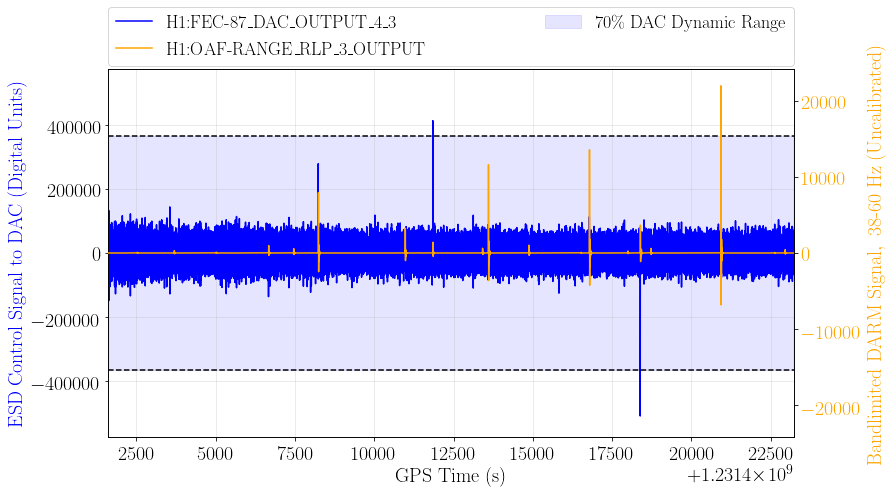
I've examined the time series of the control signal to the ETMX ESD, which is being used alone to control the DARM degree of freedom. There is some evidence the dynamic range might be too small. Every time the ESD control signal nears the end of its dynamic range (+/-2^19), an IFO glitch occurs, but the ESD signal does not rail every time a glitch occurs. This would suggest that an insufficient ESD actuation range is, at worst, one of several causes of glitching. It's worth investigating further.

I've written a code for scanning past actuator-channel data and identifying saturation events. It generates an ASCII catalog containing the timestamp and value of every saturation occurring within a specified time range. It filters data based on Guardian state to only include data taken during "low noise" operation.

https://git.ligo.org/jonathan.richardson/dac_saturation_scanner

The figure below was generated using this code for a 6-hour lock on Jan. 13.

Images attached to this report
Comments related to this report
andrew.lundgren@LIGO.ORG - 08:25, Monday 28 January 2019 (46668)DetChar
If the overflow caused the glitch, we'd expect the drive value to already be somewhere near 2^19, and for the glitch to happen when it accidentally goes past the overflow value. Instead, the DAC value is generally between +/- 100K. Then during the glitch it has a fast excursion to above 500K in a millisecond.

To look at one of the events, you can grab the times of overflows from the summary pages, e.g. this link. FEC 88 3_4 is one of the ETMX ESD quadrants. The attached plot is a zoom in of the drive signal. At least in this case, it's much more likely that there's a short loud glitch that causes the feedback to overflow, rather than the other way around. This was also the case with overflows that we investigated with the 18-bit DAC on the ESD.

One cause of glitches that worries me is something above the Nyquist sampling rate of this channel, like PI damping. I don't know how RMS that has, or what it would look like if that caused an overflow.
Images attached to this comment
john.zweizig@LIGO.ORG - 17:51, Thursday 31 January 2019 (46732)DetChar

Note that when the DAC was changed from 18-bits to 20-bits a x4 gain stage was added to a filter bank (see alog) apparently to avoid changing all the other constants. I haven't traced out the model, but this would suggest that the saturation would be at 2^17 as before rather than 2^19. There is still a discrepancy between the apparent glitching at ~1.0 rather than ~1.3 but it is much more consistent with a saturation and may be related to the reduction in maximum range discussed elsewhere.

H1 CDS (CDS)
keita.kawabe@LIGO.ORG - posted 12:02, Friday 25 January 2019 - last comment - 14:35, Friday 25 January 2019(46641)
Acausal EPICS timestamp for HAM6 fast shutter

In the attached, top two traces  are EPICS of the HAM6 fast shutter readback (top is the state of the shutter, next one is the trigger voltage, threshold is set to 2V). According to these, the shutter was triggered between -0.2 and -0.13 second.

If you look at the bottom two traces (ISI sensors to listen to the banging of the toaster and OMC PZT voltage readback), the actual triggering time was at around 0 second.

Images attached to this report
Comments related to this report
sheila.dwyer@LIGO.ORG - 14:35, Friday 25 January 2019 (46643)

The top two are beckhoff channels, the bottom ones are from the RGC.  We have seen the timing between the two systems be off by large fractions of a second. 

H1 CAL (CAL)
alexander.urban@LIGO.ORG - posted 11:44, Friday 25 January 2019 (46640)
New spectral comparison plot on the summary pages

I've pushed a change to the DetChar summary pages that adds a spectral comparison of the following intermediate data products from calibration:

An example is available here with the plot attached below; this should be up on the summary pages within an hour.

Images attached to this report
H1 ISC
jenne.driggers@LIGO.ORG - posted 10:38, Friday 25 January 2019 (46636)
Locking Notes
Images attached to this report
LHO General
thomas.shaffer@LIGO.ORG - posted 08:00, Friday 25 January 2019 (46637)
Ops Day Shift Transition

TITLE: 01/25 Day Shift: 16:00-00:00 UTC (08:00-16:00 PST), all times posted in UTC
STATE of H1: Commissioning
OUTGOING OPERATOR: None
CURRENT ENVIRONMENT:
    Wind: 7mph Gusts, 5mph 5min avg
    Primary useism: 0.02 μm/s
    Secondary useism: 0.24 μm/s
QUICK SUMMARY: Locked at 30W with Jenne hard at work.

H1 ISC (ISC)
craig.cahillane@LIGO.ORG - posted 04:06, Friday 25 January 2019 - last comment - 01:21, Saturday 26 January 2019(46635)
PSL Rack CARM signal chasing
Koji, Georgia, Craig

This evening we ran several tests of the electronics handling the CARM signal around the PSL racks.

----------------------------------------------
Analog to Digital REFL Calibrations
----------------------------------------------

We looked at a bunch of peak values while injecting a 9.101 MHz sine wave into the demod boards.

Our biggest confusion was probably the factor of 500 response difference of the REFL A and B 9 demod boards to the same input signal.
We unplugged and terminated the signal coming from the photodiodes, and set the Agilent to give a 9.101 MHz, -20 dBm signal into RF In on each demod board.  Then we read out the signal seen on REFL {A,B} {I,Q} MON demod board analog outputs, as well as the digital channels.  Peaks read out with flattop windows power spectra, not PSDs.

Channel                          Response
----------------------------------------------
H1:LSC-REFL_SERVO_ERR_OUT_DQ     1.59e-3 cts
H1:LSC-REFL_A_RF9_I_ERR          4.38e-1 cts
REFL A 9 I analog monitor        346.7 μVrms

Moved injection to REFL B RF In:

H1:LSC-REFL_B_RF9_I_ERR          1.17e-1 cts
REFL B 9 I analog monitor        120.0 mVrms

Moved injection to REFL A RF In again:

REFL A 9 I analog monitor        340.3 μVrms
REFL A 9 Q analog monitor        342.1 μVrms

Moved injection to REFL B RF In again:

REFL A 9 I analog monitor        120 mVrms
REFL A 9 Q analog monitor        120 mVrms


Demod boards are DCC D1000181, Serial numbers are S1000772 for REFL A, S1000771 for REFL B.

We also note the frequency response ratio of CARM OUT2/REFL A 9 I analog monitor = 13.1 dB, while the Sum Node A Input 2 gain = 8 dB and CMB IN1 gain = 6 dB.  Not bad.

----------------------------------------------
CARM Circuit Voltage Noise
----------------------------------------------

Basic CARM Path
9 MHz Beatnote ---------> REFL A PD ---------> REFL A 9 Demod Board ---------> Sum Node ---------> Common Mode Board (CMB) ---------> IMC Board ---------> IMC VCO


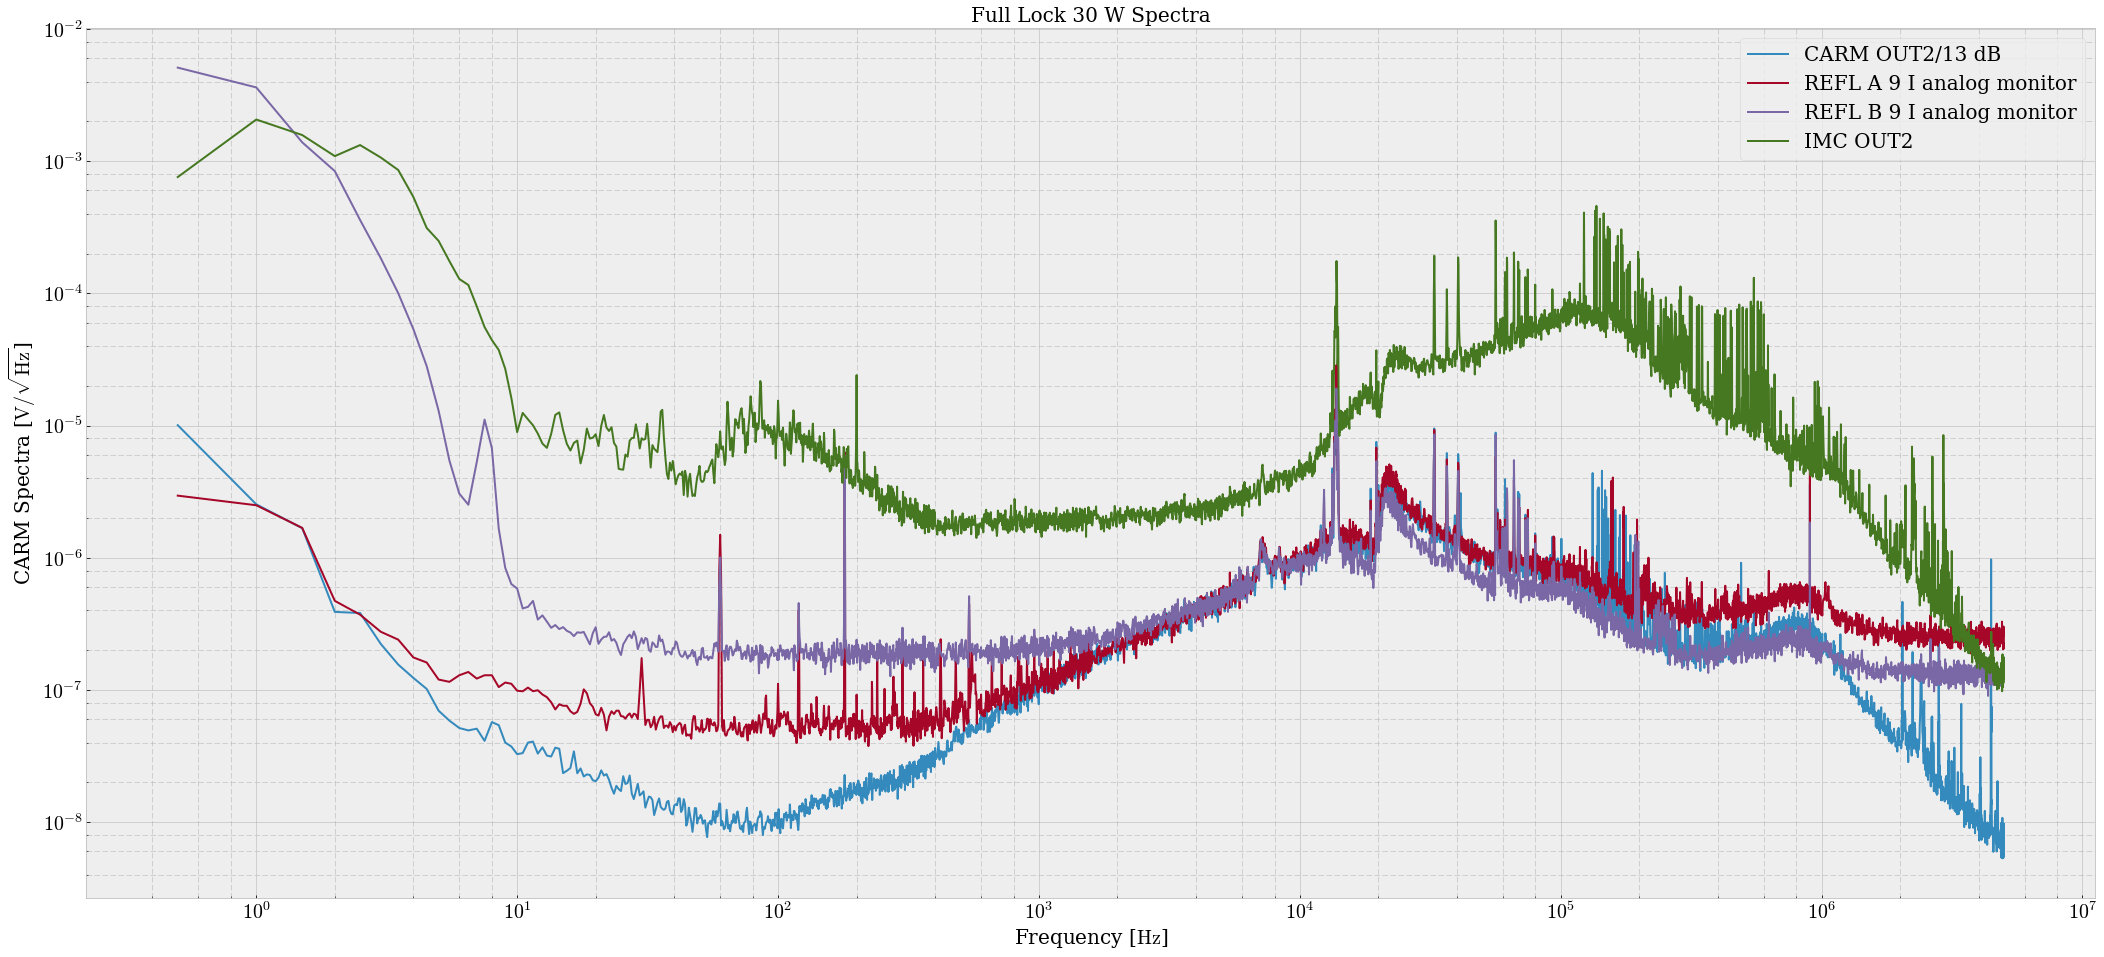
We measured the intrinsic electronics noise of the REFL A demod board, Sum Node, and first part of the Common Mode Board.  Sum Node A Input 2 gain = 8 dB, CMB IN1 gain = 6 dB.  We preamplied the circuit signal by 100 with an SR560 to avoid the SR785 noise floor.  We took four sets of spectra:
1) Demod RF In 50 Ω terminated, CMB OUT2 measured
2) Sum Node A Input2 50 Ω terminated, CMB OUT2 measured
3) CMB Input1 50 Ω terminated, CMB OUT2 measured
4) Demod RF In 50 Ω terminated, REFL A 9 I analog monitor measured

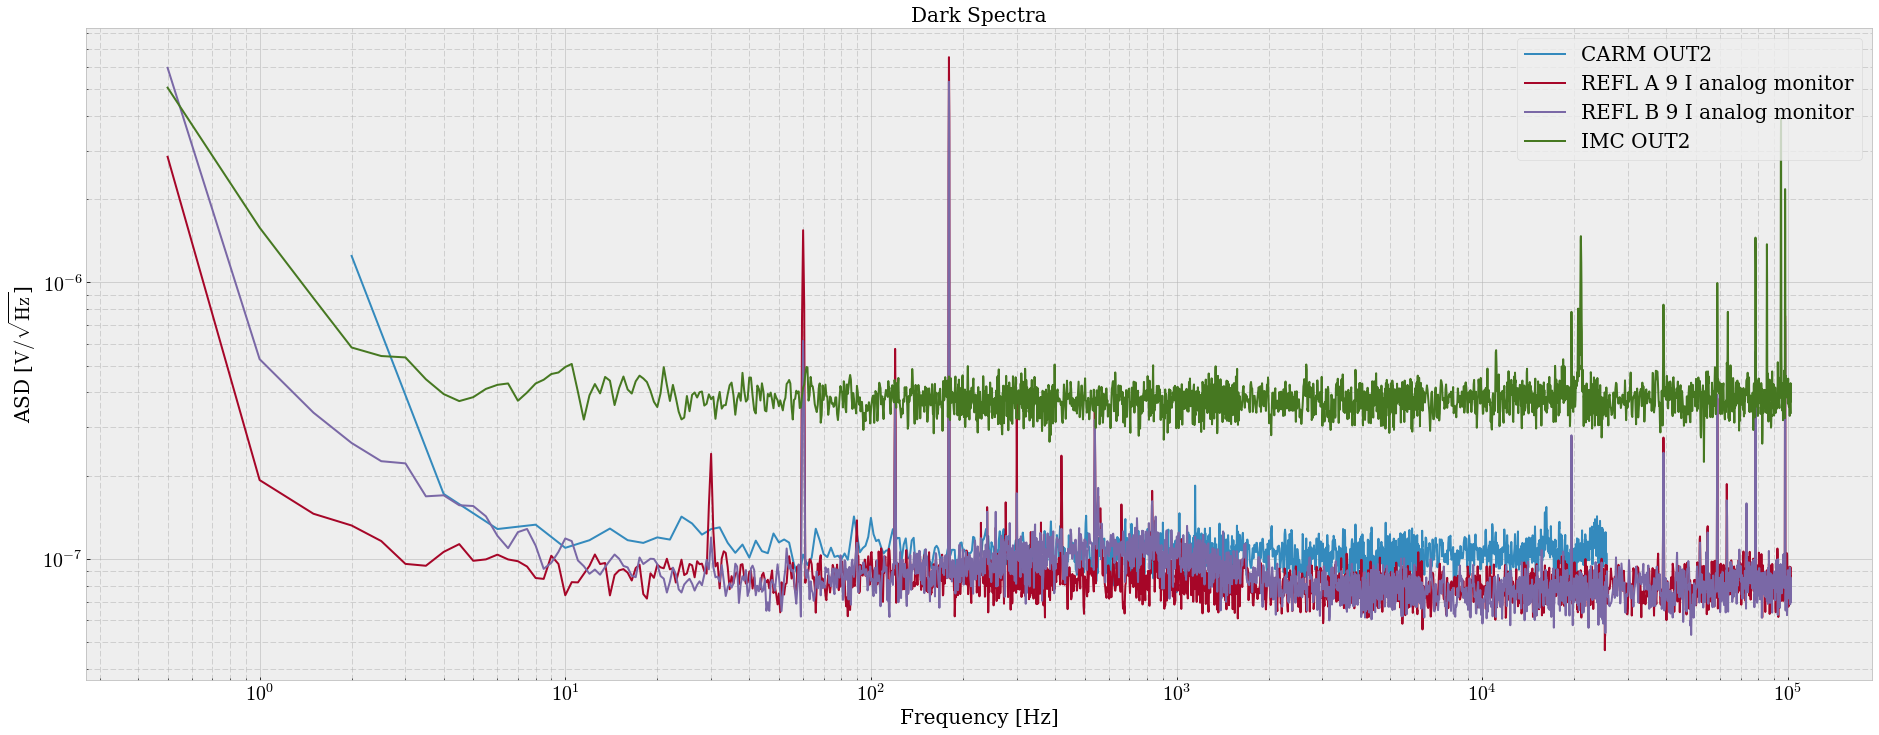
The (scaled to remove the SR560 gain) results of these measurements are shown in attachment one.  It appears that the worst circuit noise originates in the Sum Node.  
The big hump in the dark orange spectrum is probably a random RF line wandering through DC during our measurement, it is not present in the other measurements at low frequency.

During these measurements with OUT2, we noticed an mysterious peak wandering around at 60-80 kHz.  Georgia was able to toggle the frequency of the line with the Sum Node B Input1 being turned on and off, even though IN2 on the CMB was NOT connected.

----------------------------------------------

What does any of this mean for the CARM path?  The question came up when I measured REFL A 9 IMON and CARM OUT2 paths, and found that CARM OUT2 had lower noise than REFL A 9 IMON would have predicted. (red and blue in attachment two)
All it likely means is there is some additional sensing noise in the CARM path that we are just now understanding.  
Also somehow the responses of REFL A and B analog monitors are vastly different to the same input.
Images attached to this report
Non-image files attached to this report
Comments related to this report
craig.cahillane@LIGO.ORG - 21:22, Friday 25 January 2019 (46649)ISC
After some conversation with Daniel and more thinking, things seem bad for the REFL A demod board signal.

We put in -20 dBm (22.4 mV) into RF In, and got back 346.7 μV from REFL A 9 I and Q, and 120 mV from REFL B I and Q.  
Barring some measurement mistake, the signal gain for the REFL A demod board is 0.0155.  For the REFL B demod board it is 5.36, much closer to spec.  The analog response ratio REFL B / REFL A ≈ 350.

This is strictly a signal attenuation, the dark and shot noise of the signal chain is the same for both PDs.

The LO monitors report the same input for both boxes.  Same for the RF monitors.

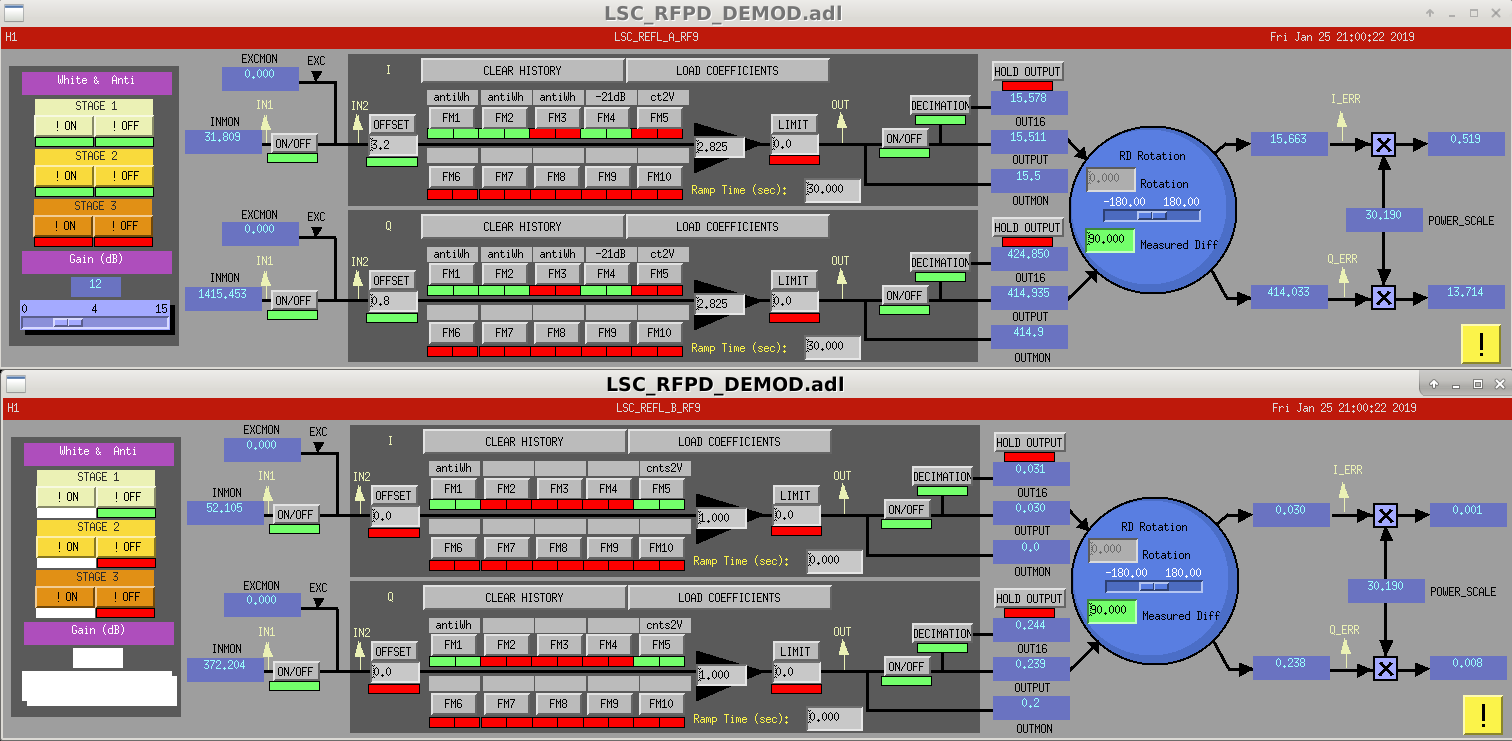
The digital readbacks of H1:LSC-REFL_A_RF9_I_ERR and H1:LSC-REFL_B_RF9_I_ERR are also consistent with low REFL A signal response.  I reported 0.438 counts peak response in REFL A, and 0.117 counts for REFL B, but when looking at the calibrations we see that REFL A FM5 [ct2V] is not applied, while it is for REFL B.  Assuming whitening is accounted for correctly, this is about a factor of 2^14/10 = 1638.4 cts/V difference, meaning the true REFL B / REFL A digital readback ratio is around 440.

The demod circuit is relatively simple: DCC D0902745.  If both analog and digital readbacks yield a low signal response the error in the board comes before the differential amplifier.  We also see the reduced signal response in both I and Q channels for REFL A, indicating the error is probably before the PE4-140s.  And if the RF and LO monitors report the same inputs for both boxes, the error is after the RF directional couplers.  This means the most likely candidate for the signal attenuation is the transformers (TC4-1Ts), or somehow one of the directional couplers is not supplying what it claims to supply.
Images attached to this comment
craig.cahillane@LIGO.ORG - 01:21, Saturday 26 January 2019 (46652)
Went out there to repeat the demod board ratio measurement for REFL A because if any of the above were actually true, locking would be impossible, and our dark/shot noise measurements would have to be different between REFL A and B.

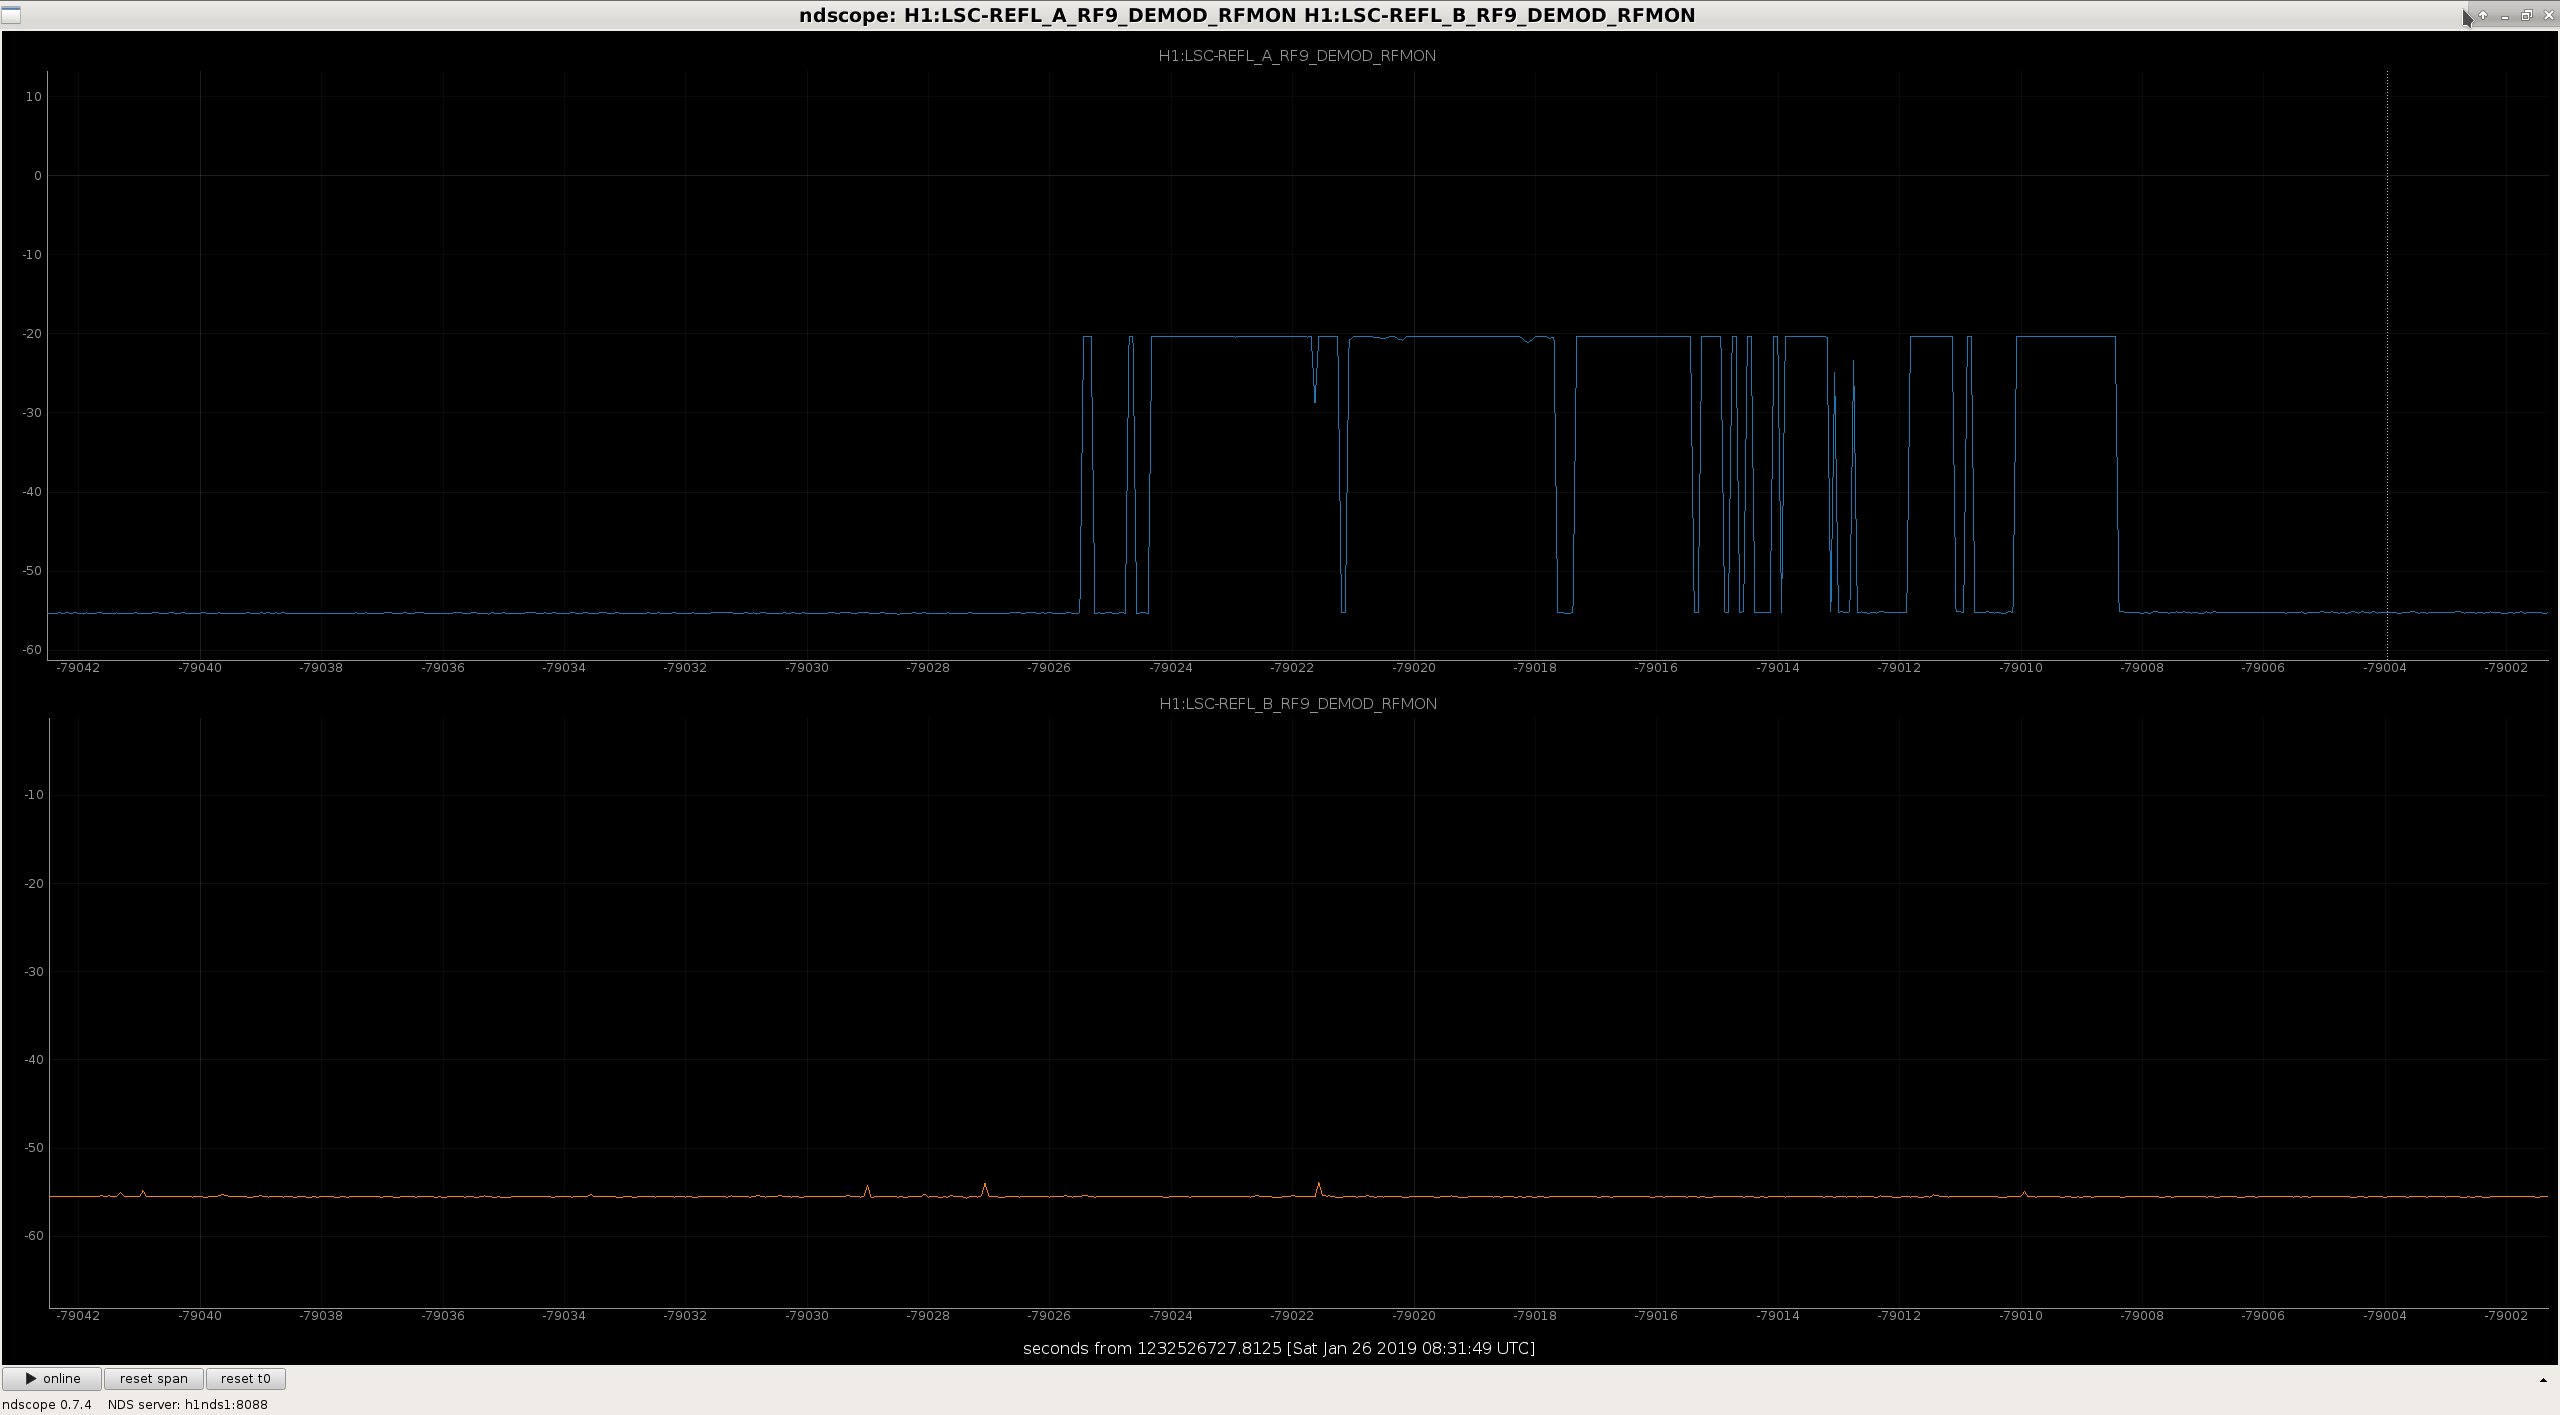
Turns out the Agilent RF source was not making a great connection when plugged into RF In.  In attachment one, the blue RFMON shows the connection was spontaneously dropping while the measurement was happening.  The cable must have been broken, since the measurement was repeatable.

This time I used a Marconi with 9.101 MHz and -20 dBm and exchanged the cable, and got a reasonable result:

Channel                                Response
-----------------------------------------------
REFL A 9 I analog monitor           117.6 mVrms
REFL A 9 Q analog monitor           118.2 mVrms
H1:LSC-REFL_A_RF9_I_ERR              48.4 cts  

REFL B 9 I analog monitor           117.6 mVrms
REFL B 9 Q analog monitor           118.3 mVrms
H1:LSC-REFL_B_RF9_I_ERR               0.115 cts  


The demod gain for both boards is 5.25.
Images attached to this comment
H1 CAL (ISC)
jeffrey.kissel@LIGO.ORG - posted 19:19, Thursday 24 January 2019 (46633)
2019-01-18 DARM Open Loop Gain Model vs. Measurement
J. Kissel

I've used the results from recent ETMX actuation function measurements (LHO:46605) and Sensing Function measurements (LHO:46632) to build a parameter set for the current (well, at least the 2019-01-18, last week Friday) interferometer's DARM loop:
    /ligo/svncommon/CalSVN/aligocalibration/trunk/Runs/O3/H1/params/modelparams_H1_20190118.py

The attached plot shows the result of comparing this loop model against the 2019-01-18 measurement. One can see a frequency-dependent ~5% wiggle in magnitude, and a phase discrepancy increasing with frequency up to 10 deg by 1 kHz. 

Comments and (educated) guesses as to what's going on:
    - 10-40 Hz Magnitude: We don't have the actuation gains just right and/or the frequency-dependent ripples are a result of the similar ripples in the PUM and TST stages of the actuator measurements. As mentioned in LHO:46605, 
"" We have not measured, and thus not well-compensated, any stage of SUS ETMX's driver electronics. We're still using the "off-the-shelf," "same compensation for each quadrant" compensation. ""
    Once we clean up these known systematic errors in the actuator (I'm schedule to take over EX next-week-Tuesday to gather the neccessary measurements), then we should be able to better estimate the gain of these two stages and I suspect we'll reduce the residuals in this frequency band.
    - 330 Hz Magnitude: We still have a massive notch in the DARM loop around 300 Hz for (a) the calibration line frequency, and (b) the beam splitter violin modes. It's not really important that we get this particular frequency right.
    - >500 Hz Magnitude and Phase: It's not clear to be yet what's going on here. At these frequencies, it's either the DARM loop filter or the Sensing Function accuracy, and the sensing function is accurately measured and fit to within 1% and 1 deg. Further, the high frequency data from the PCAL 2 DELTAL sweep (left panels of second attachment from LHO:46632 indicates that there's nothing wrong with the sensing function from 2018-12-05 (the post-ER13, 20W, split actuator model, as long as it's scaled to match the optical gain). I've, of course, checked that I've recreated the DARM loop filters correctly, but I can't find any issue as of yet. 

As mentioned in the aLOG documenting the processing of the sensing function, and in addition to cleaning up the actuator, I'd really like to get a open loop gain TF with more densely populated frequency points to help understand what's going on at low frequencies. Hopefully the high frequency issue is just a bug in the analysis script somewhere, and I can clean that up once I sleep on it over night.
Non-image files attached to this report
H1 CAL (CAL, ISC)
jeffrey.kissel@LIGO.ORG - posted 18:32, Thursday 24 January 2019 - last comment - 19:31, Thursday 24 January 2019(46632)
2019-01-18 Sensing Function Measurement Processed -- Sensing Function Parameter Values for IFO at 30W Input Power
J. Kissel

Using data taken by Sheila last week Friday (LHO:46537), I've fit that day's sensing function (for a 30W IFO, with all actuation on ETMX) and now have new values for its parameters. As always, there are a caveats. Details below. 

Var.  Units    Value      Abs. Unc.             Rel. Unc.              Description
------------------------------------------------------------------------------------
H_c   (ct/m)   3.046e+06  (+1421,-1420)         (+0.04665%,-0.04661%)  Optical gain,            
H_c   (mA/pm)  3.77       (+0.001759,-0.001757) (+0.04665%,-0.04661%)  Optical gain,            

f_cc  (Hz)     424.9      (+1.042,-1.05)        (+0.2453%,-0.247%)     Cavity pole,             

f_s   (Hz)     0.2573     (+0.261,-0.1148)      (+101.5%,-44.63%)      Detuned SRC spring frequency
Q_s   (  )     0.4263     (+0.3431,-0.2164)     (+80.48%,-50.77%)      Detuned SRC spring quality factor   

tau_c (usec)   3.299      (+0.5827,-0.5765)     (+17.66%,-17.47%)      Residual time delay

The four attached plots support this information:
pg 1: the MCMC fit compared against the data
pg 2: the same plot, but with me copying the MCMC fit results into the 20180118 parameter file, and thus showing the model against the data (essentially just proving that I can copy-and-paste with good fidelity)
pg 3: the guassian process regression of the residual between model and measurement which would quantify any unmodeled systematic error (there are none -- the residuals are consistent with unity magnitude and zero phase)
pg 4: a corner plot of the MCMC fit showing the covariance of the parameters

Several comments:
(1) The fit detuned optical spring is completely bogus. I don't believe it! The fit is essentially saying there's no SRC detuning, which H1 has never seen. What has happened: In order to minimize time with the IFO, I created a set of measurement templates with a frequency vector that was sparse at low frequencies. Thus, there are only 2 data points below ~15 Hz, and they're of high uncertainty -- resulting in a poorly informed fit for this 5-10 Hz, low frequency feature. I'll change this for the next round of templates.

(2) The optical gain is reported in both (DARM IN1) / (DARM DELTAL), [ct/m], as well as (OMC DCPD Current) / (DARM DELTA L), [mA/pm] ("milliAmperes per picometer"). The latter is merely the former divided by the transfer function value between OMC_DCPD_SUM_OUT_DQ and LSC-DARM_IN1_DQ at 5 Hz, at the time of the PCAL sweep. That value is 1.23781e6 [mA/ct] (and then the meters are converted to picometers). However, the calibration of the OMC DCPDs into [mA] is NOT an accurate, rigorously verified calibration, and thus neither is the [mA/pm] number, so be wary of making any precise statements when using this number. I suspect it's good to the 10-20% level.

Other than this -- I'm pretty happy with the accuracy of the model -- roughly 1% in magnitude, and 1-ish degrees in phase. Nice! 

I'm actually a little surprised by this because we haven't updated any of the uncompensated OMC DCPD whitening chassis poles after modifying the the whitening stage (Jun 2018, LHO:42361); we're still using the average frequencies of the two DCPD paths from LHO:28087 -- 14.47 kHz, 18.625 kHz and 99.695 kHz. Maybe these poles come from a part of the chassis that wasn't modified. We know that the transimpedance amplifiers' poles at 13.7 and 17.8 kHz have not changed since O2, so these need not change. And I guess if the model matches the data, who am I to argue!

Using these results -- If we *must* update the sensing path immediately, one can install the following foton string in the H1:CAL-CS_DARM_ERR bank (please do it in a different filter bank, don't over-write what's in the "O3_D2N" and "O3Gain" filters that are in use).
   D2N filter (SRCD2N): zpk([424.8532;0.2094;-0.3190],[0.1;0.1;7000],1,"n")gain(6.68)
           Gain filter: gain(3.283e-07)
(and needless to say, one should make the EPICs gain of the filter 1.0).

I would prefer to have a complete DARM loop model that matches the total DARM open loop gain transfer function before launching forth with the install. 
SPOILER ALERT -- I've already made the plot, and model doesn't match the data in a frequency-dependent ~5% wiggle in magnitude, and a phase discrepancy increasing with frequency up to 10 deg by 1 kHz. More details in a subsequent aLOG.
Non-image files attached to this report
Comments related to this report
jeffrey.kissel@LIGO.ORG - 19:31, Thursday 24 January 2019 (46634)
Measurement Data processed:
/ligo/svncommon/CalSVN/aligocalibration/trunk/Runs/O3/H1/Measurements/FullIFOSensingTFs/
    DARM loop suppression (1 / 1+G): 
        2019-01-18_H1DARM_OLGTF_5to1100Hz_14min.xml
        2019-01-18_H1_DARM_OLGTF_A_DARMIN2_B_DARMEXC_coh.txt
        2019-01-18_H1_DARM_OLGTF_A_DARMIN2_B_DARMEXC_tf.txt
    PCAL to DARM TF (C / 1+G):
        2019-01-18_H1_PCAL2DARM_TF_5t1100Hz_3min.xml
        2019-01-18_H1_PCAL2DARMTF_A_PCALYRX_B_DARMIN1_coh.txt
        2019-01-18_H1_PCAL2DARMTF_A_PCALYRX_B_DARMIN1_tf.txt
    DARM to OMC DCPD SUM OUT:
        2019-01-18_H1_OMCDCPDSUM_to_DARMIN1.xml

Processing script:
/ligo/svncommon/CalSVN/aligocalibration/trunk/Runs/O3/H1/Scripts/FullIFOSensingTFs/
    process_sensingmeas_20190118.py

Model: 
/ligo/svncommon/CalSVN/aligocalibration/trunk/Common/pyDARM/src/
    sensing.py
    Last Changed Rev: 6326
    Last Changed Date: 2019-01-23 19:53:08 -0800 (Wed, 23 Jan 2019)

    computeDARM.py
    Last Changed Rev: 6285
    Last Changed Date: 2019-01-22 15:20:54 -0800 (Tue, 22 Jan 2019)

Results:
/ligo/svncommon/CalSVN/aligocalibration/trunk/Runs/O3/H1/Results/FullIFOSensingTFs/
    2019-01-18_H1_sensingFunction.pdf
    merged from
        2019-01-18_H1_sensingFunction_mcmcModel_vs_measurement.pdf
        2019-01-18_H1_sensingFunction_referenceModel_vs_allMeasurements.pdf
        2019-01-18_H1_sensingFunction_GPR_on_singleSensingMeasurement.pdf
        2019-01-18_H1_sensingFunction_mcmcModel_paramCornerPlot.pdf

All of the above has been committed to the repo.
H1 SQZ (SQZ)
nutsinee.kijbunchoo@LIGO.ORG - posted 17:37, Thursday 24 January 2019 - last comment - 11:26, Friday 01 February 2019(46630)
Begin swapping SQZ locking scheme

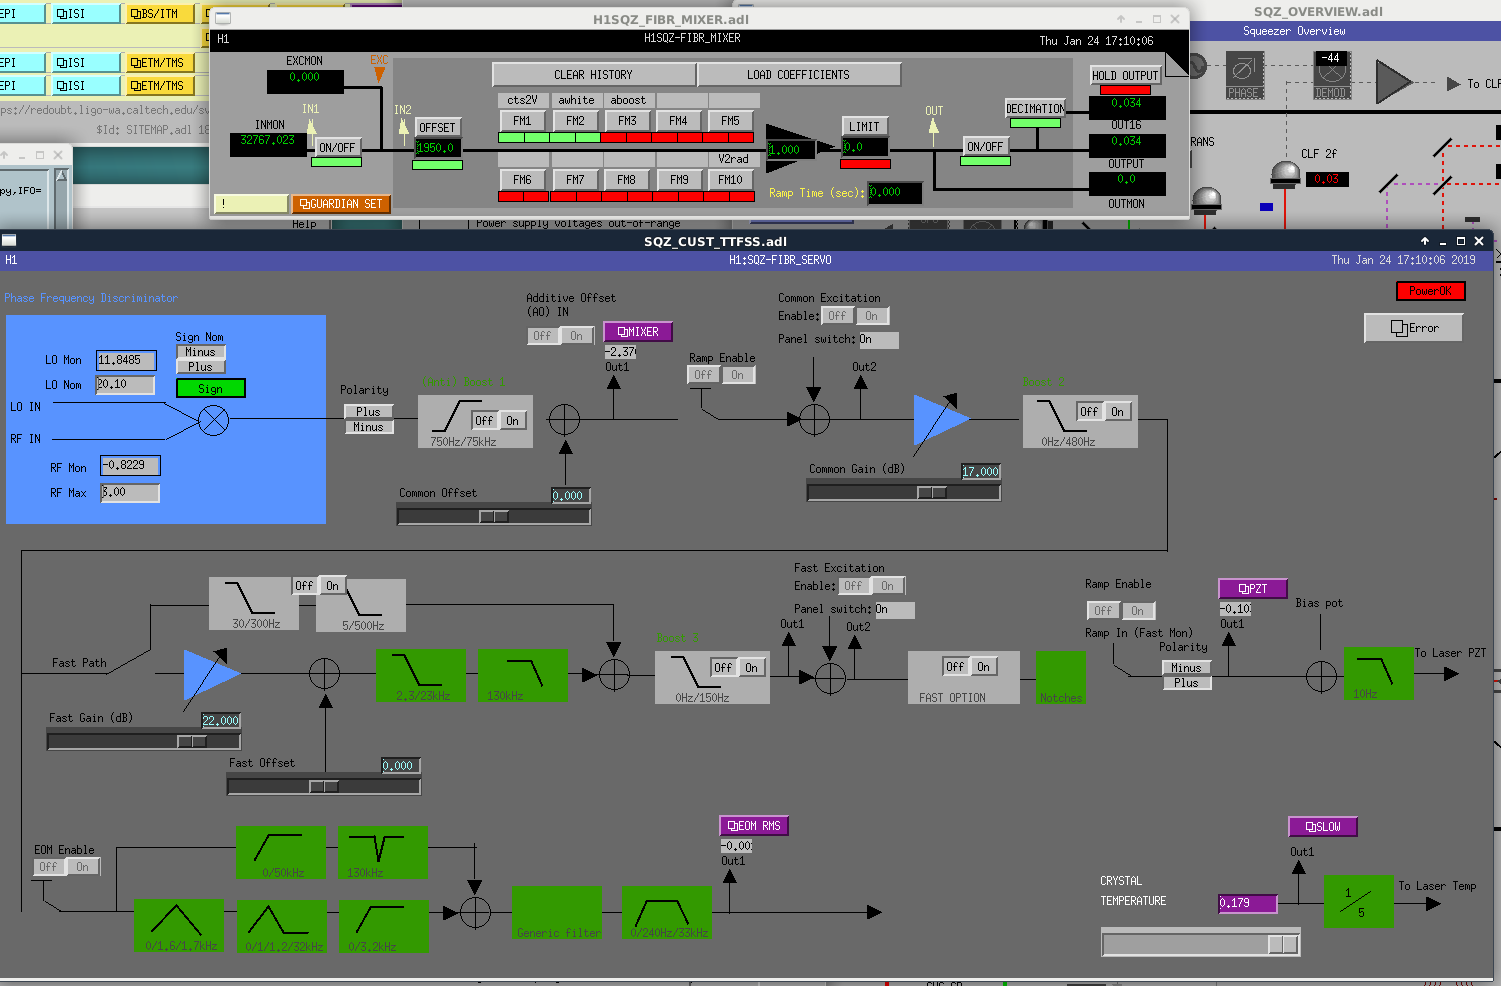
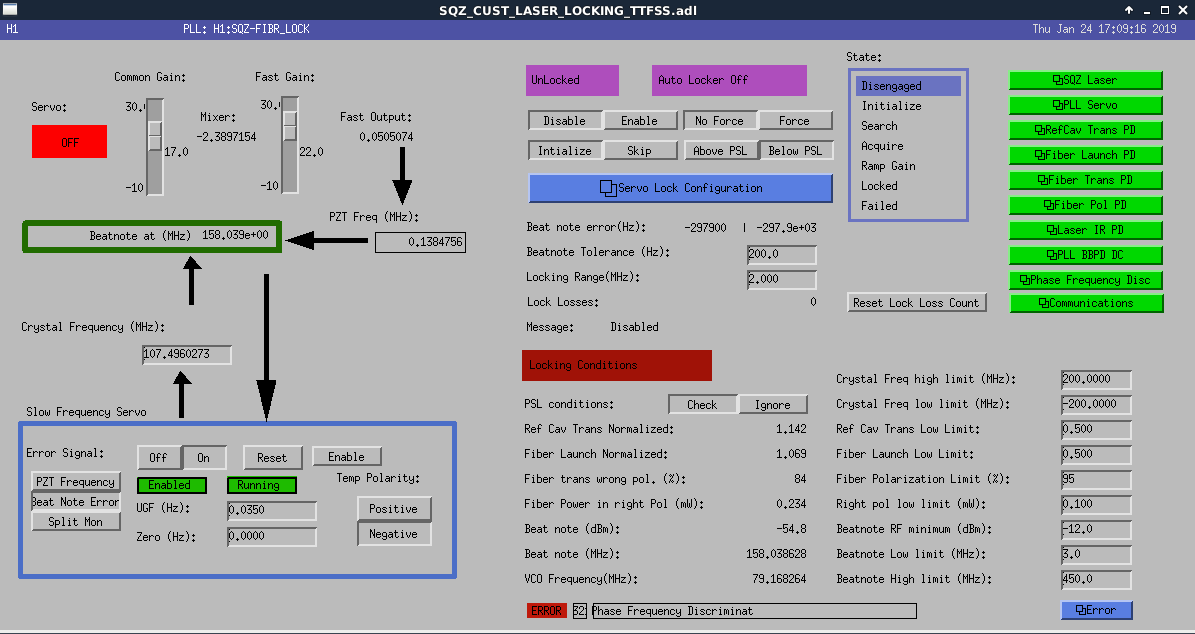
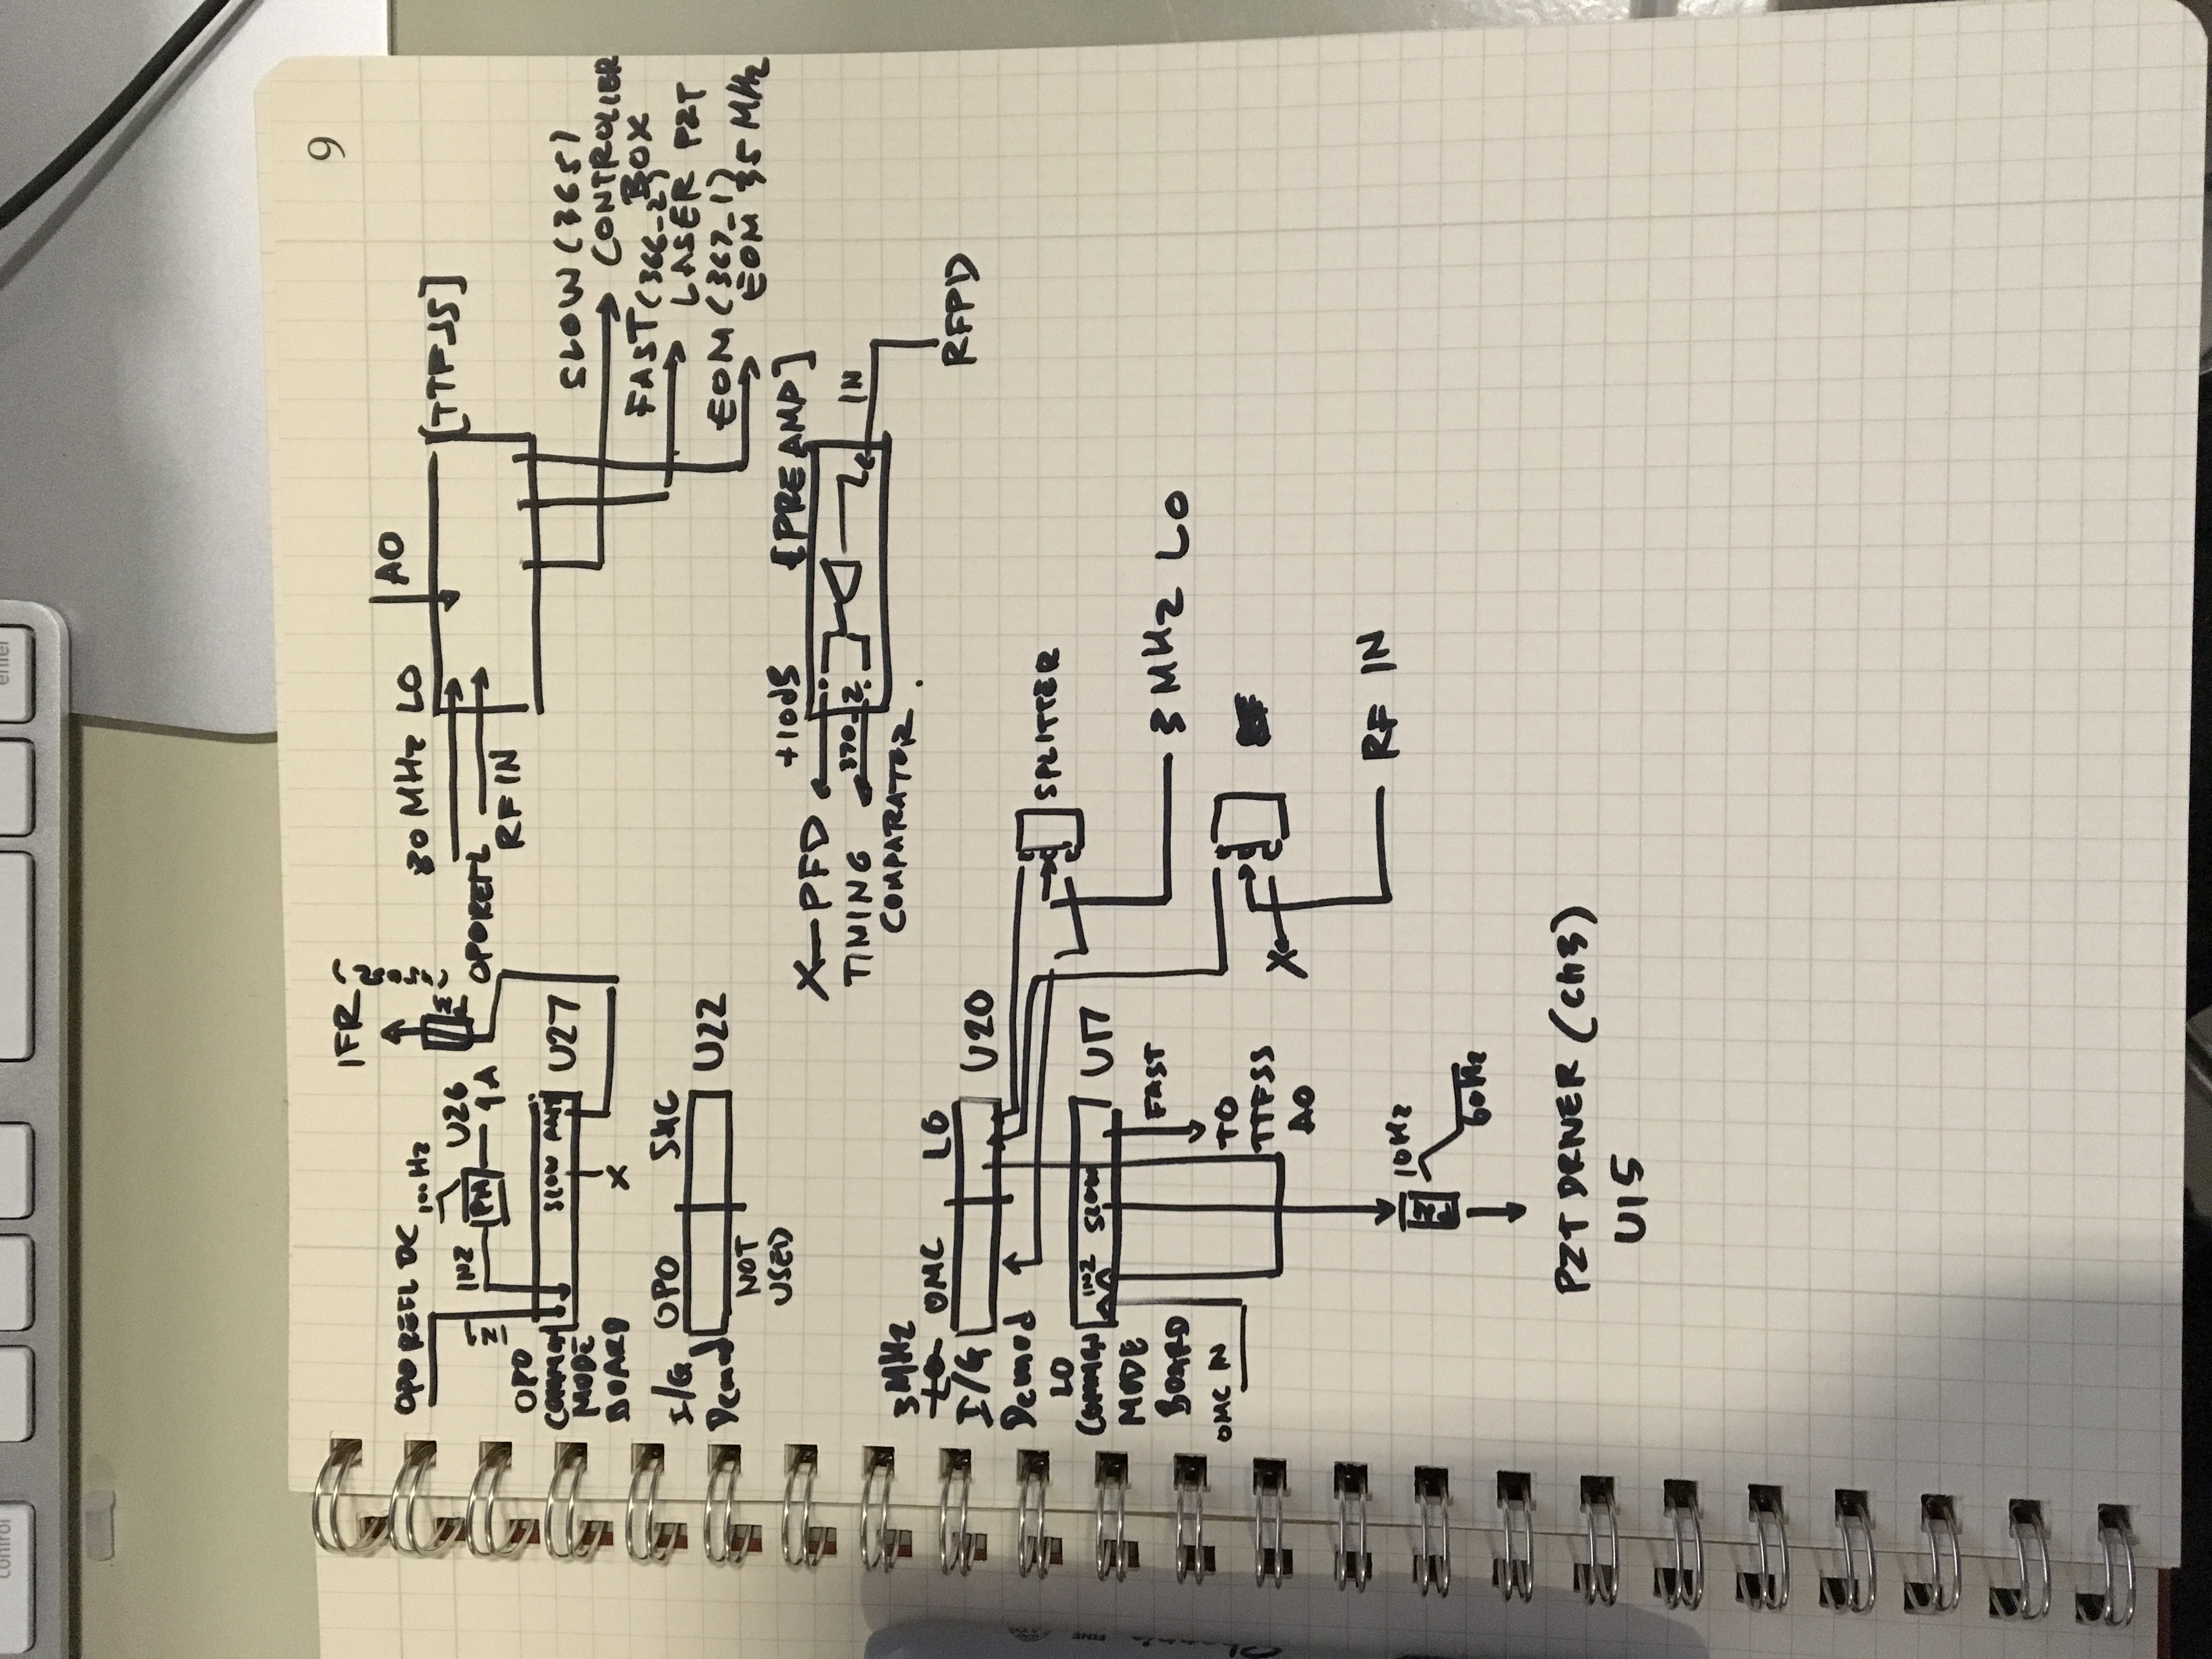
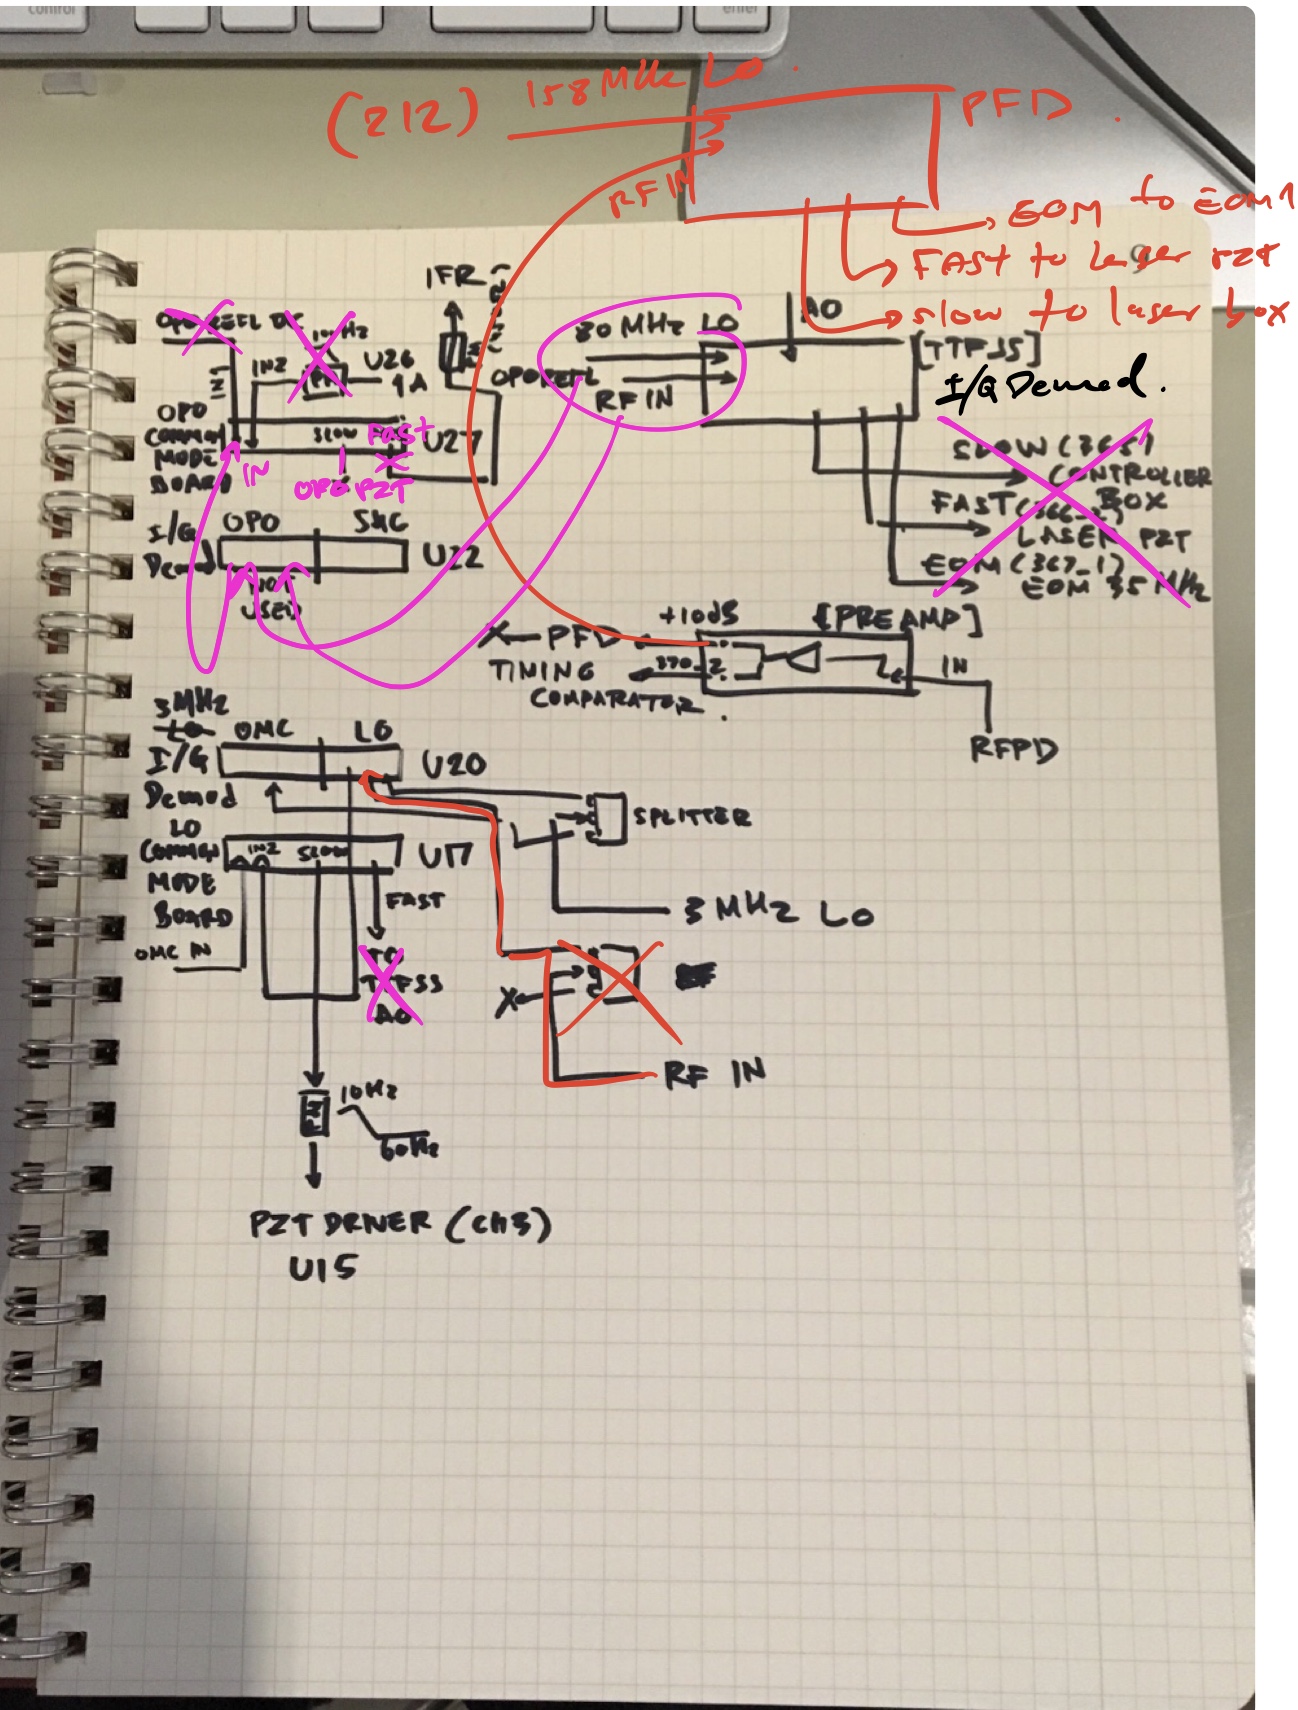
Slow output to the laser is now coming from the PFD TTFSS. That part seems to be working fine. I can't seems to stop the error signal from saturating. I stacked 20+10 dB attenuator at the RF input but no luck. RF mon is showing the 158MHz beat note at -22dBm on the RF spectral analyzer. The power okay icon shows read and the beat note strength read back is wrong. 


Also attached drawings of what we had and what's supposed to happened next (with doodles on it).

Images attached to this report
Comments related to this report
daniel.sigg@LIGO.ORG - 10:21, Friday 25 January 2019 (46638)

HV was off.

terry.mcrae@LIGO.ORG - 11:26, Friday 01 February 2019 (46746)

Note in drawing 2 the output "PZT Driver (Ch3) U15" should also be crossed out.

LHO General
thomas.shaffer@LIGO.ORG - posted 16:00, Thursday 24 January 2019 (46629)
Ops Day Shift Summary

TITLE: 01/24 Day Shift: 16:00-00:00 UTC (08:00-16:00 PST), all times posted in UTC
STATE of H1: Commissioning
INCOMING OPERATOR: None
SHIFT SUMMARY: Commissioning continues. Wind and microseism are low.
LOG:

1550 Chris S moving forklift near X arm past OSB
1739 Kara to EY to troubleshoot shaker
1820 Chris S to EY fan room
1827 Kara back
1836 Dave restarting broadcaster
1846 Richard, Fil to drive inside of arms
1905 Richard, Fil poking ALS fiber
2012 Richard, Fil back
2042 Nutsinee to ISCT6
2235 Amber and guests to drive on the overpass
2302 Kara to EY to check on shaker
2322 Kara back


H1 PSL (ISC)
jenne.driggers@LIGO.ORG - posted 14:28, Thursday 24 January 2019 - last comment - 06:44, Thursday 31 January 2019(46626)
FSS noisy sometimes??

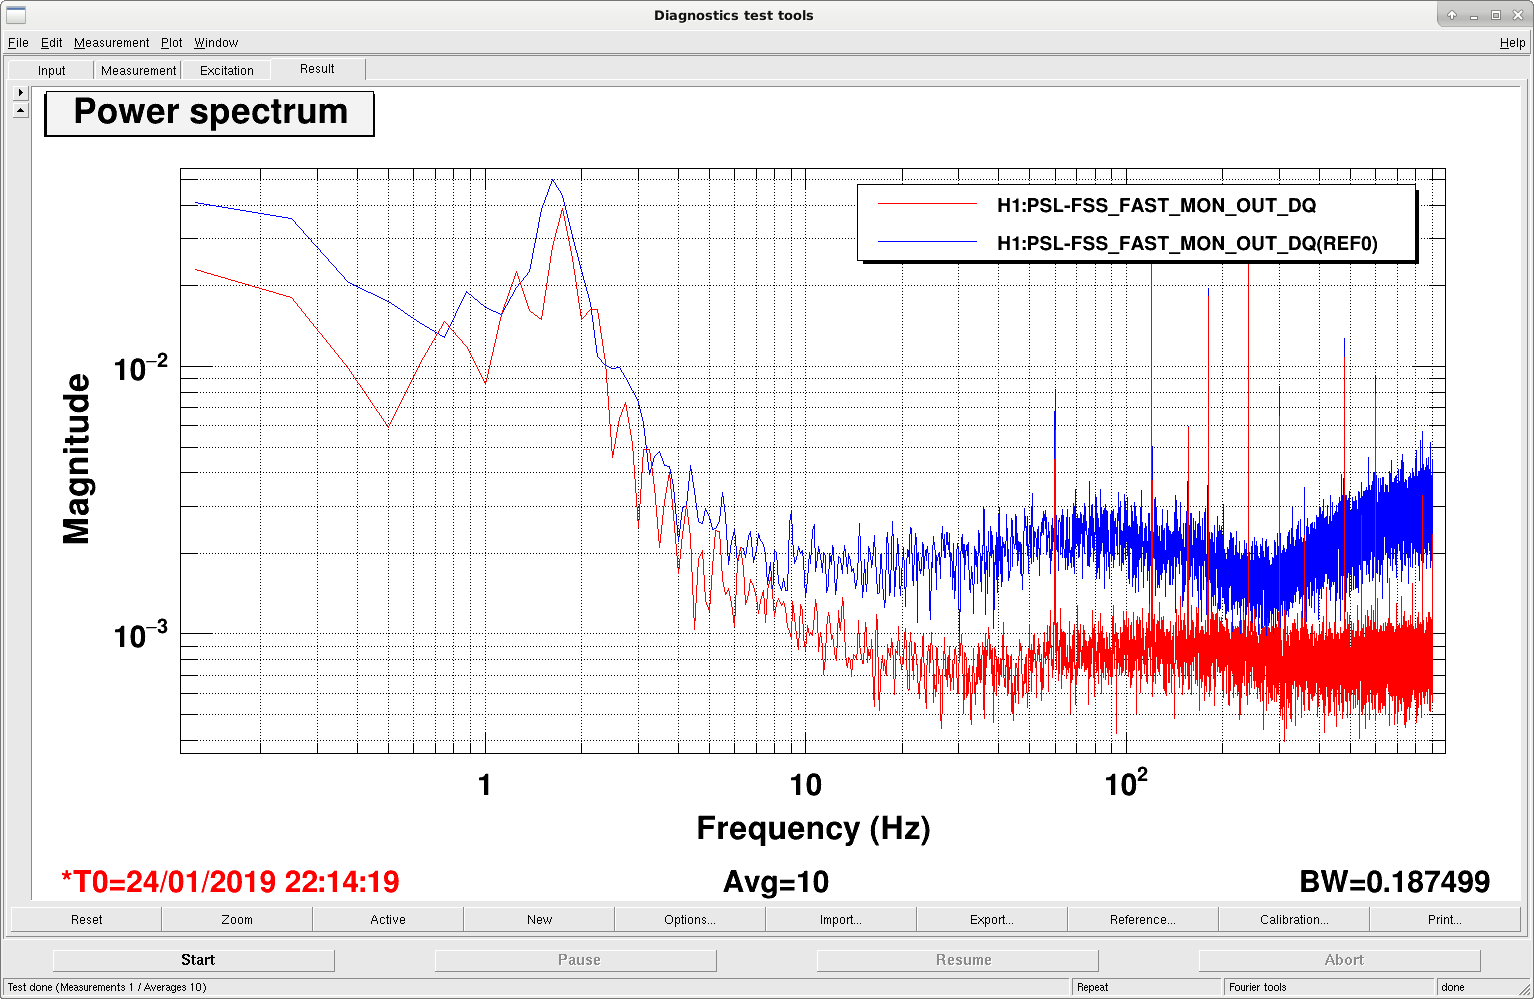
Sometimes it seems like the FSS gets noisy, and I don't think anything else is happening in the IFO.

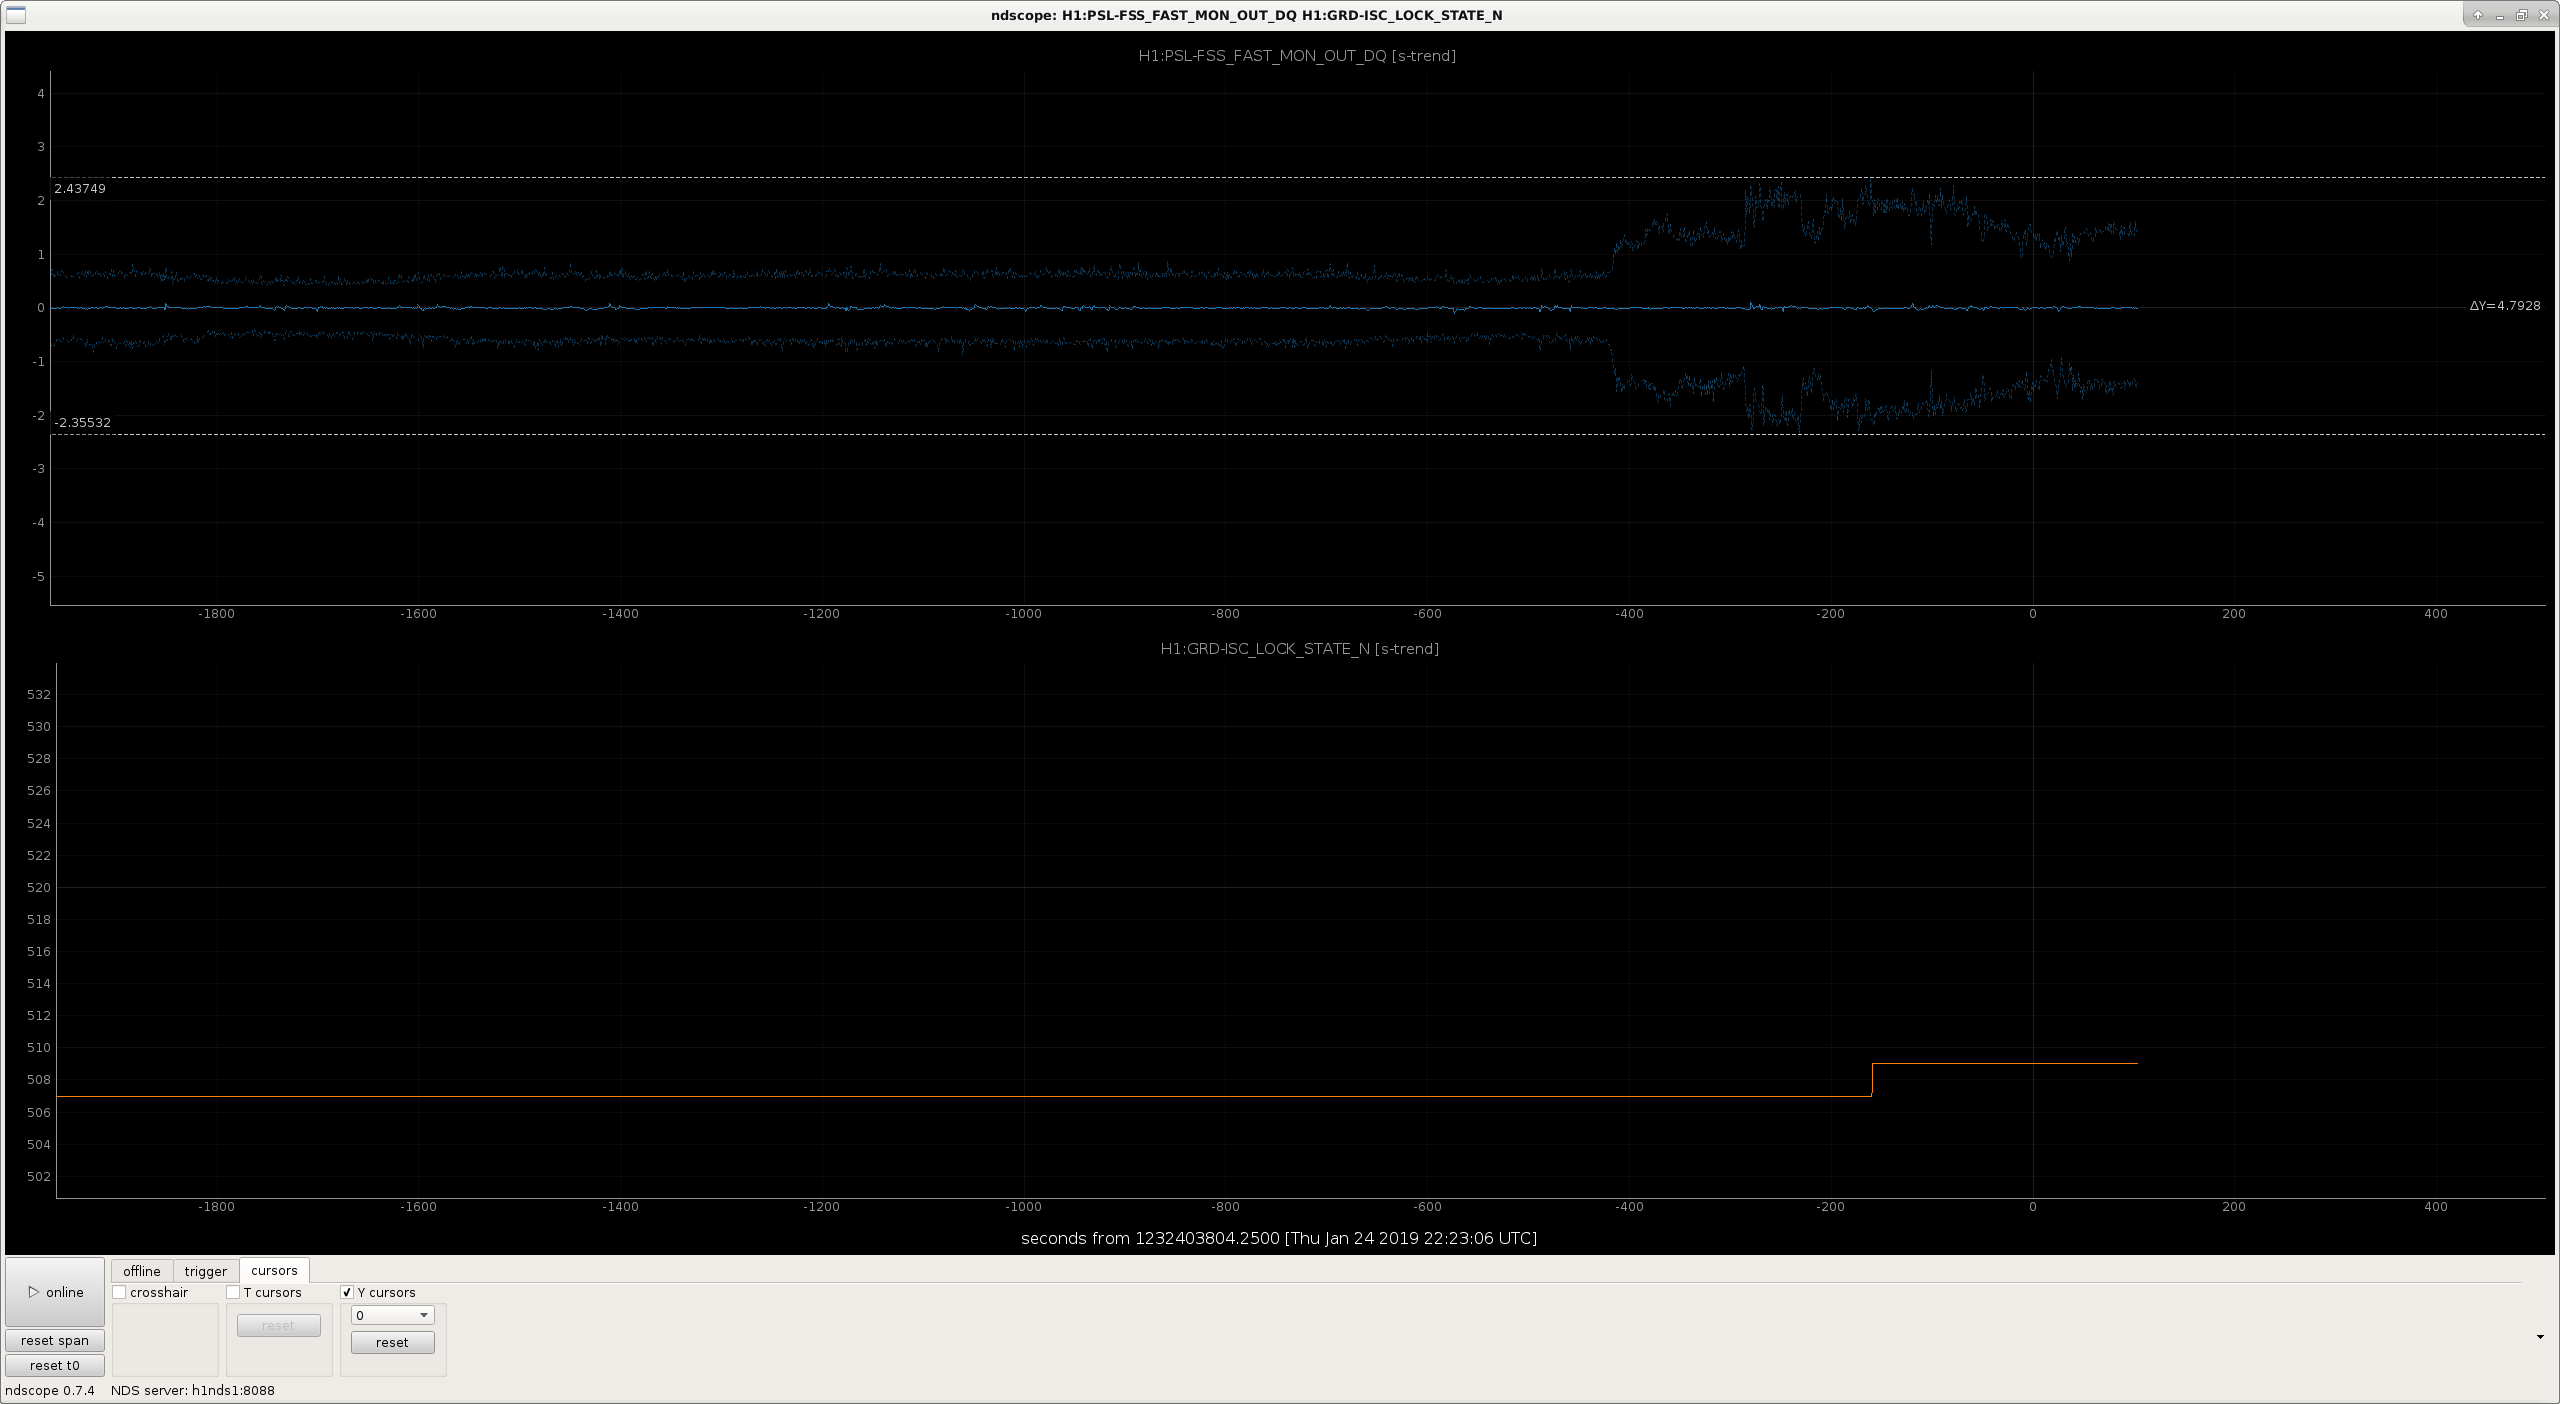
I caught it happening again, and am posting a quick time series and spectrum to show that it's definitely changing.  Does anyone in PSL-land know what this might be?  Perhaps (as Sheila suggests) someone could take a look at PSL PEM sensors to see if anything changed in there?

Images attached to this report
Comments related to this report
jason.oberling@LIGO.ORG - 12:24, Friday 25 January 2019 (46639)DetChar

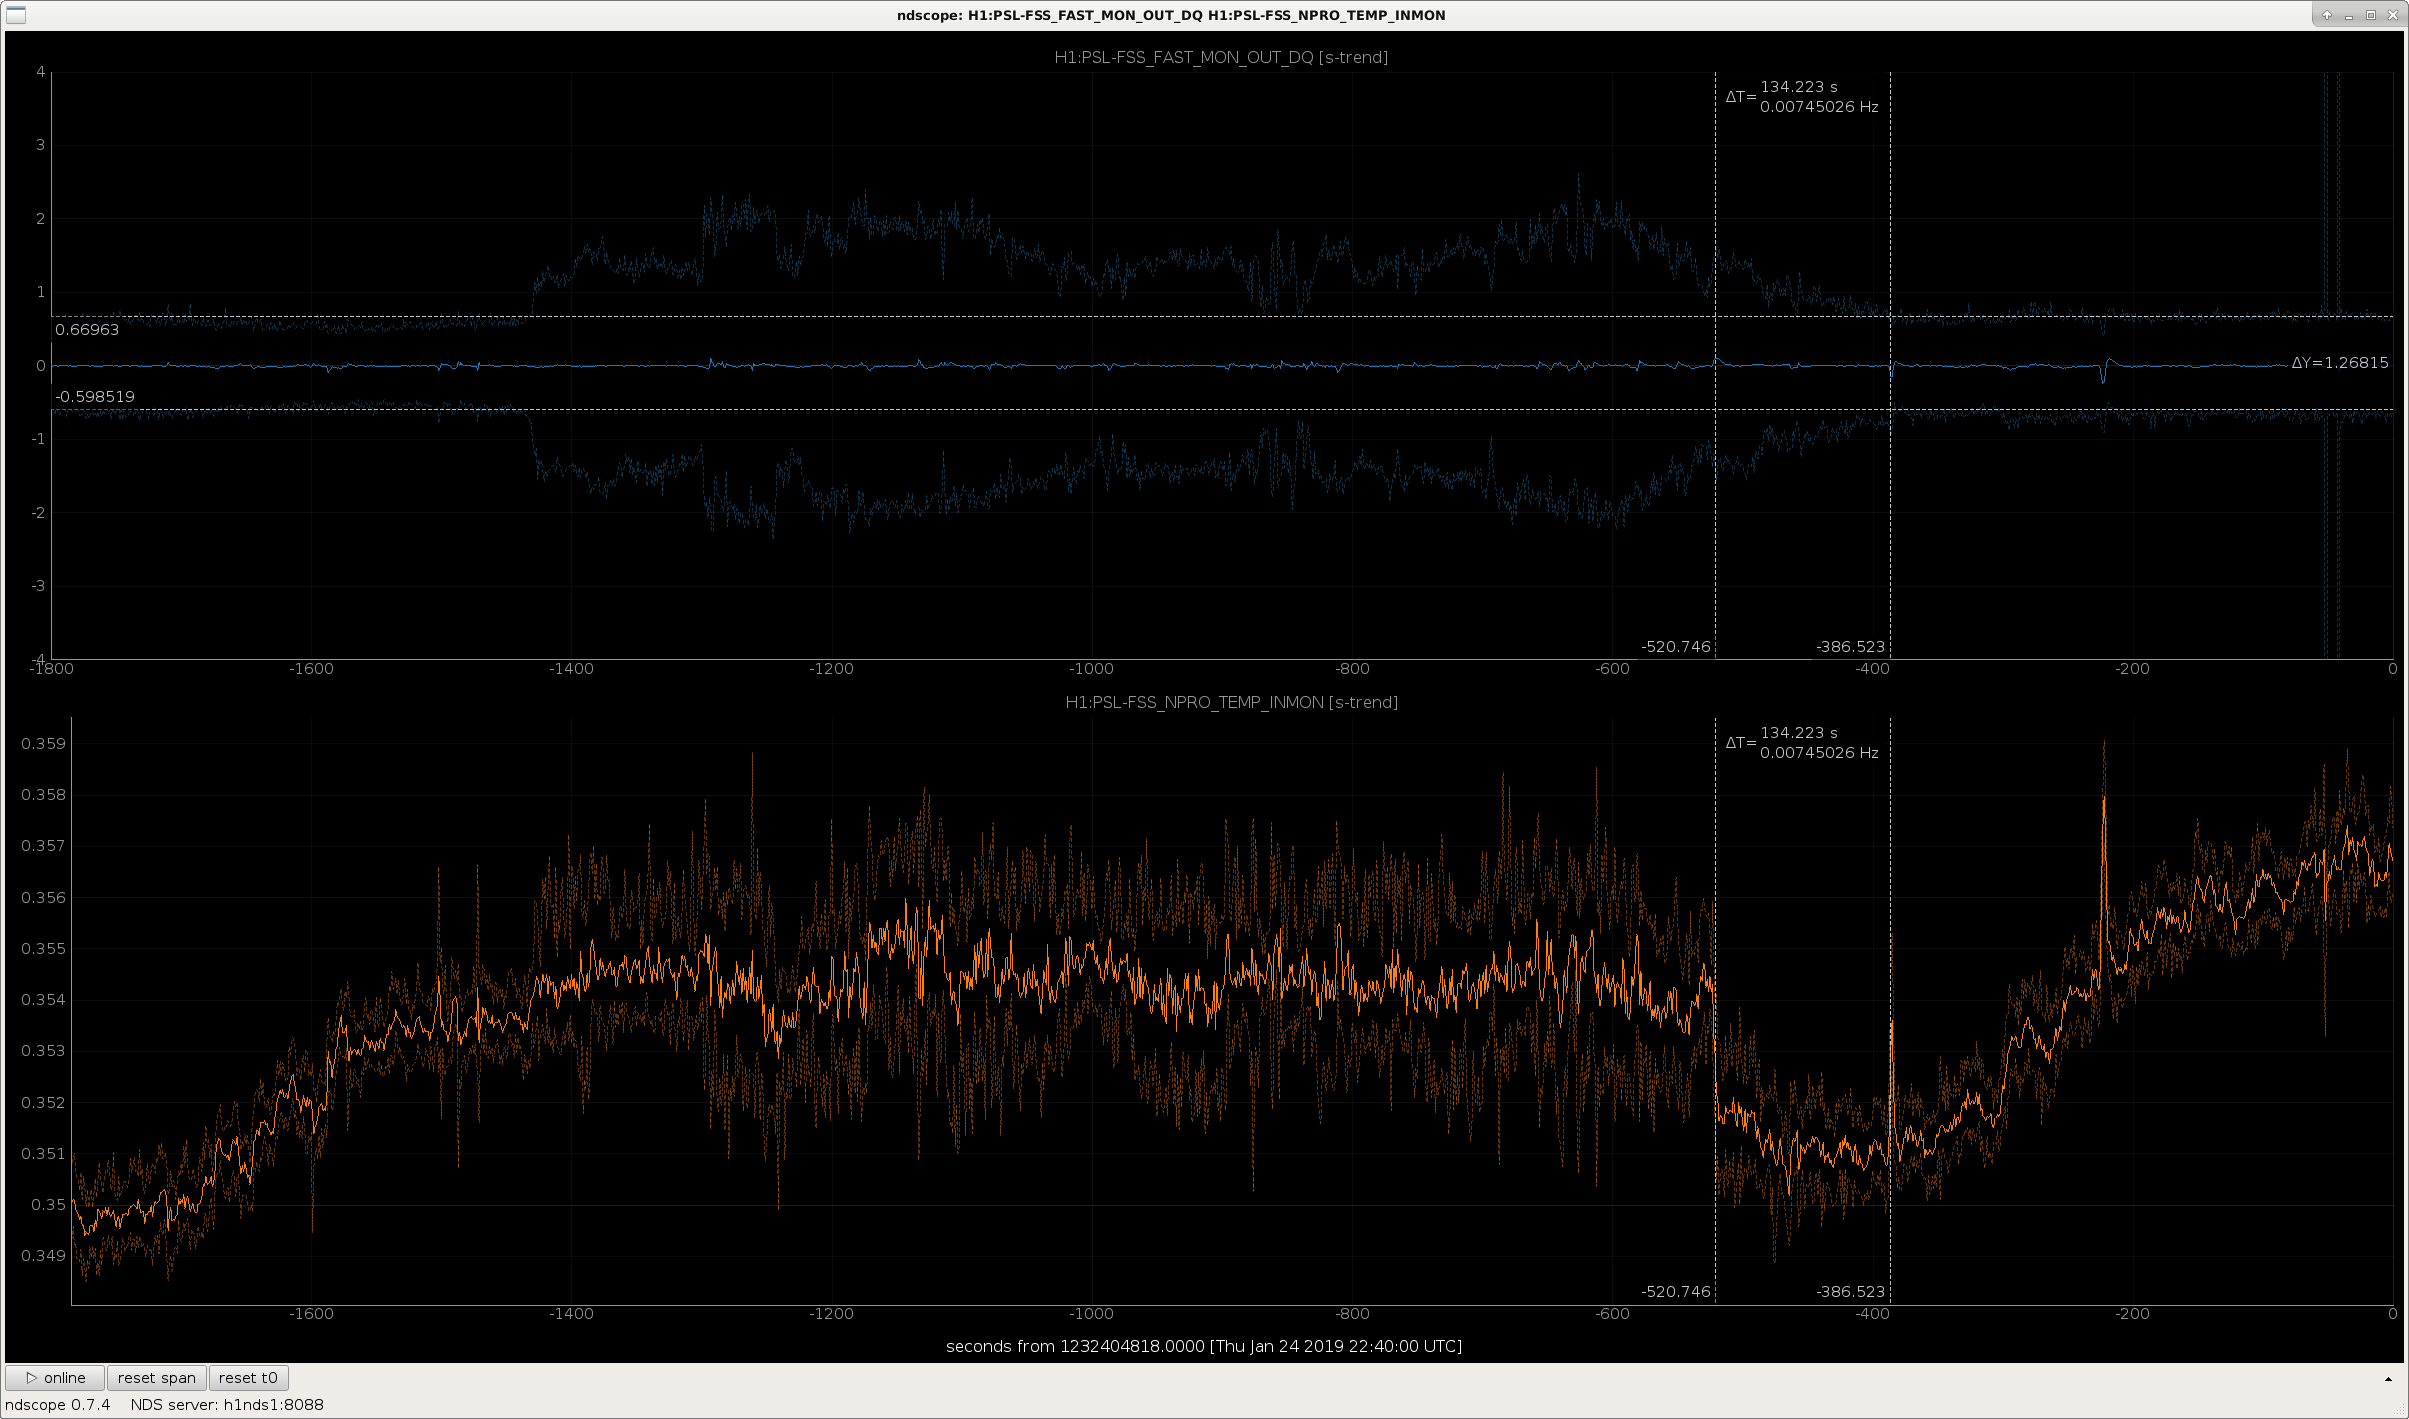
First attachment contains the 2 FSS control channels, the NPRO PZT (fast) and the NPRO crystal temperature (slow), and covers the entire period of the noise "event" Jenne notes above.  As can be seen the noise is visible in both channels (not entirely surprising) and lasts for ~1047 seconds.  ~134 seconds before the NPRO PZT returns to its usual peak-to-peak swings, the NPRO crystal temperature sees a small downward jump and then slowly returns to its normal peak-to-peak behavior over those 134 seconds.

I also looked at several other signals over the same time frame and compared them to the FSS fast signal:

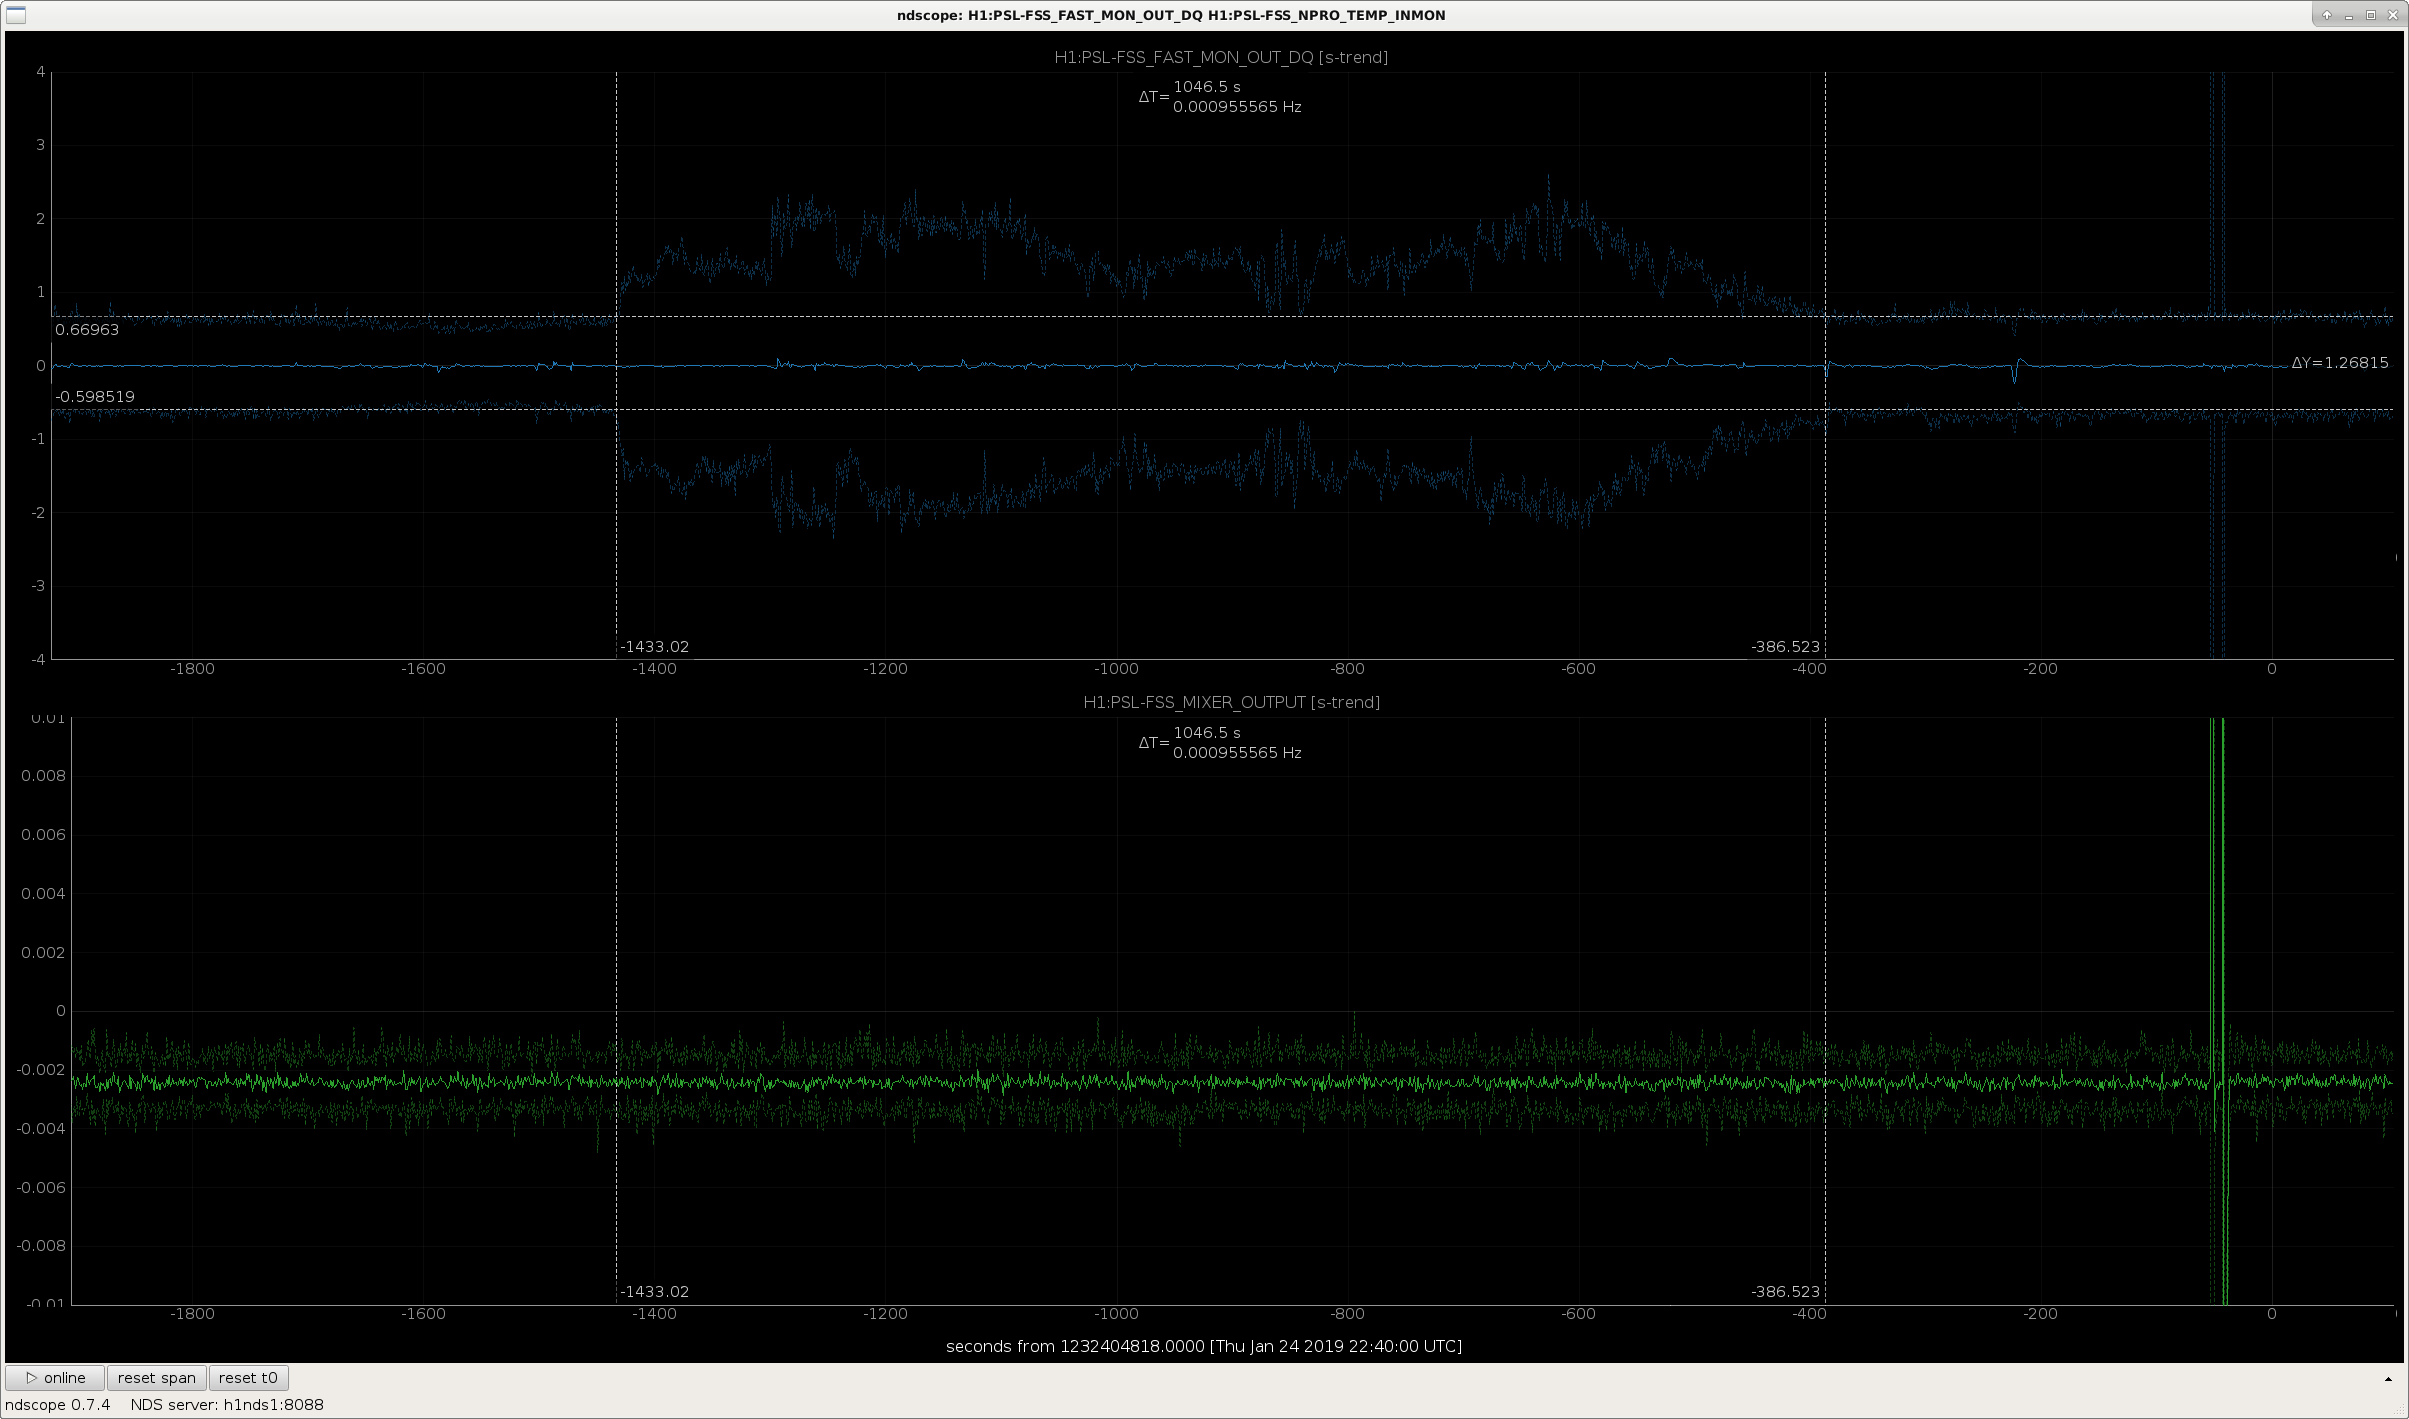
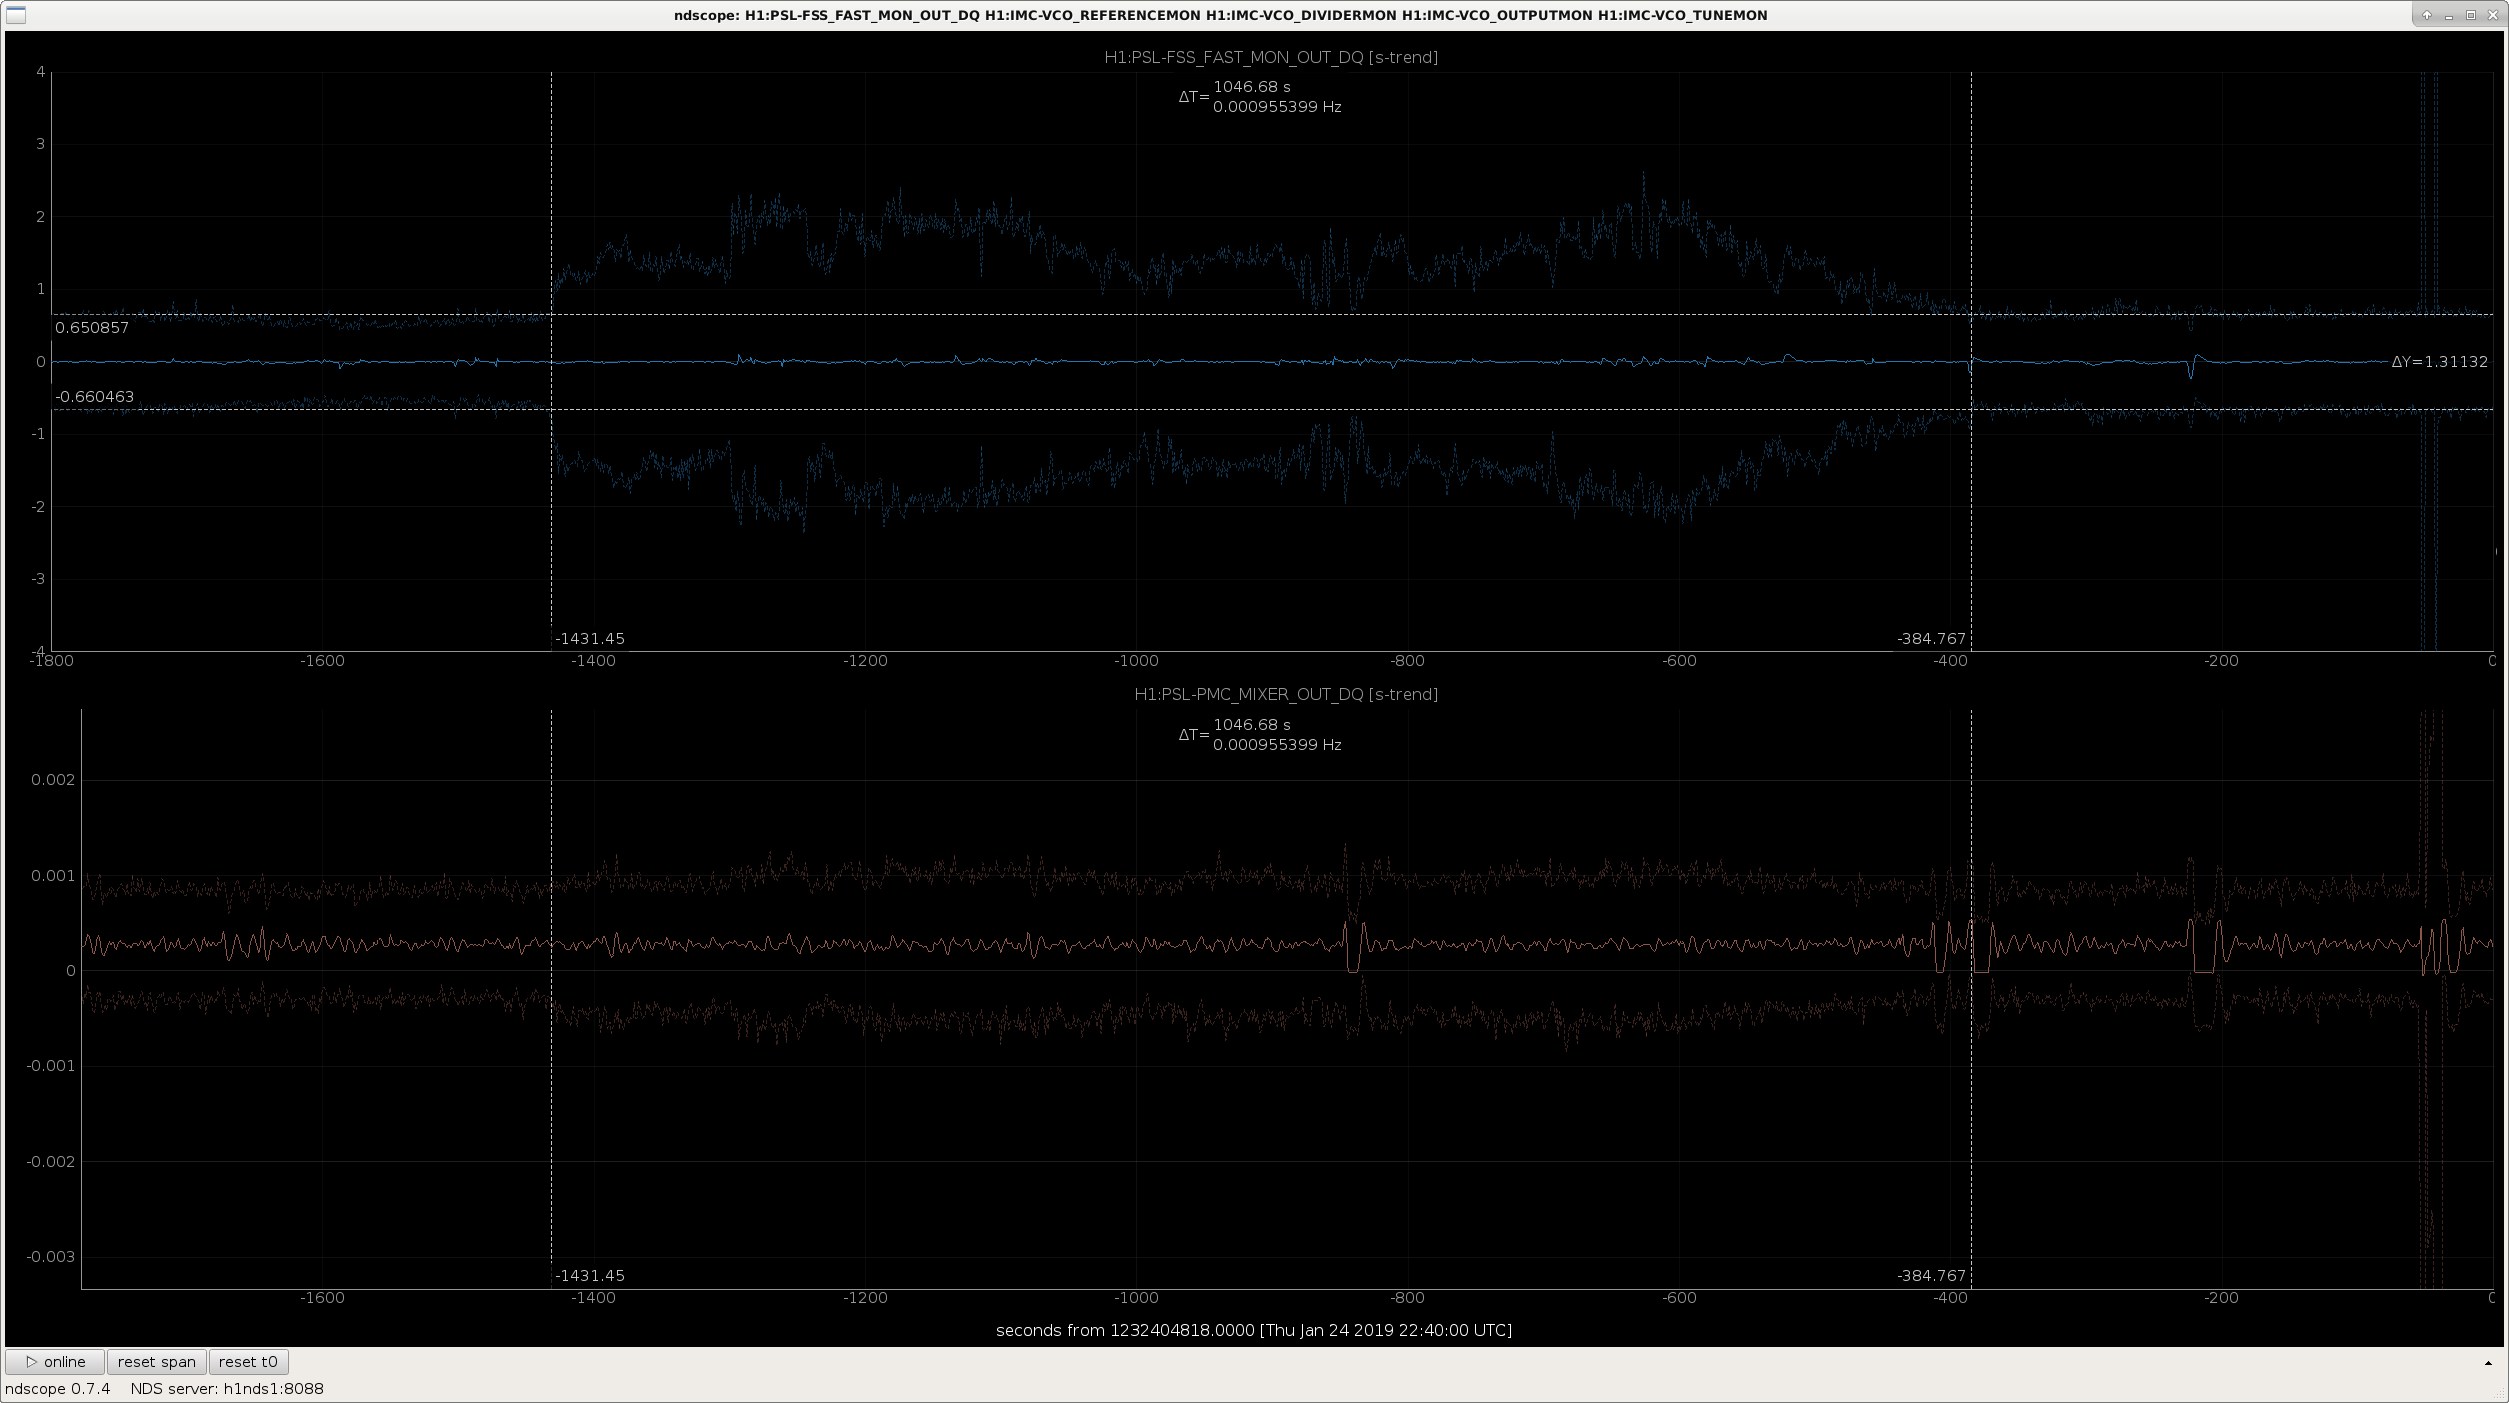
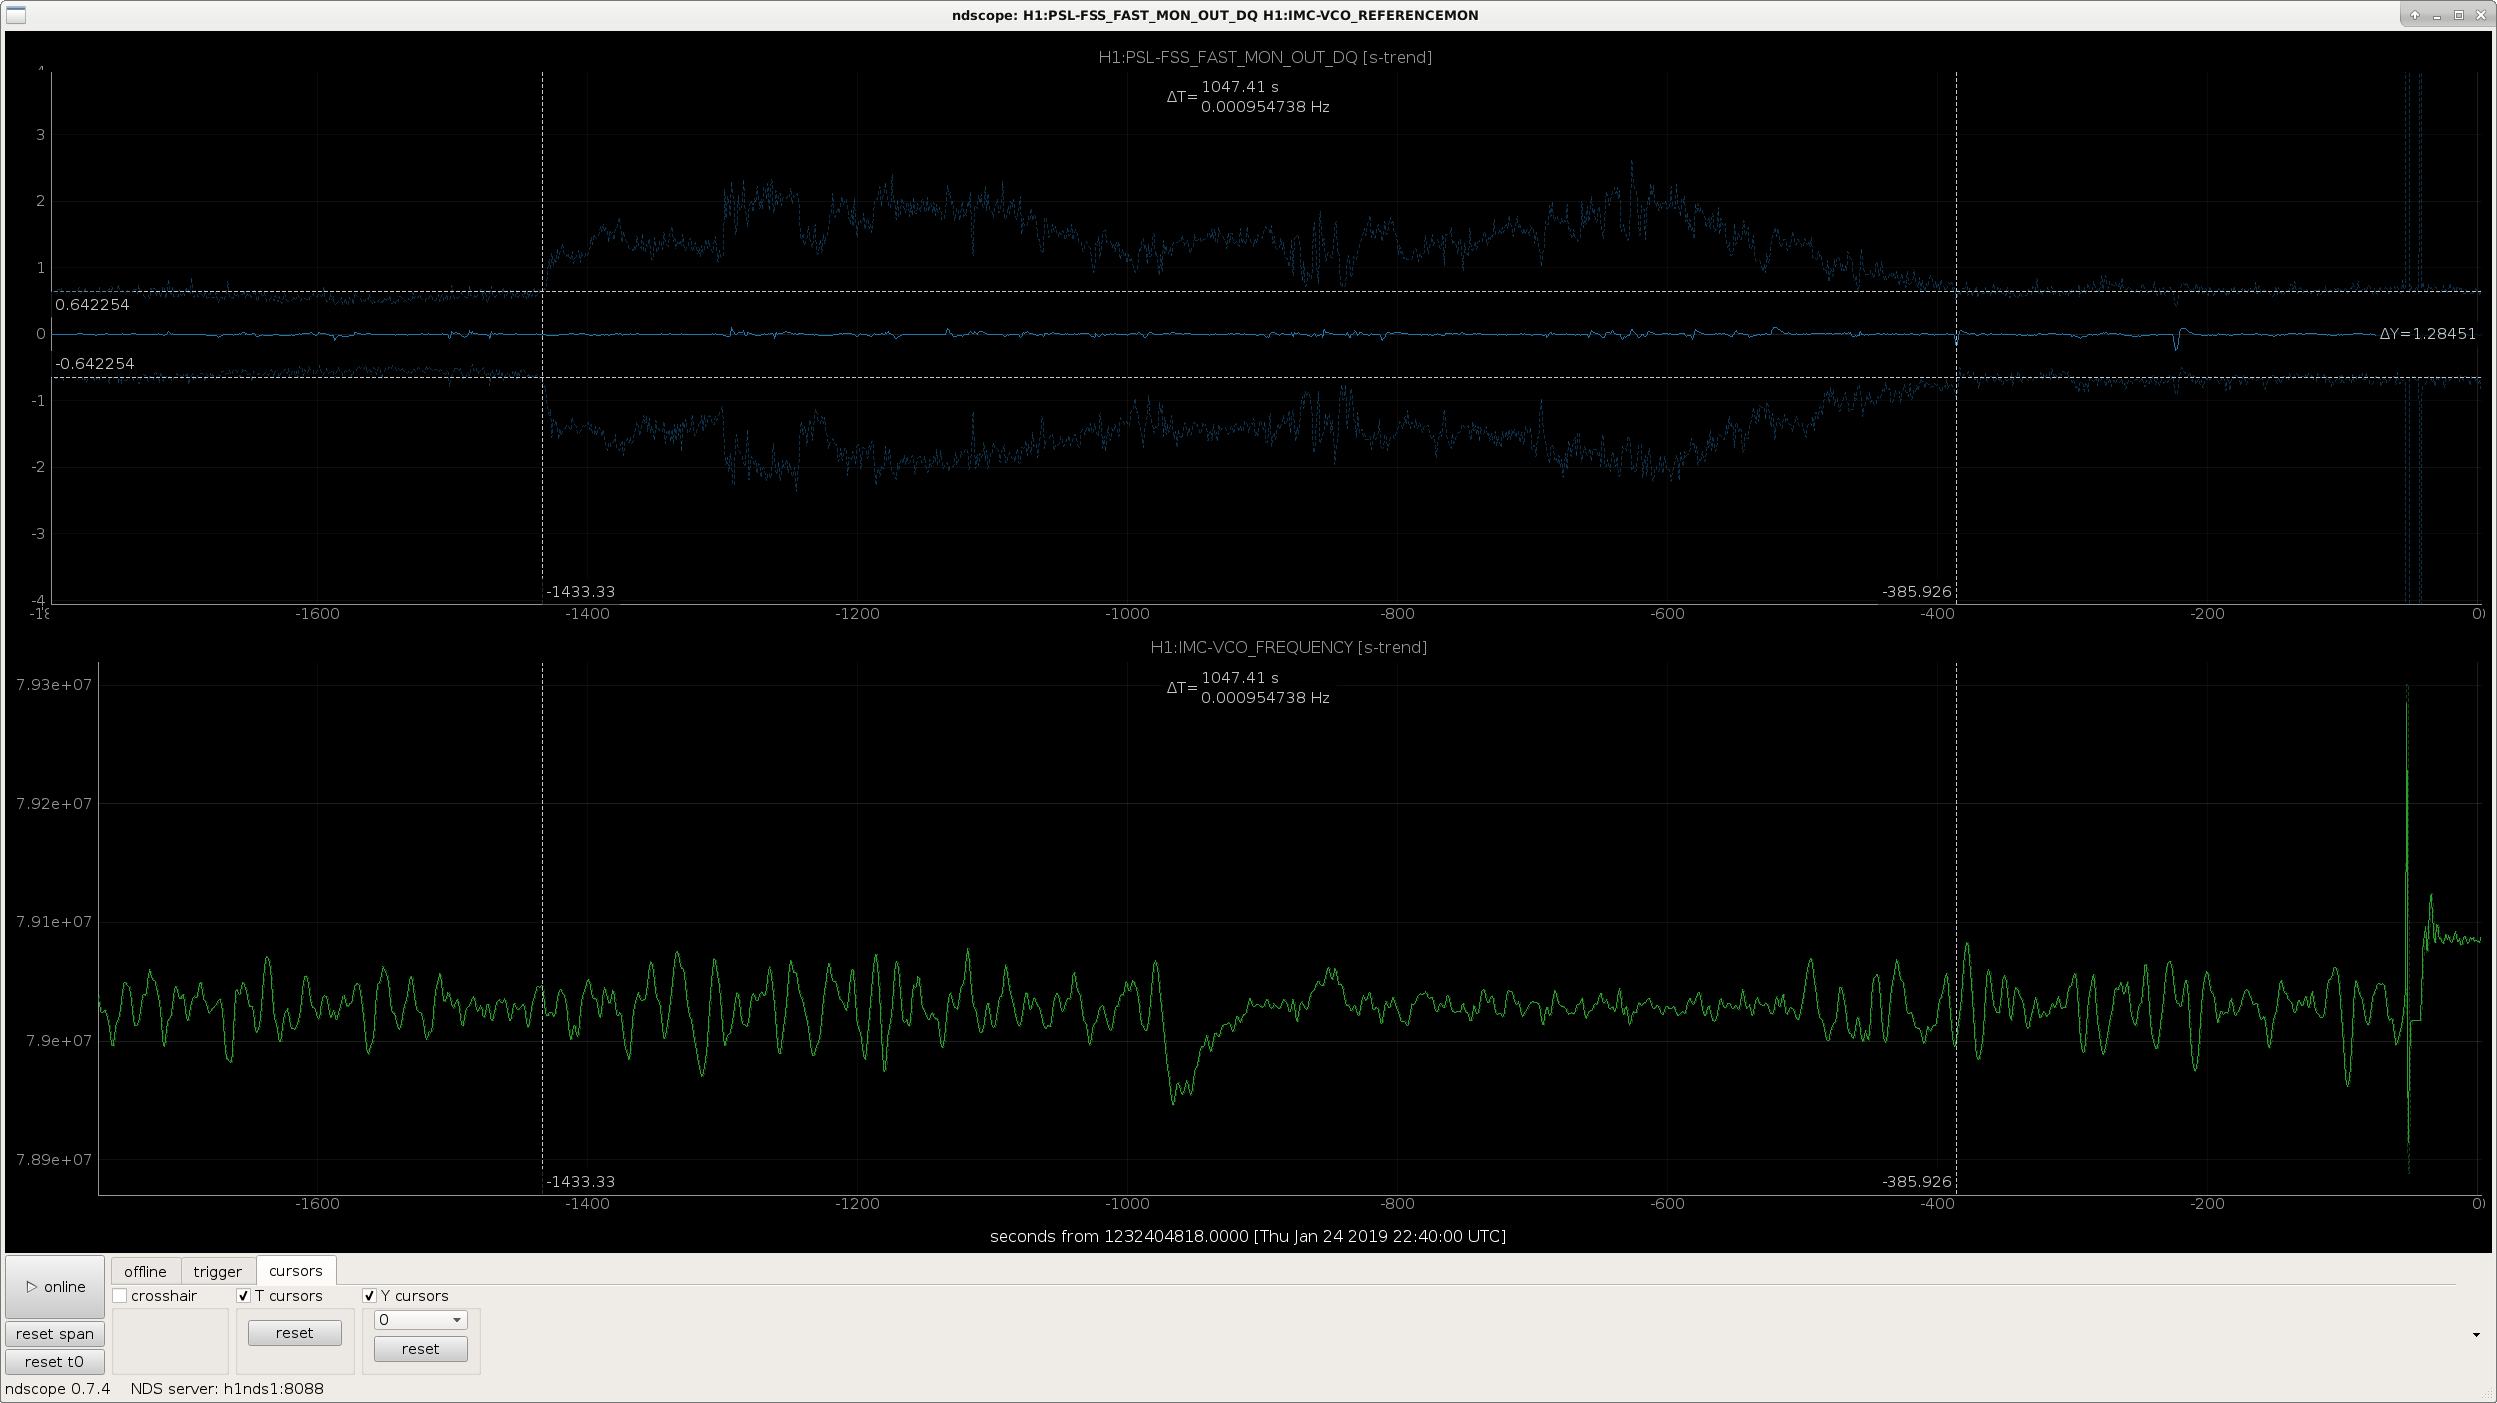
  • 2nd attachment: FSS fast with FSS RefCav mixer
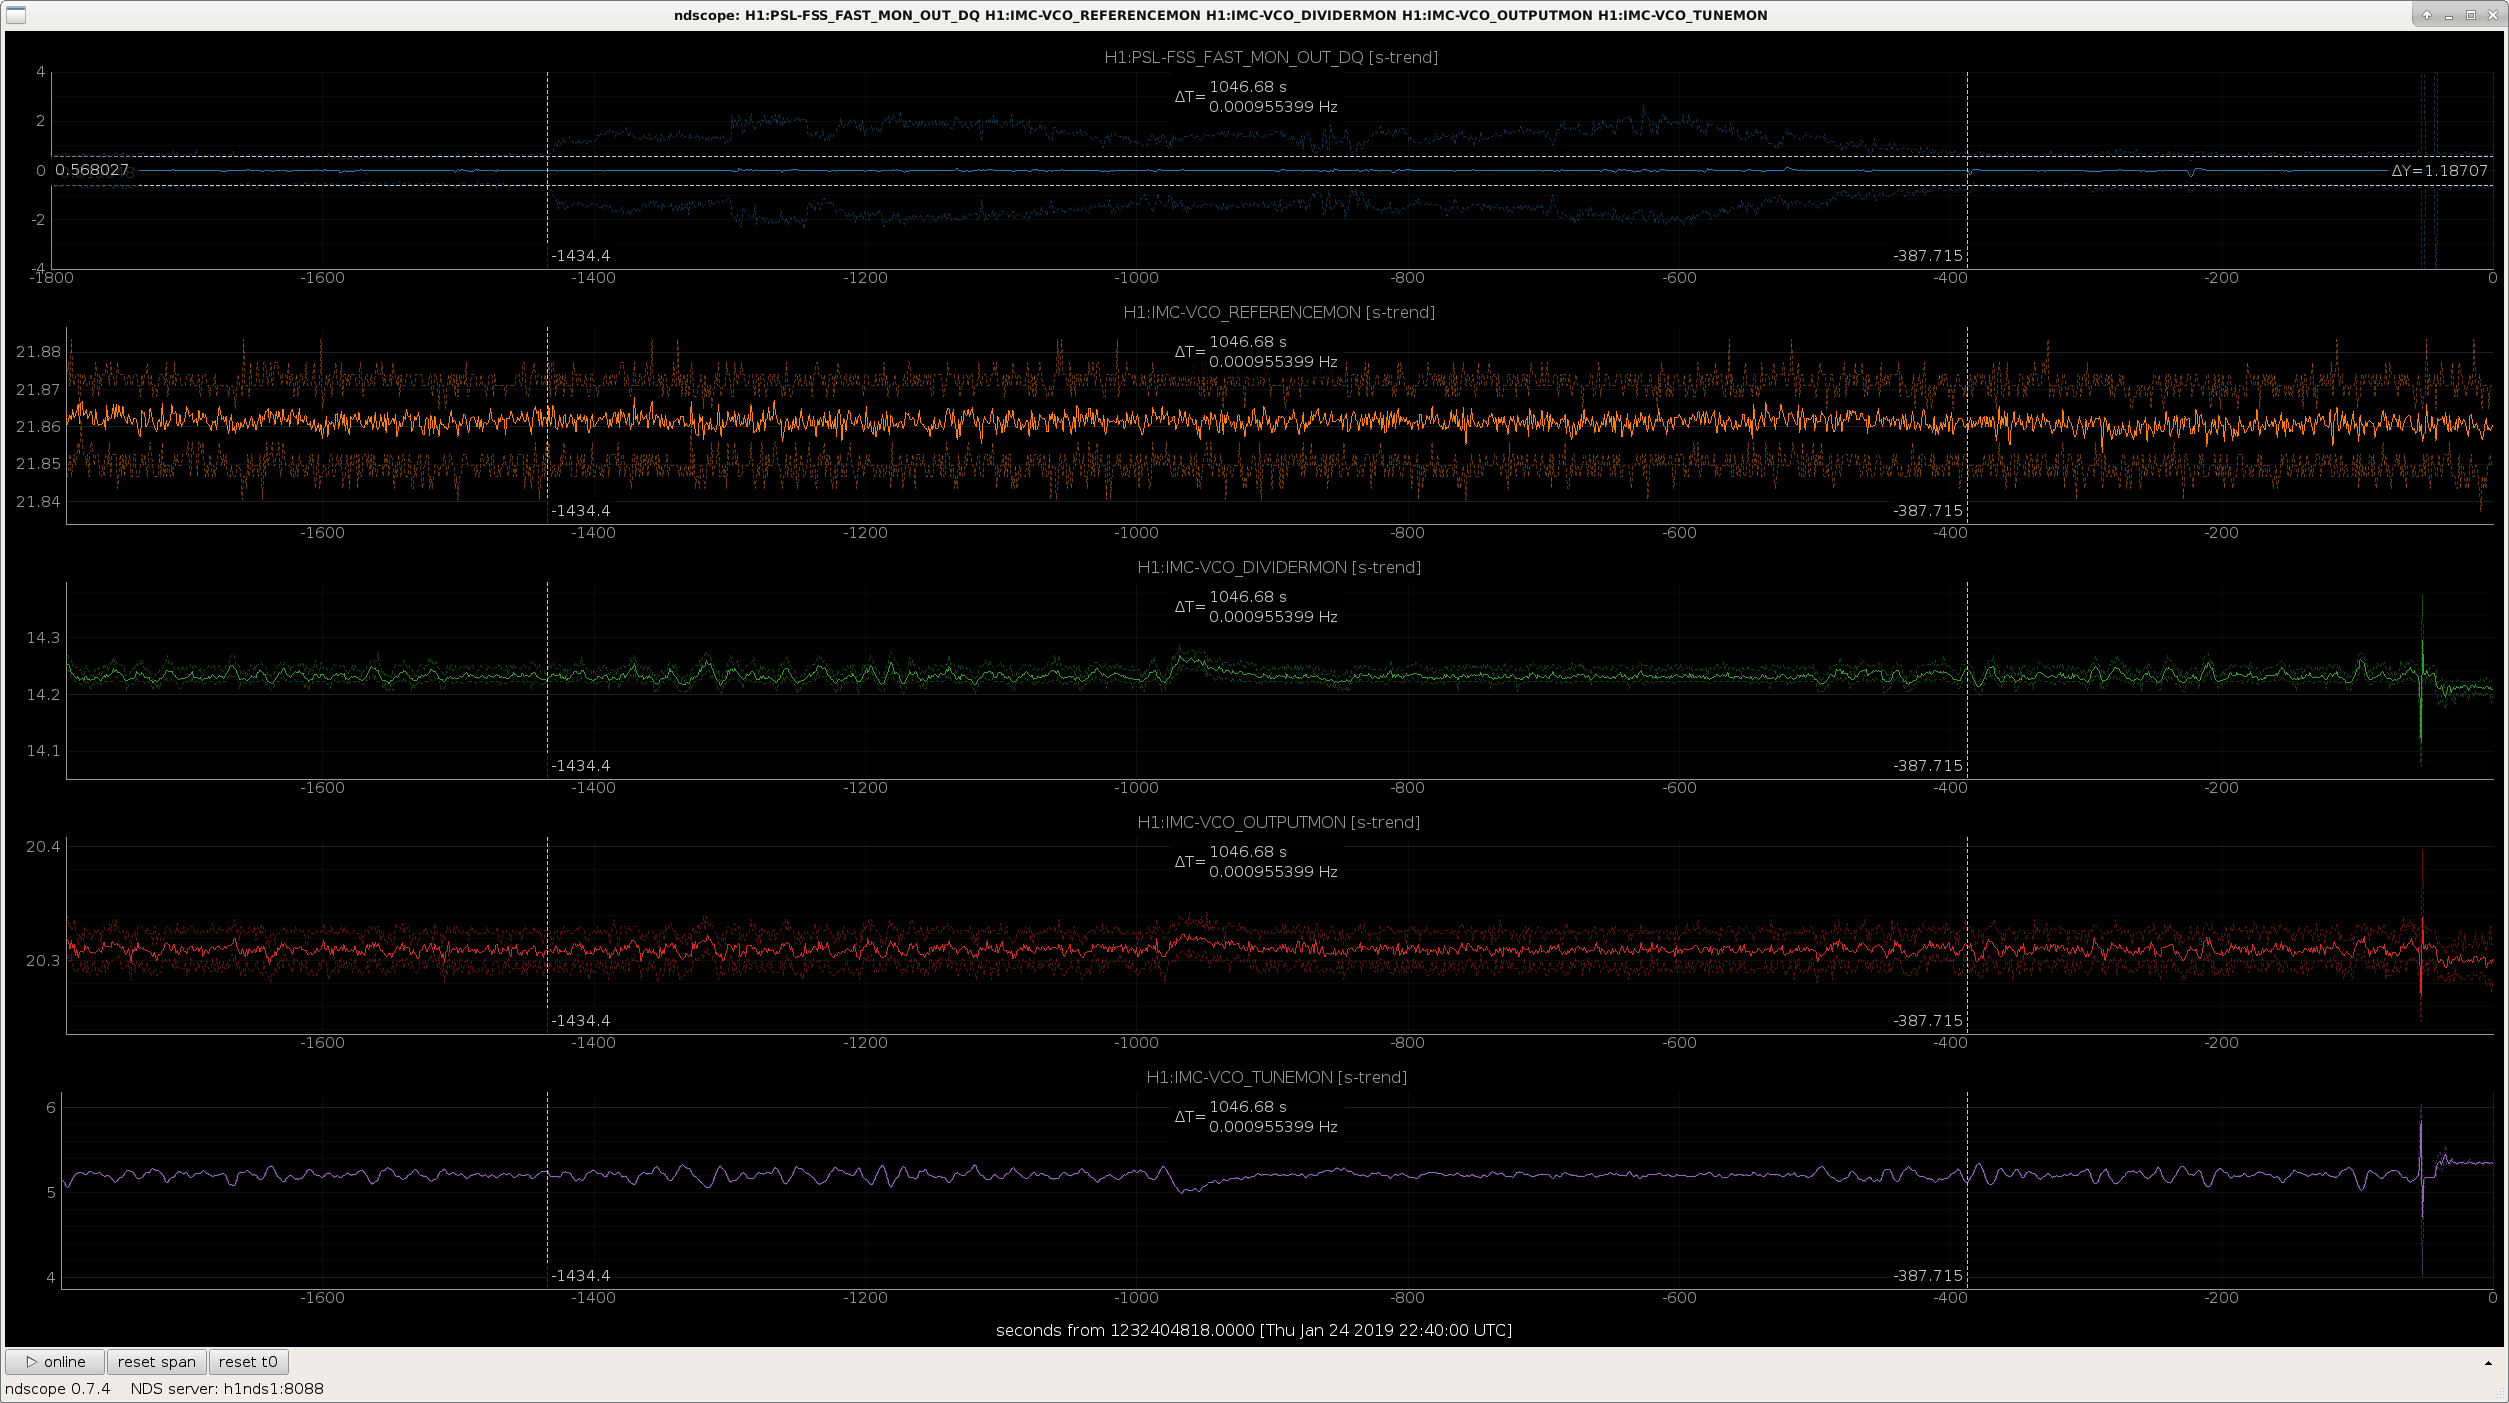
  • 3rd attachment: FSS fast with various VCO signals
  • 4th attachment: FSS fast with PMC mixer
  • 5th attachment: FSS fast with VCO frequency

This noise does not appear in any of these other channels that I can see; so far I've only seen it in the FSS fast and slow channels.  After a quick chat with Peter we have 2 possibilities to explore:

  • Does the noise coincide with VCO whistles?
    • Maybe unlikely, but could someone from DetChar check this?  Thanks.
  • The PSL NPRO could be close to a mode hop region
Images attached to this comment
daniel.sigg@LIGO.ORG - 15:06, Friday 25 January 2019 (46645)

Excess high frequency signals are clearly visible in the PC_MON. This is an RMS measure of the signal sent to the Pockels cell.

Non-image files attached to this comment
kara.merfeld@LIGO.ORG - 11:54, Tuesday 29 January 2019 (46688)DetChar, PEM
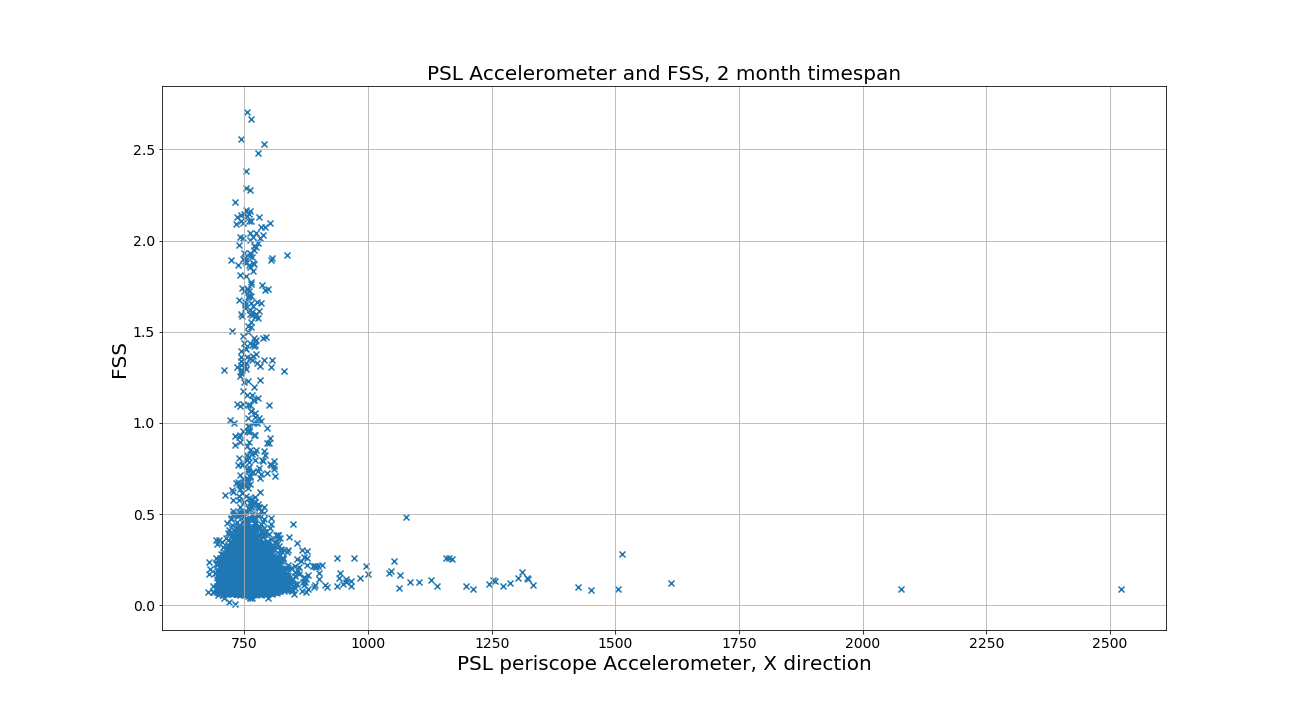
I looked at correlations between the FSS and several PEM monitors in the PSL, these were: the microphone, the dust monitor, and the x-direction accelerometer on the periscope.  I compared the 10s maxima of the PEM channels with the 10s maxima of the FSS over a 2 month span of time using only time segments when the interferometer was in nominal low-noise, and found no correlations.  Attached is a plot comparing the PSL periscope accelerometer, and the FSS.  

Jenne saw this noise in FSS while the interferometer was still acquiring lock, and as long as it doesn't interfere with locking, it shouldn't be a problem.
Images attached to this comment
peter.king@LIGO.ORG - 06:44, Thursday 31 January 2019 (46717)
During the Commissioning Meeting yesterday I kept an eye on the PZT voltage, the laser crystal temperature and the EOM monitor
drive voltage.  The larger fluctuations in the PZT voltage seem to coincide with large values of the EOM voltage.  A brief
discussion with Daniel the other day where he suggested looking at increasing the EOM gain to reduce the EOM voltage since its
average value is somewhat above 0, led me to think about the cross over.

    This morning I moved the cross over around by adjusting the fast gain.  Sure enough increasing the fast gain reduces the
EOM drive and lowering it, increases the EOM drive.  The EOM drive voltage seems to be minimised when the fast gain is set
to 19 dB.  More than this and the EOM drive voltage increases, whilst the PZT remains pretty much the same.  Adjusting the
common gain had little or no effect.

    The cross over bears some re-examination.  The last time this was measured, as I recall, was around the time of the
installation of the 70 W amplifier where a series of transfer function measurements were made.
H1 SQZ
daniel.sigg@LIGO.ORG - posted 11:10, Thursday 24 January 2019 - last comment - 14:50, Thursday 24 January 2019(46622)
Squeezer VCXO chassis swapped

Nutsinee Daniel

Sometime back Marc implemented the changes of ECR E1800041 to the spare VCXO D1600500 with S/N S1700238. We then promptly forgot about it, until we encountered a calibration discrepancy in the VCXO drive that indicated that we were missing a factor of 1/25 in gain. Today, we swapped the current unit S1700237 with the spare, which eliminates the 1.6Hz/40Hz pole-zero pair and uses an AT cut crystal. As an added benefit we now need a lot less gain in the CLF CM board and the DAQ readbacks no longer overflow.

Comments related to this report
nutsinee.kijbunchoo@LIGO.ORG - 14:50, Thursday 24 January 2019 (46627)

The output of this VCXO goes to the bottom pre-amp which drives AOM2 (AA Opto Electronic MT200). There's a 10dB attenuator at the input. We gain a couple of extra dB but we should still be within range of max power allowed to drive that AOM (previously we had 6dB attenuator here, that would have been marginal). 

H1 CAL (CAL, ISC)
keita.kawabe@LIGO.ORG - posted 19:53, Wednesday 23 January 2019 - last comment - 15:54, Thursday 24 January 2019(46612)
Temporary dtt template as a stop-gap measure for calibration systematic

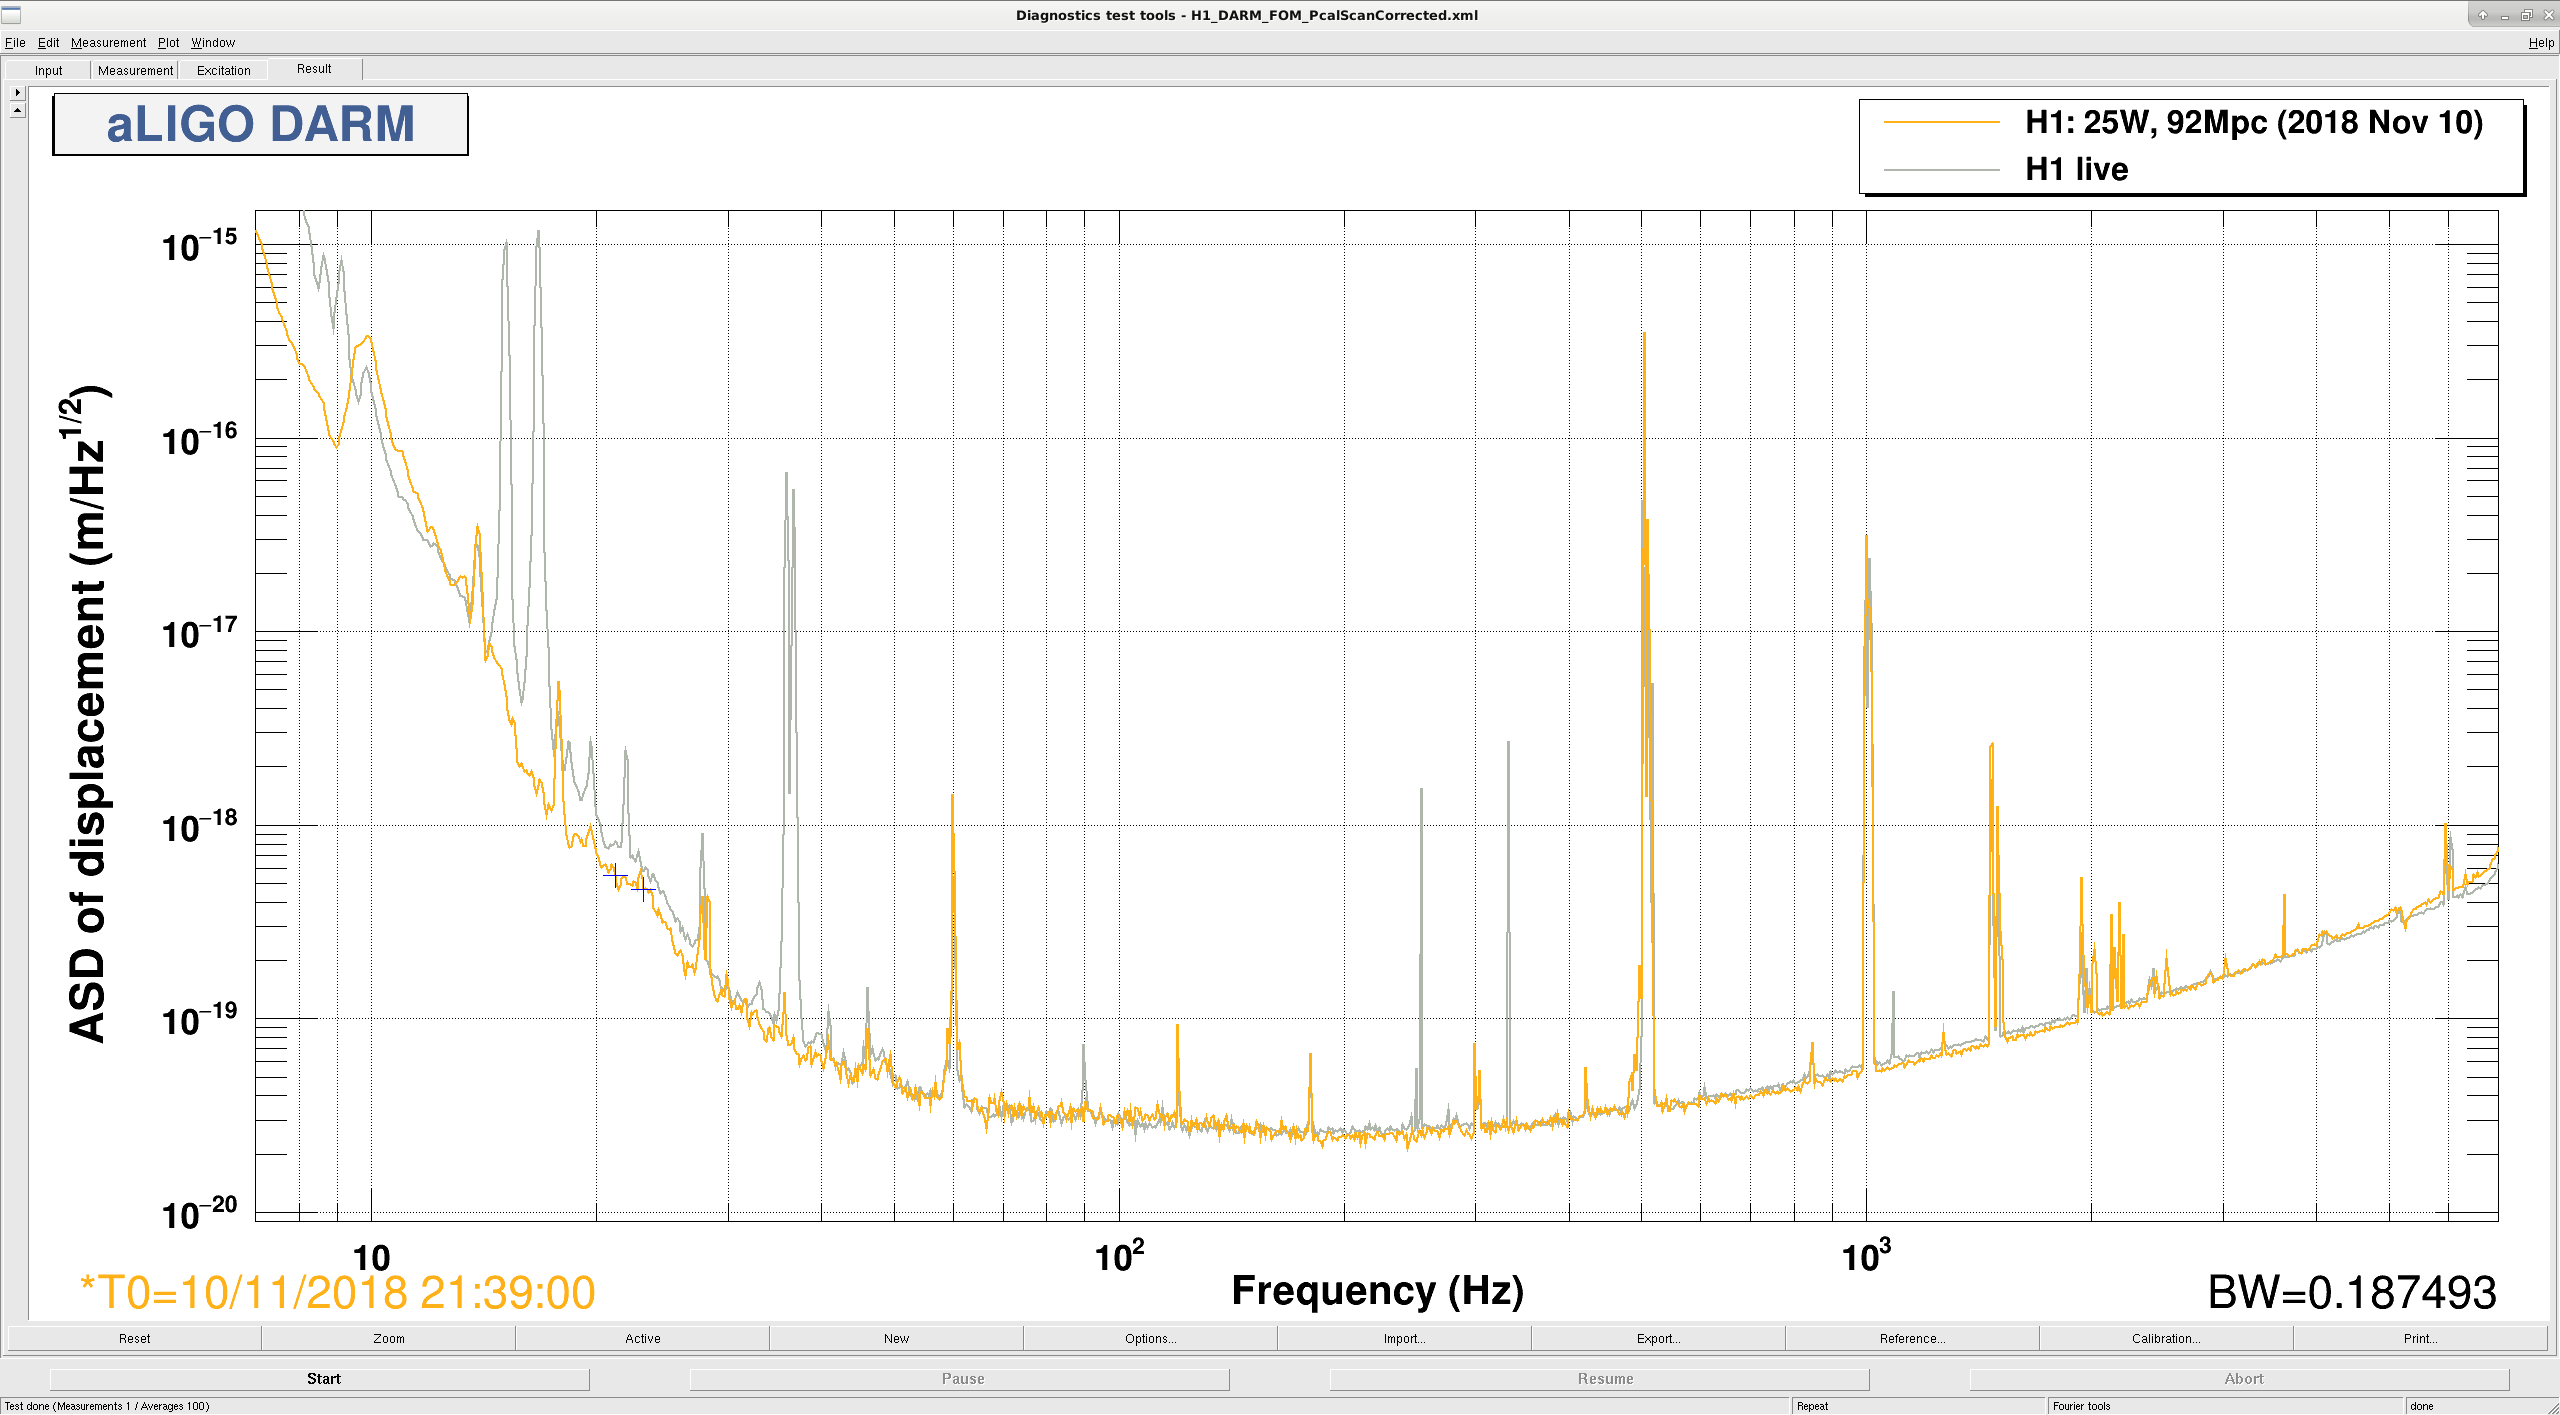
As is apparent in alog 46530, DARM calibration is off by about 10% at 100Hz, and it's hard to make comparison between now and Dec 2018 as is until a good calibration model is made.

I made a FOM dtt template with two new calibrations, one starting December 08 2018 and the other Jan 01 2019.

/opt/rtcds/userapps/trunk/isc/h1/scripts/H1_DARM_FOM_PcalScanCorrected.xml

It should be OK for f>10Hz.


What I did:

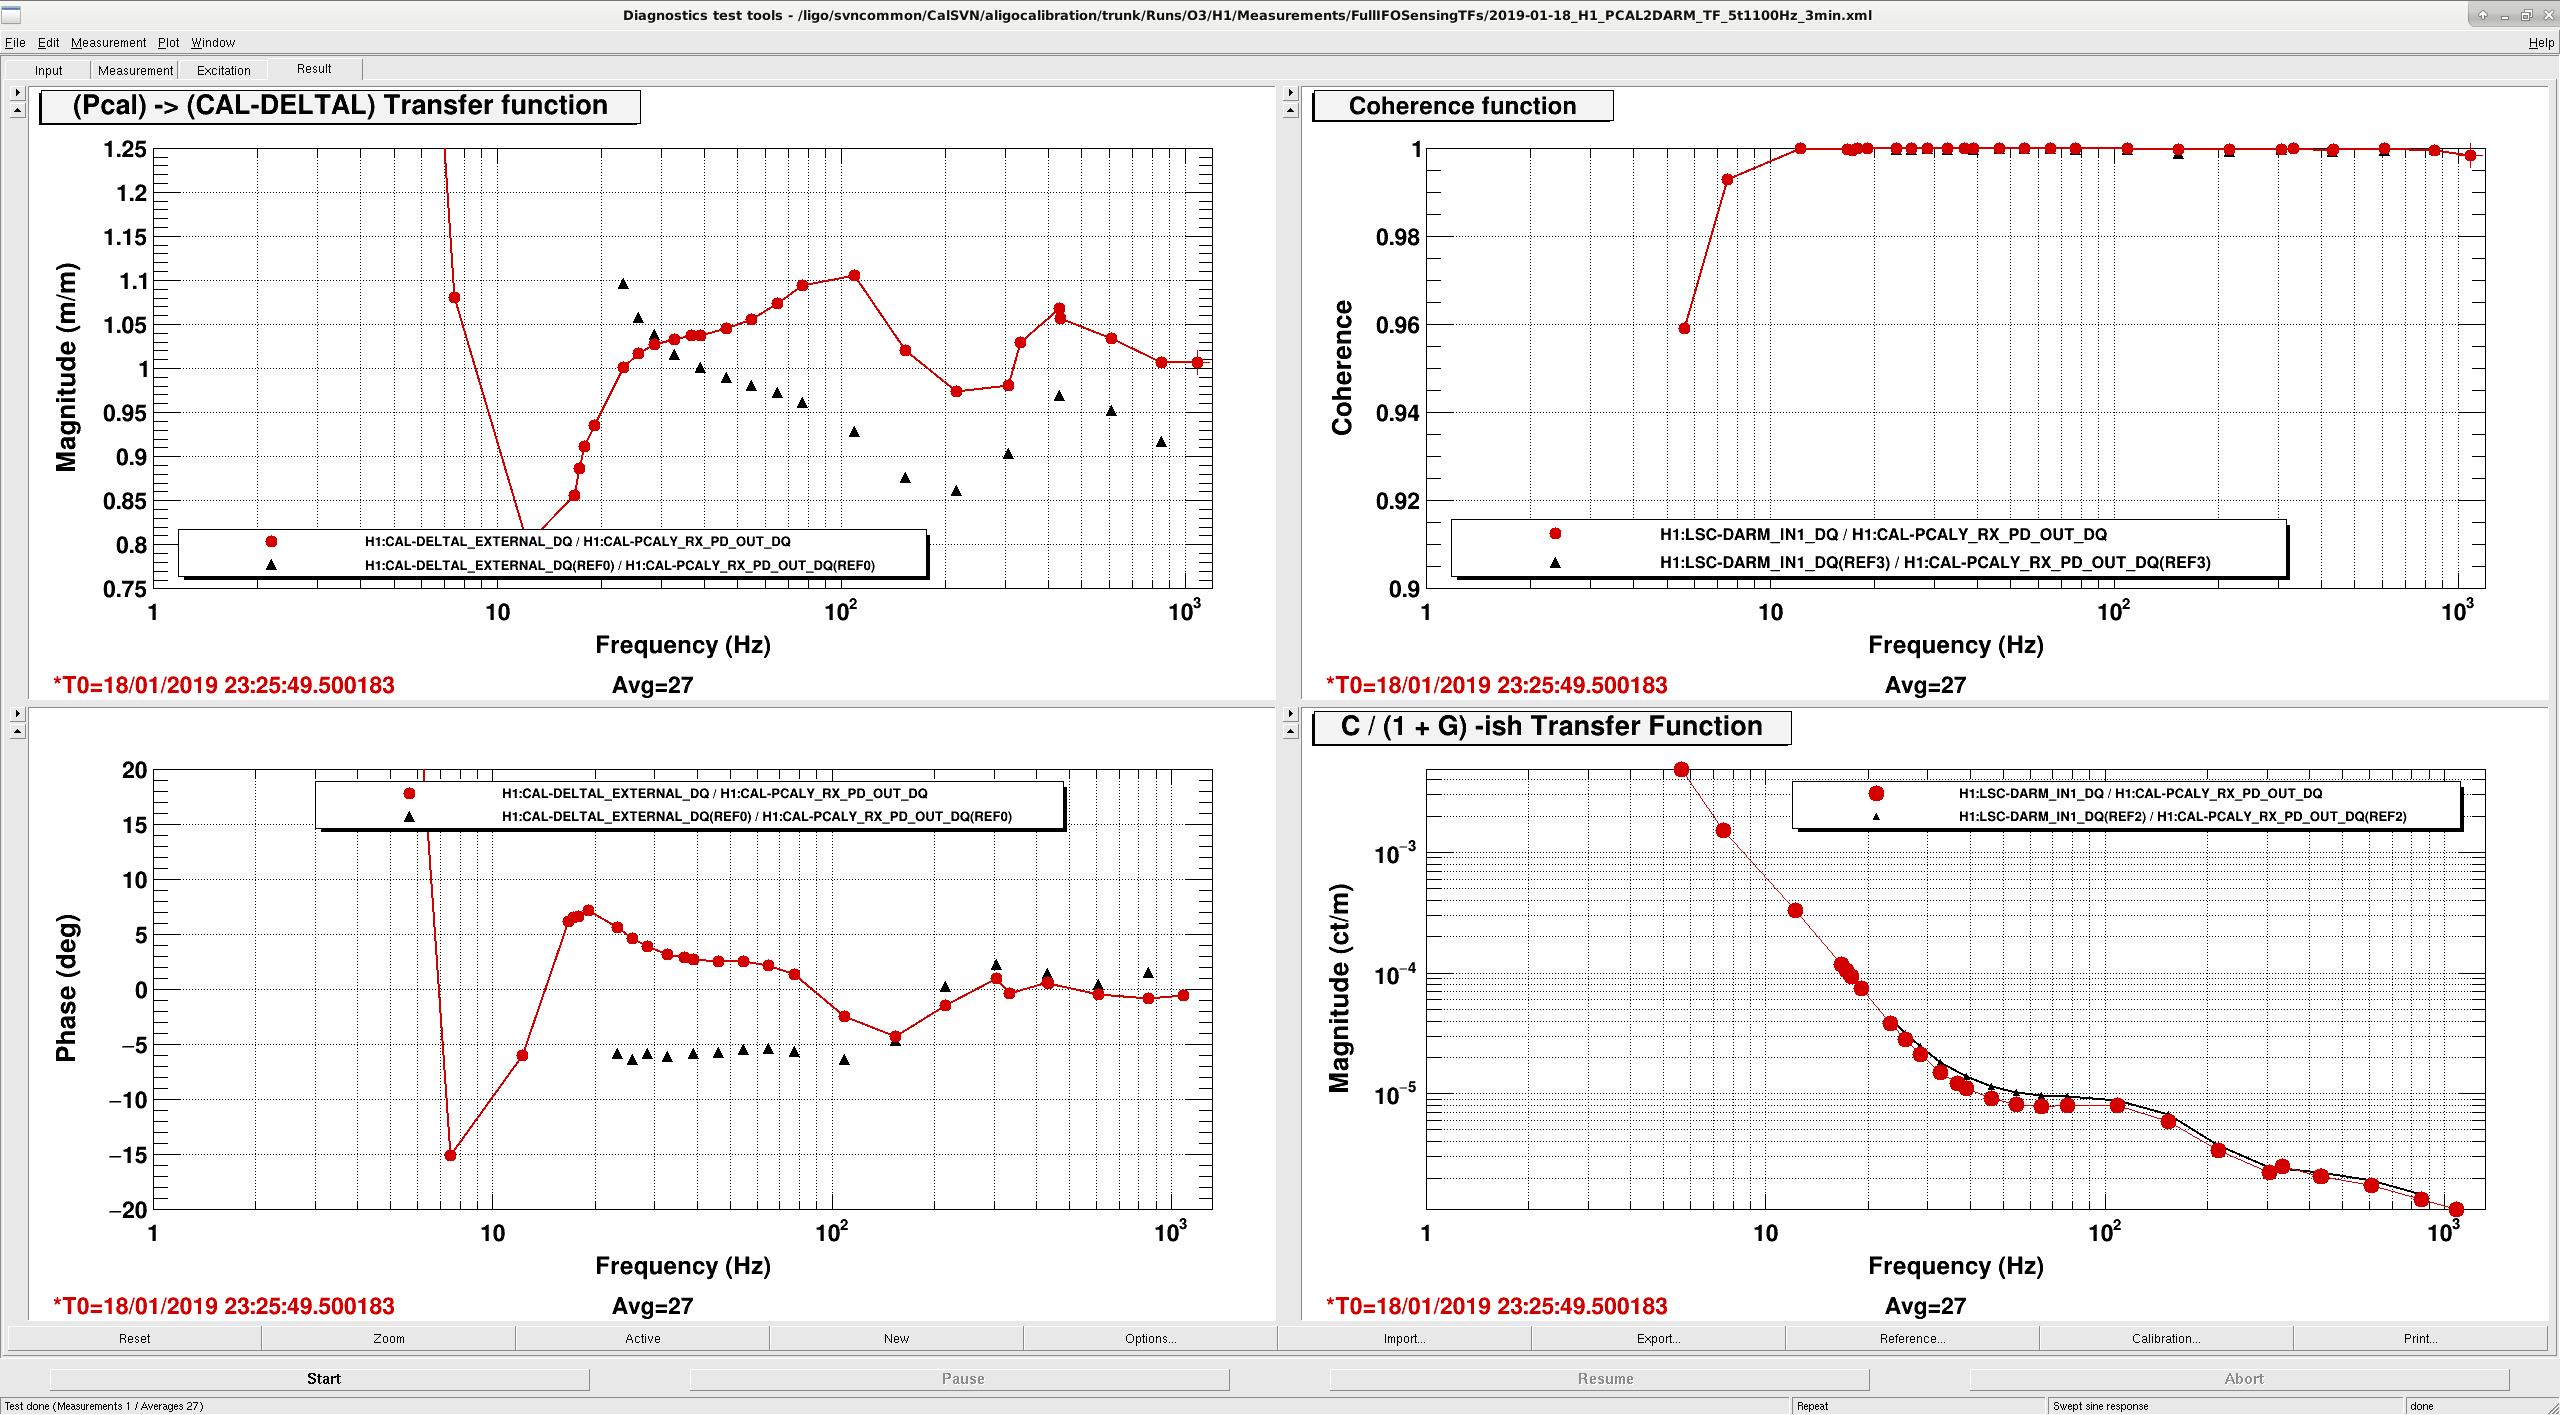
From dtt, export CAL-DELTAL_EXTERNAL_DQ/CAL-PCALY_RX_PD_OUT_DQ transfer function of

/ligo/svncommon/CalSVN/aligocalibration/trunk/Runs/O3/H1/Measurements/FullIFOSensingTFs/
        2019-01-16_H1_PCAL2DARM_TF_5t1100Hz_3min.xml

to a text file in /opt/rtcds/userapps/trunk/isc/h1/scripts/tempCalibForDtt20190123/.

Export the default TF calibration of the above transfer function to another text file.

Export the latest calibration of CAL-DELTAL_EXTERNAL_DQ dated 2018/10/4 22:28:48 from H1_DARM_FOM.xml to yet another text file.

Combine these three files and save into yet another file (newstopgapcal.txt) using

/opt/rtcds/userapps/trunk/isc/h1/scripts/tempCalibForDtt20190123/makeStopGapCalForDtt.m

Do the same for 2018-12-05_PCAL2DARM_TF_5t1100Hz_2min and save into yet another file (oldstopgapcal.txt).

Open DARM_FOM.xml using dtt.

Make a new calibration for H1:CAL_DELTAL_EXTERNAL_DQ at 2019 Jan 01 00:00:00.

Click "Trans. Func." tab, click "Edit", click "File" and "Open", load newstopgapcal.txt.

Repeat it, this time 2018 Dec 08 00:00:00, load oldstopgapcal.txt.

Save the dtt template as H1_DARM_FOM_PcalScanCorrected.xml

Comments related to this report
sheila.dwyer@LIGO.ORG - 23:18, Wednesday 23 January 2019 (46613)

Here is a comparison of a lock from late last week (Jan 21 0:30 UTC) to the November reference using Ketia's template.  The noise is generally similar, although if the November calibration was correct the shot noise has gotten slightly worse, when we increased the input power. 

The november lock was Nov 11 at 21:39 UTC, the "live" lock is Jan 21 at 0:23 UTC.  The power on the POP diode increased 22.7% from November to now, so the shot noise limited sensitivity should have improved by 10%.  If this calibration comparison is really correct, we have instead lost sensitivity.  It might be worth taking a closer look at the calibration lines in November to see how our optical gain compares.  
Images attached to this comment
jenne.driggers@LIGO.ORG - 15:54, Thursday 24 January 2019 (46628)

I looked at the Nov 10th time that Sheila has in her DTT template (11th Nov as typed in the text of the log is a mis-type) and the 21st Jan time.  The PSL injected power increased by 13% between these two times (26.7W -> 30.3W), and the POP_A_LF, and all 4 TR QPD sums all agree that the circulating power in the IFO increased by 10%.  So, it's certainly true that the circulating power has increased.  But, as Sheila points out in her plot, the shot noise region appears to have gotten worse.  Sheila is doing a test right now to investigate this further.

H1 PSL (PSL)
peter.king@LIGO.ORG - posted 08:10, Thursday 17 January 2019 - last comment - 17:55, Thursday 24 January 2019(46498)
FSS measurements (continued)
Following on from yesterday's attempt.  I made transfer function and spectra measurements with the input modecleaner locked and
unlocked.  In summary, there wasn't too much difference in the noise spectra above 100 kHz with the input modecleaner locked
or unlocked.

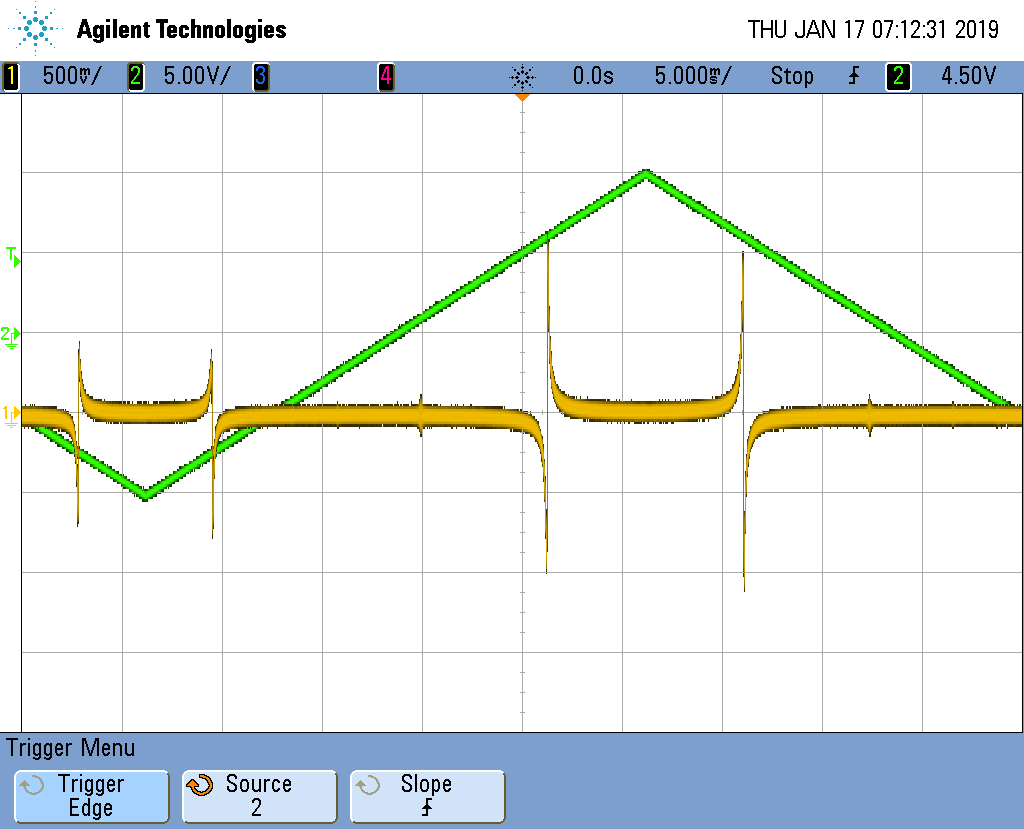
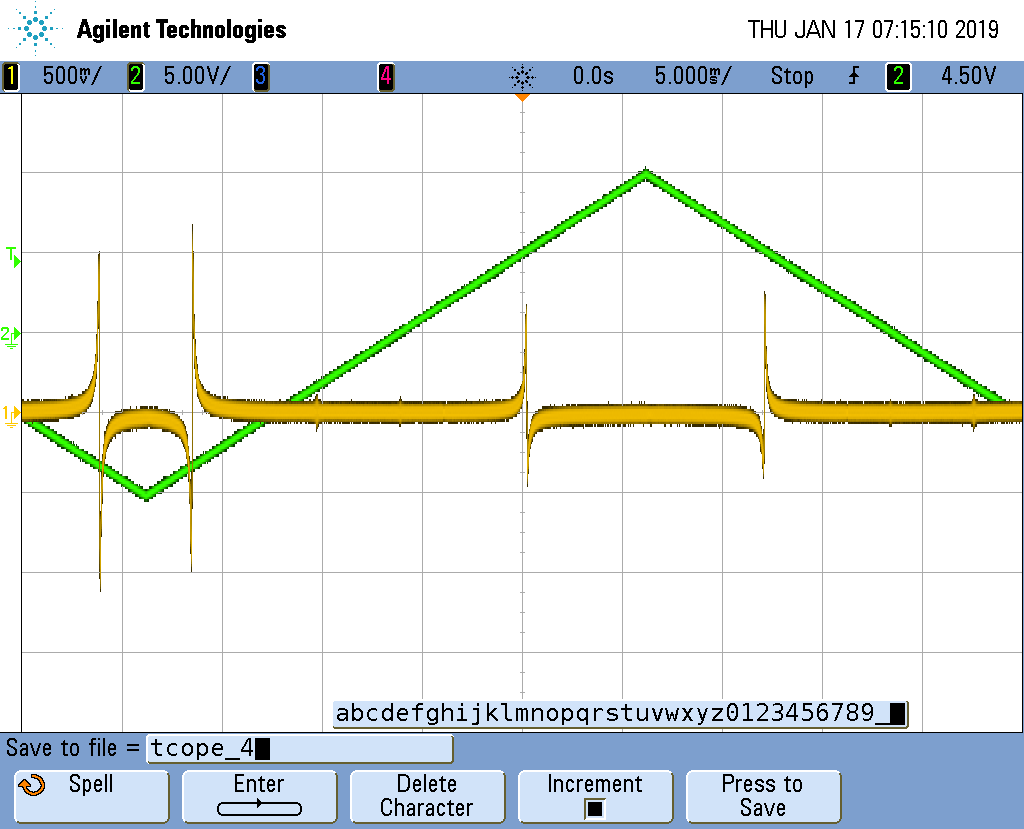
    Attached are transfer function measurements when the input mocdecleaner was unlocked and locked respectively (IMCULKD1.tif,
IMCLKD1.tif).  The noise spectra measurements are IMCULN1.tif and IMCLN1.tif respectively.  The mixer calibration was measured
to be 1.93/77.4 V/kHz.

    More to follow ...
Images attached to this report
Comments related to this report
peter.king@LIGO.ORG - 11:44, Thursday 17 January 2019 (46503)
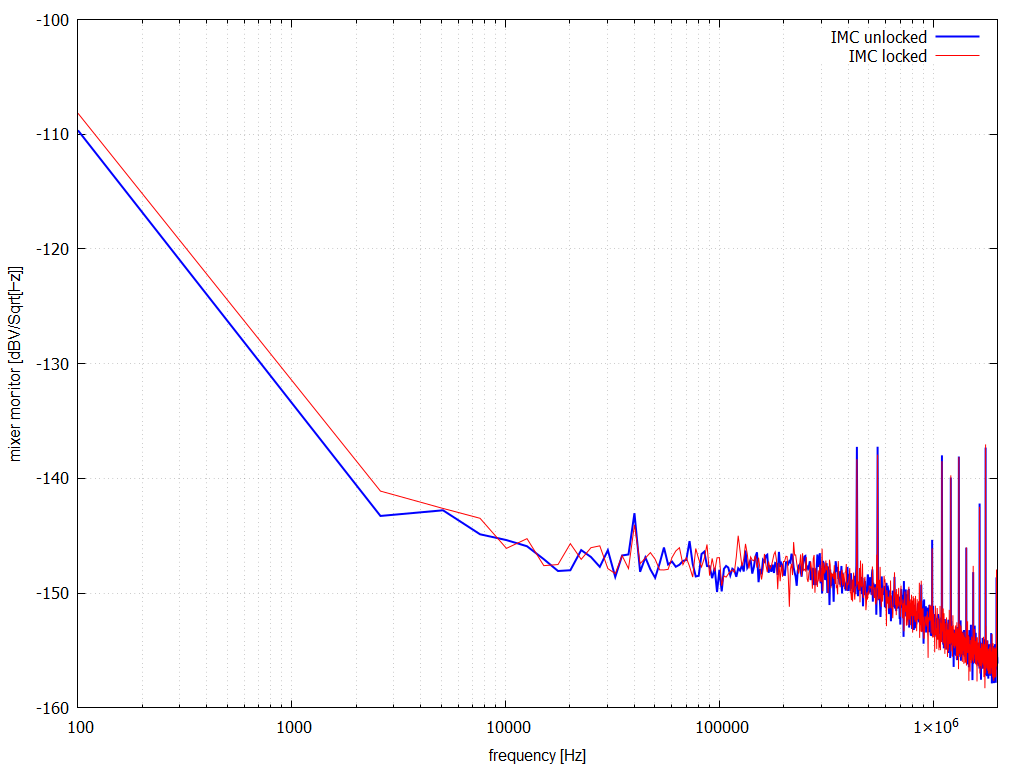
mxr_imc.txt: FSS mixer monitor signal from 100 Hz to 2 MHz, measurement taken with 4395A and active probe
             plotted as hfmxr.png

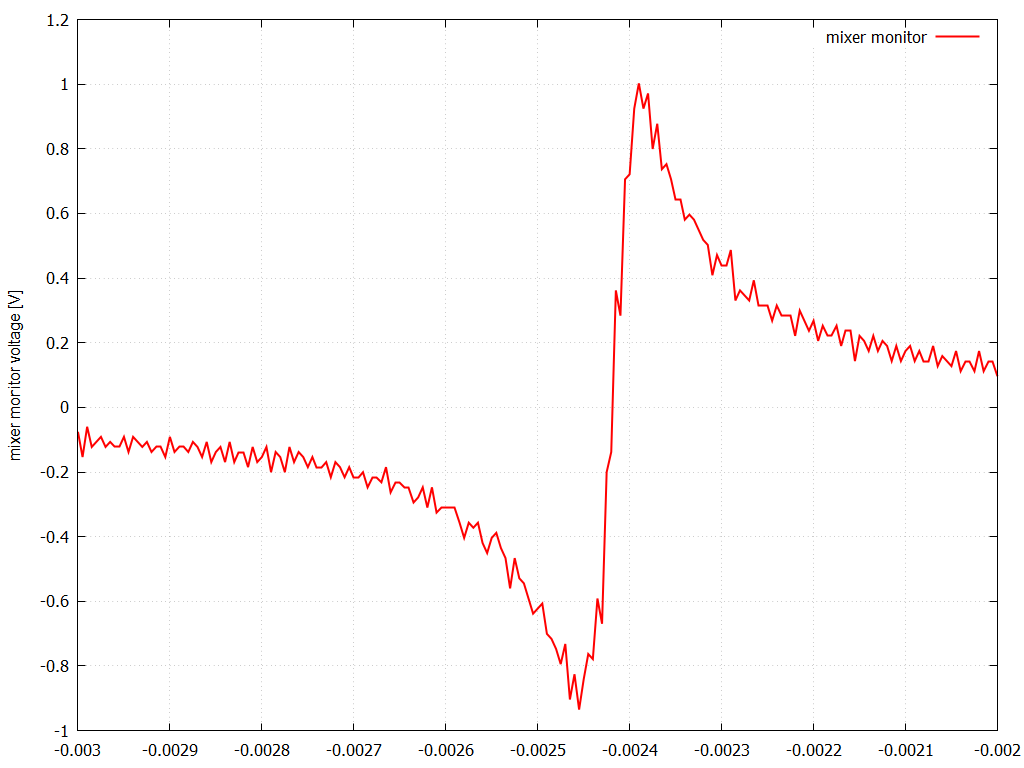
c1.txt: mixer monitor signal at the carrier, zoomed in
        plotted as carrier.png

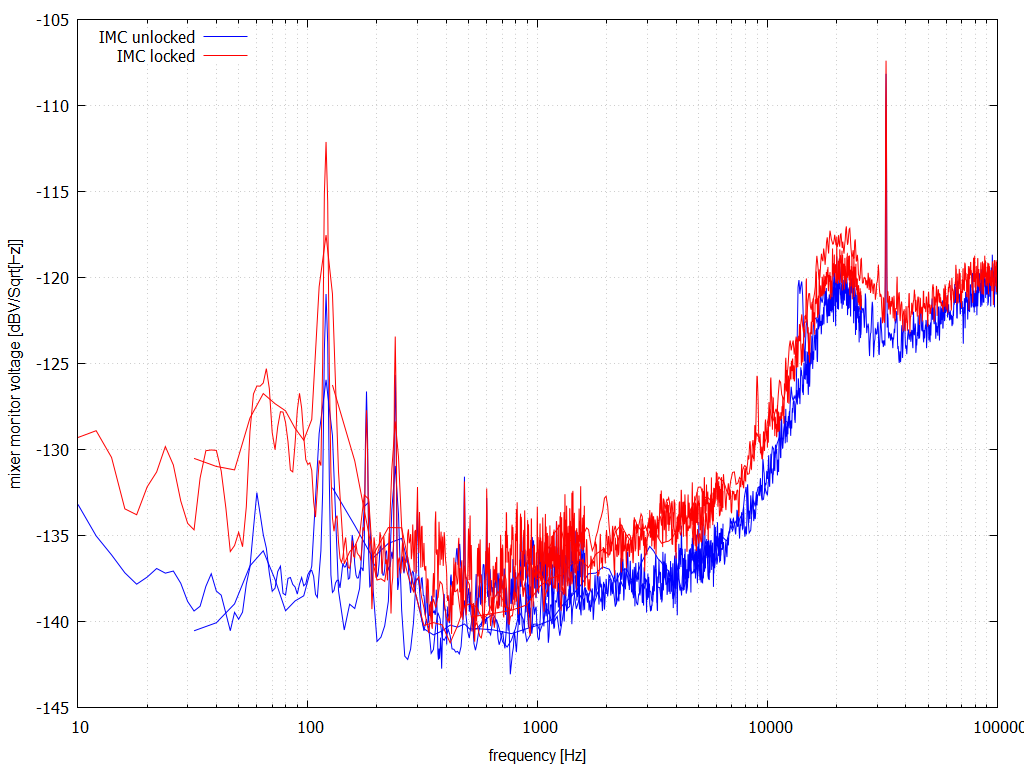
MXR[1-4].txt and MXRIMCL[1-4].txt: FSS mixer monitor signal from 10 Hz to 100 kHz, measurement taken on
                                   SR7855, plotted as mxr.png
Images attached to this comment
Non-image files attached to this comment
craig.cahillane@LIGO.ORG - 17:55, Thursday 24 January 2019 (46631)
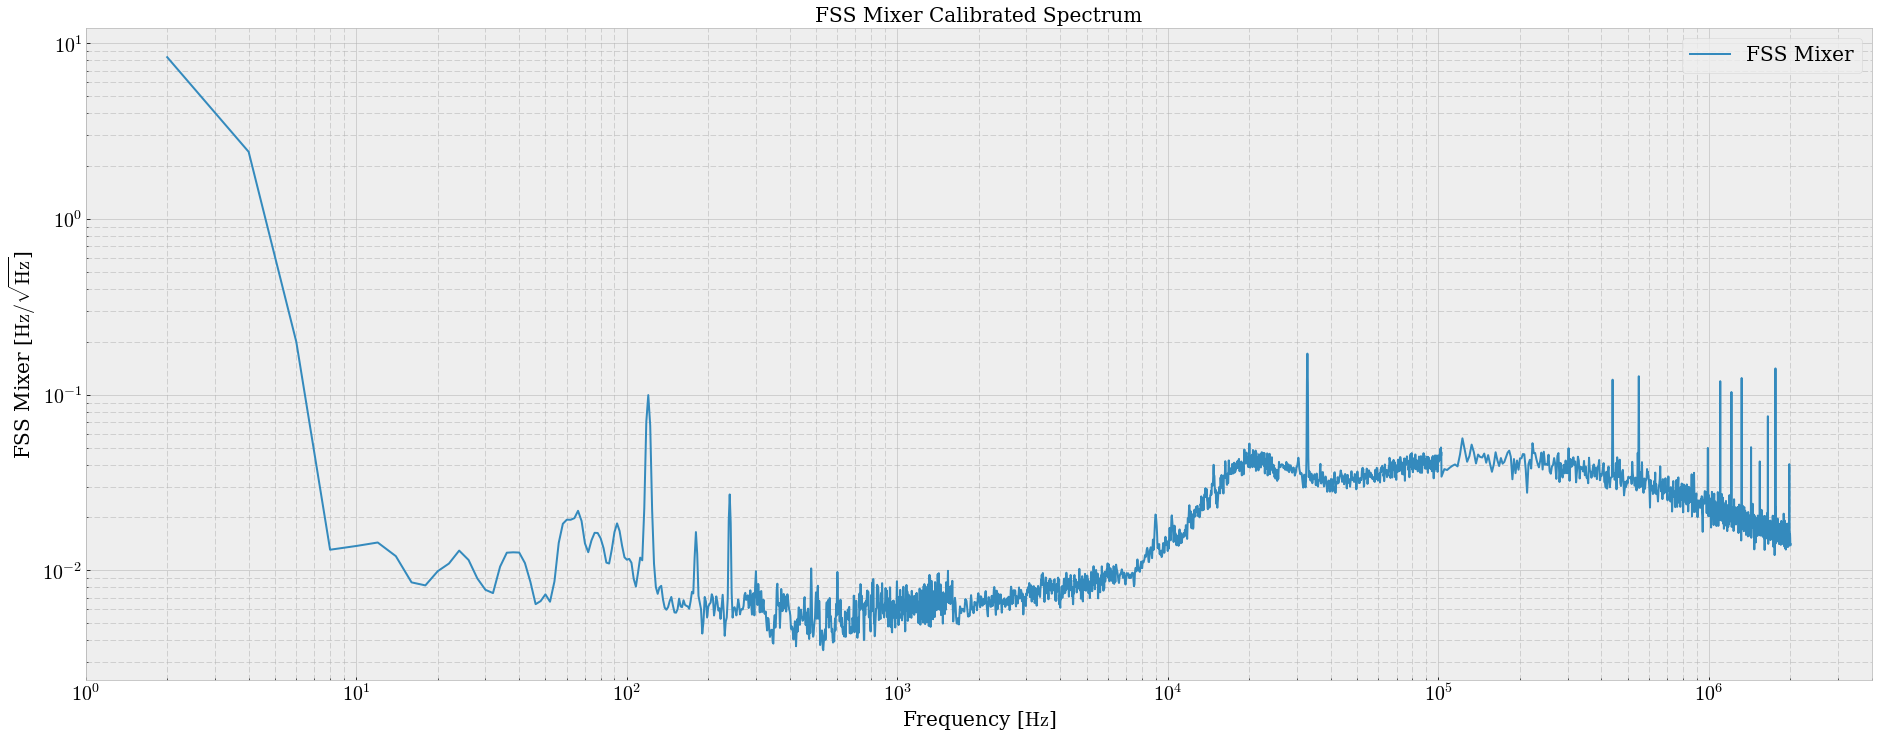
I stitched and calibrated Peter's FSS mixer data with IMC locked from the SR785 and Agilent together, multiplying the Agilent spectrum by a factor of 25 to get them to match up.
Images attached to this comment
Displaying reports 43361-43380 of 88618.Go to page Start 2165 2166 2167 2168 2169 2170 2171 2172 2173 End