Rana, Hang
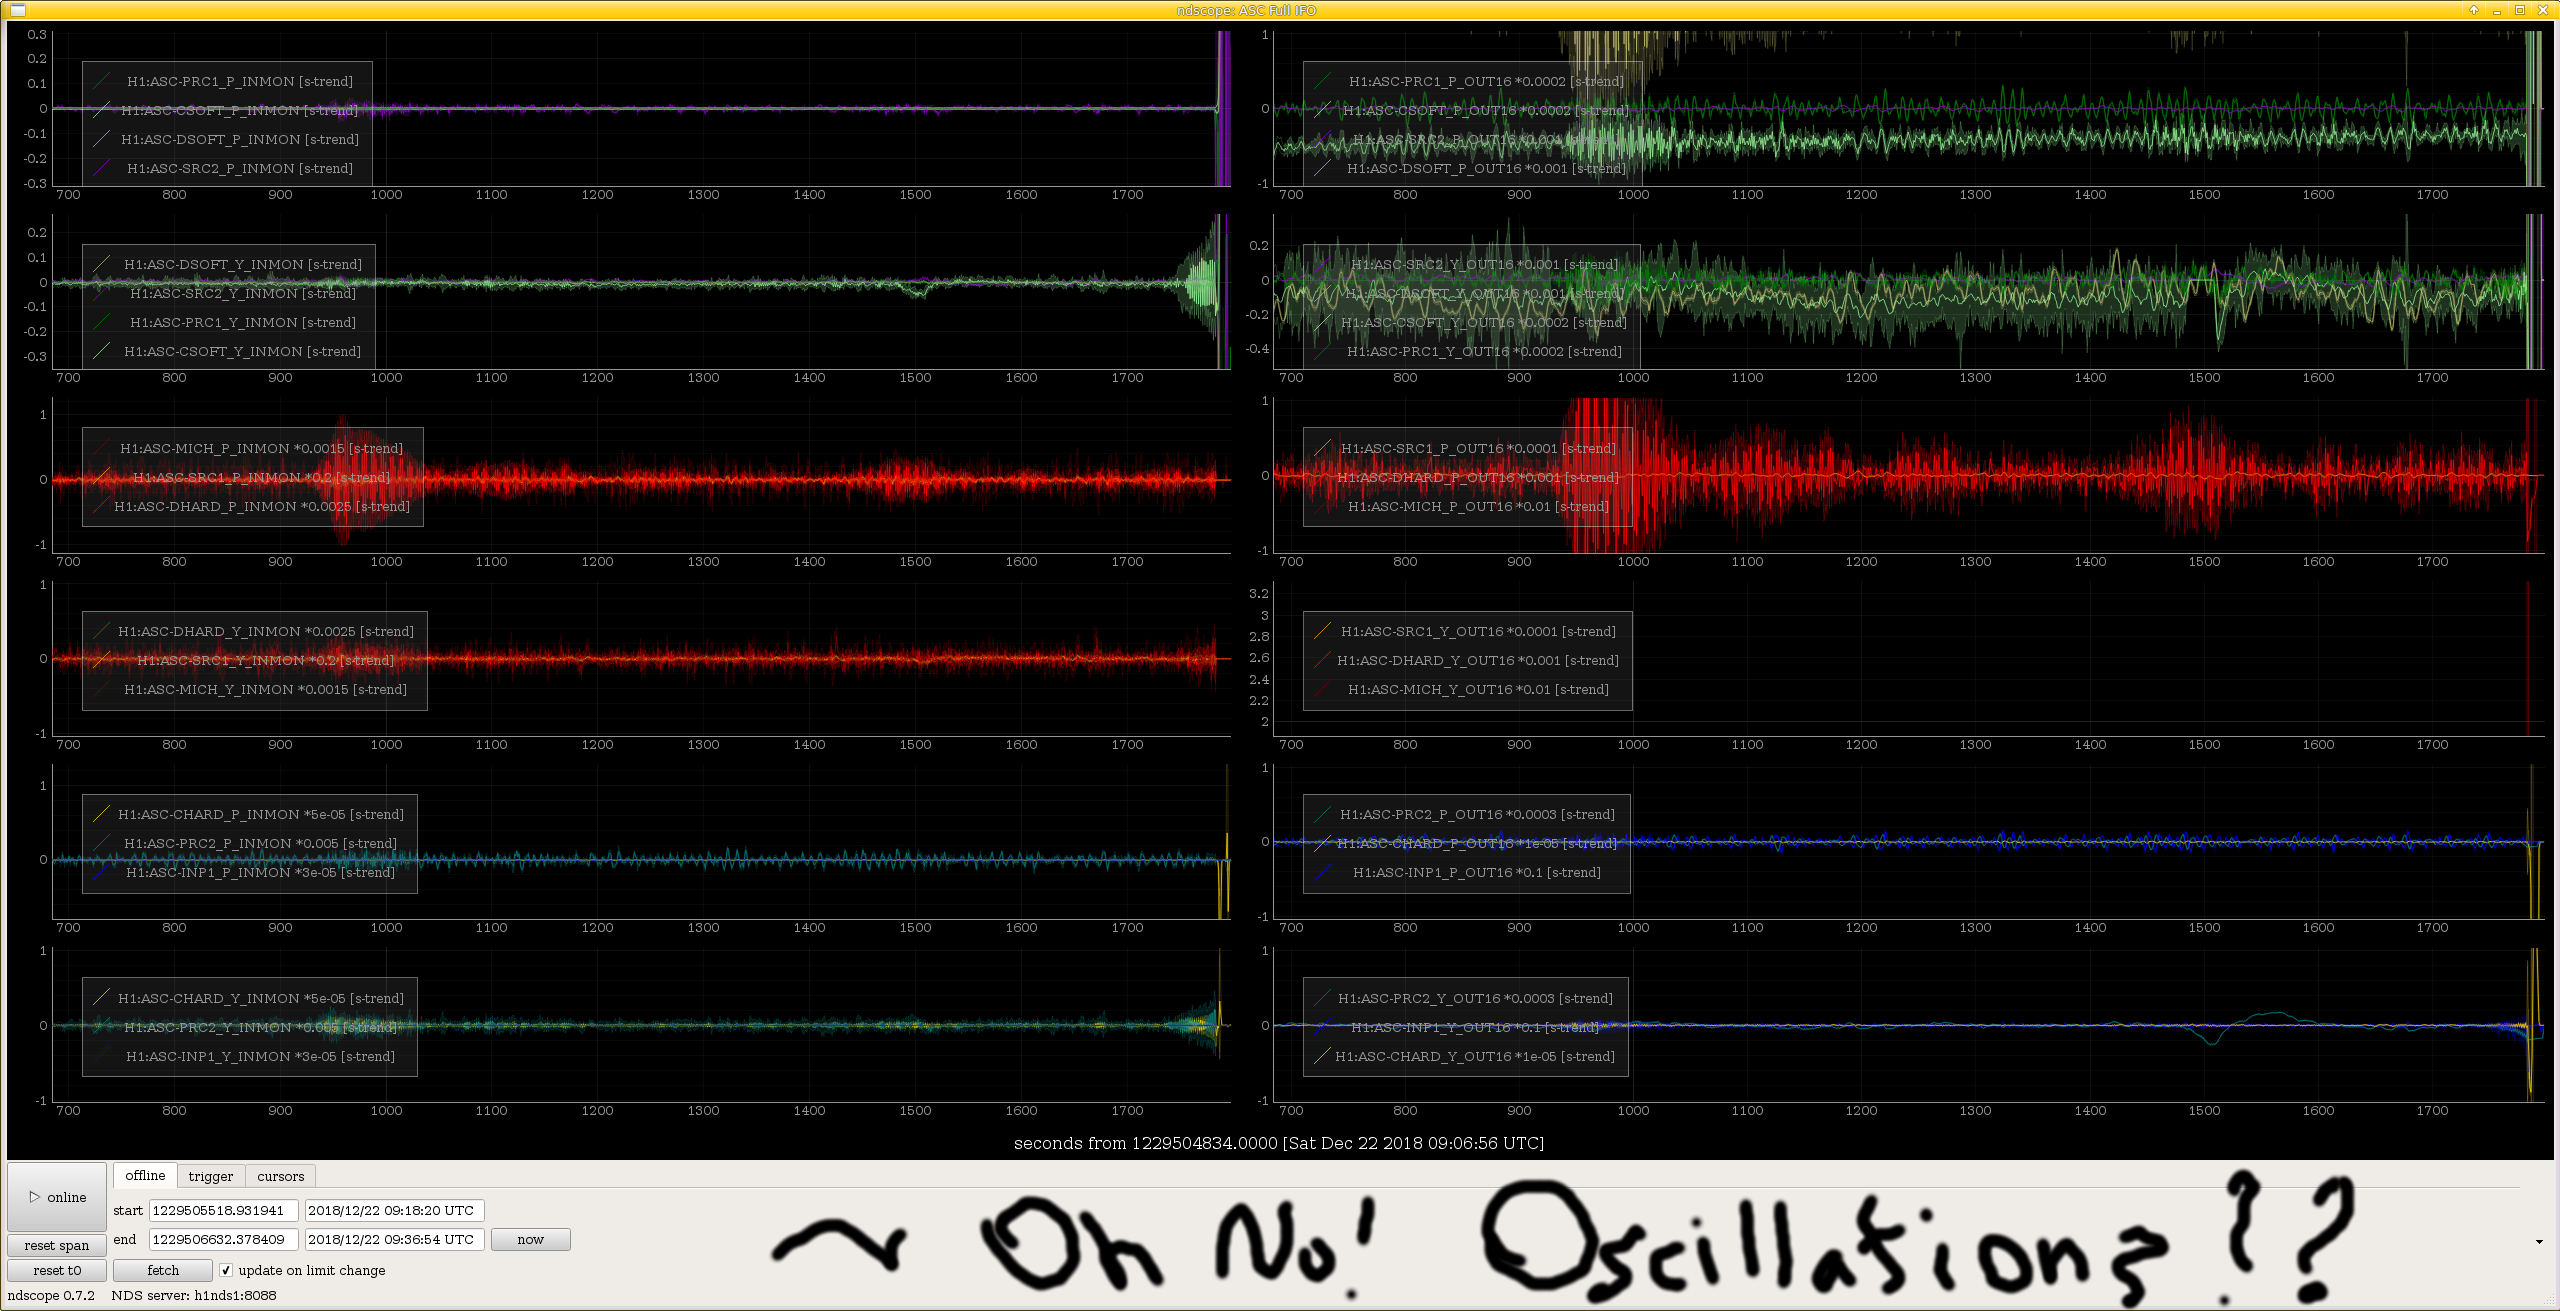
Yesterday we saw the 0.47 Hz oscillation showing up in basically all the PIT ASC loops at 23 W and became unstable at 25 W.
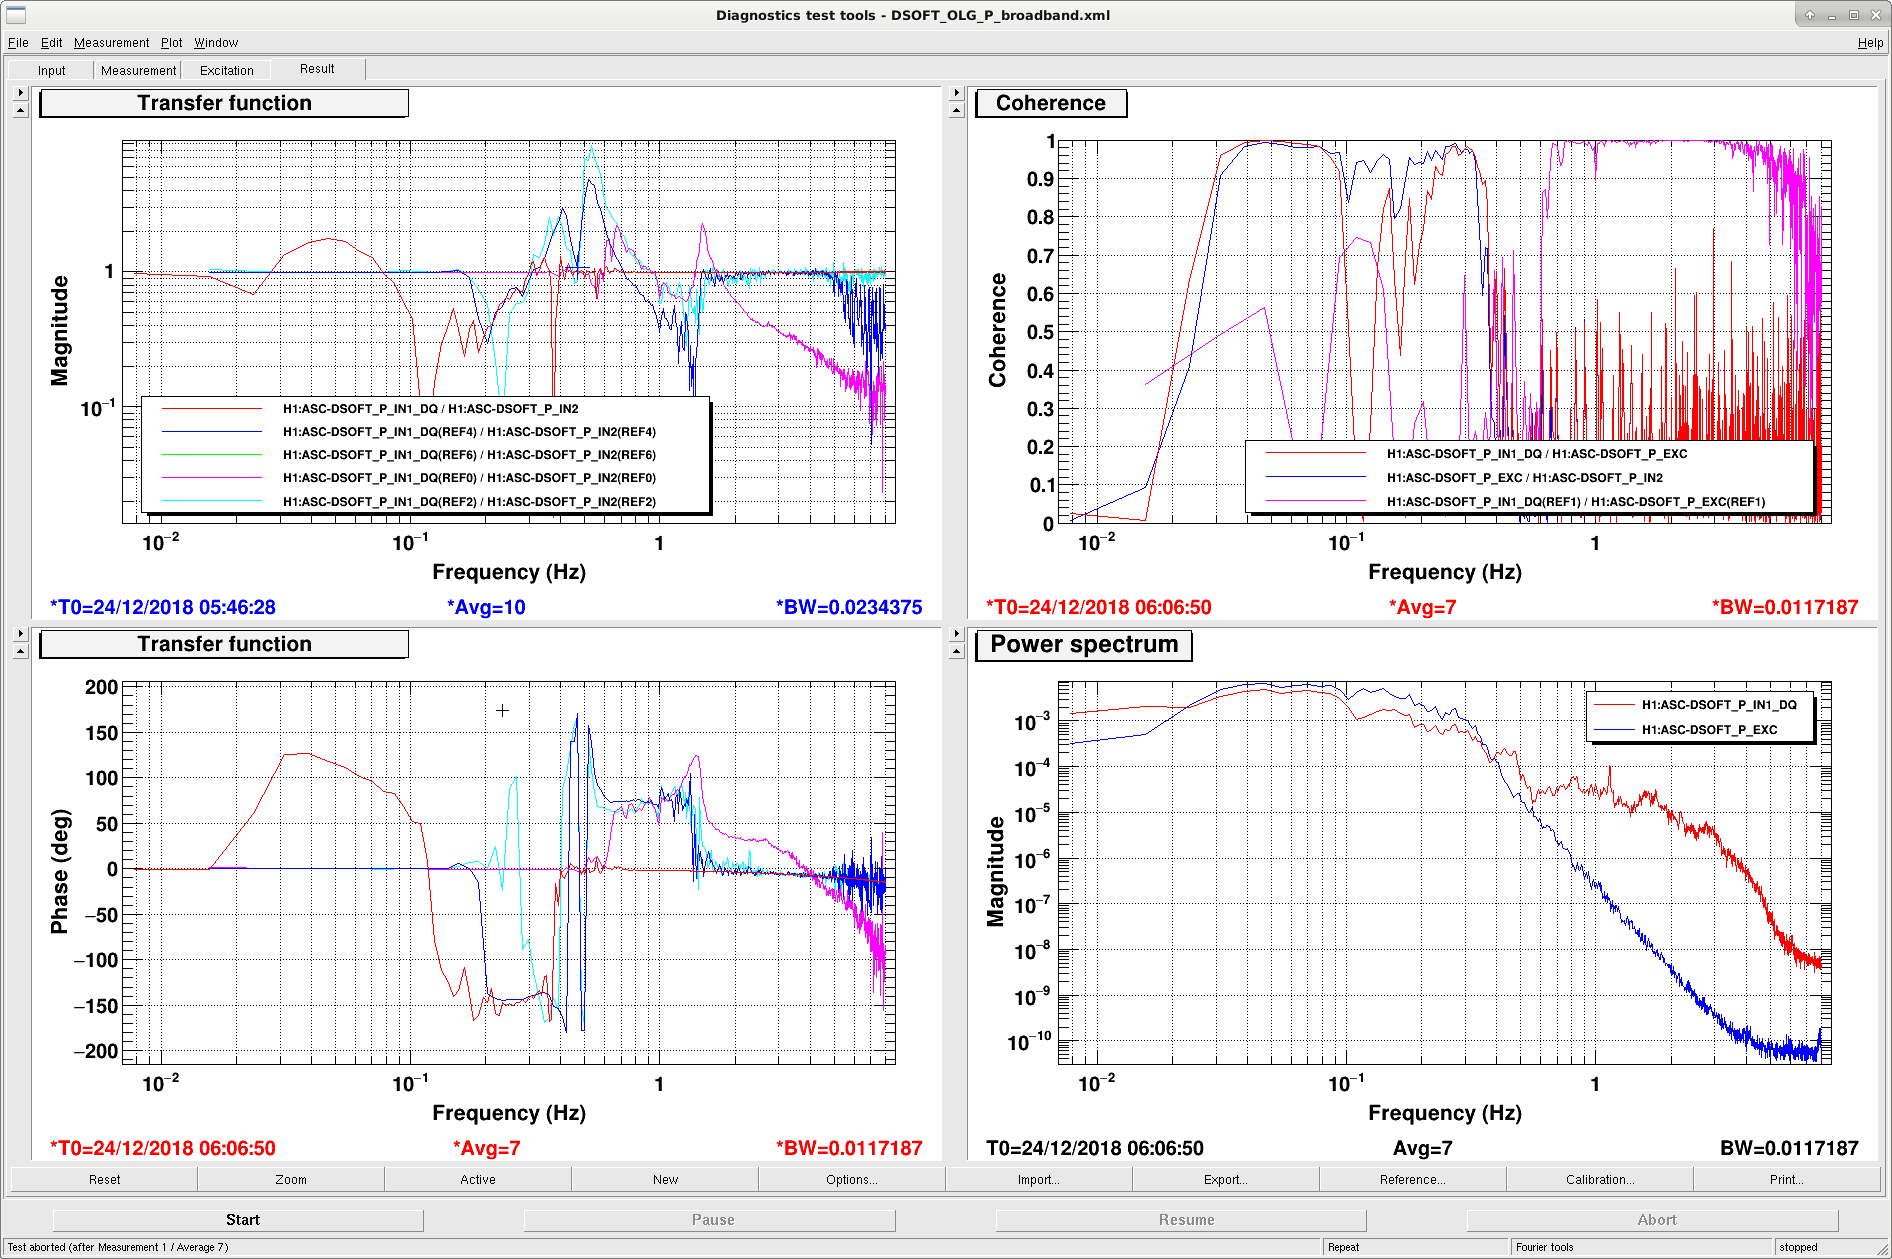
We thus measured DSOFT P OLTF and the result was attached to this entry. The cyan/pink traces were some old measurements done back in October at 2 W. The OLTF measured today at 20 W was the blue/red traces (We have good measurement in the 0.3-0.6 Hz region yet below 0.1 Hz we could not get good). In both measurements we saw a pair of zeros at 0.47 Hz, which was the freq we saw the oscillations.
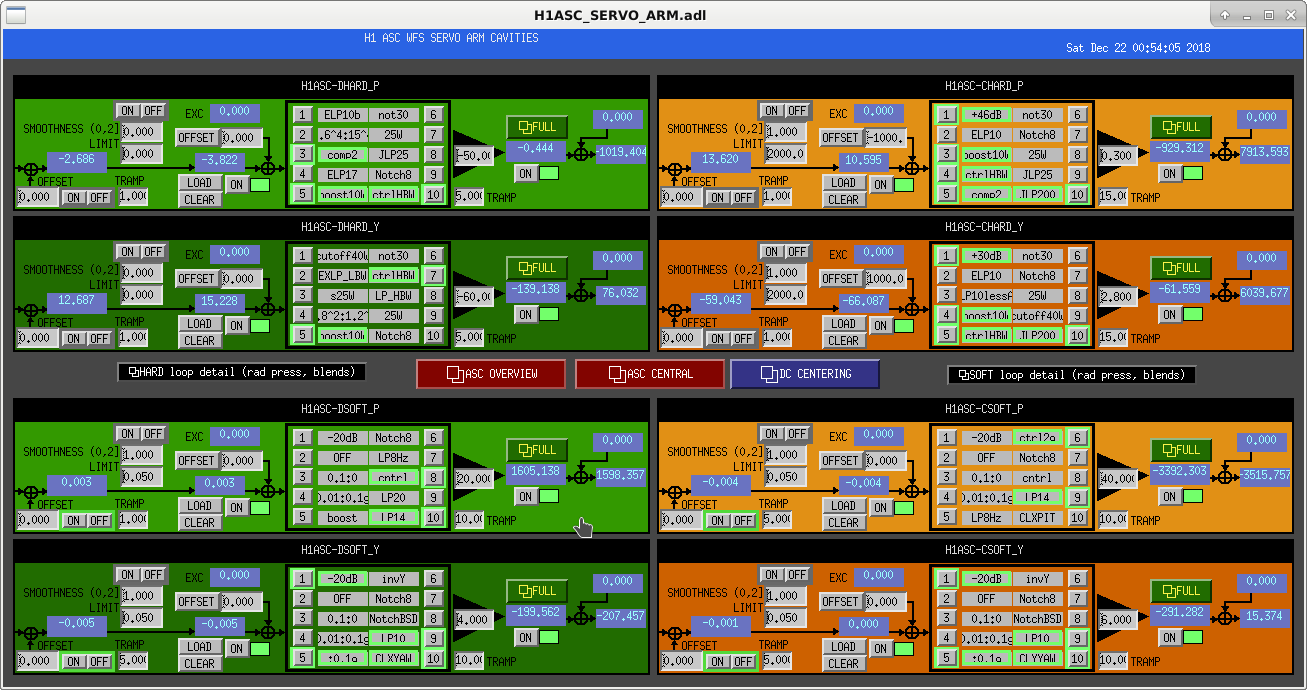
To compensate for this feature, we put resgains at 0.47 Hz with Q of 3 and height of 12 dB in DSOFT P (FM9), DHARD P (added to the boost10W FM5), and CHARD P (added to boost10W FM5). The same filter was also created for CSOFT P yet it didn't seem necessary to engage it for now. After these changes the 0.47 Hz feature was basically removed from the PIT loops at 23 W.
An oscillation at similar frequency also appeared in CHARD YAW, and it was mitigated if we turned off the FM4 boost10W filter in CHARD YAW.
With those modifications we did not see oscillations at 23 W any more.
====================================================
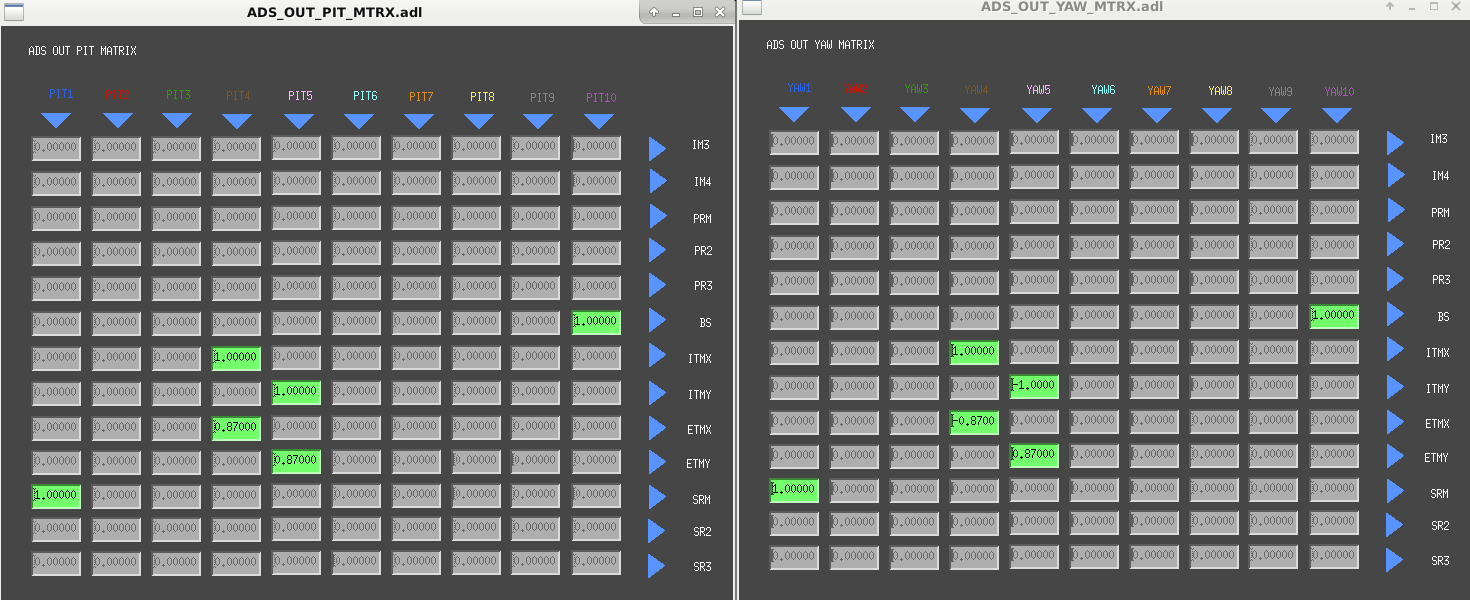
In addition, we also improved our DSOPT/DHARD PIT decoupling for the B path (AC coupled; for damping the dPdTheta)
The new matrix we used for DSFOT P B path input was
| TRX_A | TRX_B | TRY_A | TRY_B | |
| -0.0193 | 0.0176 | 0.00335 | -0.08375 | DSOFT_P B |
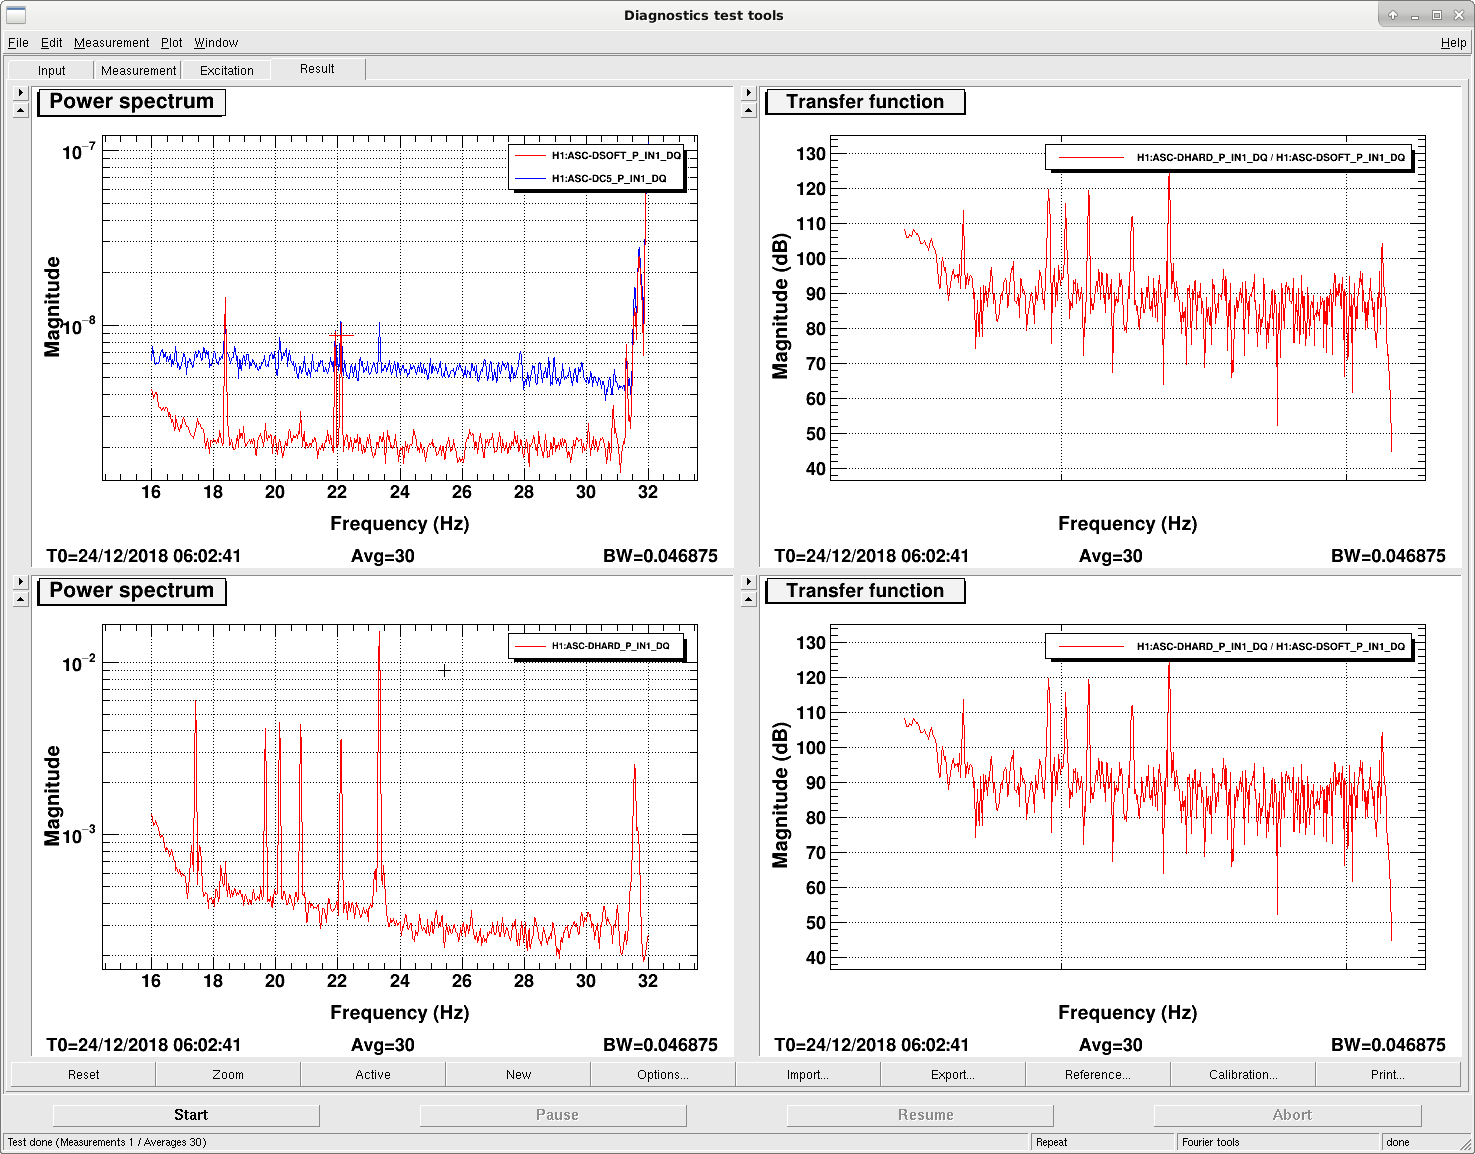
In the second attached plot we compared the performance of this new input matrix to the old one (routed to DC5). The DHARD dither was at 23.3 Hz and the DSOFT dither at 21.1 Hz.
The new input matrix not only rejects hard mode much better, but also has a significantly improved SNR.
most of the ASC filter banks have a lot of junk loaded in that's the dregs of history. Many of the filters have a name like '2.3t' which mean nothing. Some of the low pass filters have extra notches placed to handle suspension resonances rather than as a real low pass.
We're starting a cleanup with PRC1. I deleted several unused filters. PRC1 pit and yaw now use the same filters. Since we only use this for sub-Hz control, there's no need to put little notch tweaks at ~3 Hz any more. The subtle ELF filters have been replaced with elliptic low pass.
In the attached plot, the CYAN + BROWN + MAGENTA were the old filters. In the new loop, magneta is gone and Brown has been replaced w/ Orange. Works fine like this.
The new FM5 is a 0.1 Hz AC coupling filter. We turn it on once we turn on the dither loops so that PRM is used to center the beam on ITM, and we just use POP QPD for AC control of PRM.

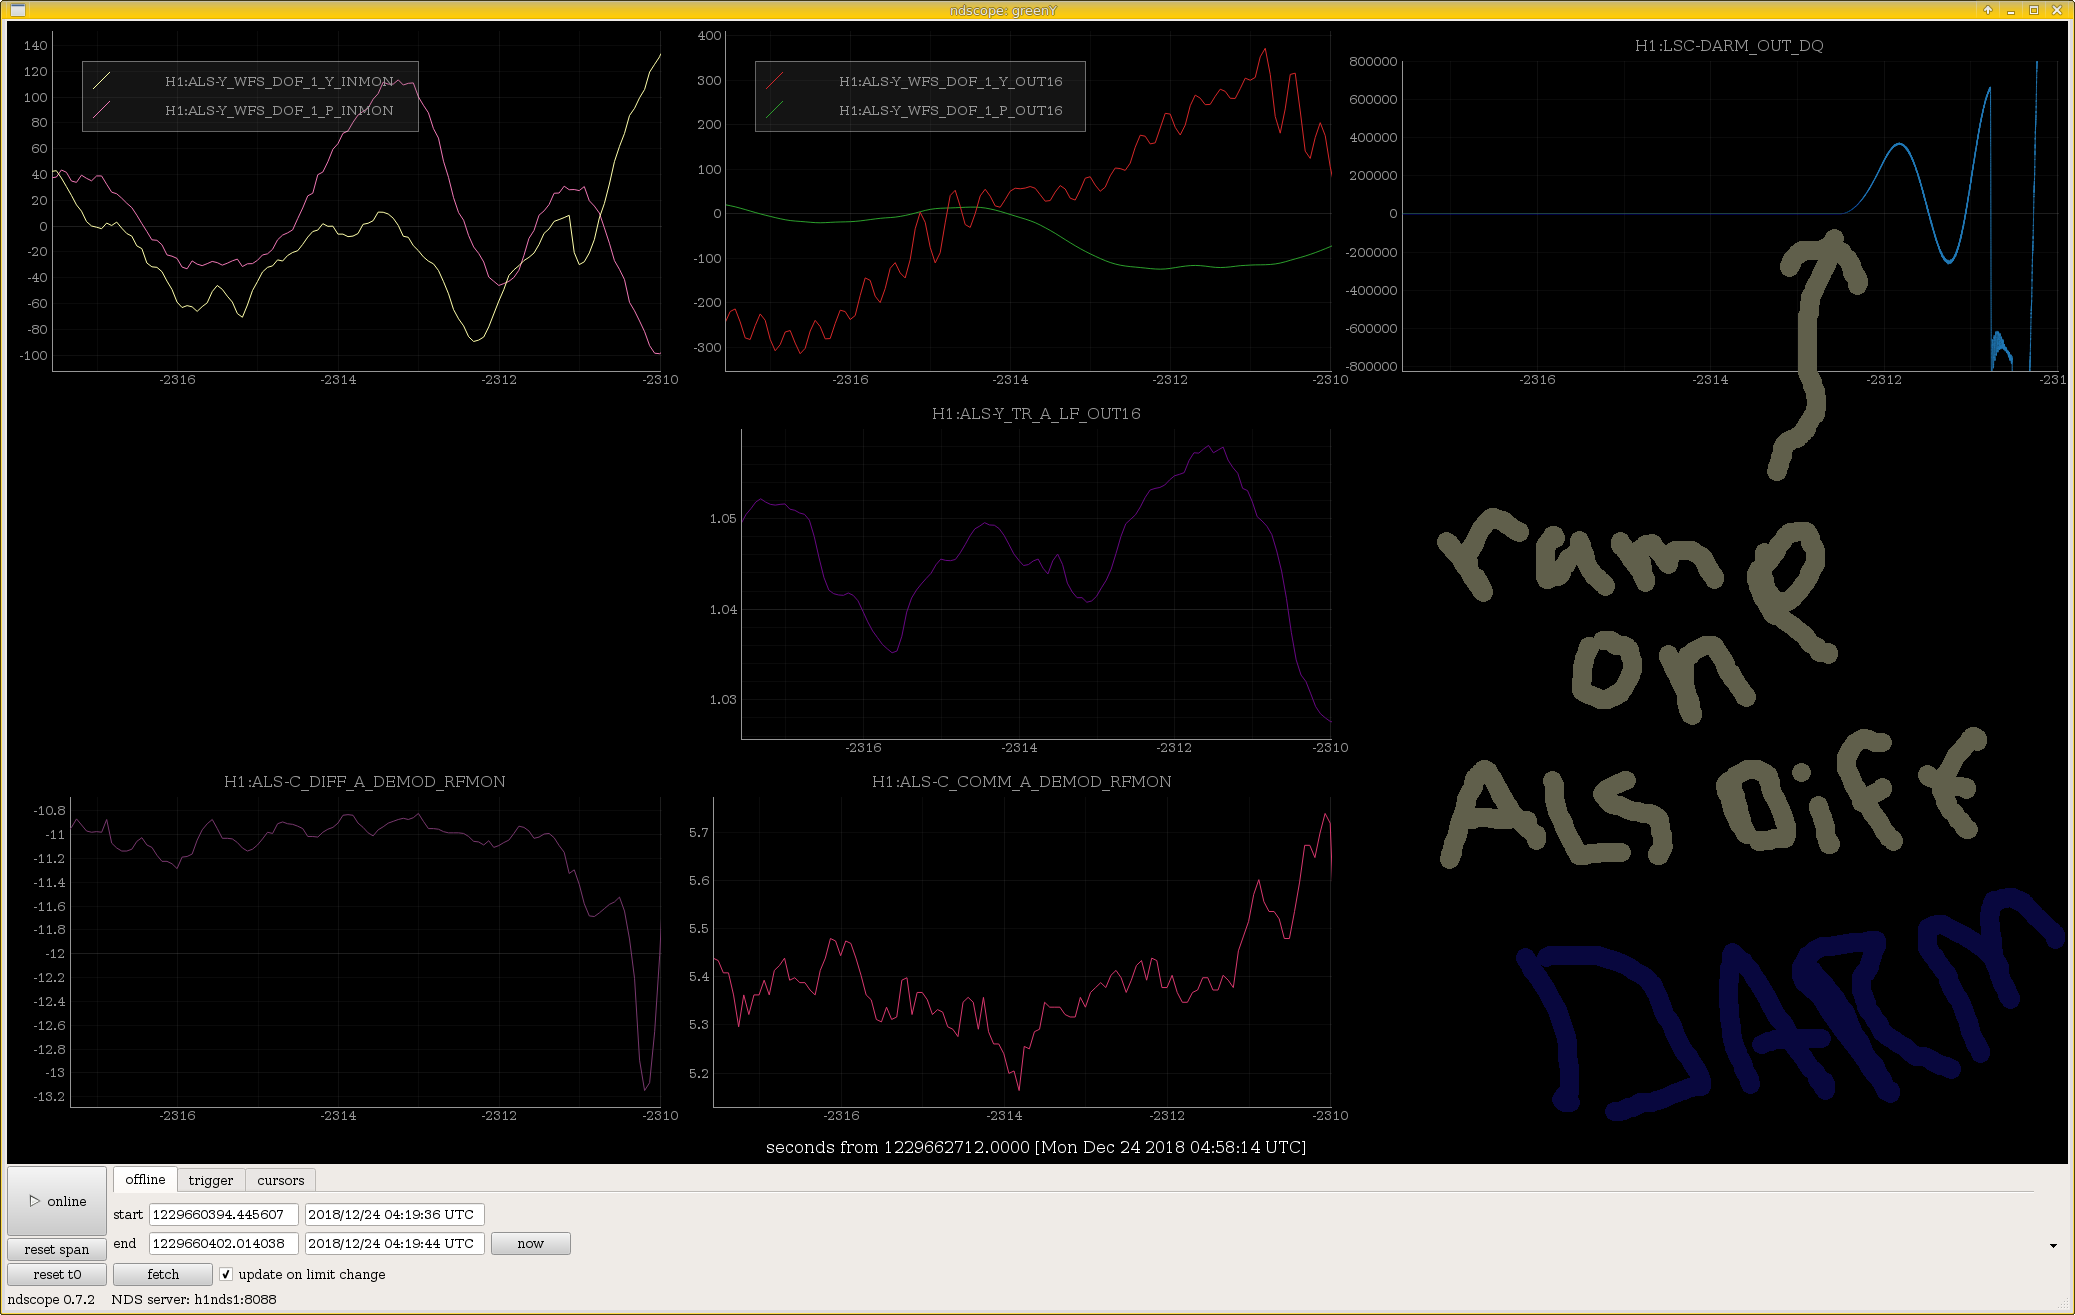
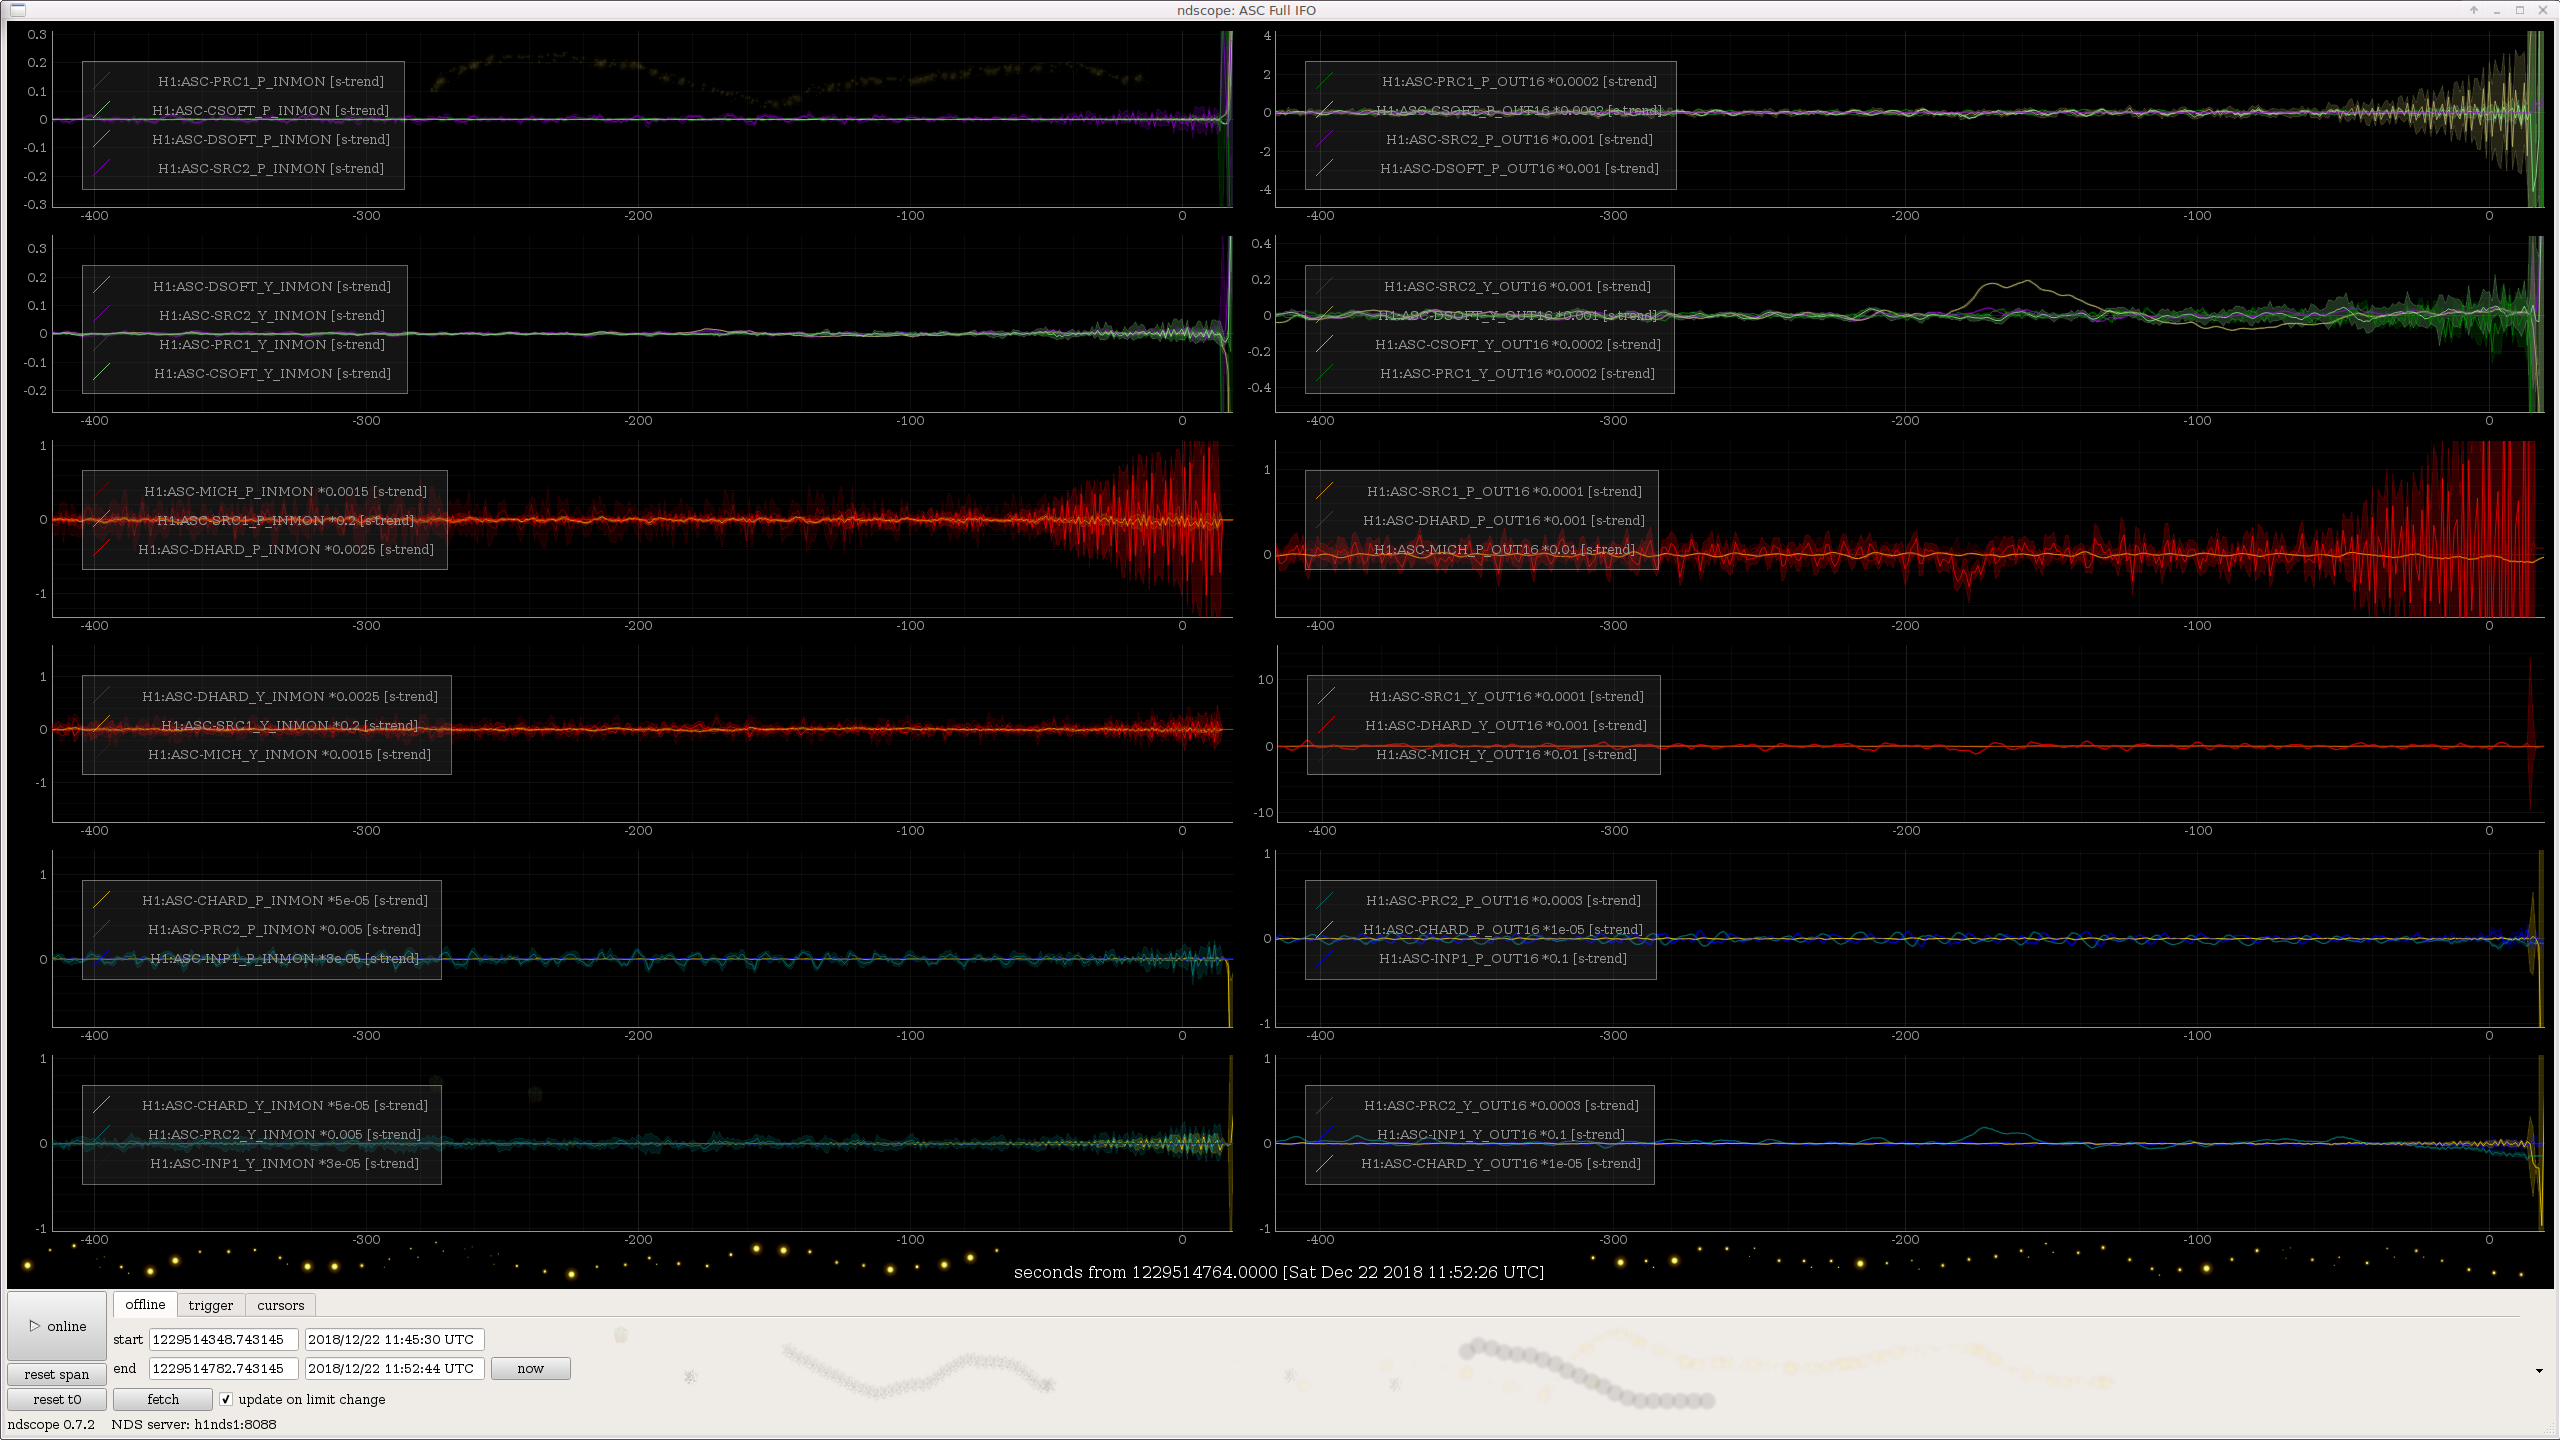
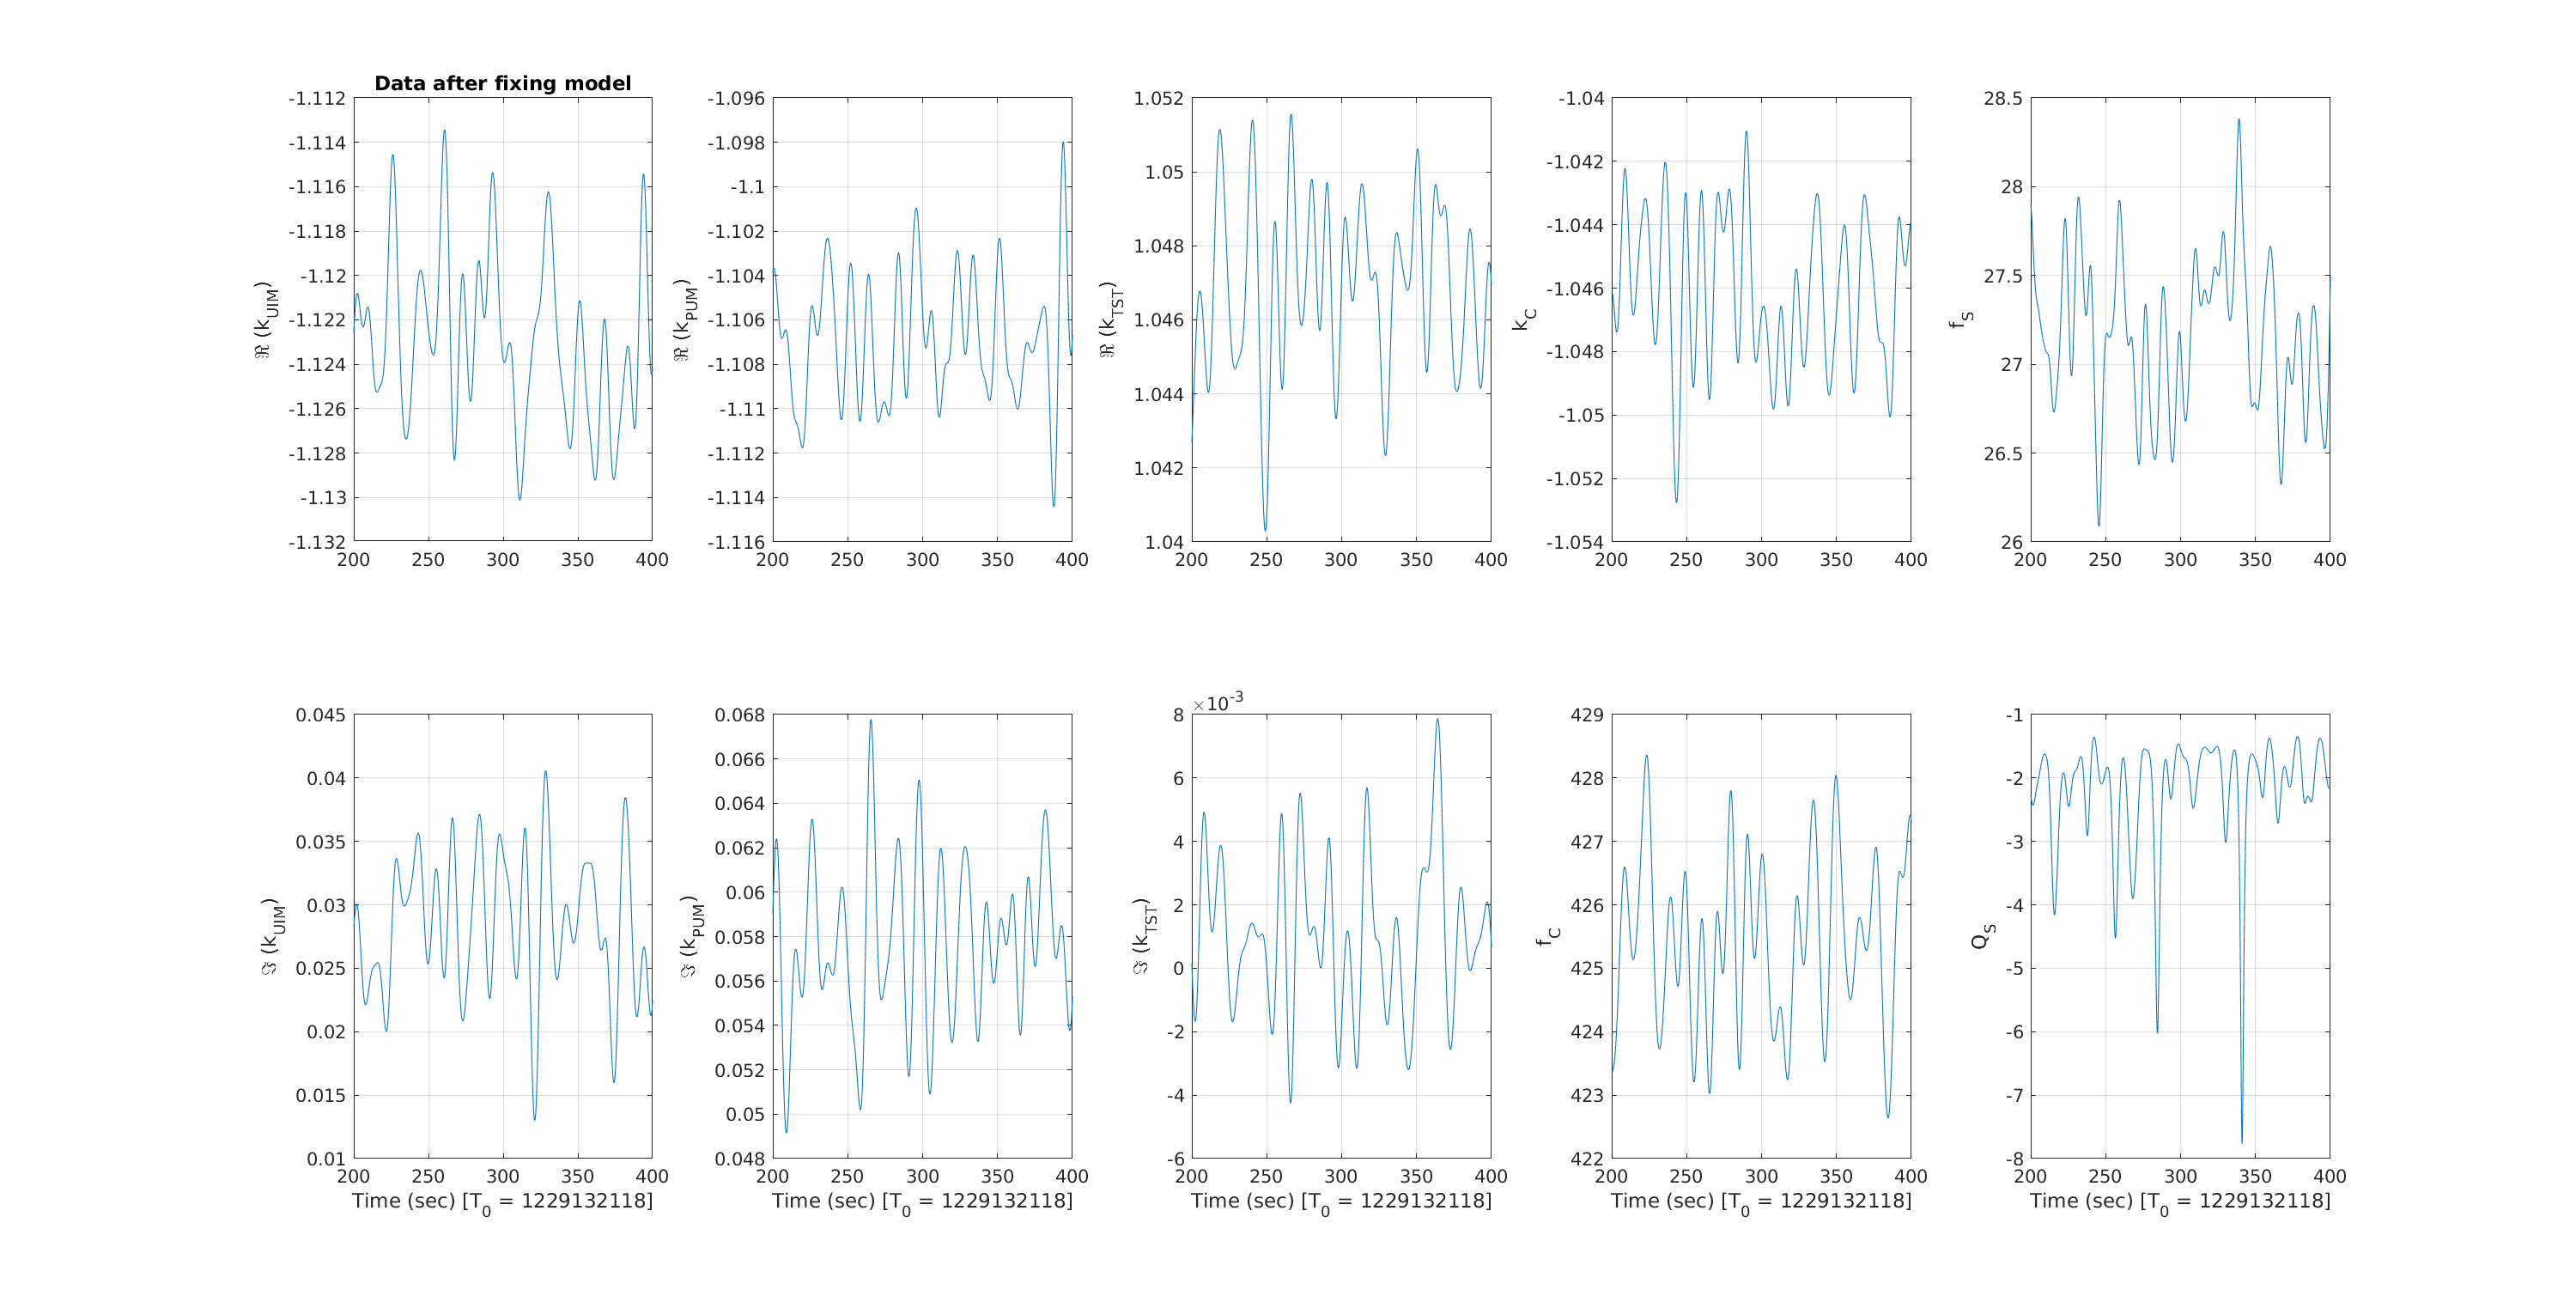
Just FYI, here are the hard/soft control signals after Hang added the RG to compensate the 0.5 Hz zero. These are driving the PUM (and TOP below 0.1 Hz) so you may multiple by 1/f^4 above a few Hz to convert to angle.

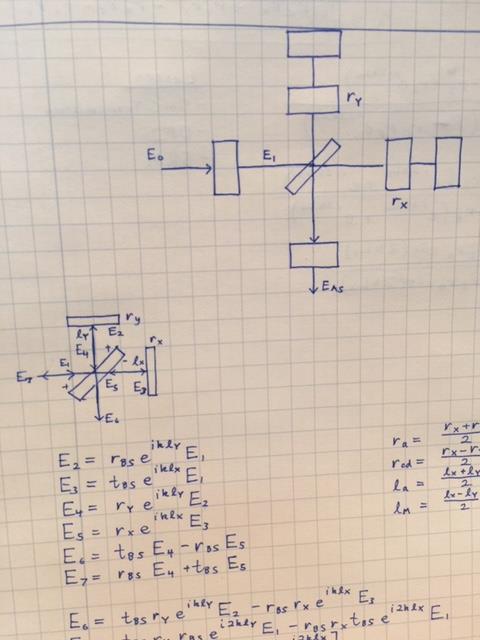
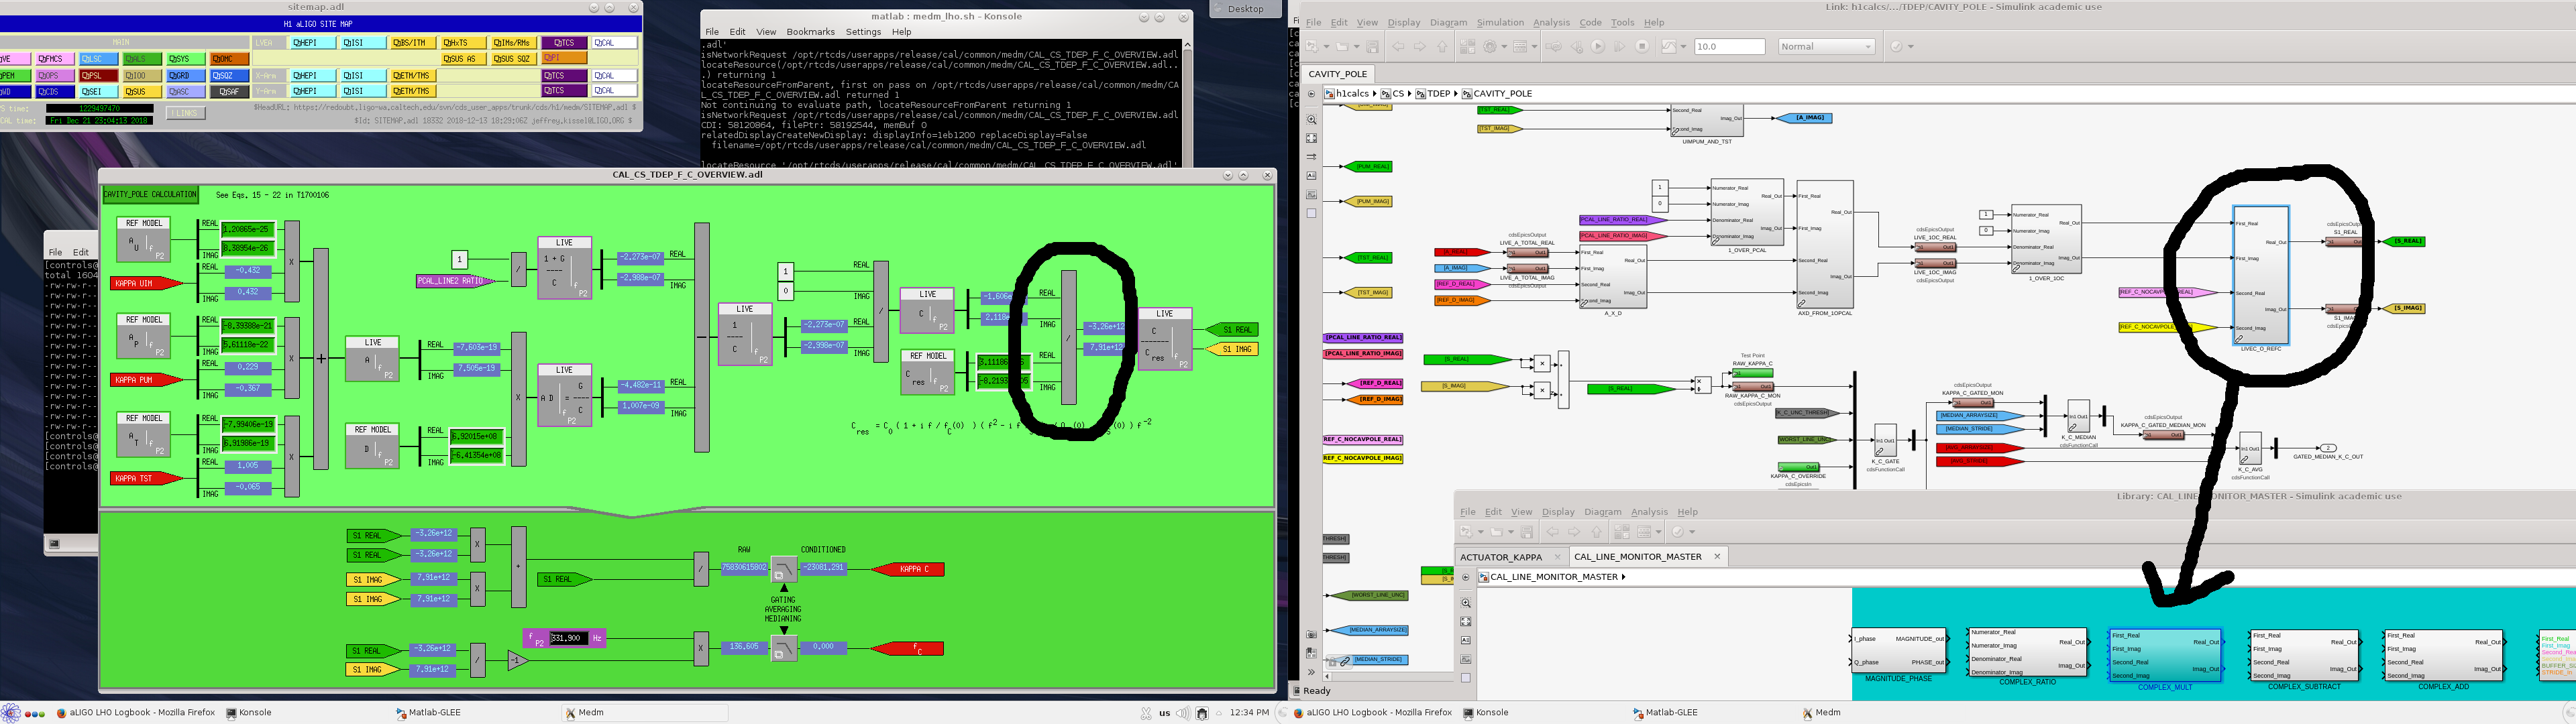
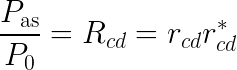 The electric fields associated with this equation are shown in the fourth attachment.
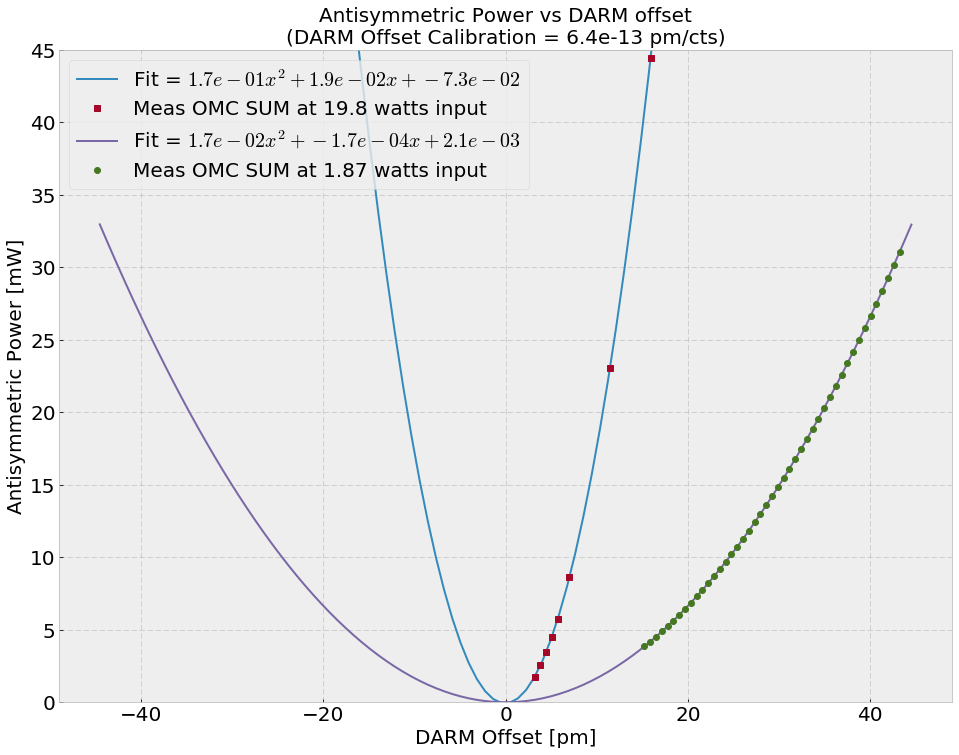
When DARM is locked on RF at 2 watts and the OMC is locked, we get about 11.8 mA, or 14.0 mW of power on the OMC DCDPs. This means the DARM offset is around 29 pm according to
The electric fields associated with this equation are shown in the fourth attachment.
When DARM is locked on RF at 2 watts and the OMC is locked, we get about 11.8 mA, or 14.0 mW of power on the OMC DCDPs. This means the DARM offset is around 29 pm according to 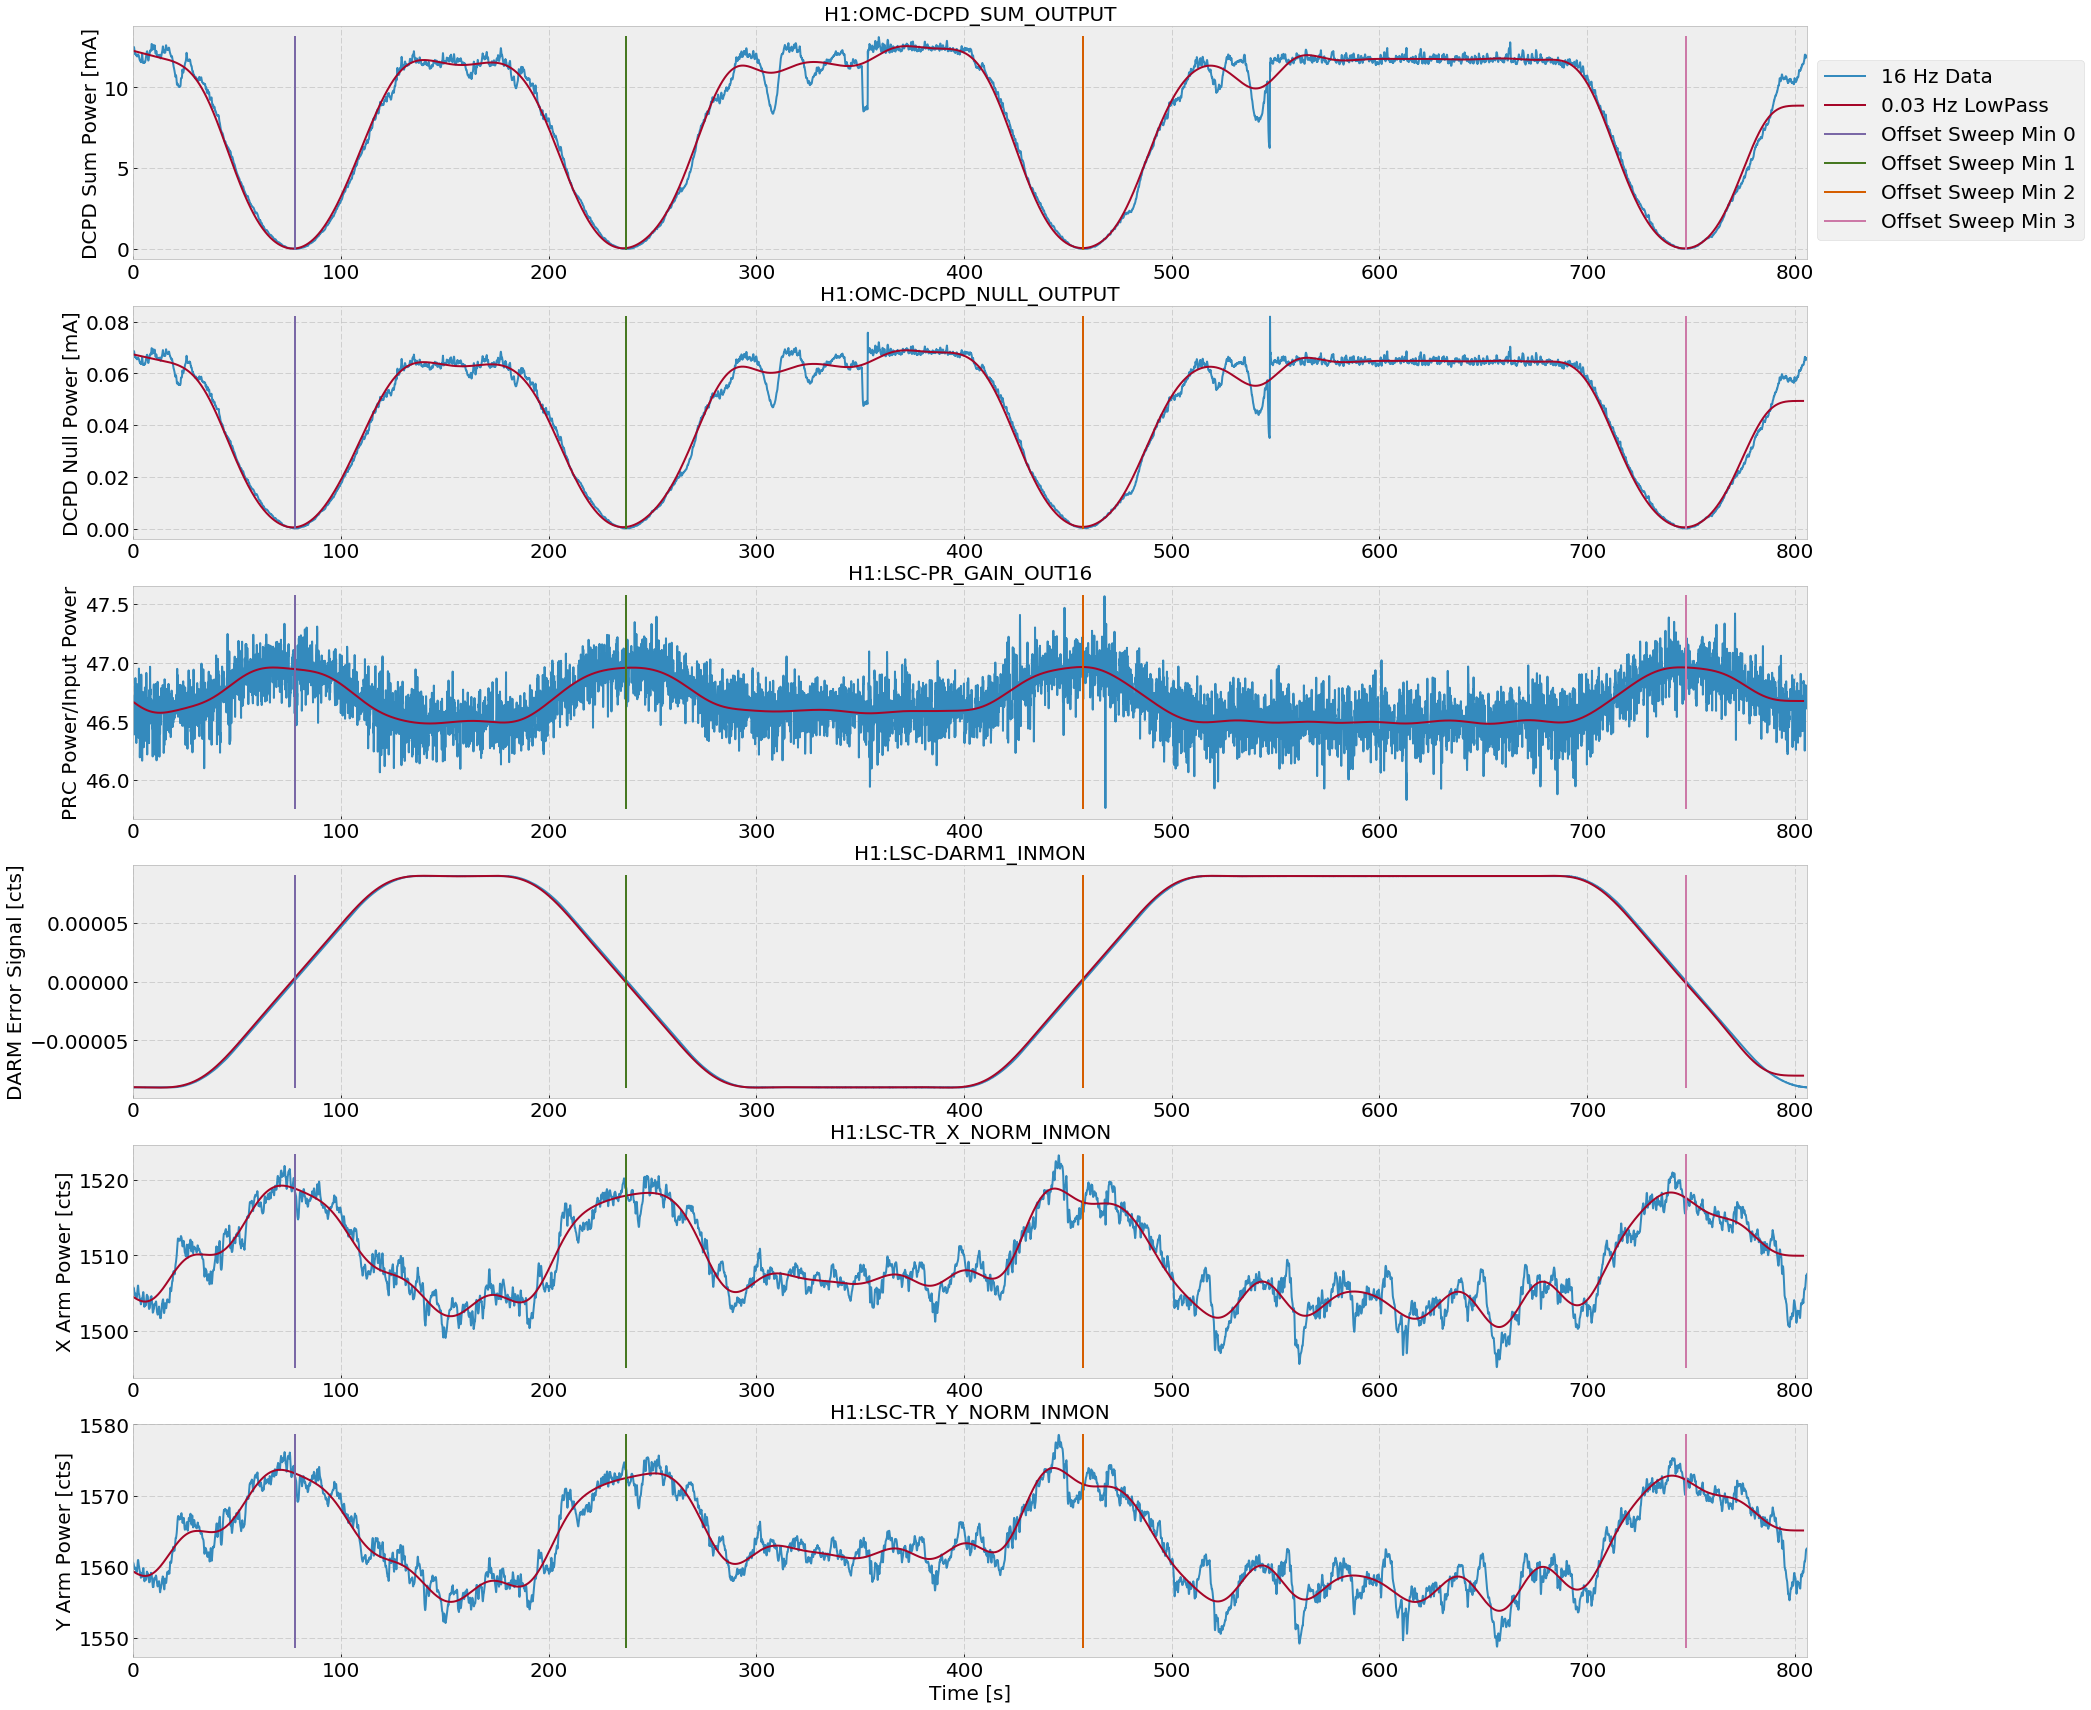
