david.barker@LIGO.ORG - posted 11:27, Monday 16 July 2018 (42918)
Restarted all models on h1iscey
Following crash due to activity in EY CER.
Following crash due to activity in EY CER.
There is plans for ISS work tomorrow morning during Maintenance.
We are laser HAZARD in the LVEA.
Laser Status:
SysStat is good
Front End Power is -0.003878W (should be around 30 W)
HPO Output Power is 0.2576W
Front End Watch is GREEN
HPO Watch is RED
PMC:
It has been locked 3 days, 2 hr 56 minutes (should be days/weeks)
Reflected power = 20.37Watts
Transmitted power = 48.31Watts
PowerSum = 68.68Watts.
FSS:
It has been locked for 0 days 3 hr and 25 min (should be days/weeks)
TPD[V] = 2.494V (min 0.9V)
ISS:
The diffracted power is around 2.0% (should be 3-5%)
Last saturation event was 0 days 0 hours and 0 minutes ago (should be days/weeks)
Possible Issues:
Front End Power is Low
PMC reflected power is high
ISS diffracted power is Low
LRA out of range, see SYSSTAT.adl
Items of note are the recent trips of both EX & EY pumps over the weekend (they have since been brought back online this morning). CLOSING this task.
Note: the dataviewer template calls out a few old EX channel names (attached is the matlab Weekly output).

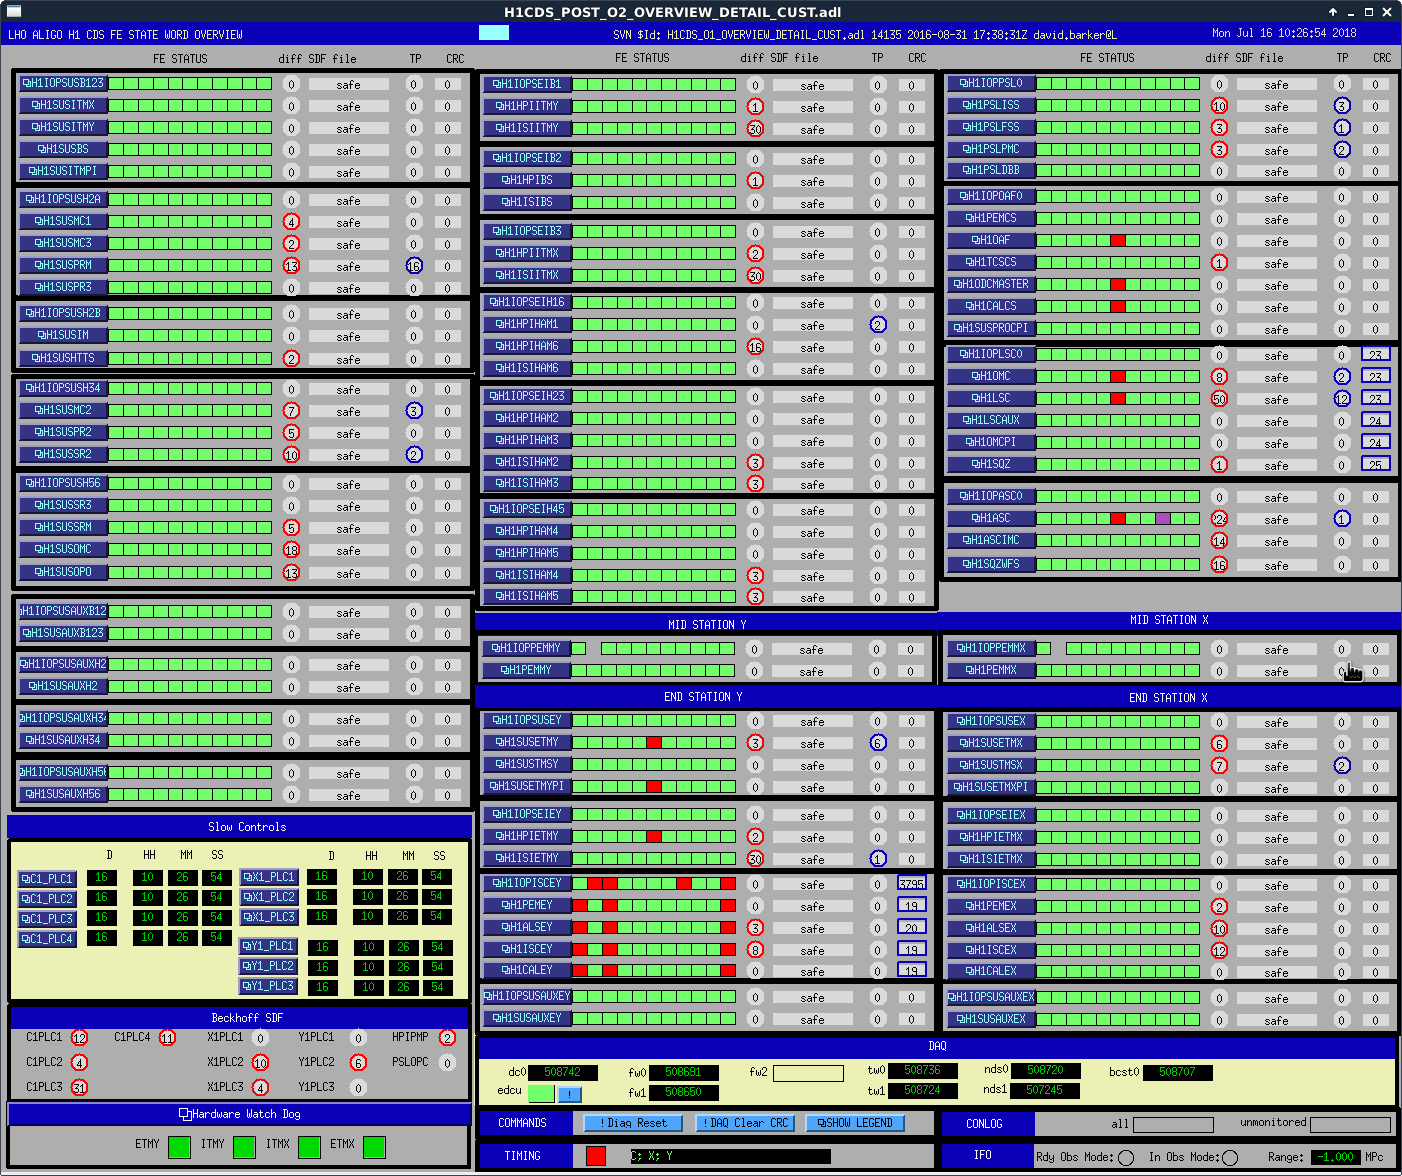
Happen to look up at the CDS Overview to notice a few computer issues (see snapshot).
(edit: did not call Dave since DAQ is OK. Did send him a text....adding to other alarm texts he might already have gotten.)
(Jeff K running meeting.)
Critical Work: PSL & Opening Arms
Safety/Site Note: Unescorted person walked around site & in OSB last week. Jeff
PSL Power Stabilization: Peter
Opening Arms: (Kyle)
TCS: (Thomas)
OPERATORS: Back to COMMISSIONING!! (This was also reiterated in the Ops Meeting last week.)
Other:
SEI:
MAINT: 4hrs only! (depending on PSL work though)
I added 100ml to the Xtal Chiller
TITLE: 07/16 Day Shift: 15:00-23:00 UTC (08:00-16:00 PST), all times posted in UTC
STATE of H1: Commissioning
OUTGOING OPERATOR: None
CURRENT ENVIRONMENT:
Wind: 8mph Gusts, 6mph 5min avg
Primary useism: 0.01 μm/s
Secondary useism: 0.07 μm/s
QUICK SUMMARY:
CP4 LN2 dewar has reached its lower alarm level of 15% full. Chandra has requested this alarm be removed tomorrow, for now it has been bypassed.
Bypass will expire:
Mon Jul 16 11:31:08 PDT 2018
For channel(s):
H0:VAC-MY_CP4_LT255_DEWAR_LEVEL_PCT
Summary: This I/O chassis has much lower contamination from fans and power supply magnetic fields than previously tested I/O chassis. Coherence between magnetic fields produced by the power supply and the fans and empty ADC channels was less than 0.001. However, there is slight coherence between empty ADC channels, and I suggest a future test with a linear supply providing the 24V power.
Previous I/O chassis models have had small cooling fan peaks evident in all tested empty ADC channels (https://alog.ligo-wa.caltech.edu/aLOG/index.php?callRep=17944). These features can appear in real data when the signal is near the ADC noise floor (https://alog.ligo-wa.caltech.edu/aLOG/index.php?callRep=11931 , https://alog.ligo-wa.caltech.edu/aLOG/index.php?callRep=2895 ). These investigations showed that the fans coupled by power supply ripple, not magnetic fields.
In addition, in older versions of the I/O chassis, magnetic fields from the on-board power supplies coupled into ADC channels (https://alog.ligo-wa.caltech.edu/aLOG/index.php?callRep=2895 ). A different power supply in the later I/O chassis versions reduced magnetic fields, in some bands by orders of magnitude, to where the power supply magnetic fields were no longer evident in coherence with blank channels, though the fan peaks were still present (https://alog.ligo-wa.caltech.edu/aLOG/index.php?callRep=17944 ).
We tested the latest I/O chassis in the H2 room test stand, using a magnetometer to identify the fan peaks and detect fields emitted by the power supply and other electronics. To identify the fan peaks in the magnetic spectrum, I partially covered the fan ports with paper in order to manipulate the fan rotation frequency (Figure 1).
Figure 2 shows the magnetic field spectra and the coherence between the magnetometer channel and blank channels. No coherence is evident, at a coherence level of less than 0.001, with either the fan peaks (the broad peaks just to the right of 60 Hz harmonics), or the broad signal from other electronics. The broad band fields from the power supply were roughly three times lower than from even the best previously tested I/O chassis, (https://alog.ligo-wa.caltech.edu/aLOG/index.php?callRep=17944 ).
Figure 3 shows spectra for all empty ADC channels, showing that fan peaks were not evident in 5000 averages but that there were small features that appeared in all channels, behaving like intermodulation peaks between high frequency signals. These features produce coherence between empty channels, shown in Figure 4. The lack of coherence demonstrated in Figure 2 indicates that this contamination is not due to magnetic field coupling.
One possibility is that these small features are associated with the 24 V supply to the chassis, which is now from a Sorenson switching supply. I have left the test setup in place so that the 24V supply can be replaced with a linear supply for a future investigation.
Robert, Dave, Jonathan
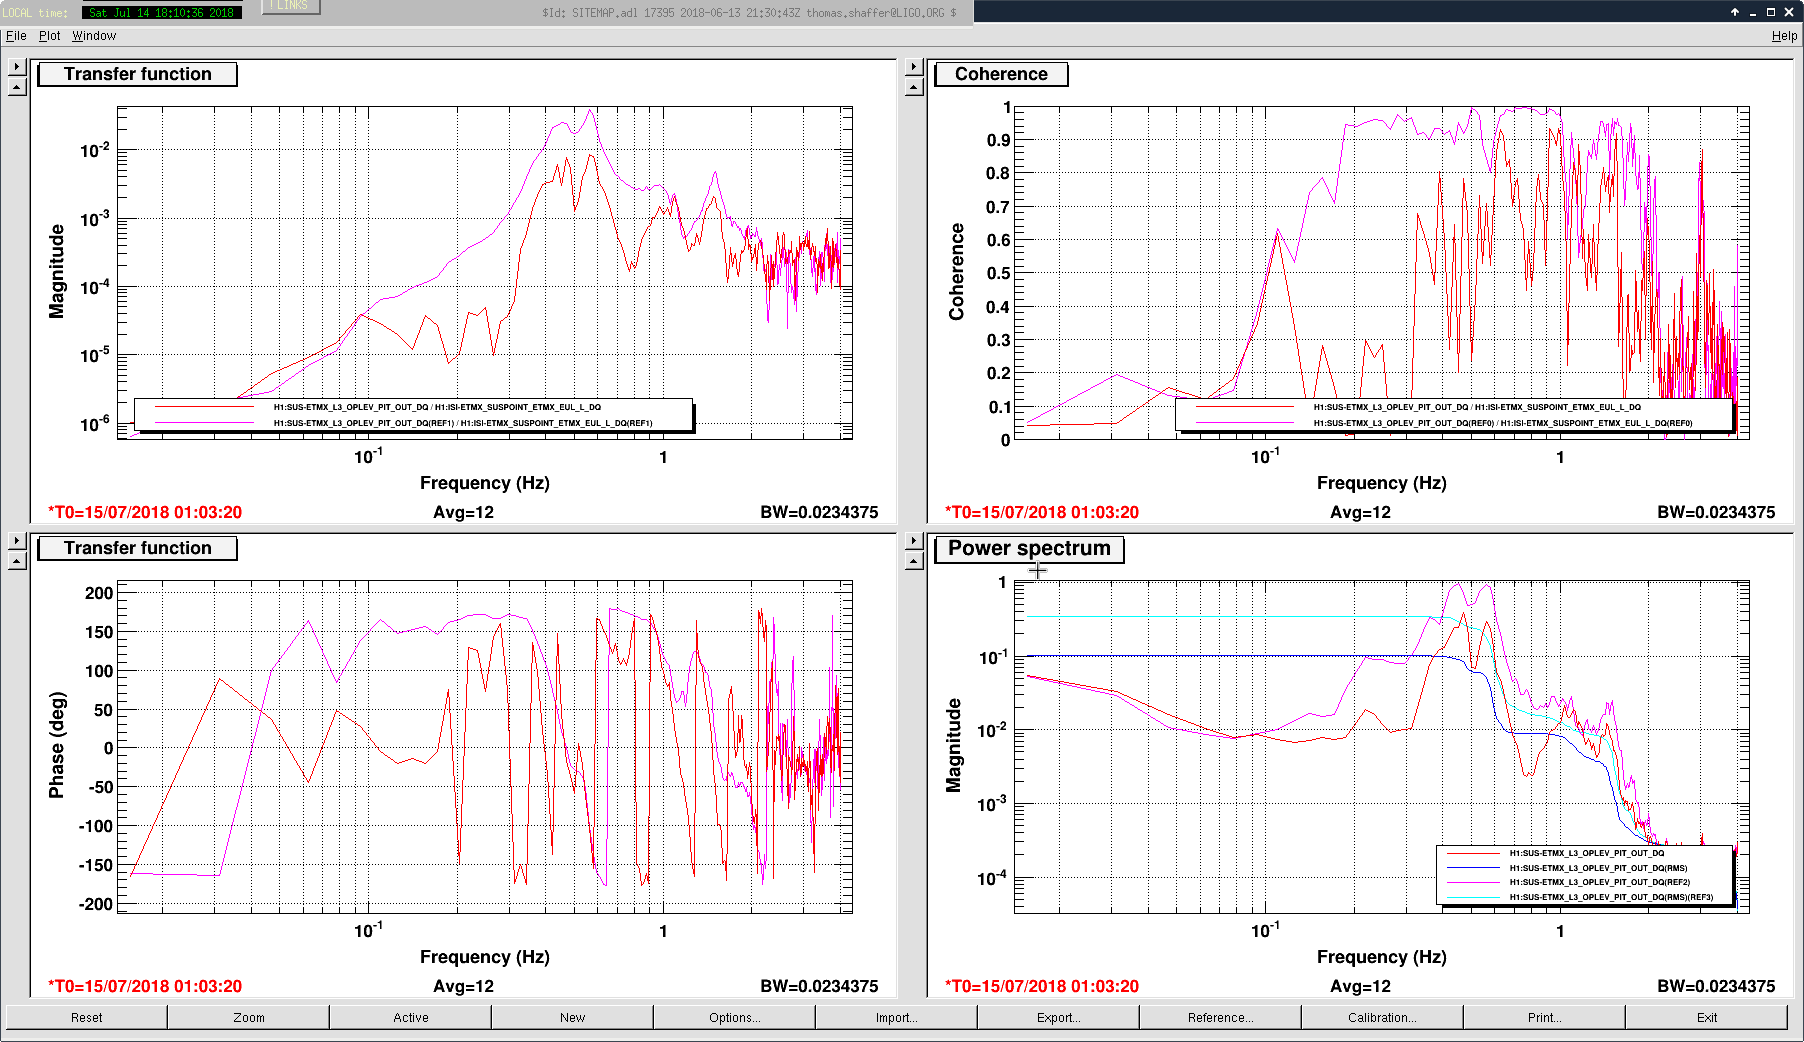
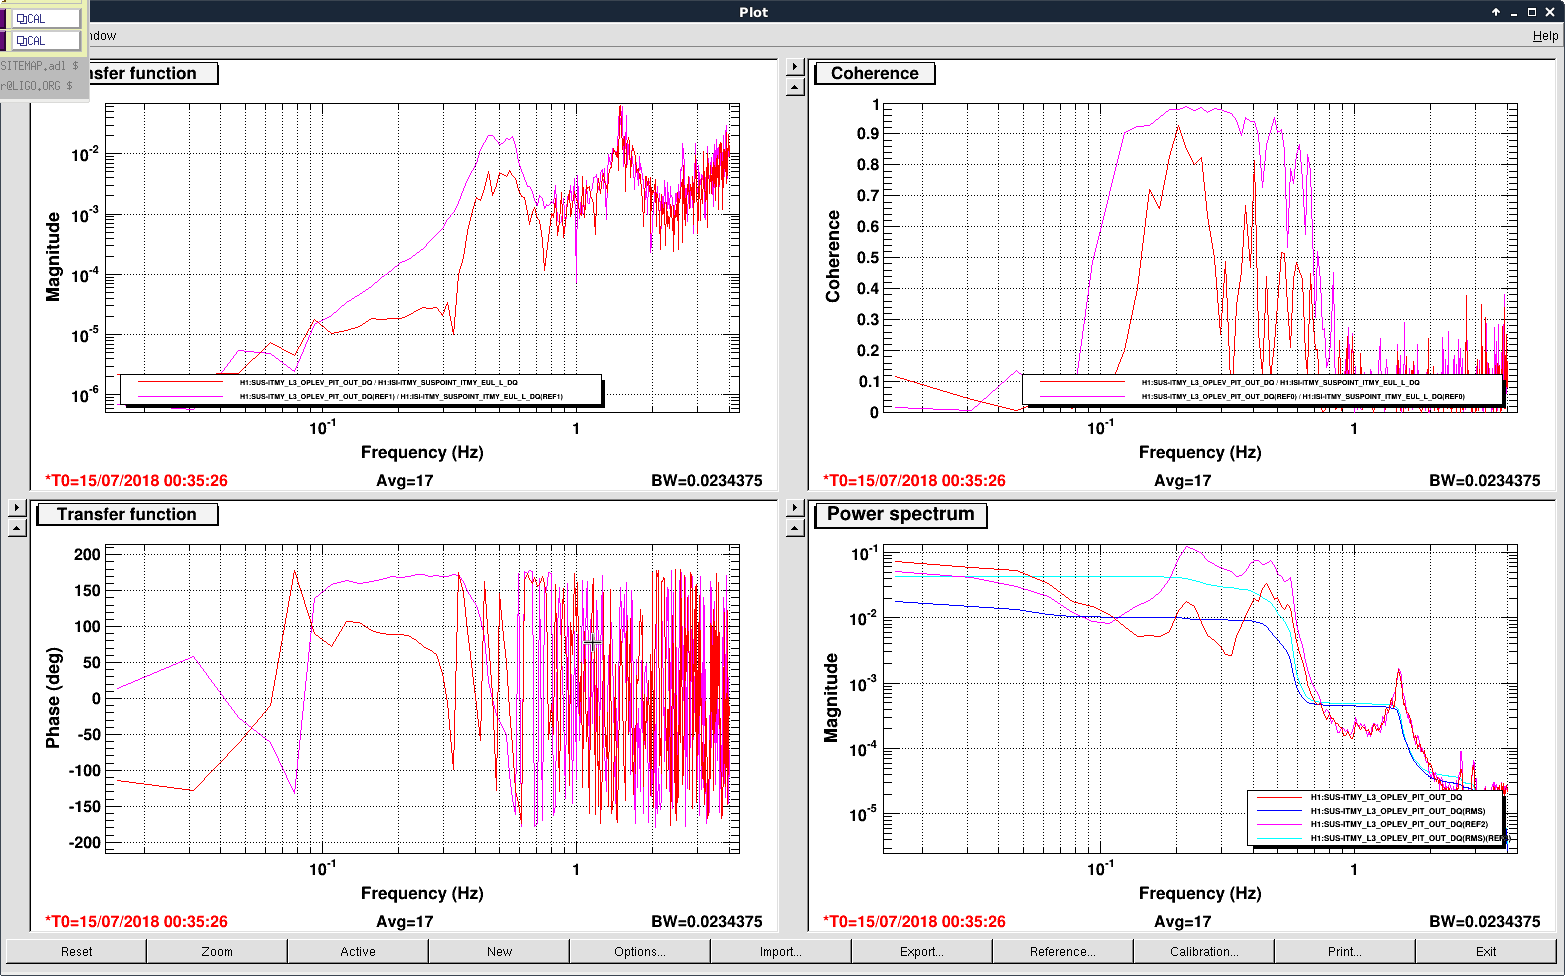
We continued the ISIFF work today (similar to LHO:42875). We finished the filter design for both EX and IY. Using passive data, a reduction in L3 pitch of x2 - x3 was achieved.
See the first figure for EX, and second for IY. The pink and cyan curves were with the FF off, and red and blue with FF on.
The subtraction in IY was slightly worse than in EX because I manually added an zero at 0 and pole at ~ 0.02 Hz to enforce AC coupling of the IY L2P (the best fit did not give an AC coupled filter automatically), which degraded the subtraction at ~0.2 Hz. This might not be necessary as the motion at <0.1 Hz did not limit the ctrl bandwidth. When we get a chance next time, will try to move the pole to lower freq (e.g. 0.01 Hz) to get better subtraction of the microseismic.
================================================================================
The measured FF filter and fitting results were also attached.
The raw measurement data were currently put under
/ligo/home/hang.yu/Desktop/small projects/ISIFF/EX and /ligo/home/hang.yu/Desktop/small projects/ISIFF/IY We will mitigate those to the sus svn.
The foton zpk filter for EX is
zpk( [ -1.201315e-03+i*4.951483e-02; -1.201315e-03-i*4.951483e-02; -9.047257e-01+i*1.310103e+00; -9.047257e-01-i*1.310103e+00; -4.135461e-01-i*8.402608e+00; -4.135461e-01+i*8.402608e+00; ], [ -2.145353e+00+i*3.206850e-03; -2.145353e+00-i*3.206850e-03; -5.465923e-01+i*3.000483e+00; -5.465923e-01-i*3.000483e+00; -2.371843e+00+i*7.319342e+00; -2.371843e+00-i*7.319342e+00; ], 3.359477e-02 )
and for IY
zpk( [ 0.000000e+00+i*0.000000e+00; -1.780956e+02+i*0.000000e+00; -5.654532e+00+i*0.000000e+00; -8.399729e-02+i*3.742470e-01; -2.595089e-01+i*7.302161e+00; -8.399729e-02-i*3.742470e-01; -2.595089e-01-i*7.302161e+00; ], [ -1.400000e-01+i*0.000000e+00; -6.449348e+01+i*0.000000e+00; -2.456886e-01+i*2.905084e+00; -1.885957e-01+i*6.295556e+00; -2.111860e+01+i*9.187572e-03; -2.456886e-01-i*2.905084e+00; -1.885957e-01-i*6.295556e+00; -2.111860e+01-i*9.187572e-03; ], 4.341633e-01 )
Hang, Sheila
Both end station HEPI pump controllers tripped this afternoon at 20:55 and 20:26 UTC. We also got end station temperature low warning from verbal alarms 22:02 UTC. In 37359 Jeff K says that the HEPI pump station trip seems to happen in the summer, and it is hot this weekend.
Hang and I followed the first few steps of the instructions given in 37359, but it seems that at EX some of the hardware is different so we couldn't identify some of the things the instructions say to check.
We abandoned EX and decided to check at EY, but again didn't feel confident enough to continue.
We have given up for now (Hang was trying to do some measurements for ISI to suspension FF) and think this can wait for monday.


Stefan, Danny, TVo
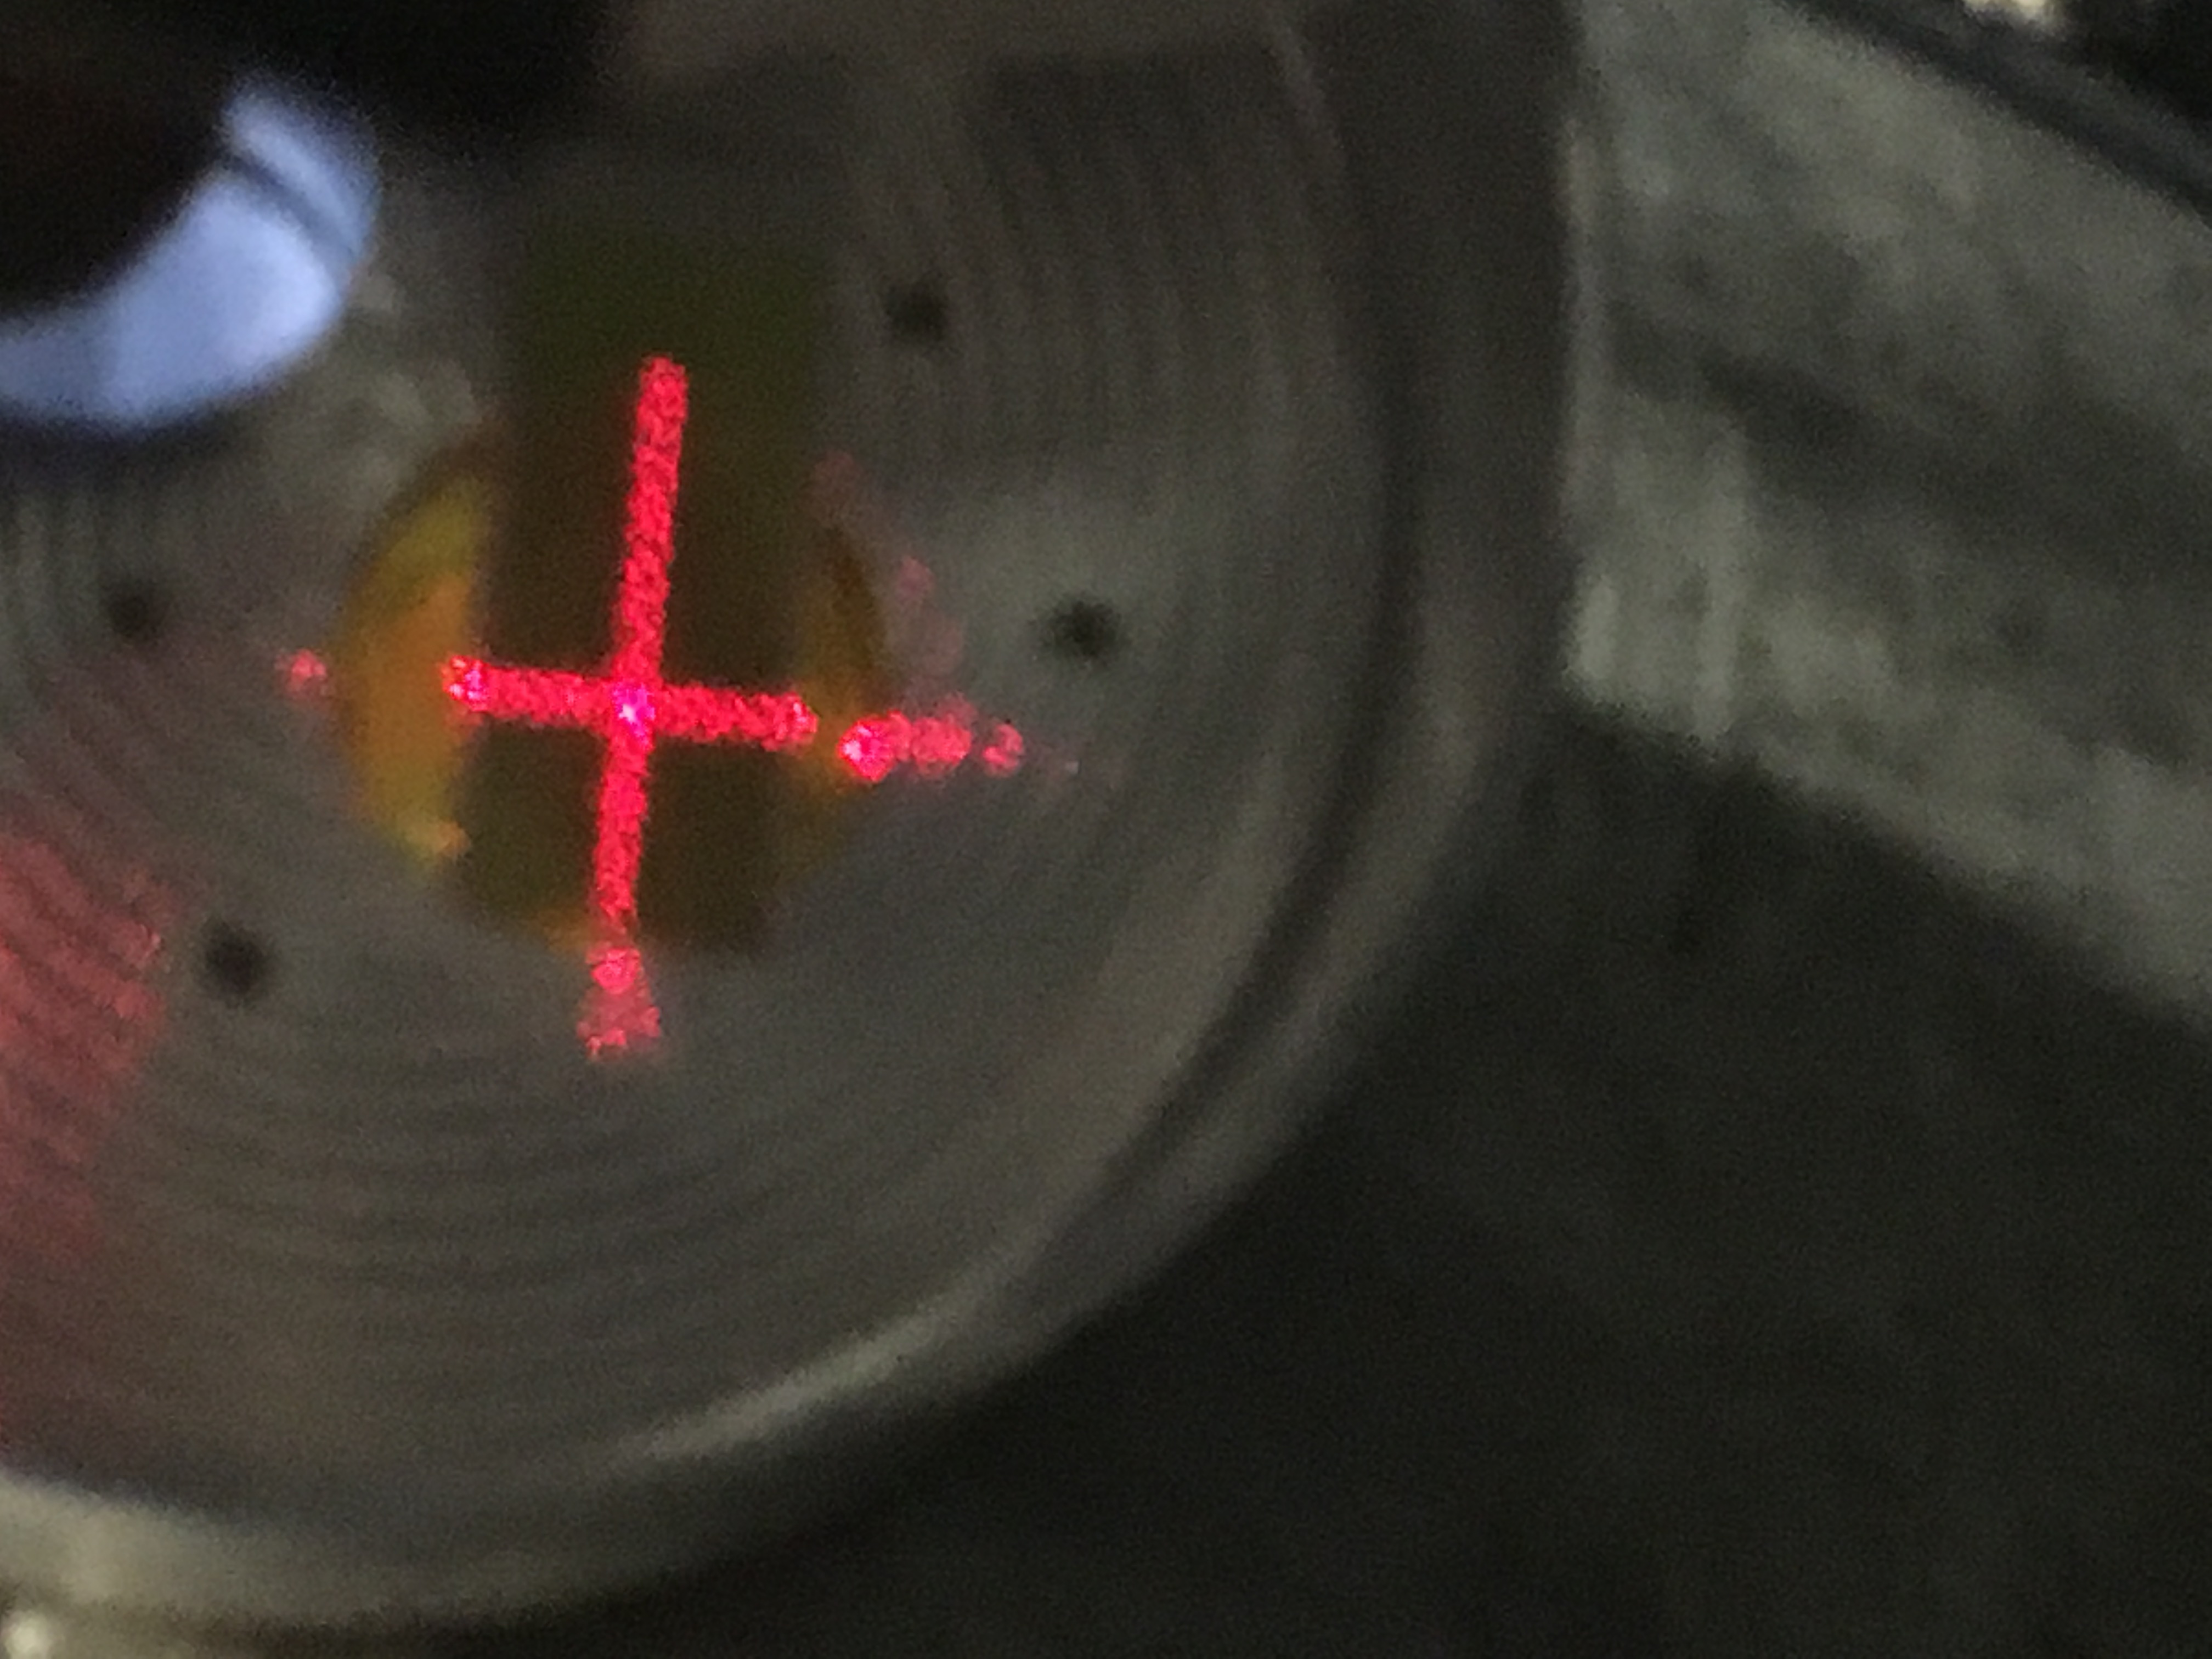
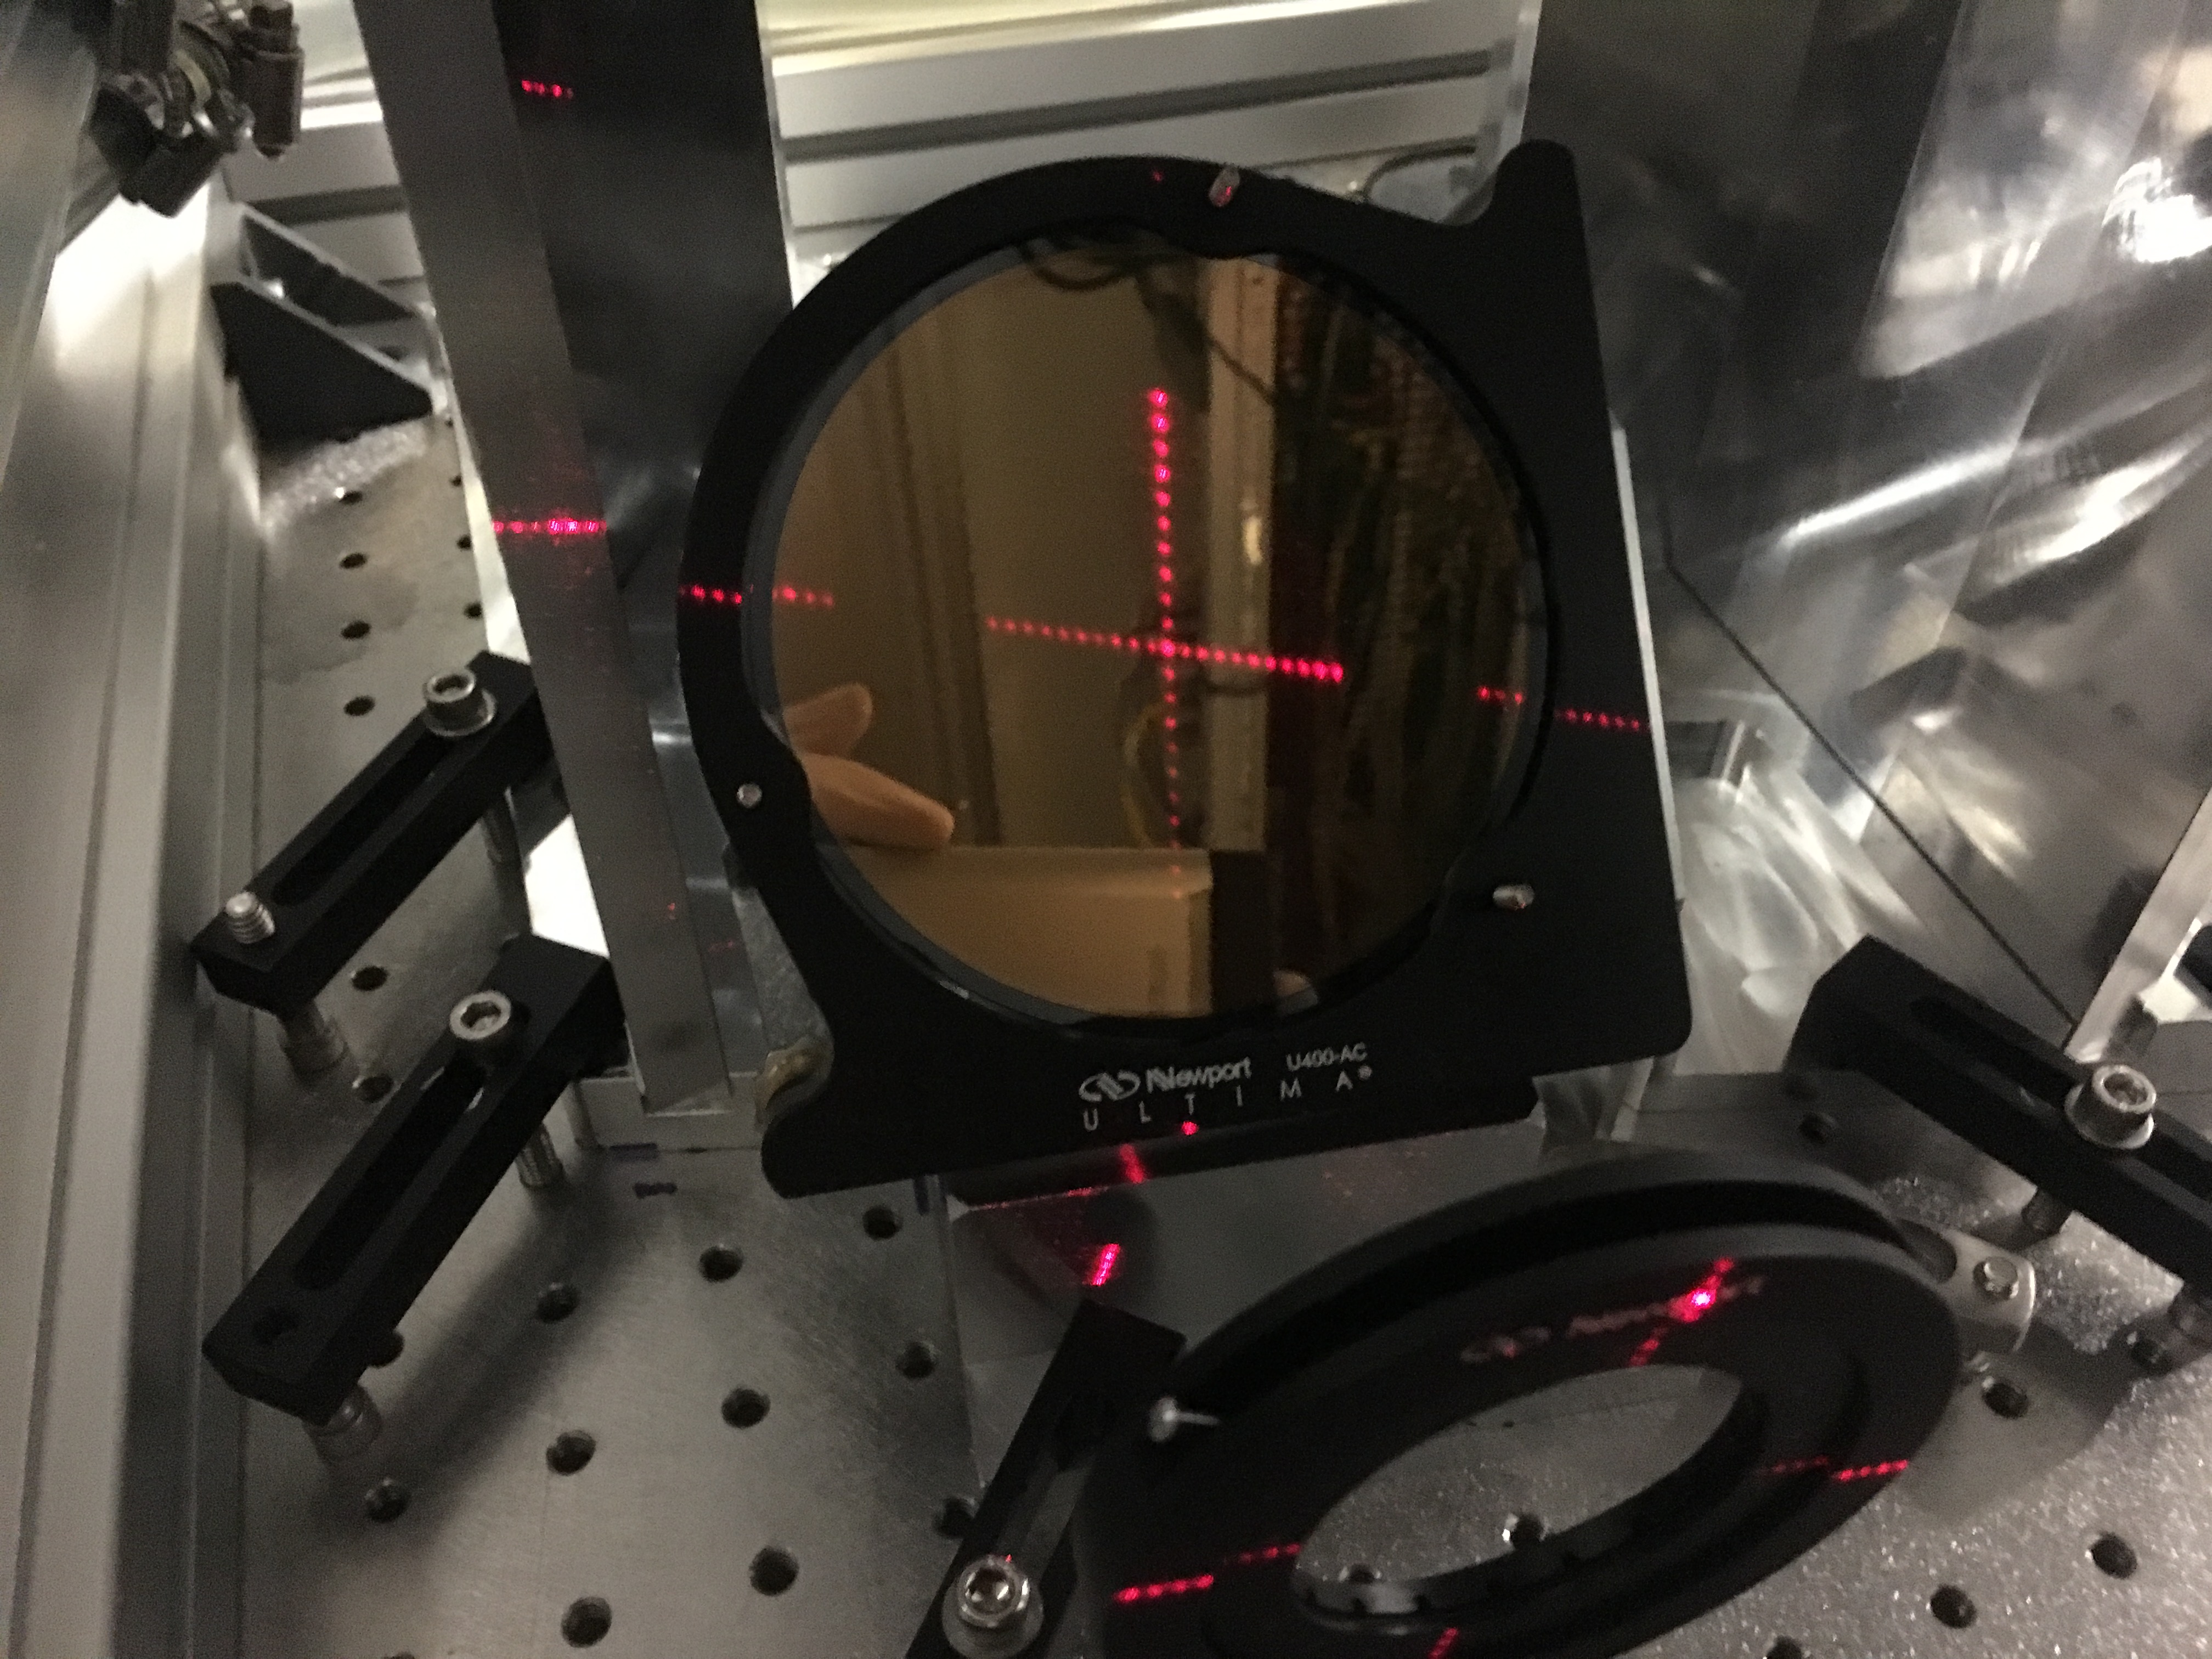
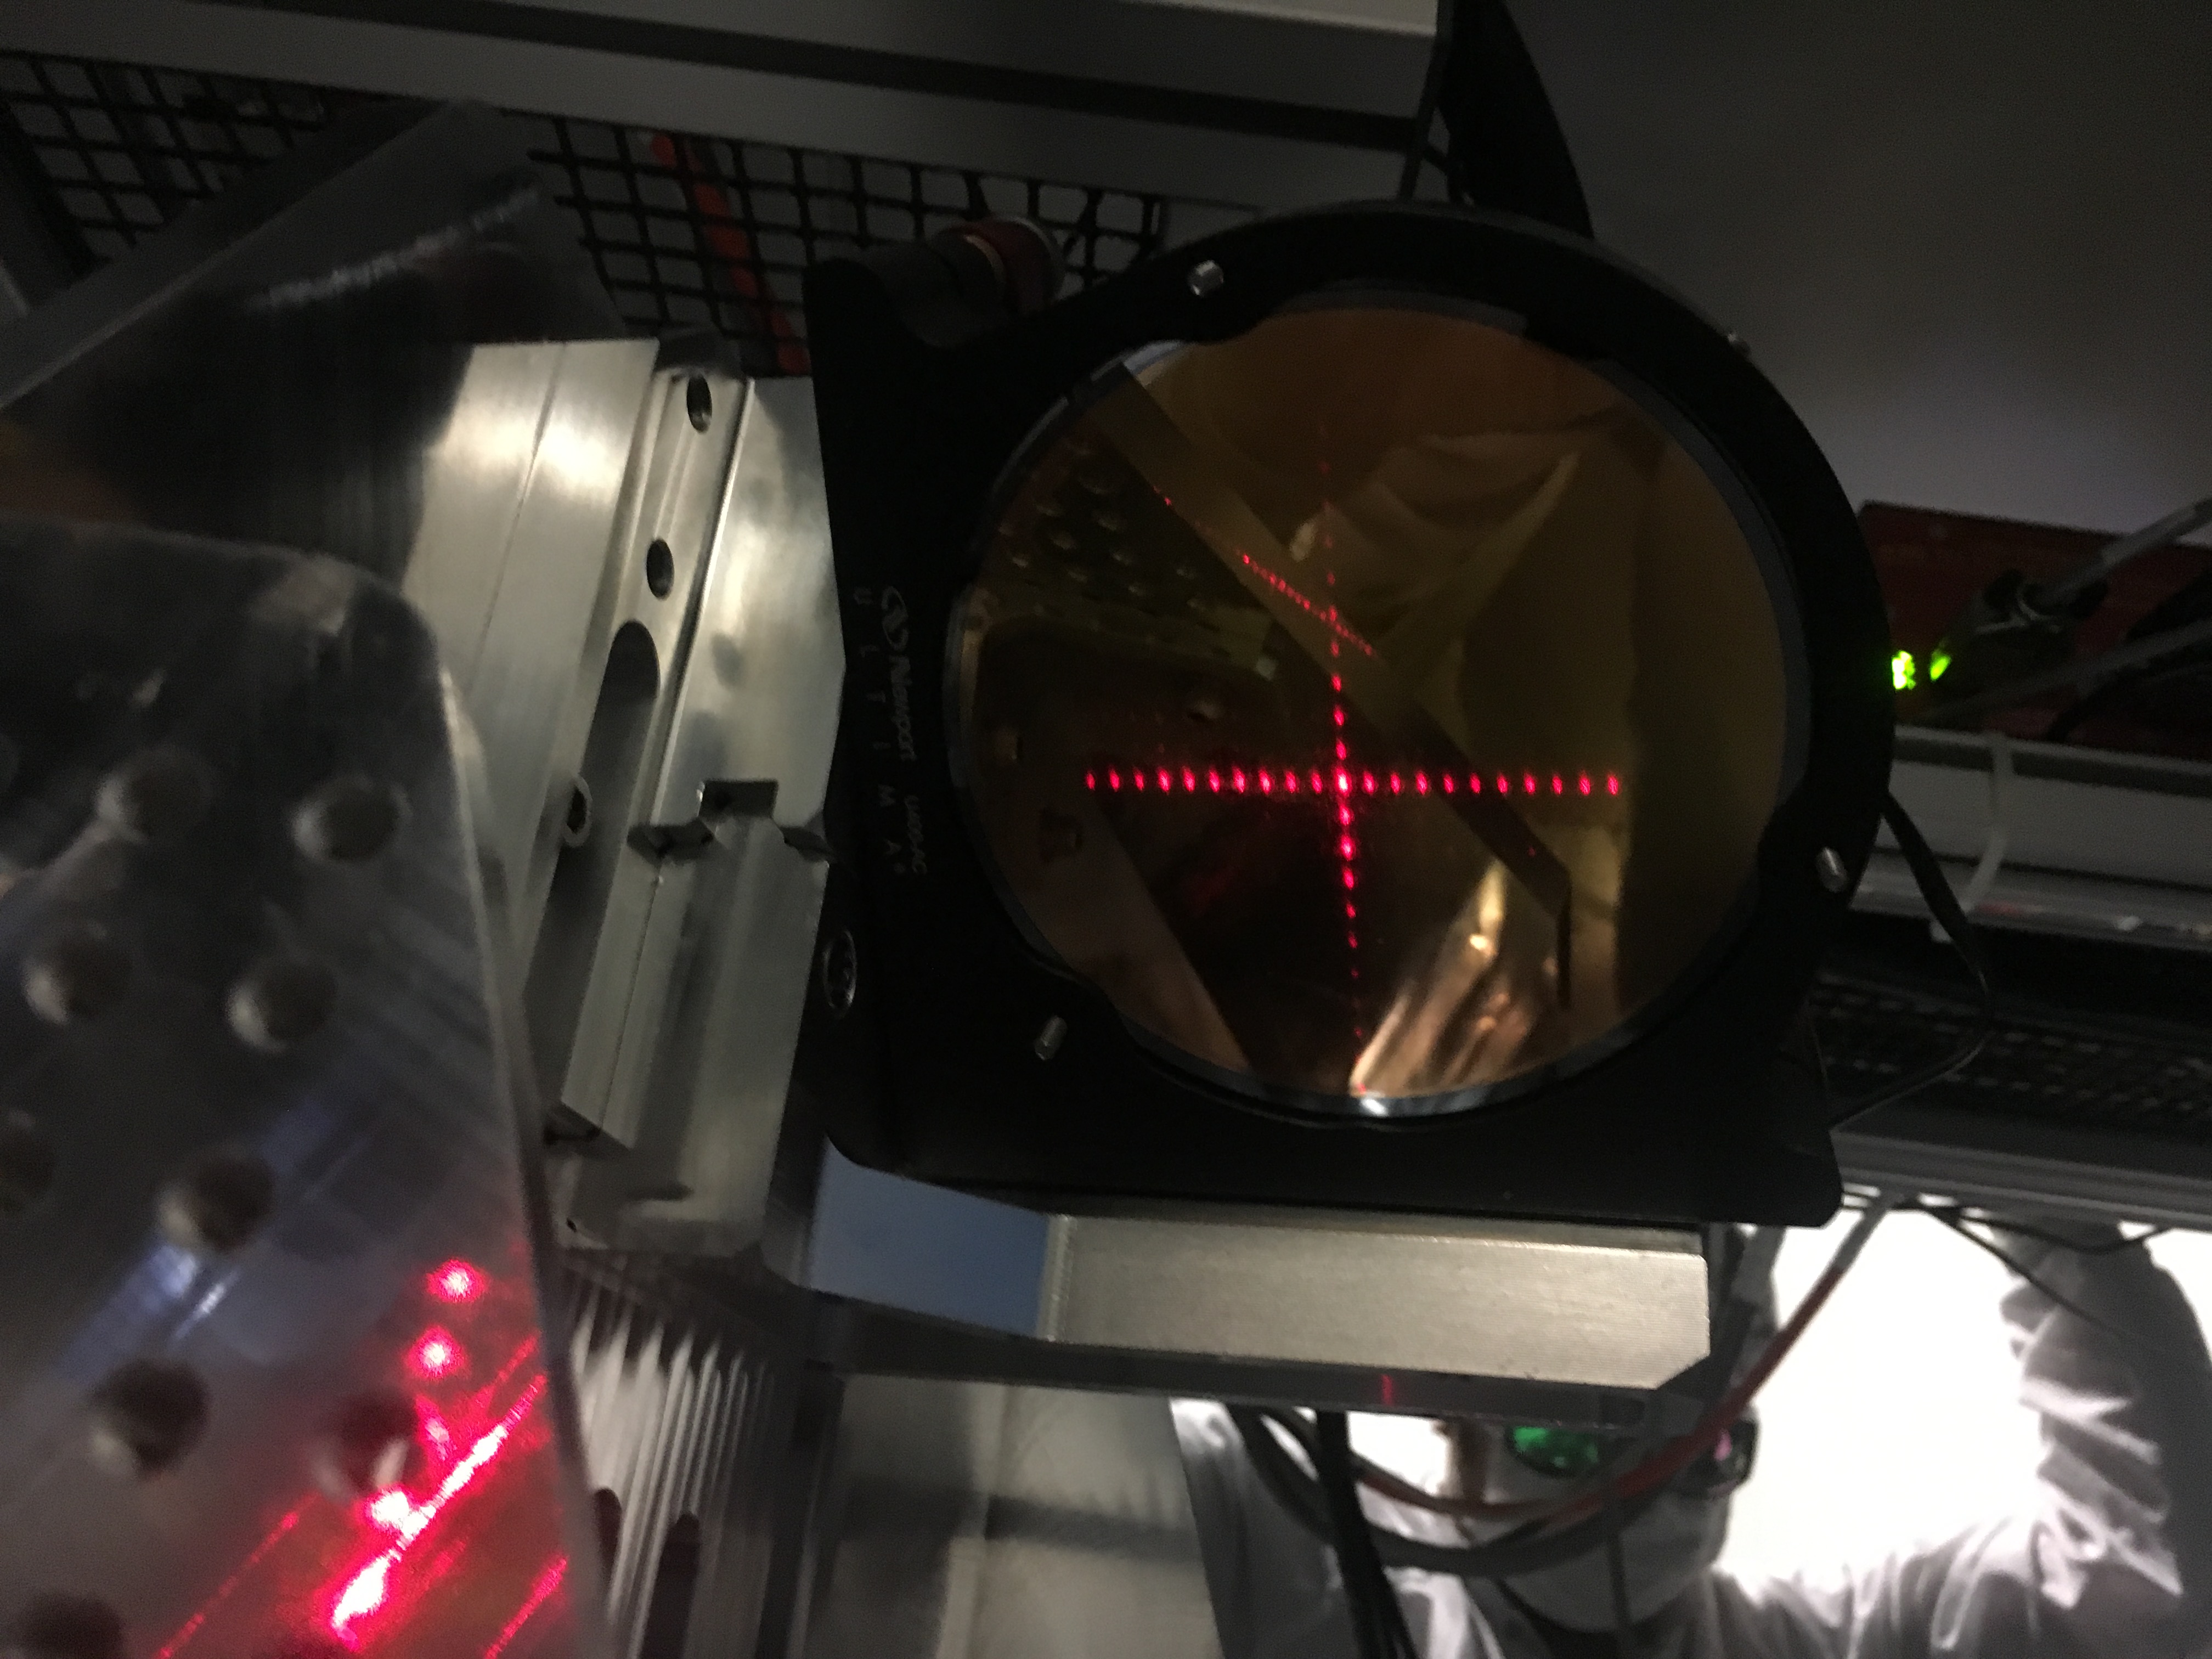
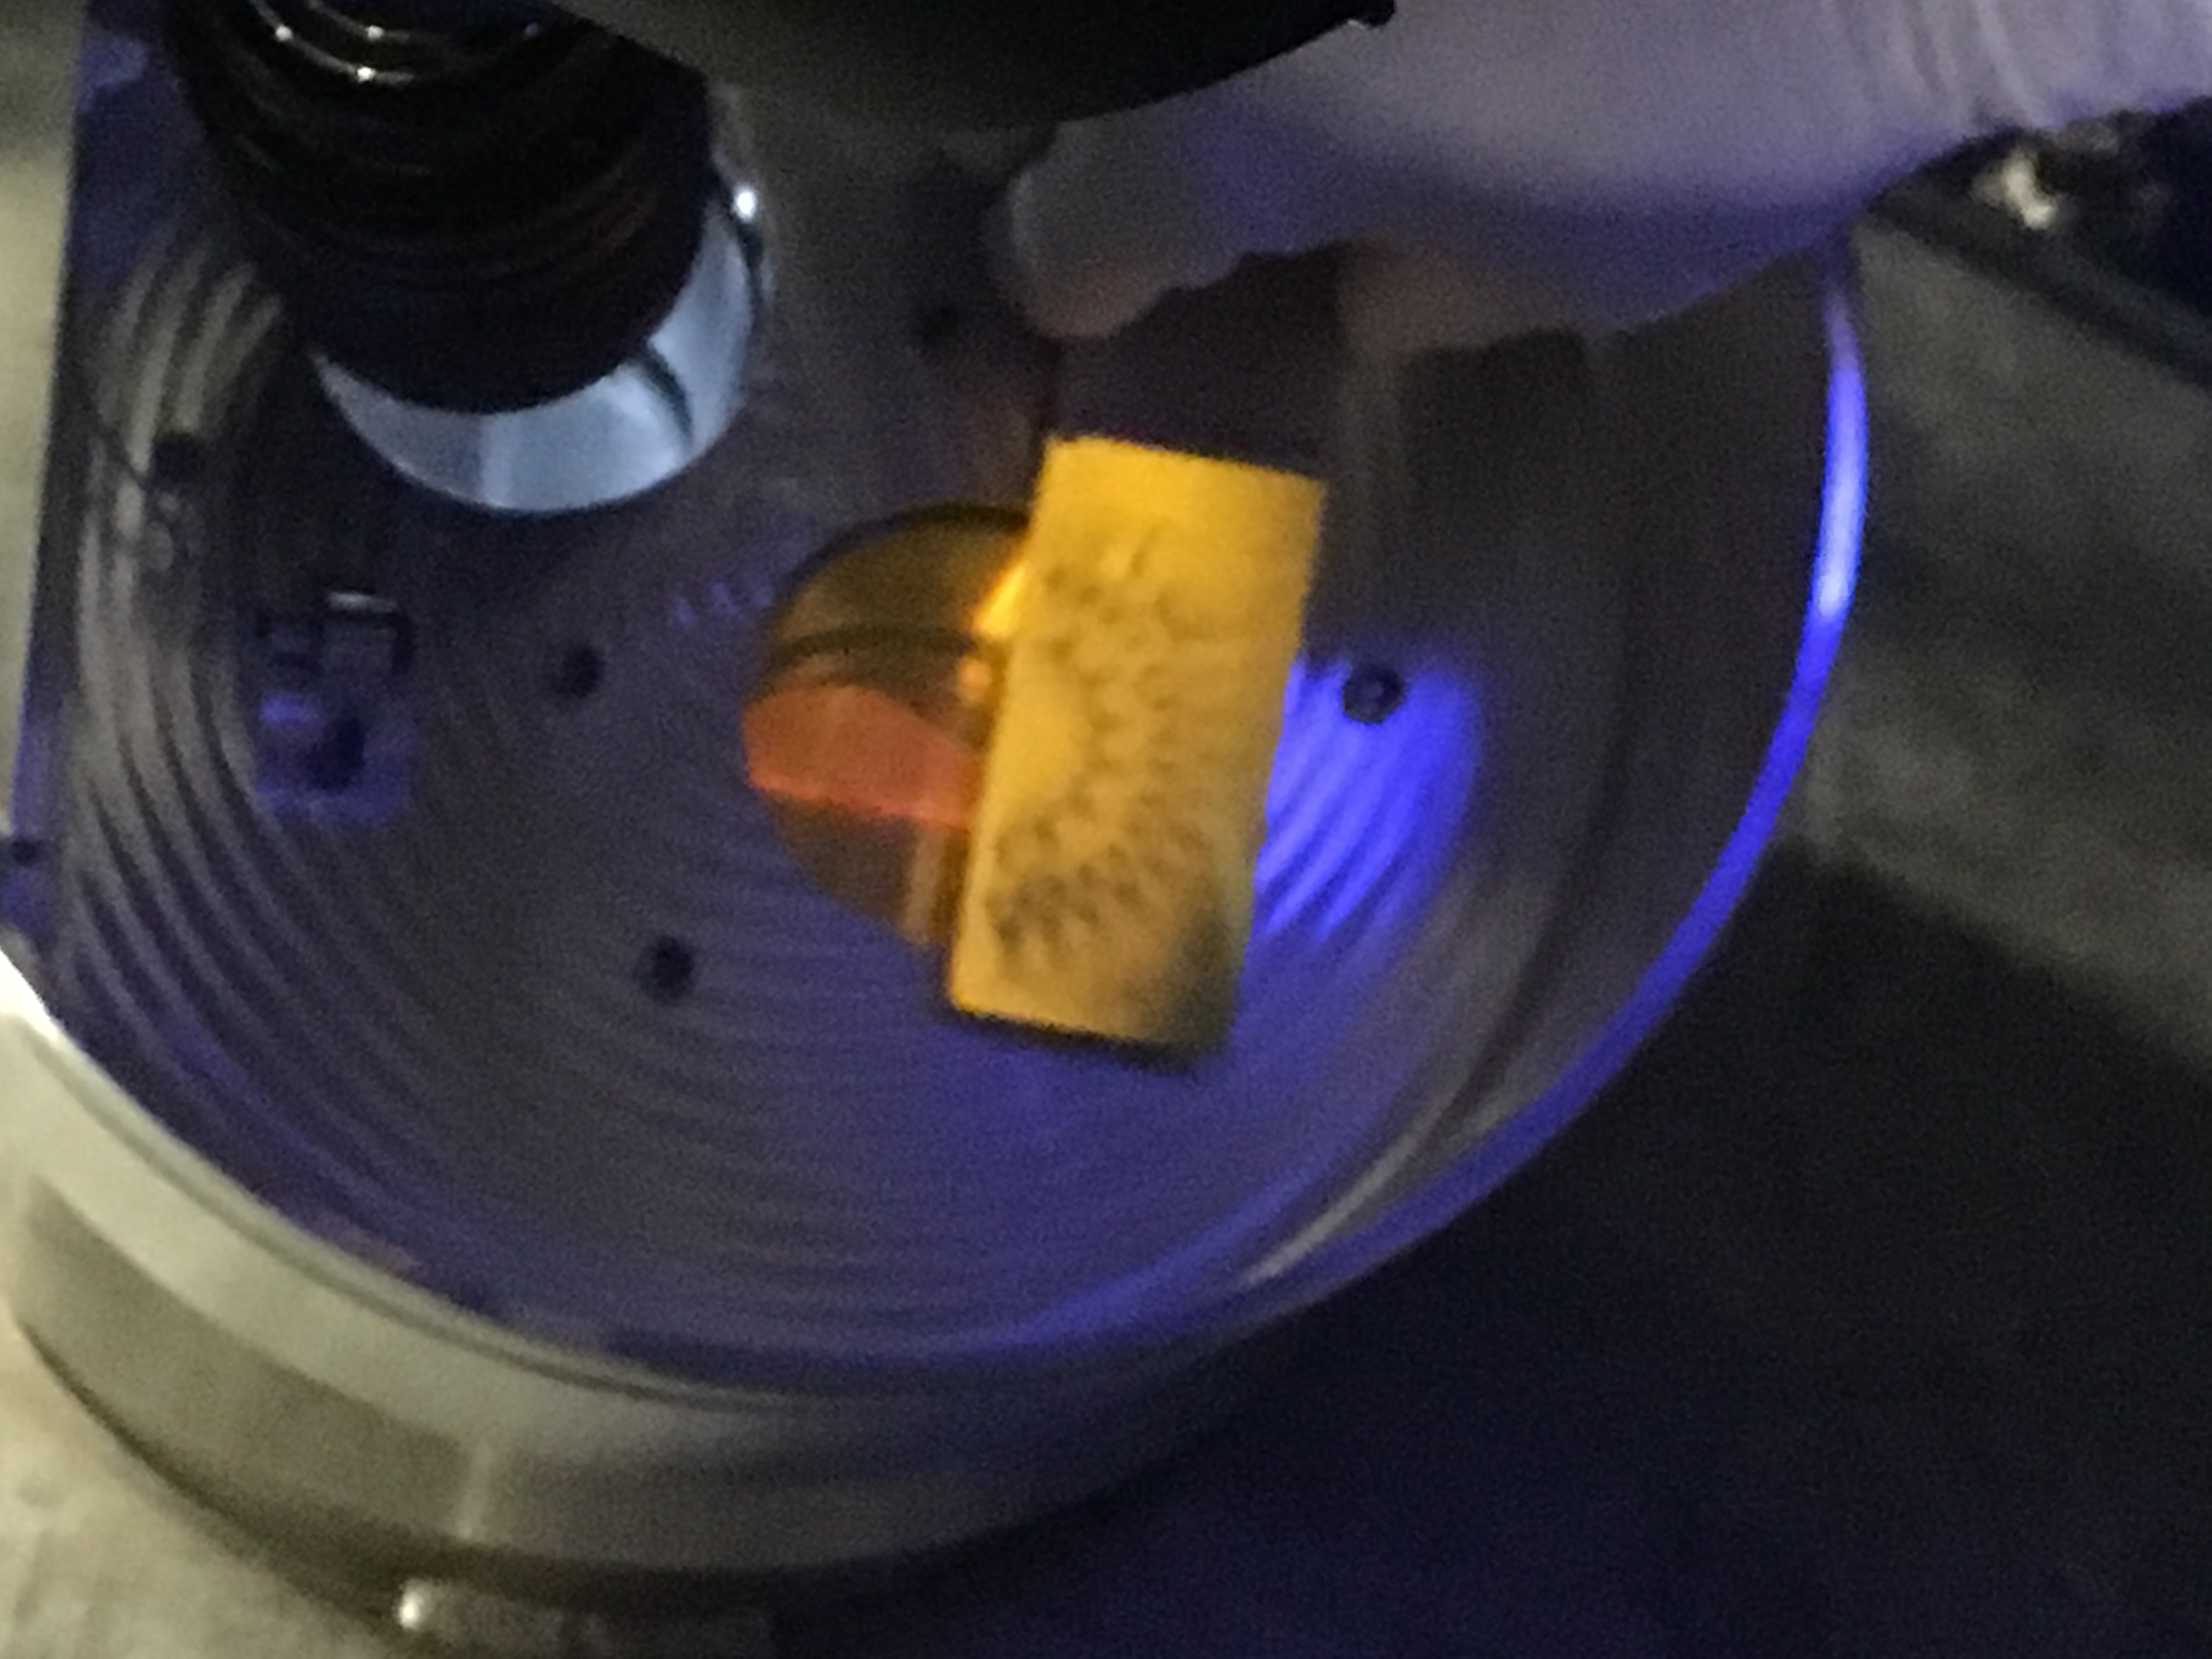
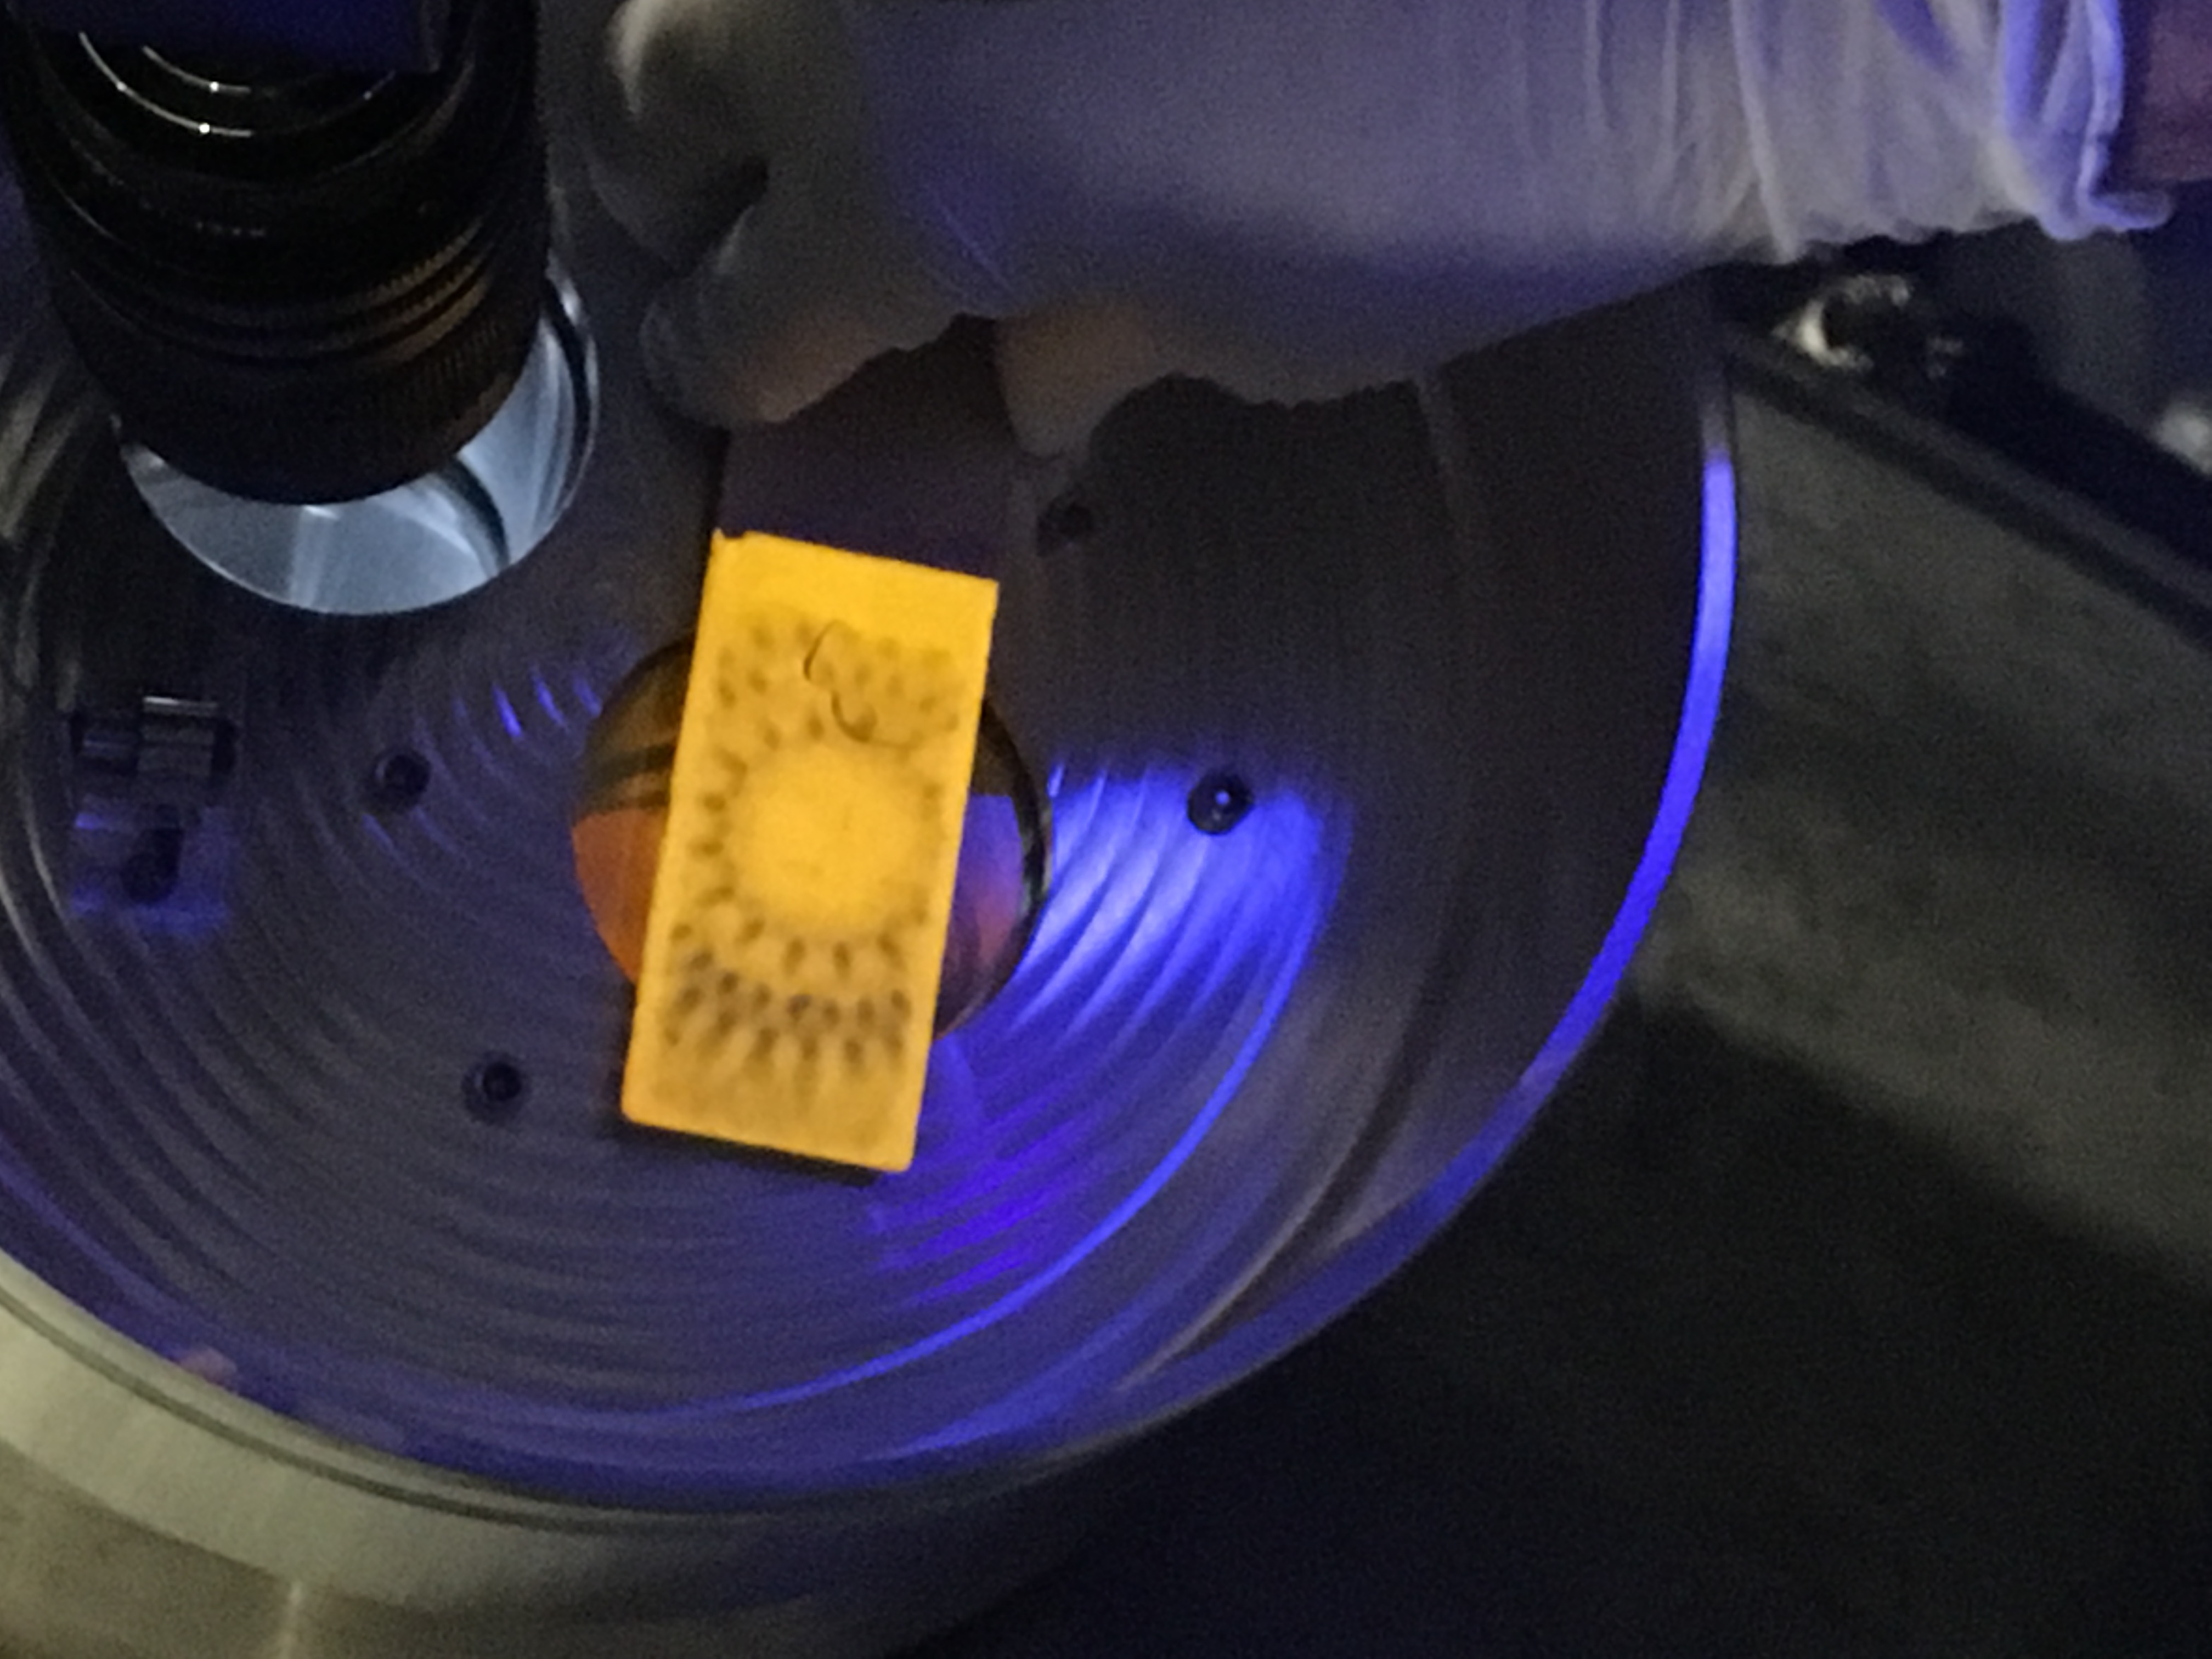
Today we decided to take a more careful approach by setting up a red cross-hair laser and coalign the alignment laser with the CO2 beam on the two irises before the periscope.
We then found that the beam was clipping on the small aperture which is formed by the double ZnSe viewport and decided that the periscope structure had to be moved in order to avoid clipping and center on the top periscope mirror as well as get to the CP. However, to avoid losing the alignment completely, we installed a camera with a zoom lens to see the CP through the visible viewport, this proved to be extremely useful. We then slid the periscope structure and bottom periscope 1.5 inches in the +y direction (IFO coordinates) and re-aligned using the camera.
After a bit of fine tuning with walking the beam, the result is a much cleaner beam as shown by the Hartmann (Stefan will comment)! Hopefully at this point, we won't need to go back on the table and can do the pointing adjustments with the top periscope picomotor. One interesting thing about the annulus heating, not much of it gets through the viewport.
Attached are figures of the end result:
Fig 1. Cross hair on the viewport
Fig 2. Cross hair on bottom periscope
Fig 3. Cross hair on top periscope
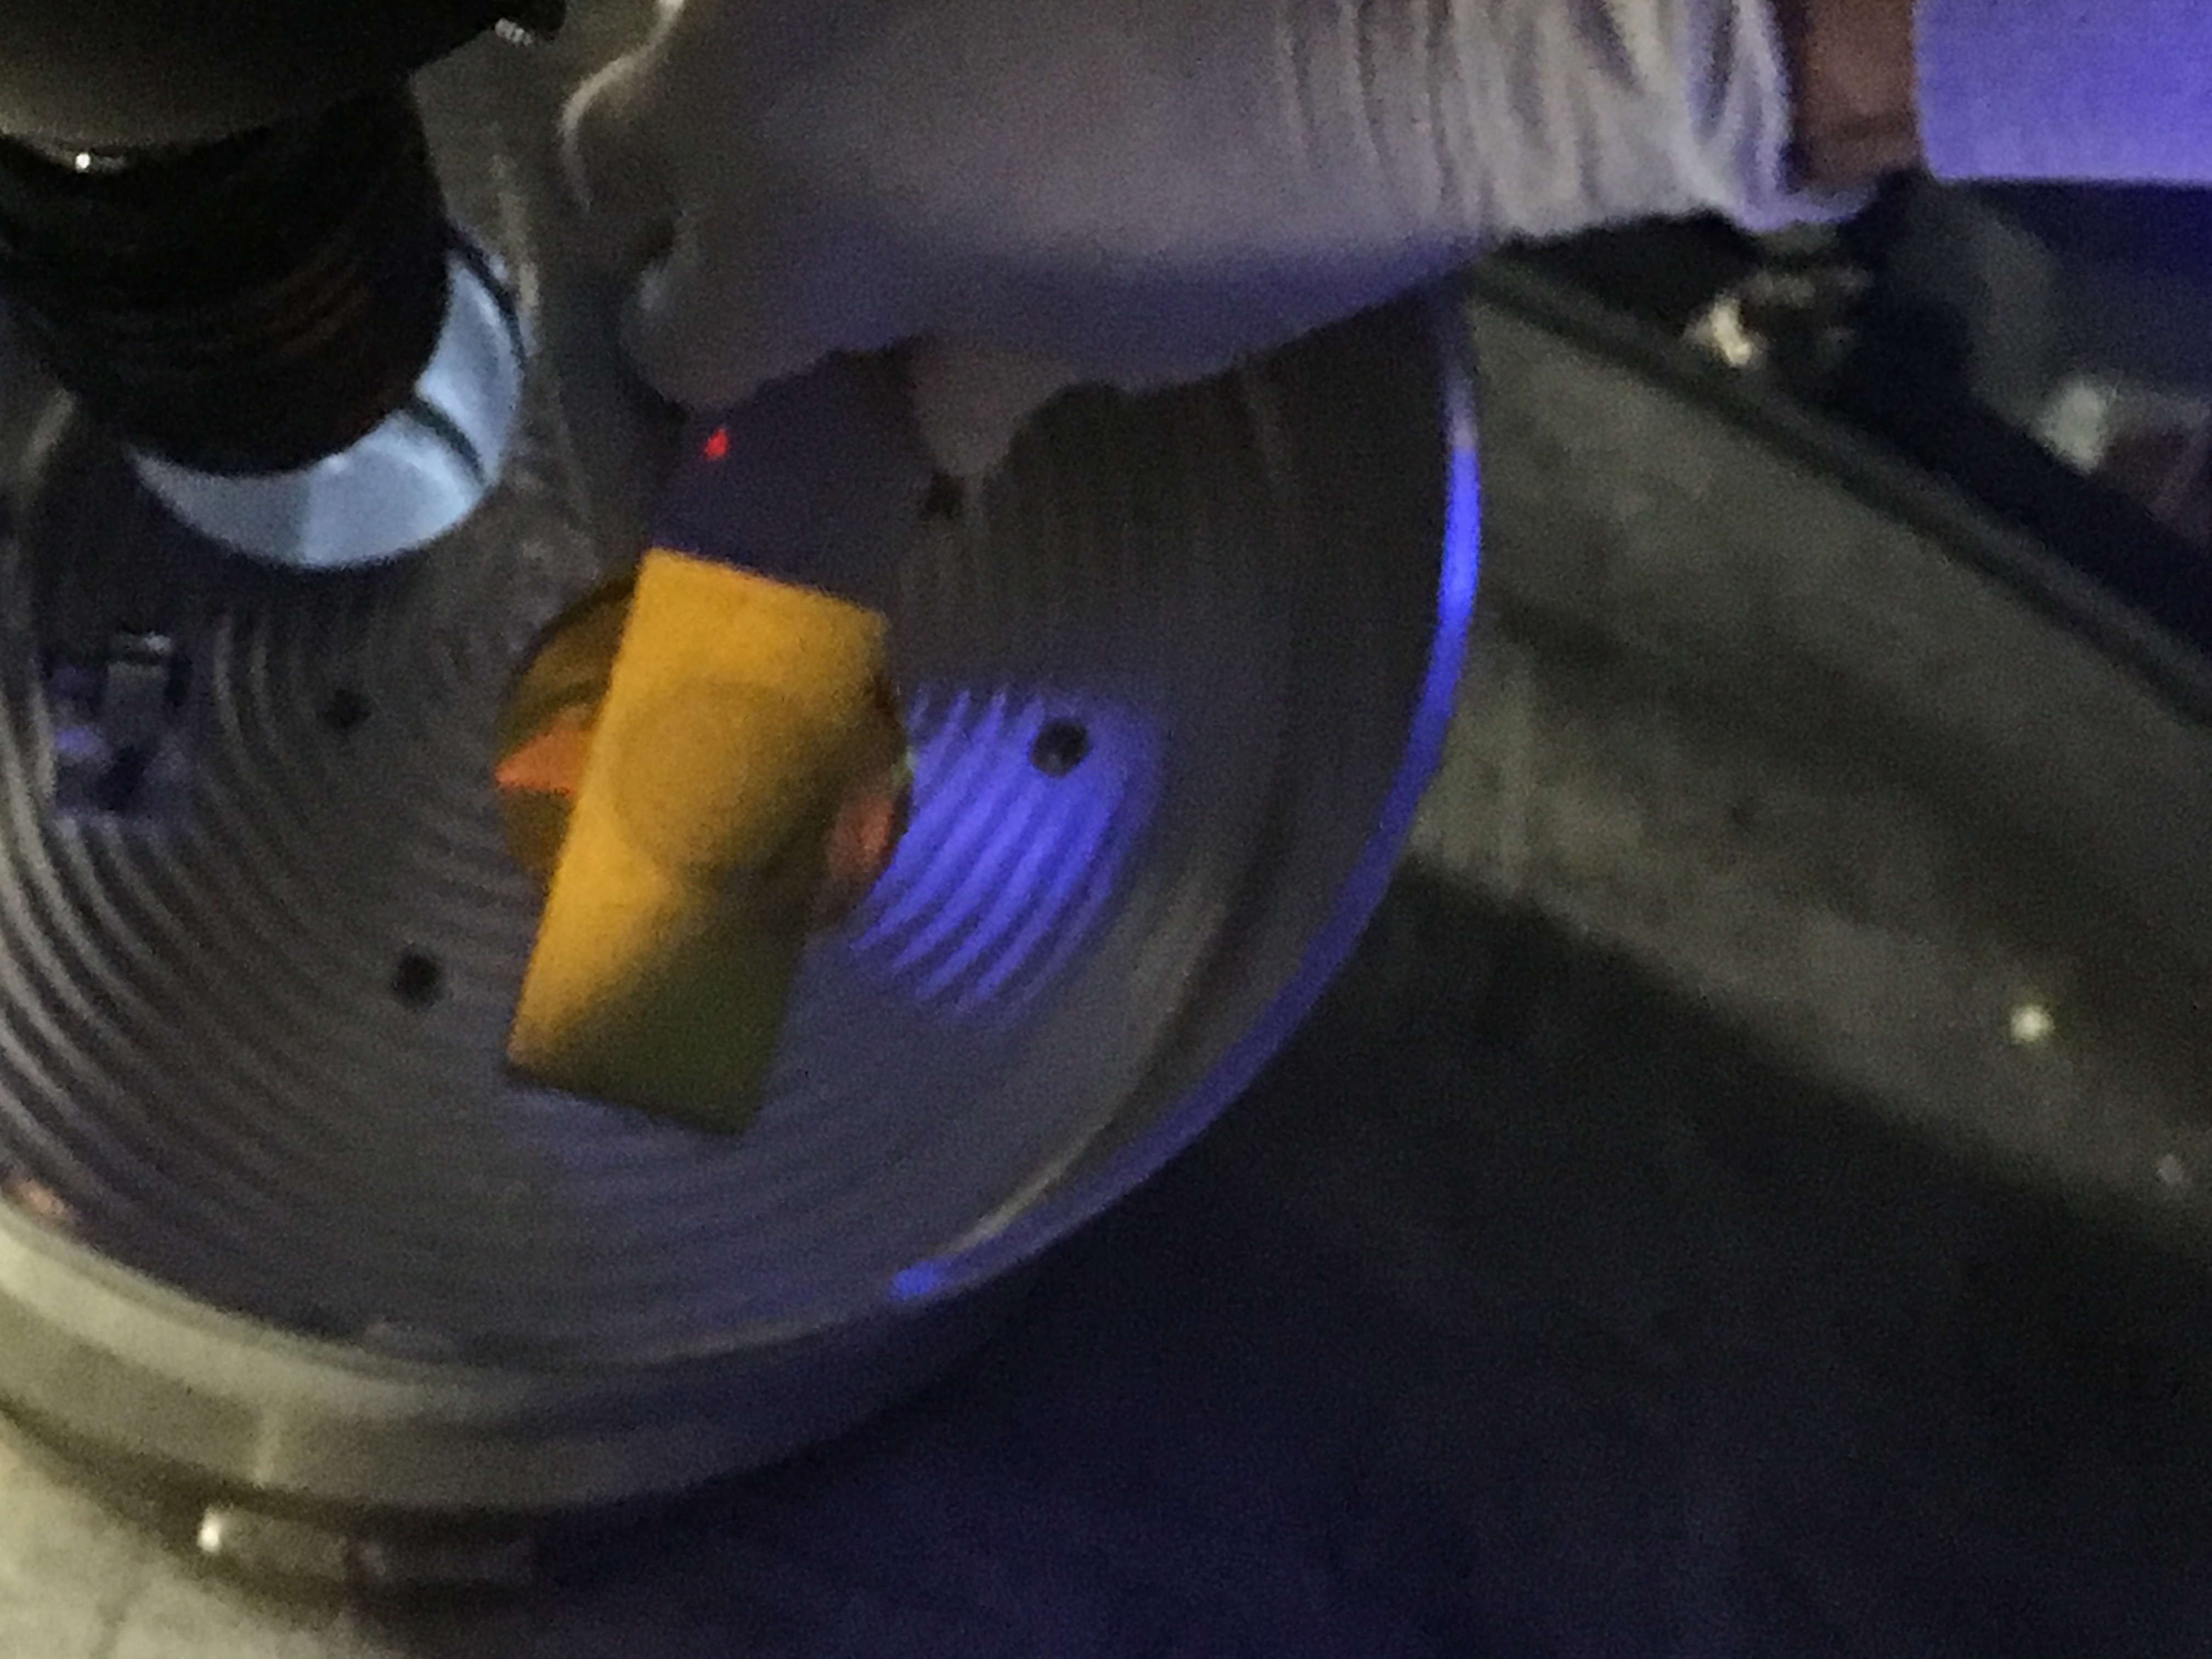
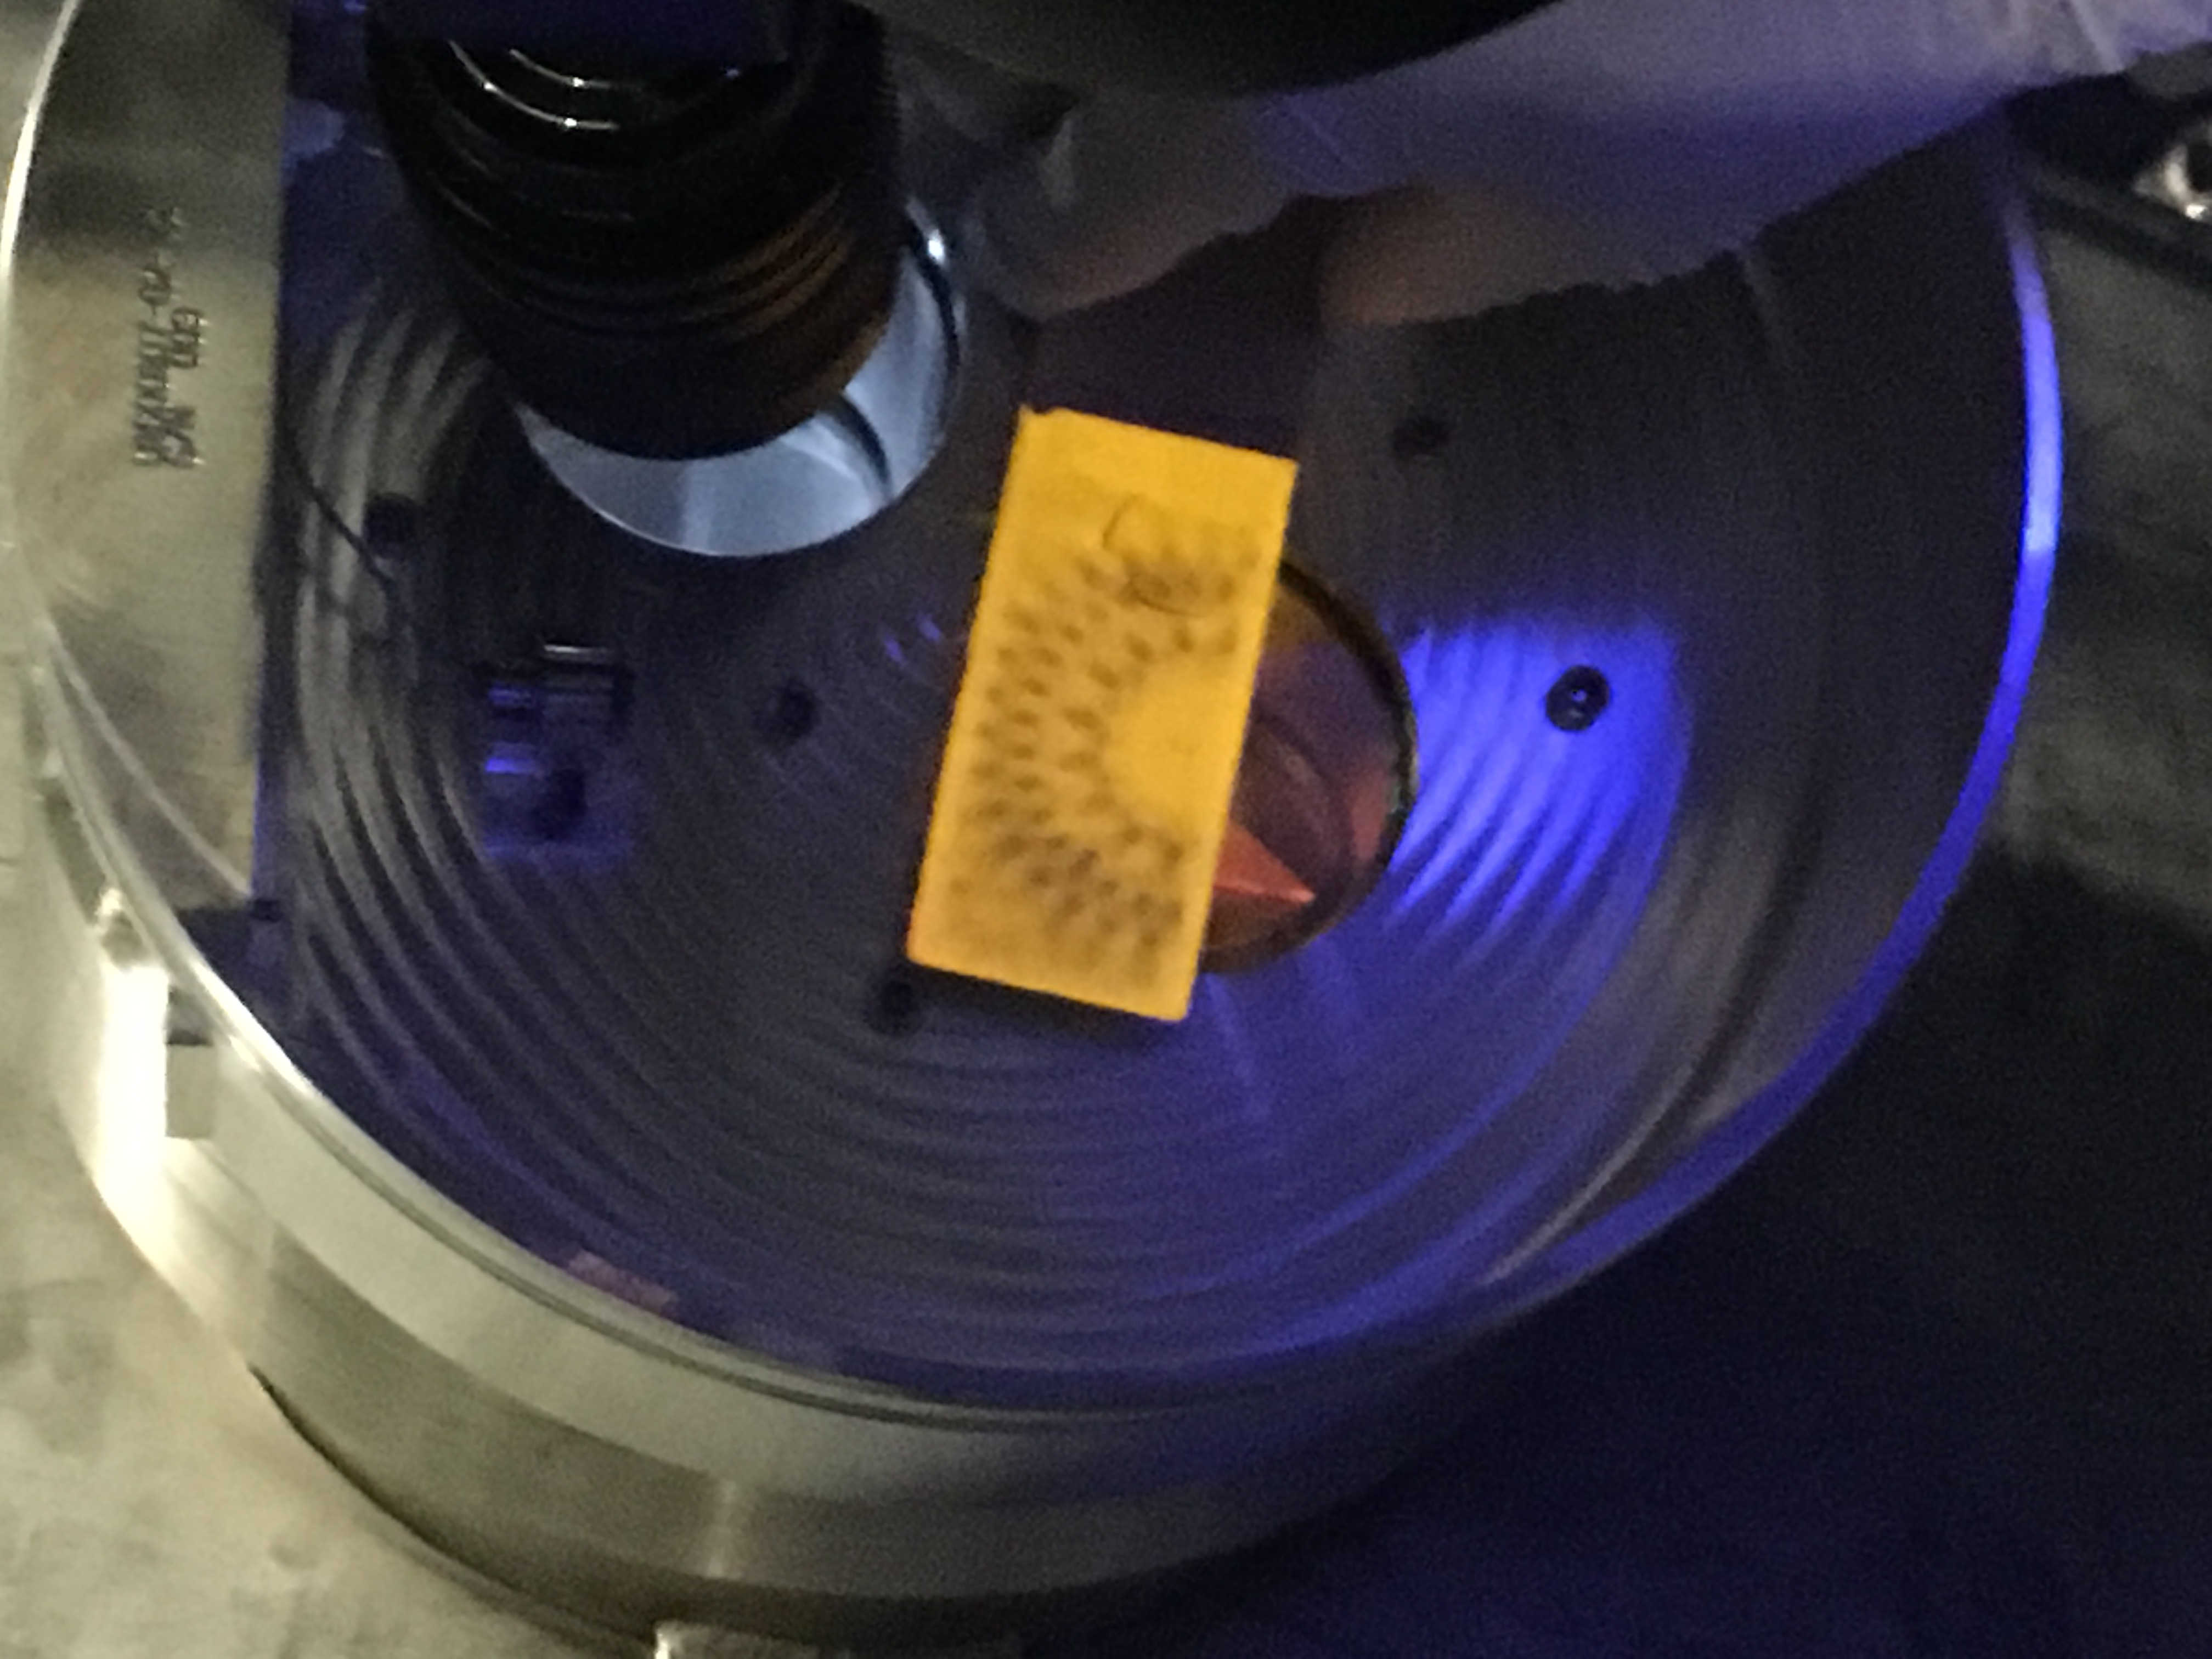
Fig 4. Central heating mask
Fig 5. Annulus heating mask top edge
Fig 6. Annulus heating mask bottom edge
Fig 7. Annulus heating mask central
Attached are:
- A 33min HWSY animated gif showing the turn-on transient of the TCSY CO2 central heating.
- The TCSY FLIR image of the heating beam.
A word to the orientation of these images: the HWSY images have global Y+ as horizontal axis, and global z+ as vertical axis. On the FLIR image horizontal and vertical are approximatrely switched (there is also a ~20deg rotation). We ought to take a reference image with a shyadow marker to clarify this relative orientation.
Note that the intensity is not completely uniform across the mask. It looks like we will still have to do a fine-tweak the beam position by about 1 cm in pitch and yaw, but that can easily be done with the top mirror picomotors. The picomotors move at about 2000cts/cm.


An iphone camera image of the ITMY compensation plate seen through the two steering mirrors and the BSC1 glass viewport next to the zinc selenide viewport.

Summary:
MC2 M3 coils were balanced using pringle injection into MC2, using MC2 TRANS QPD as the angle sensor and IMC_L_IN1 as length sensor at 9Hz.
(This measurement might have been limited at sub-% level imbalance due to cheesy electronics coupling from MC2 M3 drive to some of MC2 M1 OSEM sensors, resulting in shaking of the entire suspension. This is a small effect anyway but will be discussed in a different alog. Note that I could have killed this coupling by implementing notches for M1 damping filters.)
Anyway, I reduced pringle to length and yaw coupling by more than 20dB (note that yaw sensing is related to PIT balance in pringle excitation). Old balance was not good for PIT.
Due to this (and 7% overestimate that existed in all LHO calculations prior to Jun/20/2018, alog 42594), to correctly interpret MC2 PIT spot position measurements from the past, you need to first divide the centering number by 1.07 and subtract 2.2mm. Sign convention I'm using is positive=high.
For example, Sheila's measurement showed that MC2 spot was too high by 7.6mm (alog 42350), according to this new measurement it was in reality something like 7.6/1.07-2.2=4.9mm.
But I don't know if this is the only systematic in A2L spot position measurement. P2L coupling of HSTS model might matter, I'll have a look.
Details:
I used MC2 TRANS as angle sensor due to higher S/N though I looked at IMC WFS RF and DC as well as IM4 trans. I used IMC_L_IN1 for length. For pringle excitation, since I used DTT I just injected into four coils independently, with 12k exc into each at 10Hz, with 180 deg phase offset to LL and UR.
First attachment left bottom shows coil gains before adjustment, left top is after, and the right plot shows the coupling before and after the adjustment. Note that, by doing pringle injection, your PIT coil/magnet imbalance shows up as YAW motion, and vice versa. Length and YAW signal decreased by more than 20dB.
UL+UR gain divided by LL+LR gain used to be 1.14 before, now after balancing it's 1.02. So the force balance for PIT used to be 1.14/1.02.
In the second attachment, which is a modification of Koji's cartoon in http://nodus.ligo.caltech.edu:8080/40m/2863, alpha-primed is the imbalance due to coil imbalance. I changed the sign convention from Koji's original so positive alpha means the node is high.
If we ignore cross term of alpha*alpha', the centering offset becomes 2*beta/D*(alpha+alpha') = 39.3mm*(alpha+alpha') for HSTS.
Before I started changing coil balance, it used to be that
(1-alpha')/(1+alpha')=1.14/1.02, i.e. alpha'=-5.6E-2.
Natural rotational node (i.e. no A2L correction, alpha=0) was 39.3mm*(-5.6E-2)=-2.2mm.


TITLE: 07/13 Day Shift: 15:00-23:00 UTC (08:00-16:00 PST), all times posted in UTC
STATE of H1: Commissioning
INCOMING OPERATOR: None
SHIFT SUMMARY:
Started off with PSL work this morning (IMC was eventually relocked...heard the sign of a matrix element of an MC optic was the issue).
Some commissioning activities began with alignment work at the TCSy table going on. In parallel, DRMI alignment later began along with other work.
(Below, the items in BOLD are currently still active.)
LOG:
This morning whilst aligning the ISS AOM there was no diffracted beam irrespective of the AOM
orientation.  The 80 MHz signal in to and out from the AOM driver was measured.  The output
of the driver was too low [~18.4 dBm (3.4 dBm + 15 dB attenuation)] for any noticeable diffraction.
The RF amplifier gain simply was not there.

    As a side note, the RF spectrum was measured.  80MHzIn2.tif shows the input RF spectrum
from 10 MHz to 120 MHz and is relatively clean.  The output spectrum is in 80 MHzOut2.tif
where a number of extra peaks are present.

    The AOM driver, which should produce at least 33 dBm, was examined in the EE Lab.  For a
power supply voltage of +18 V, it could not produce more than ~30 dBm regardless of modulation
input.  Increasing the power supply voltage to the nominal +24 V, the AOM driver easily produced
33 dBm.  Keeping the modulation input voltage fixed, as it is whilst the ISS is unlocked, and
reducing the power supply voltage by 1 V reduced the AOM driver RF output power.  The
suspicion is that either the power supply voltage was reduced some how and the AOM driver
latched.  The same behaviour was observed in a different unit that was, until now, thought
to be faulty.

    A dedicated power supply line will be pulled some time next week just for the AOM driver.


Filed FRS 11085 for this.
The figure shows spectra from the 4 angular IMC WFS DC channels with labeled peaks. Eight of the peaks between 80 and 1000 Hz are from optics or structures on the PSL table, two were from IOT2 and four haven’t been identified. The unidentified peaks were not excited by our PSL injections, even the global ones. It is possible that they are associated with structures that weren’t excited on IOT2 or in HAM2, or they may be associated with structures on the PSL table that we weren’t able to excite.
The identified sources are table resonances, periscope resonances and optic mount resonances. All optics that produced peaks in the spectrum were downstream of the PMC and were mirrors rather than through-optics like lenses, as would be expected.
The figure also shows the location of the sources in the PSL, as well as samples of the bowing and tapping data used to make the identifications.
Robert, Craig
This version of the jitter spectrum includes photos of the optics. It should be easy to lower the Q of some of the higher-Q optics like M3.
This is a very interesting and impactful glimpse into the current state of PSL table jitter coupling. Wish I had noted the study on first release.
I'm sure many would be interested in seeing an equivalent study of LLO, in everyone's spare time ![]() .
.
This study is relevant to IIET Ticket 4639 with title: "ECR: Modify attachment of optics mount to mounting plate on PSL periscope, previously Bug 1140". This IIET Ticket corresponds to the upper periscope mirror mount, with designator IO_MB_M6.
This study is relevant to IIET Ticket 5132 with title: "Move IO input beam PZT-mount from periscope to PSL/IO table surface". This IIET Ticket corresponds to the steering mirror upstream of the periscope which has a PZT actuator, with designator IO_MB_M4.
This effort was subsequently re-examined by Robert in
https://alog.ligo-wa.caltech.edu/aLOG/index.php?callRep=44460
J. Kissel, J. Warner

Jim and I went to B&K hammer EX’s PCAL periscope this afternoon and came across a new bug I hadn’t seen before: the hammer channel’s BNC input spigot was constantly red while connected, and after activating a known functional template (which showed the 3-axis accelerometer working as normal), the hammer’s sensor input bar was flashing red and reporting that it was saturating / overloaded. However, between the ~1sec cadence flashes, you can see the glimpses of a normal hammer behavior. We tried:
	- Power cycling the satellite box
	- Closing and re-opening a known functional template (and a different template)
	- Physically disconnecting the hammer from the satellite box, (the spigot stays red — but that happens normally when a sensor is disconnected)  and reconnecting it
	- Swapping out the hammer’s B&K BNC with a normal BNC
	- Shifting all of the inputs down by one (doesn’t work at ALL! Sad… why have 6 channels then?)
	- Clearing and Re-selecting the hammer species in the template (8206-003)
	- “Clear and Detect Hardware” in the Hardware setup
	- Physically disconnecting the hammer’s accelerometer from the head and reconnecting it (grasping at straws … )
	- Changing the input gain on that channel in the template’s hardware properties (really grasping for straws… )

Attached are pictures of the satellite box in error, and the activated template in error.

I've got emails out to the experts and we'll continue to debug the hardware outside of the clean room, but this may mean we forgo B&K hammering of this periscope.
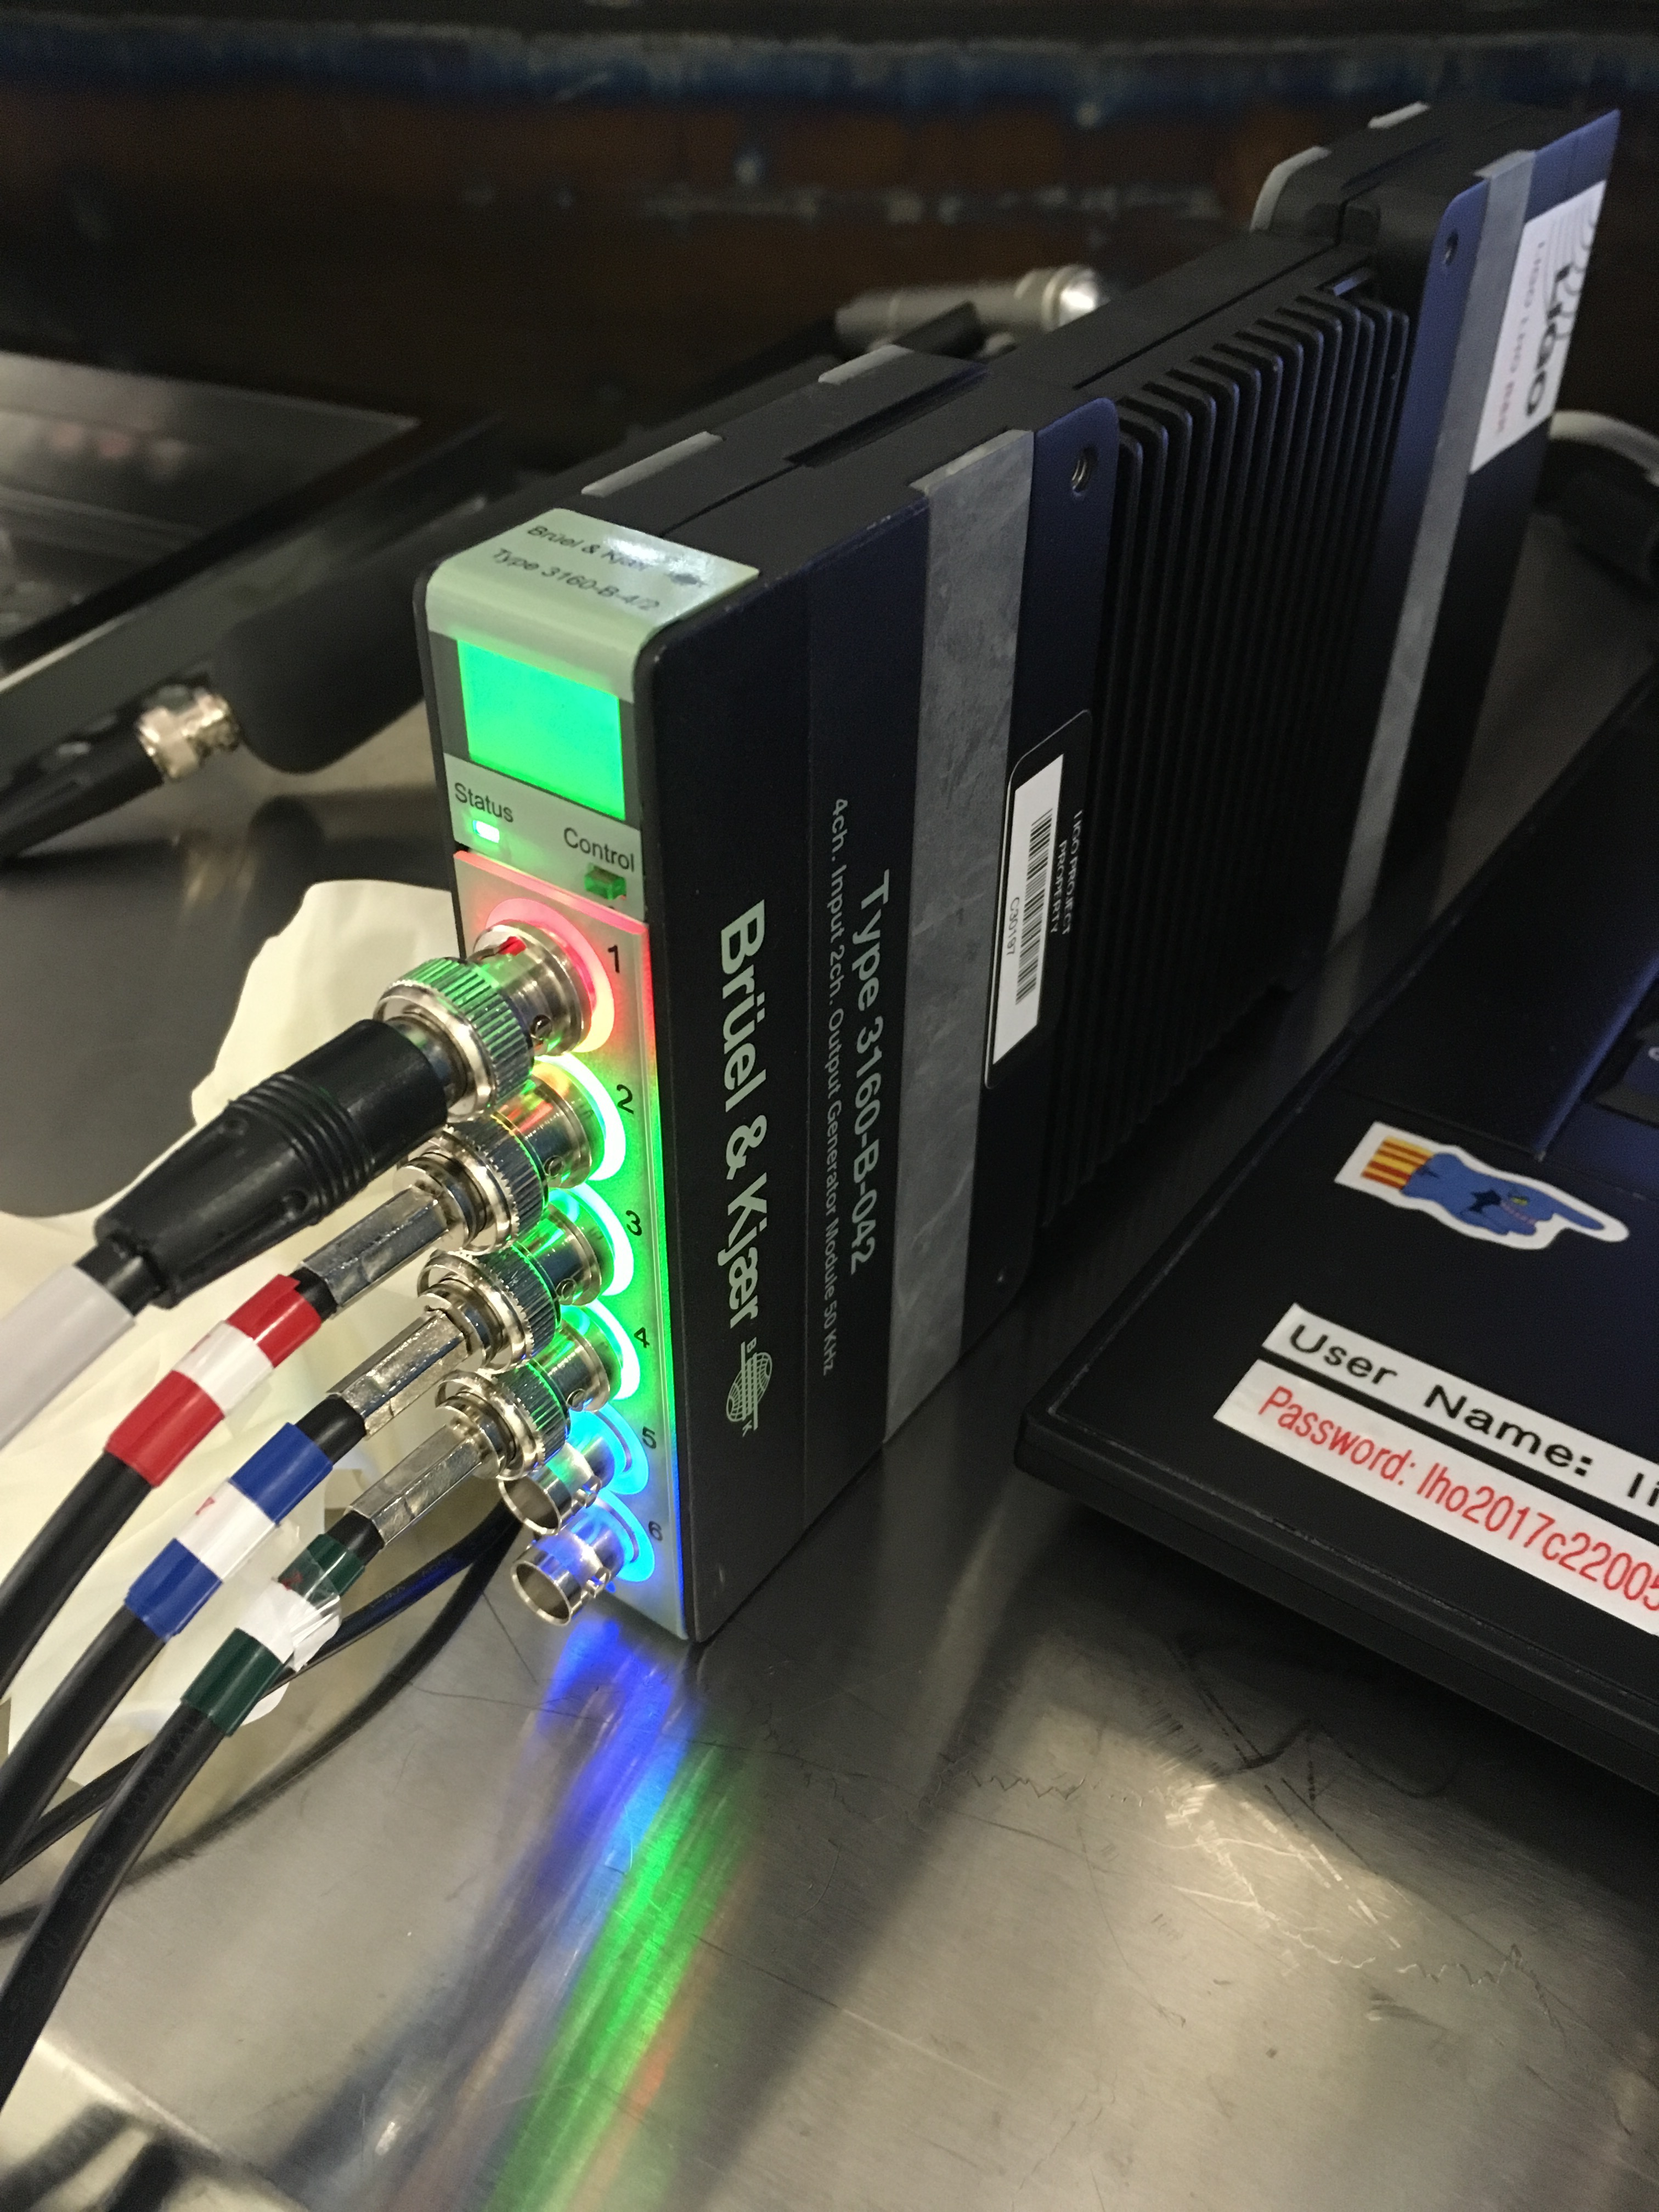

This failure is being tracked by FRS Ticket 10817.
