NikoL, Rick S
We switched on the the Pcal laser to check the beam pointing after the vibration damper and baffles installation work last week.
We (with Corey's help) pointed the ETM to center the optical level signals.
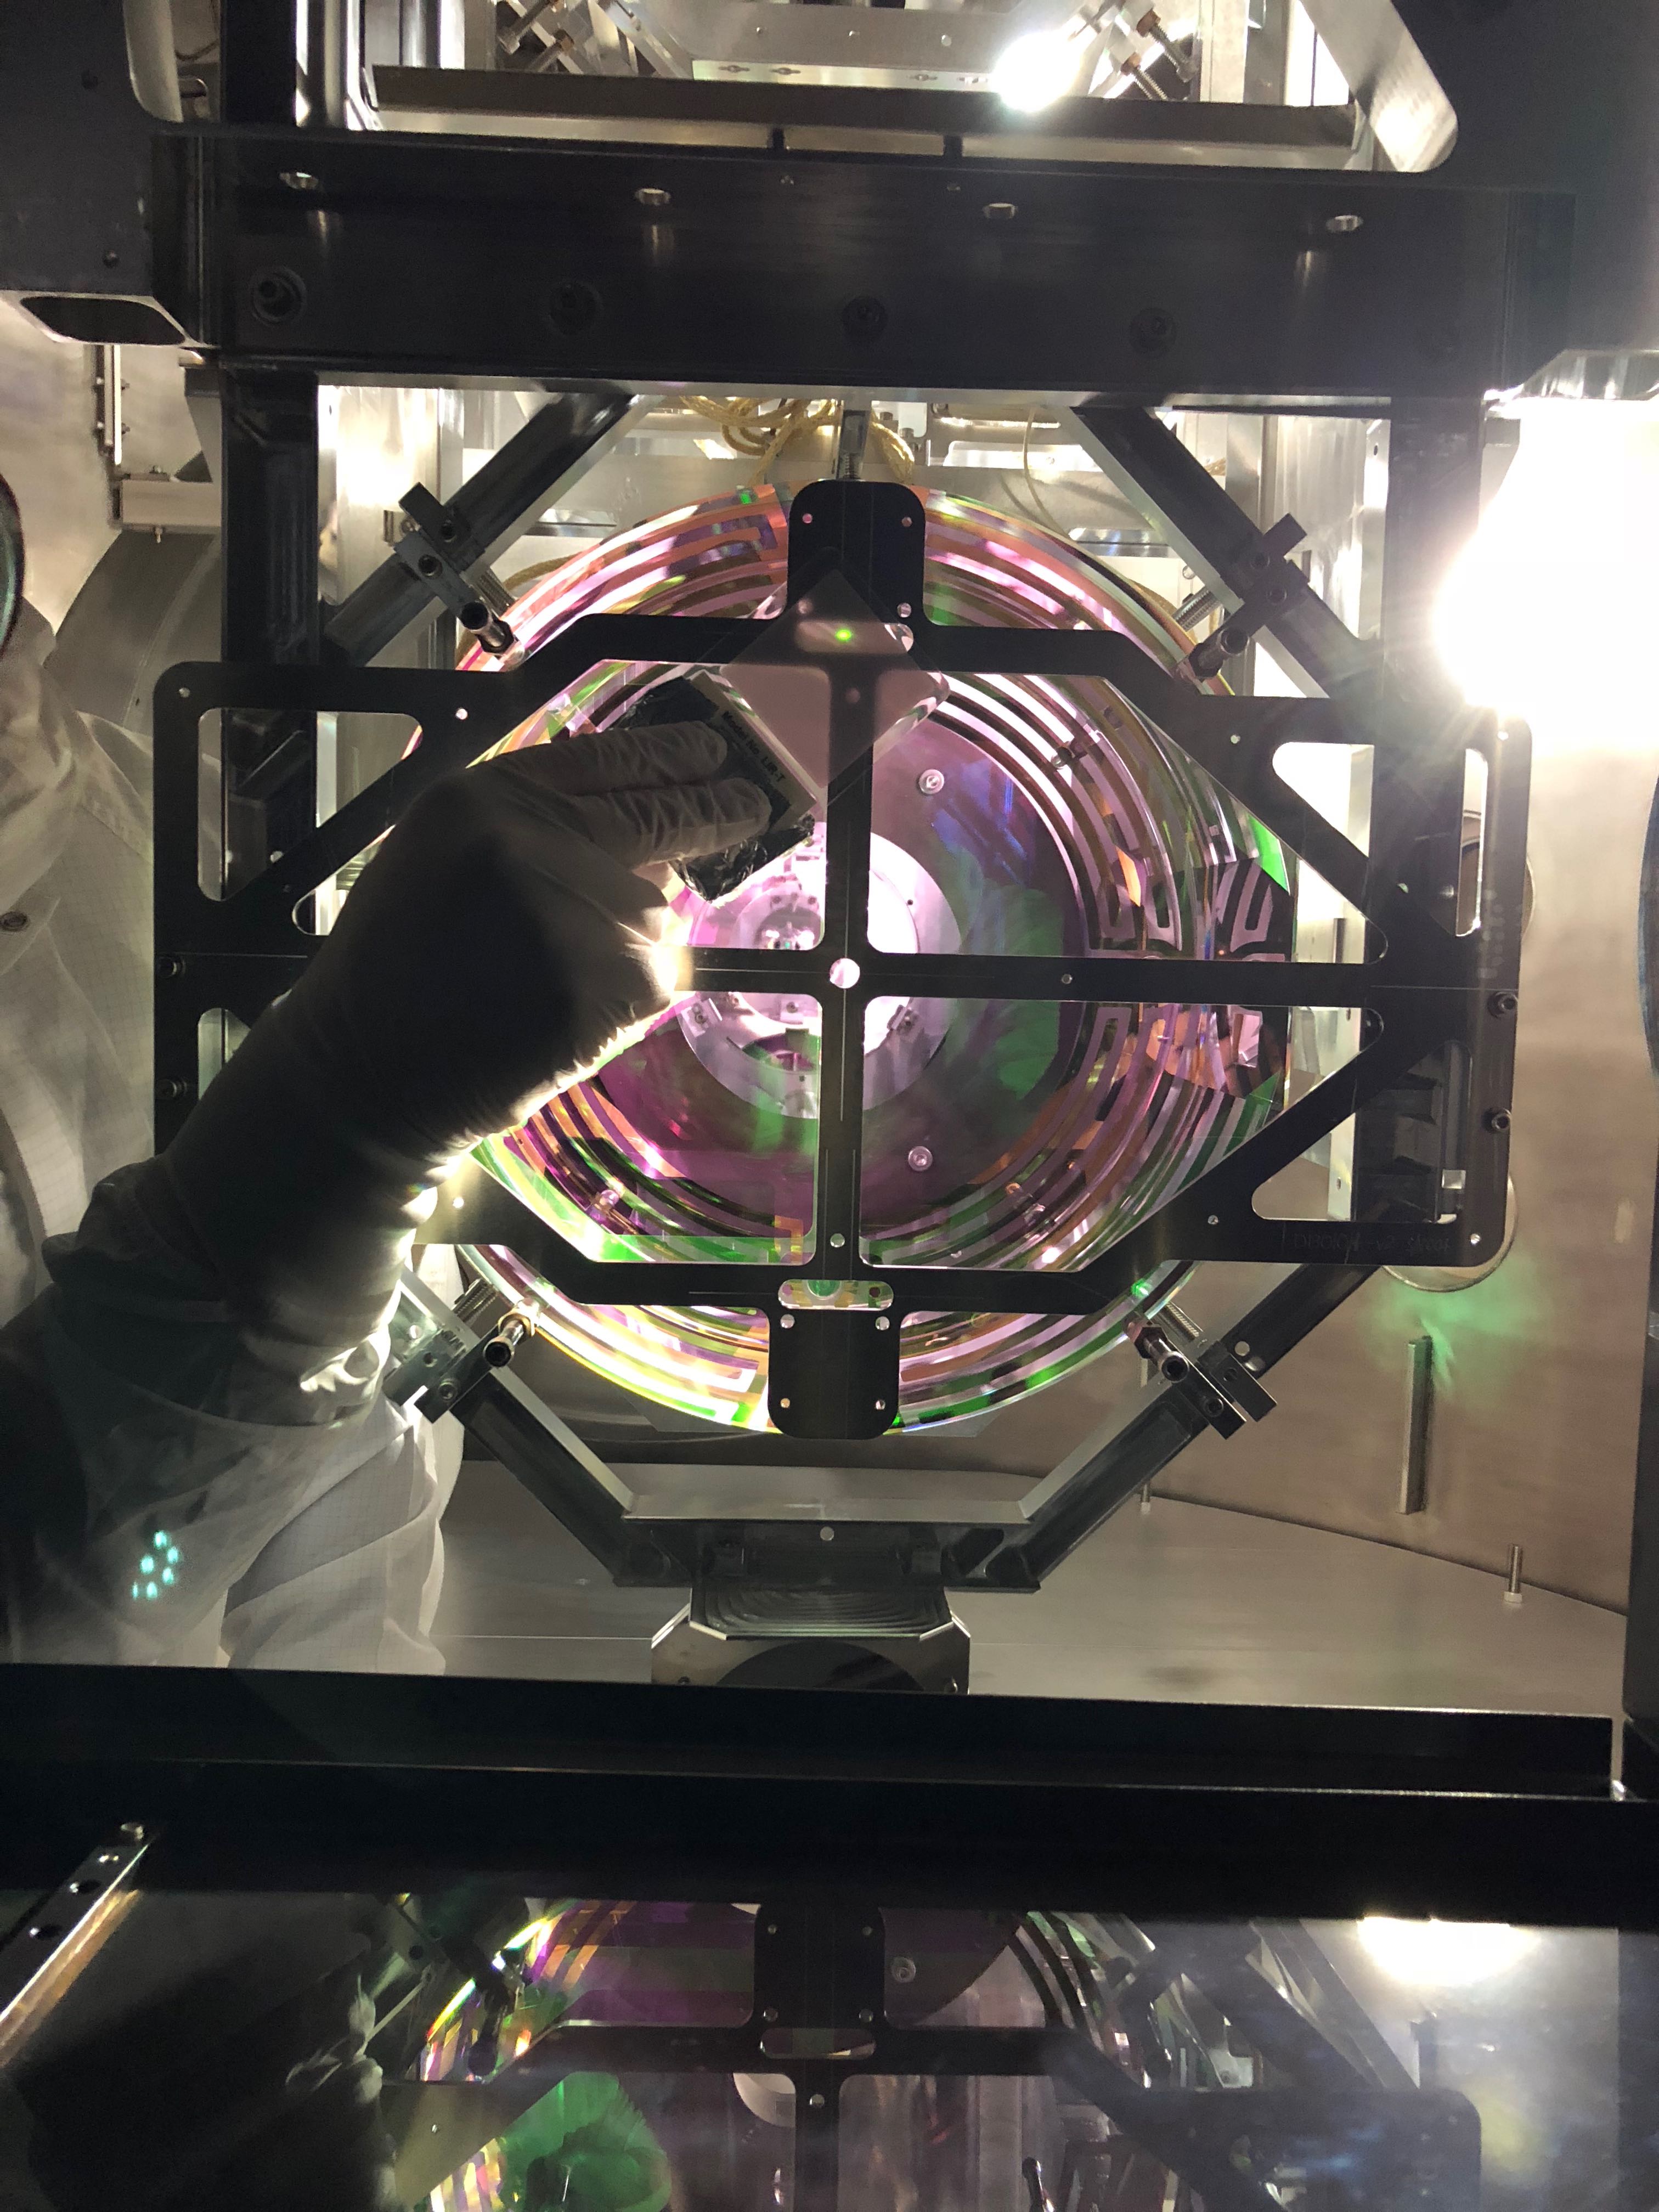
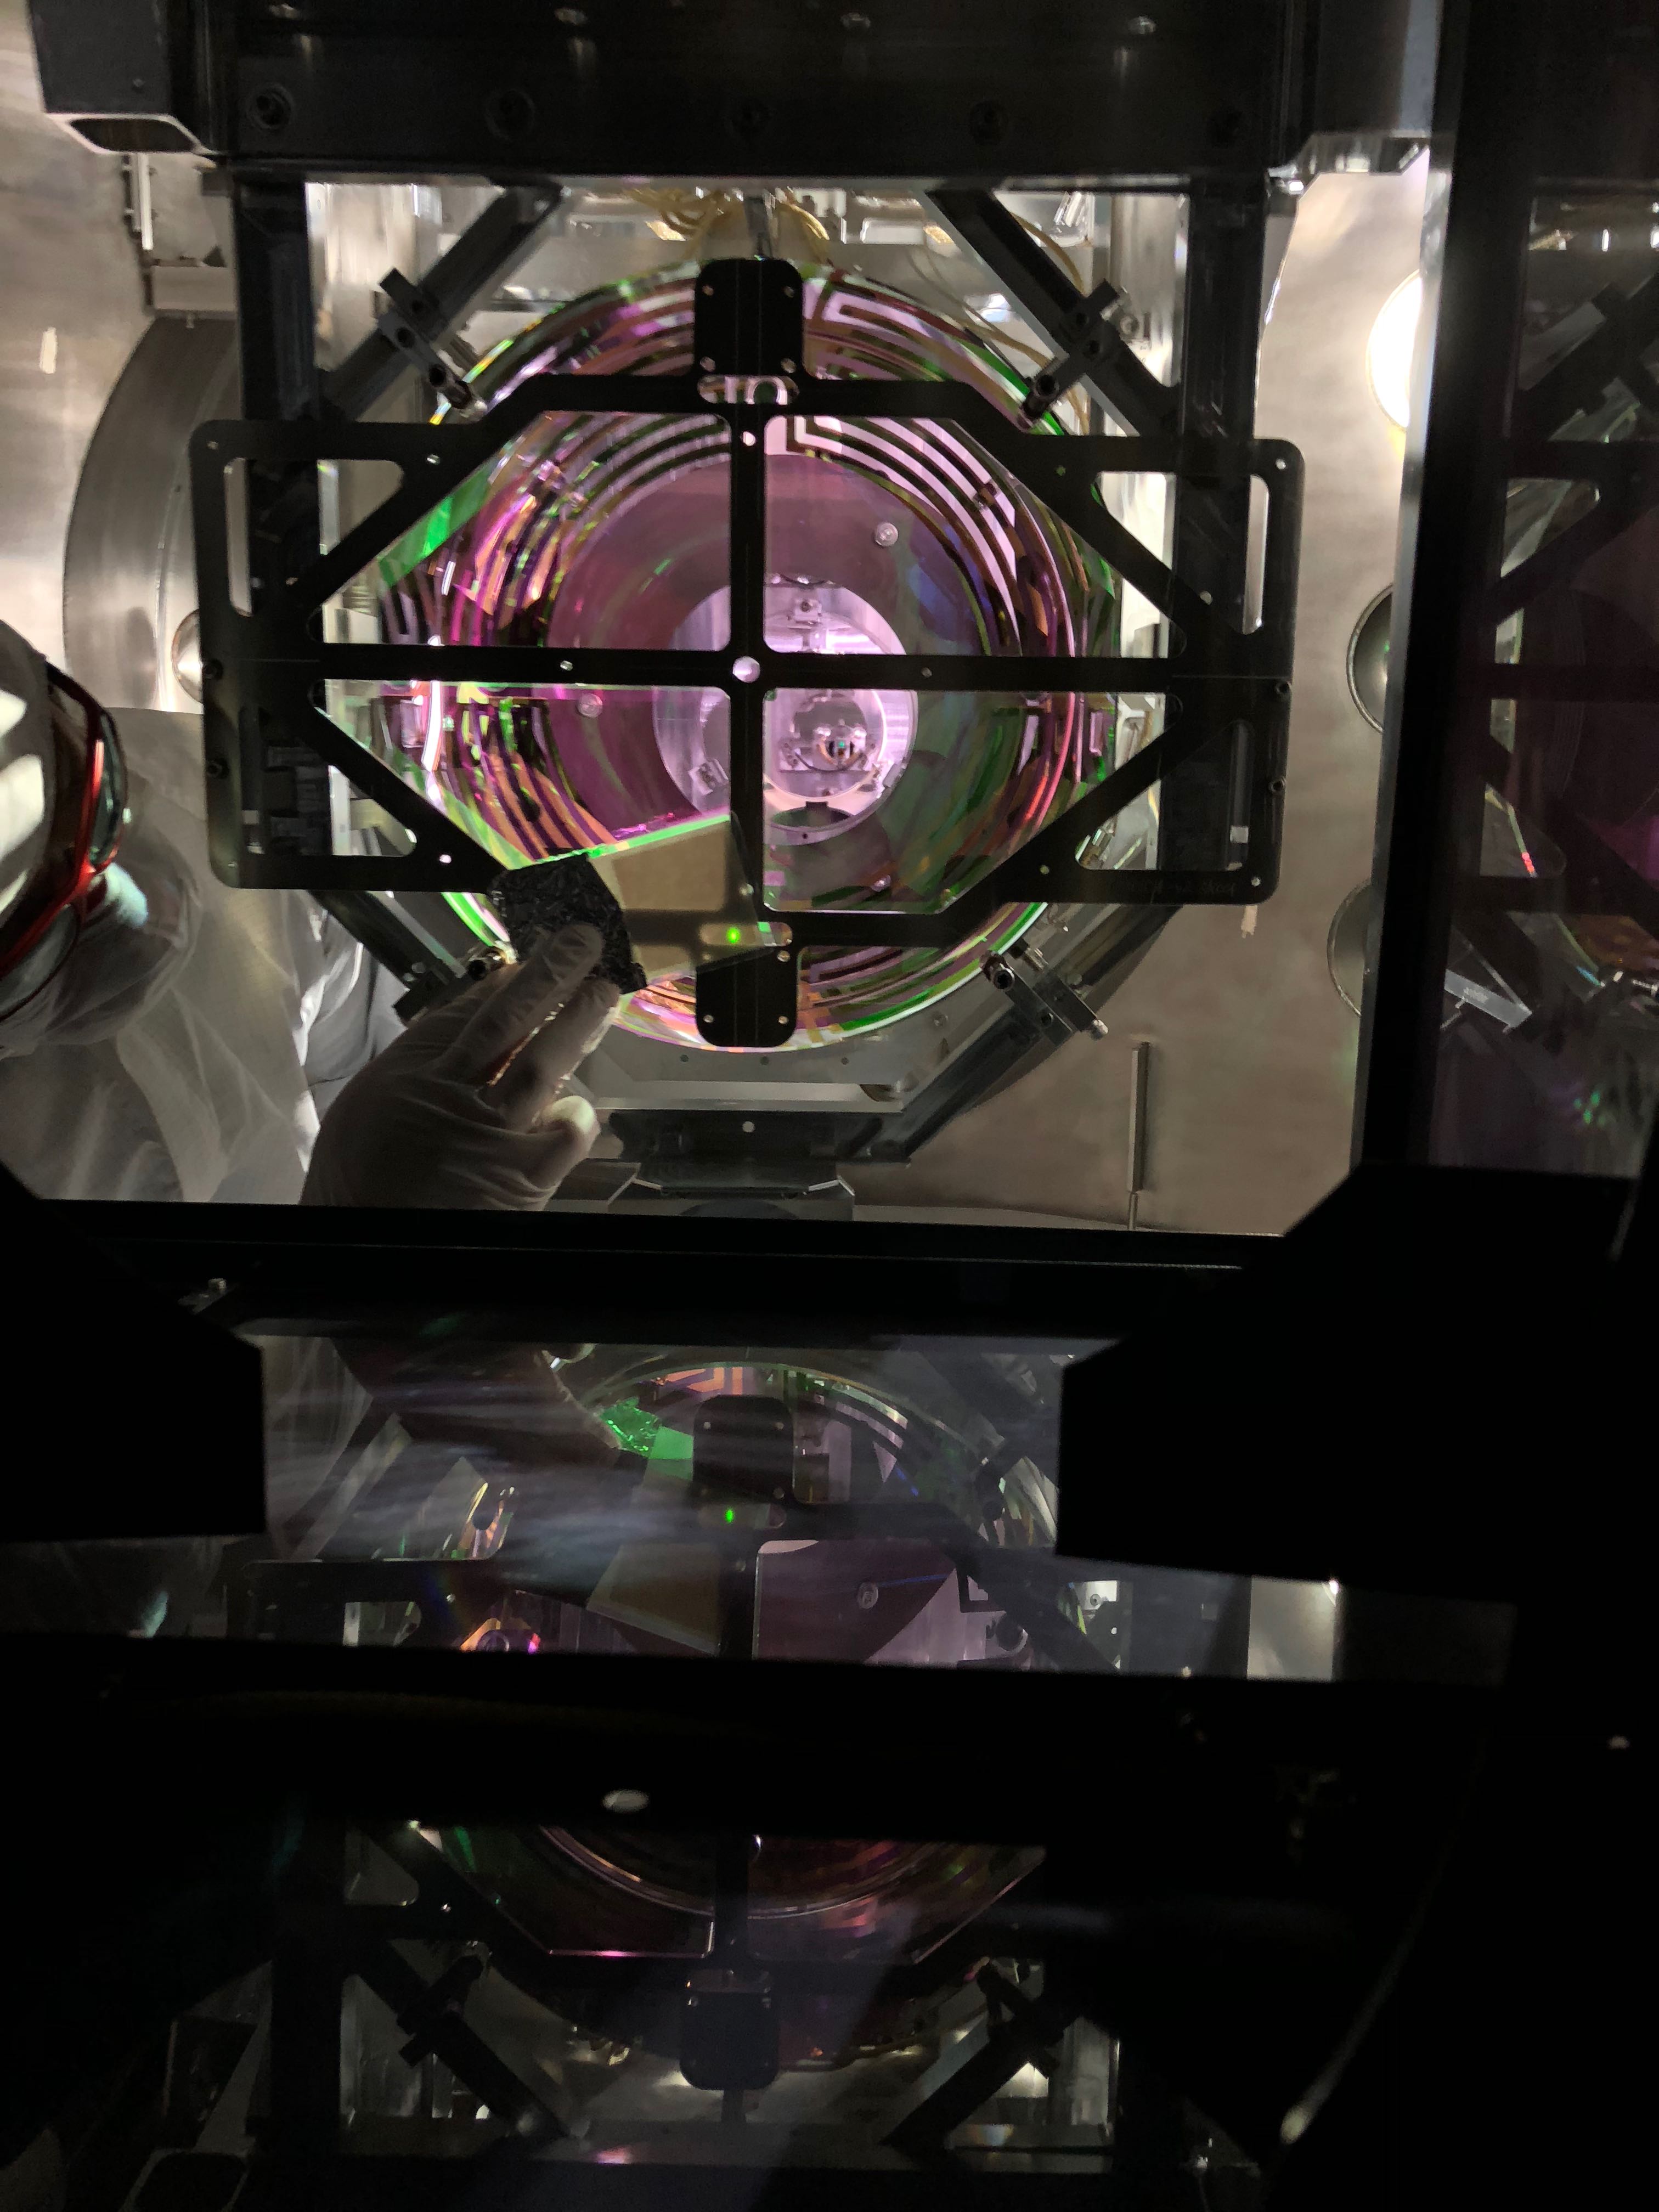
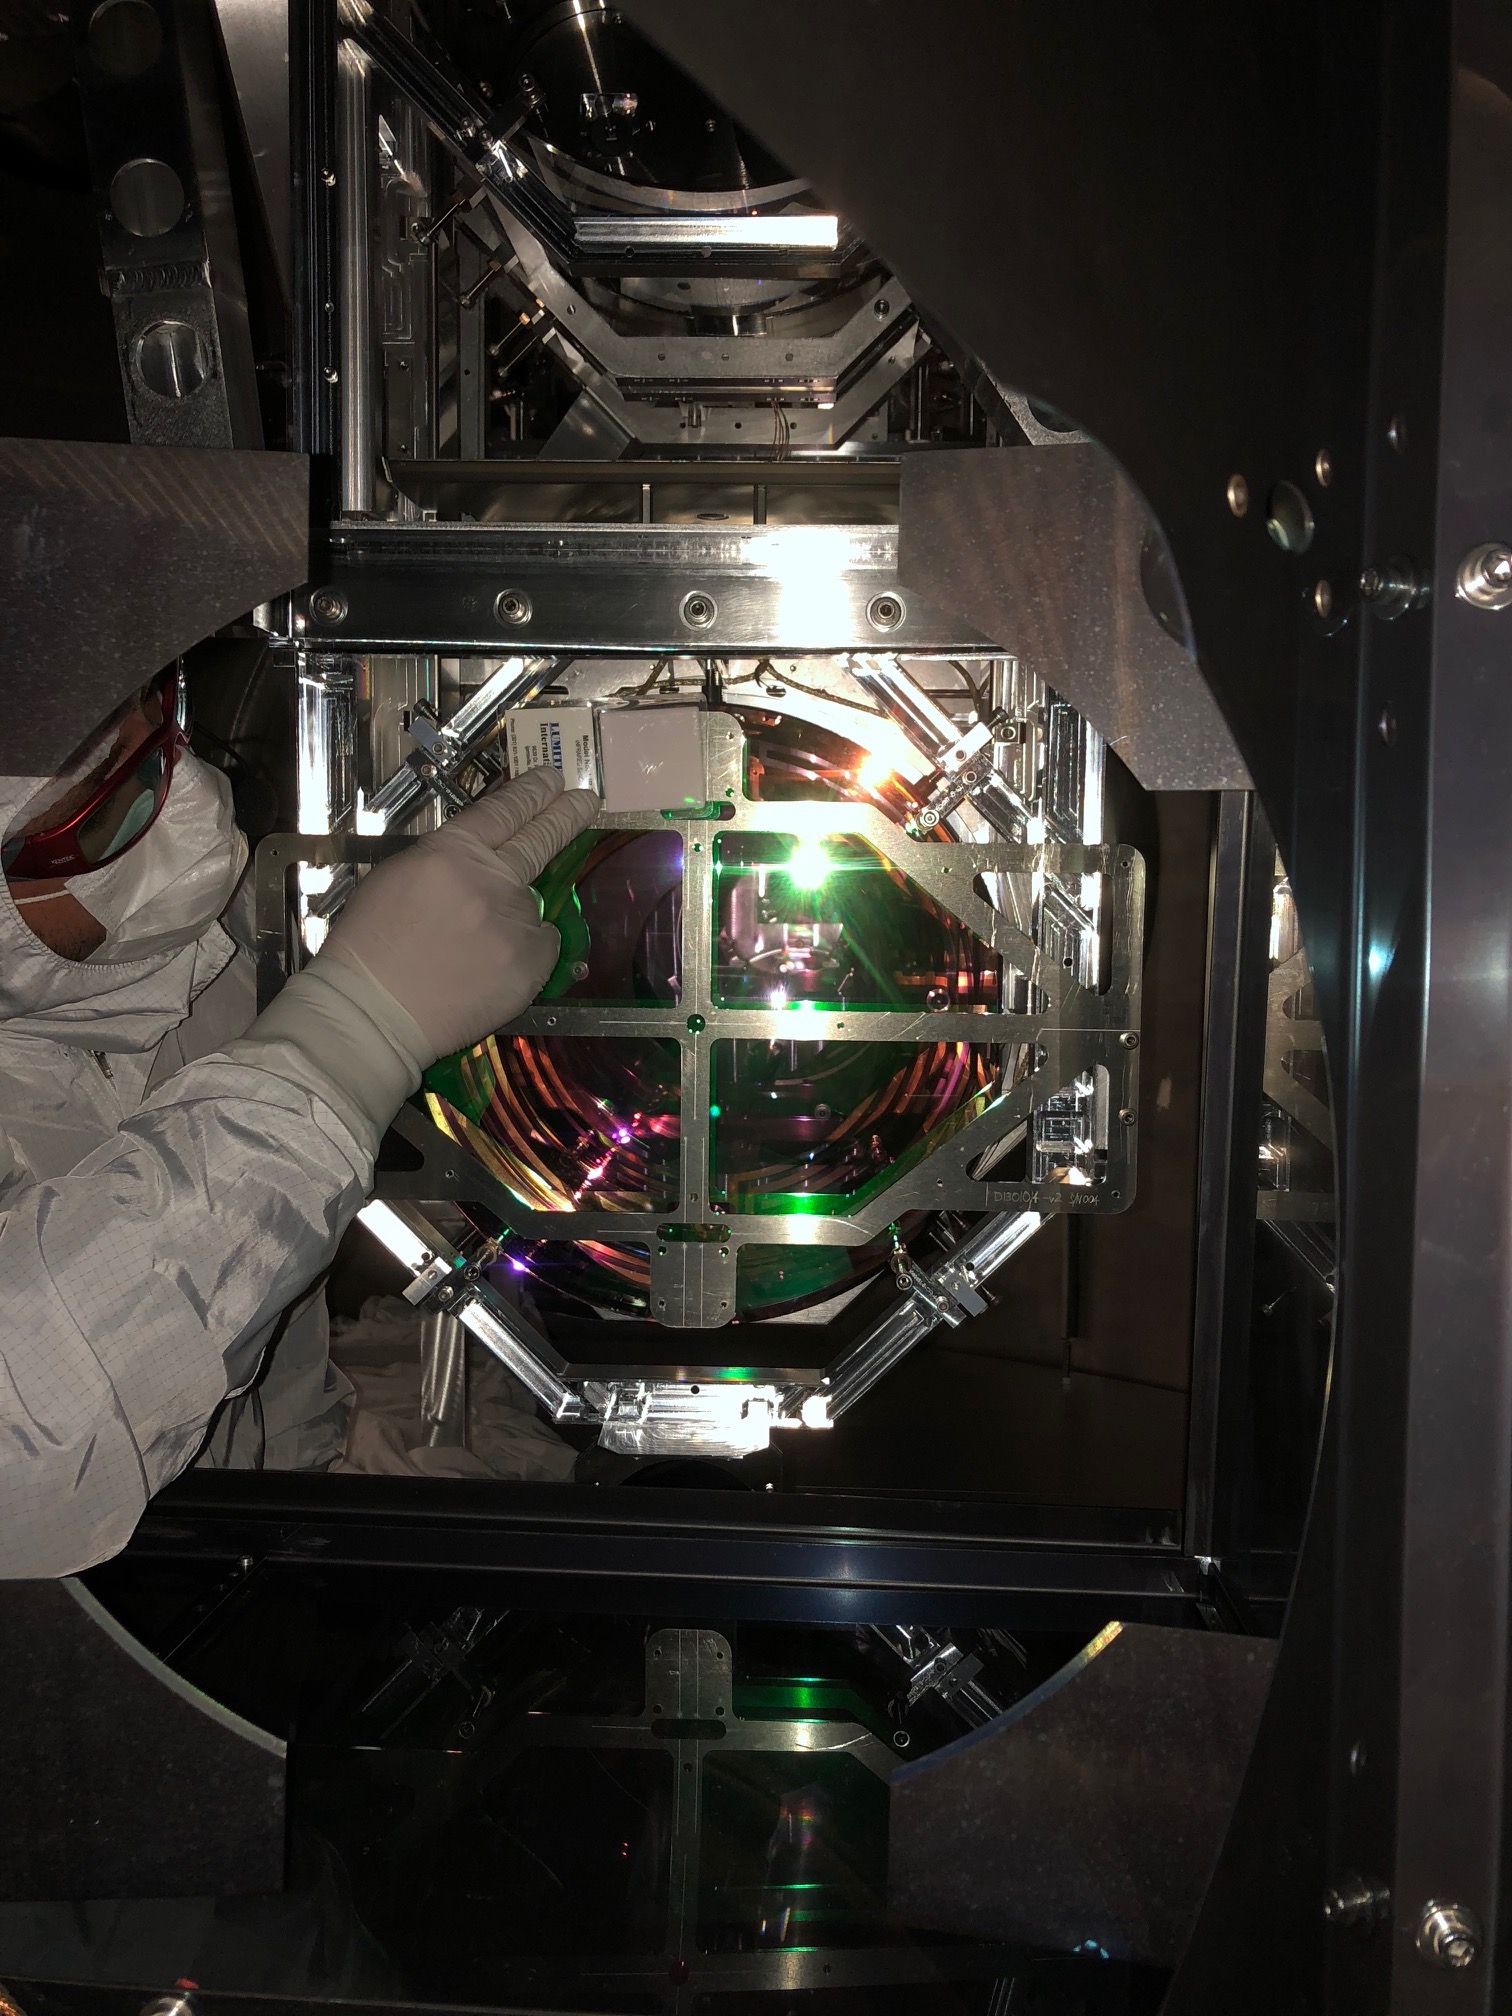
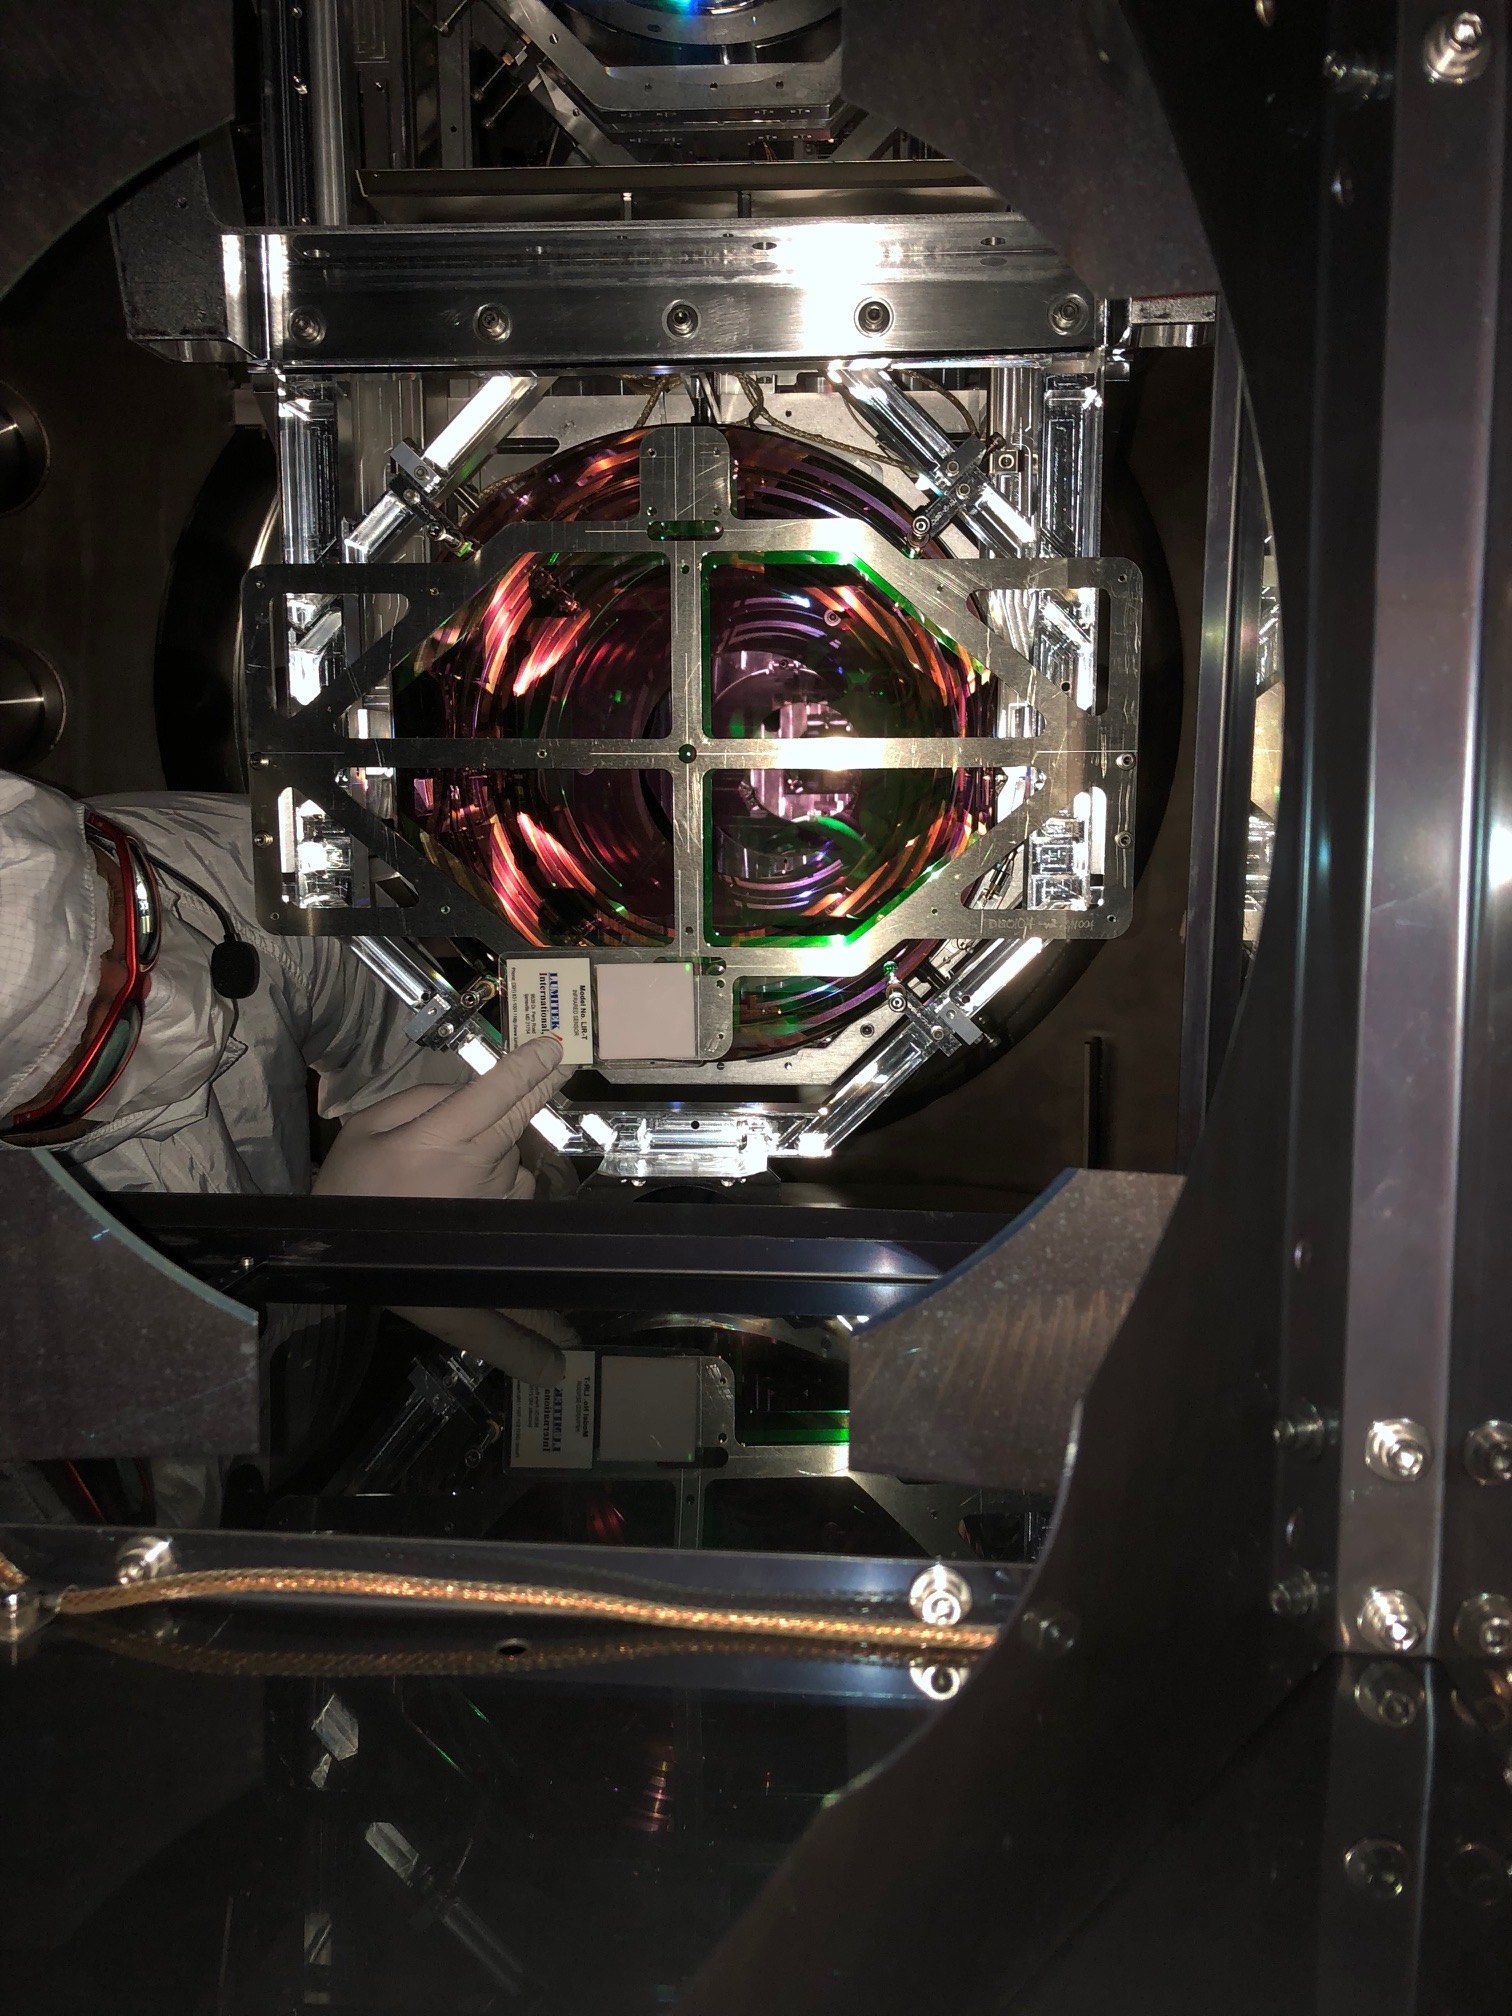
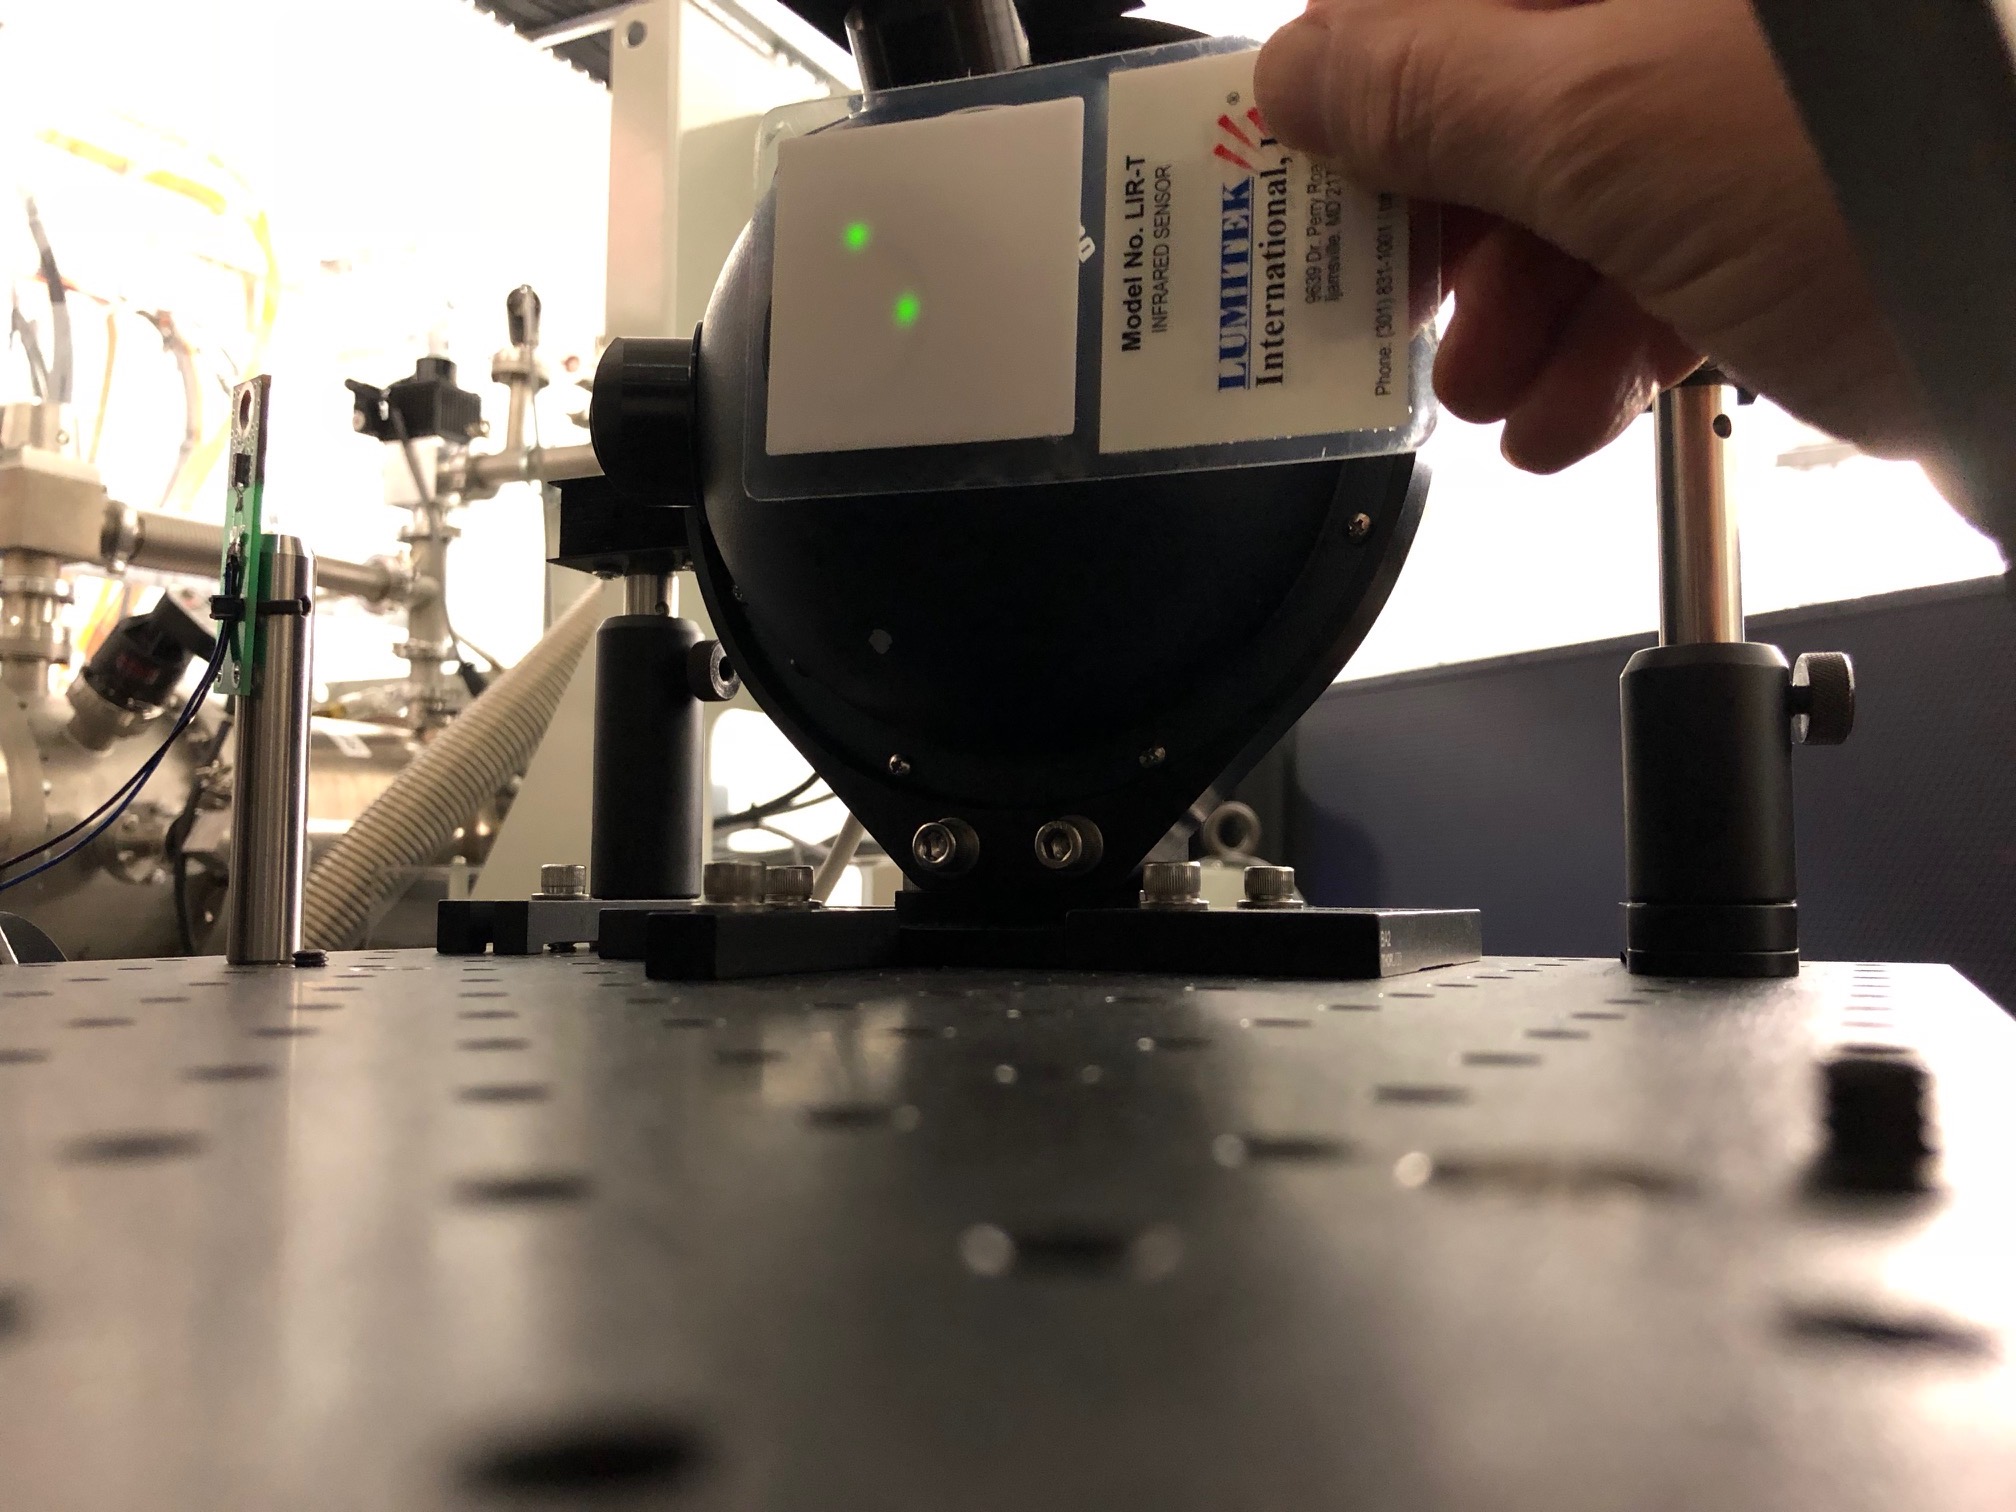
With this alignment the Pcal spots are way off, more than 1 cm (see attached photo, both beams should be (and were earlier last week) centered on the integrating sphere aperture).
Keita is going to check on the TMS alignment so we can try to discriminate between the possibility that the Pcal periscope shifted during the alignment work and the possibility that the ETM pointing (or OptLev) has changed.
If the ETM pointing is off, it would be on order 10 mm over 10 m, or about 1 mrad.
TravisS, NikoL, RickS
It appears that the Pcal periscope structure moved (top pitched back, away from the ETM) during the "Baffles and Shields" installation.
The attached photos show the spot positions on the ETM target both before (last Wed.) and after (this morning) the installation of the vibration absorbers, Mt. Brackets, and barrel baffle panels.
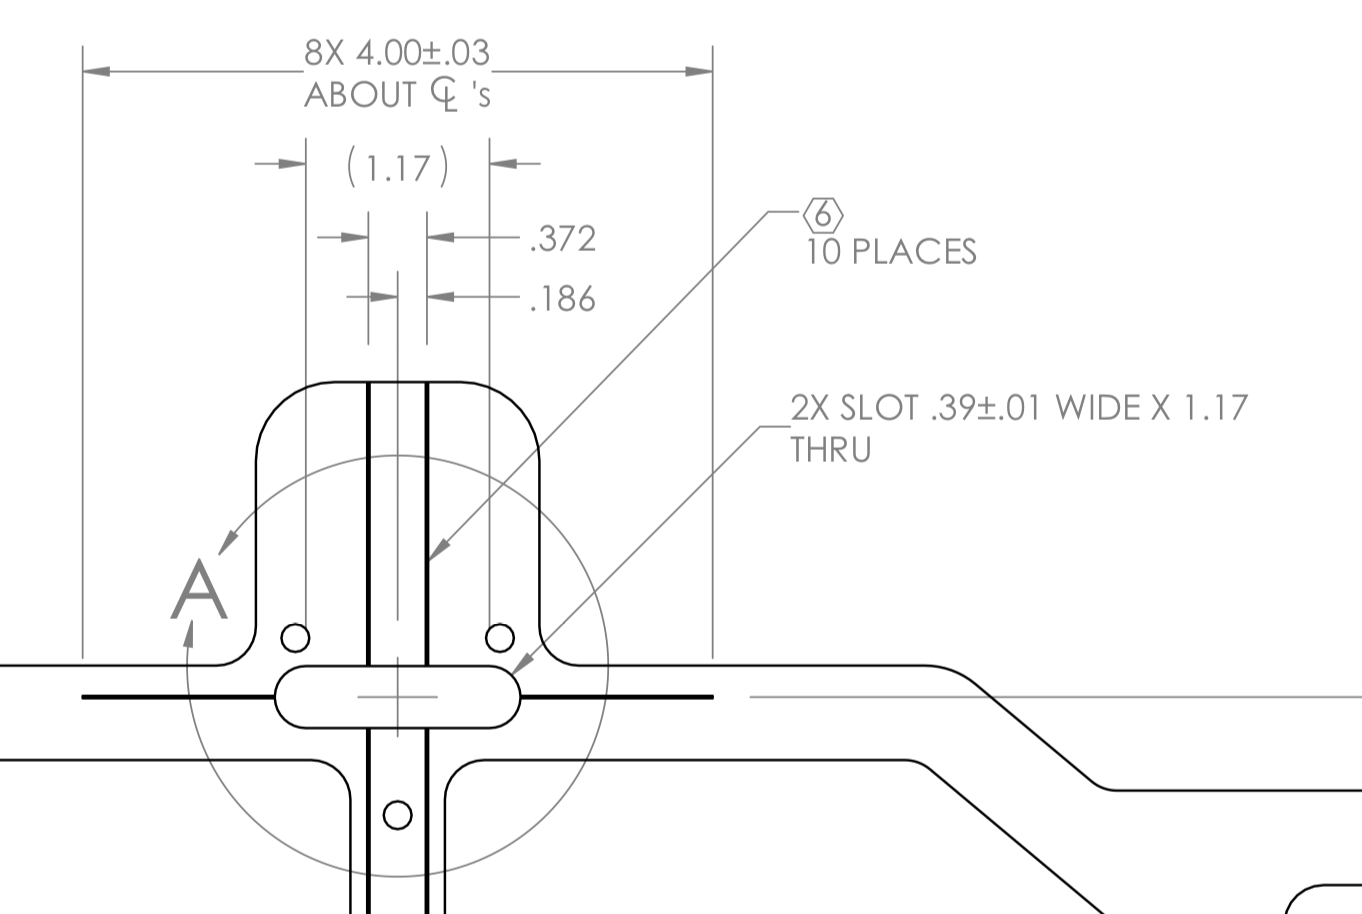
Also attached is a detail of the Pcal ETM target (D1301014) showing the dimensions of the features on the target.
It appears that the upper beam moved up about 3.5 mm and the lower beam moved right about 3.5 mm.
The gaps between the centers of the upper flexures and the A7 adapter wall were slightly more than 0230". Our goal was to keep them below 0.220". We set them significantly below 0.220" last week (maybe 0.210") but apparently the additional mass of hte hardware added reduced the compression (as expected, see LIGO-T1800047-v2).