Greg, Thomas
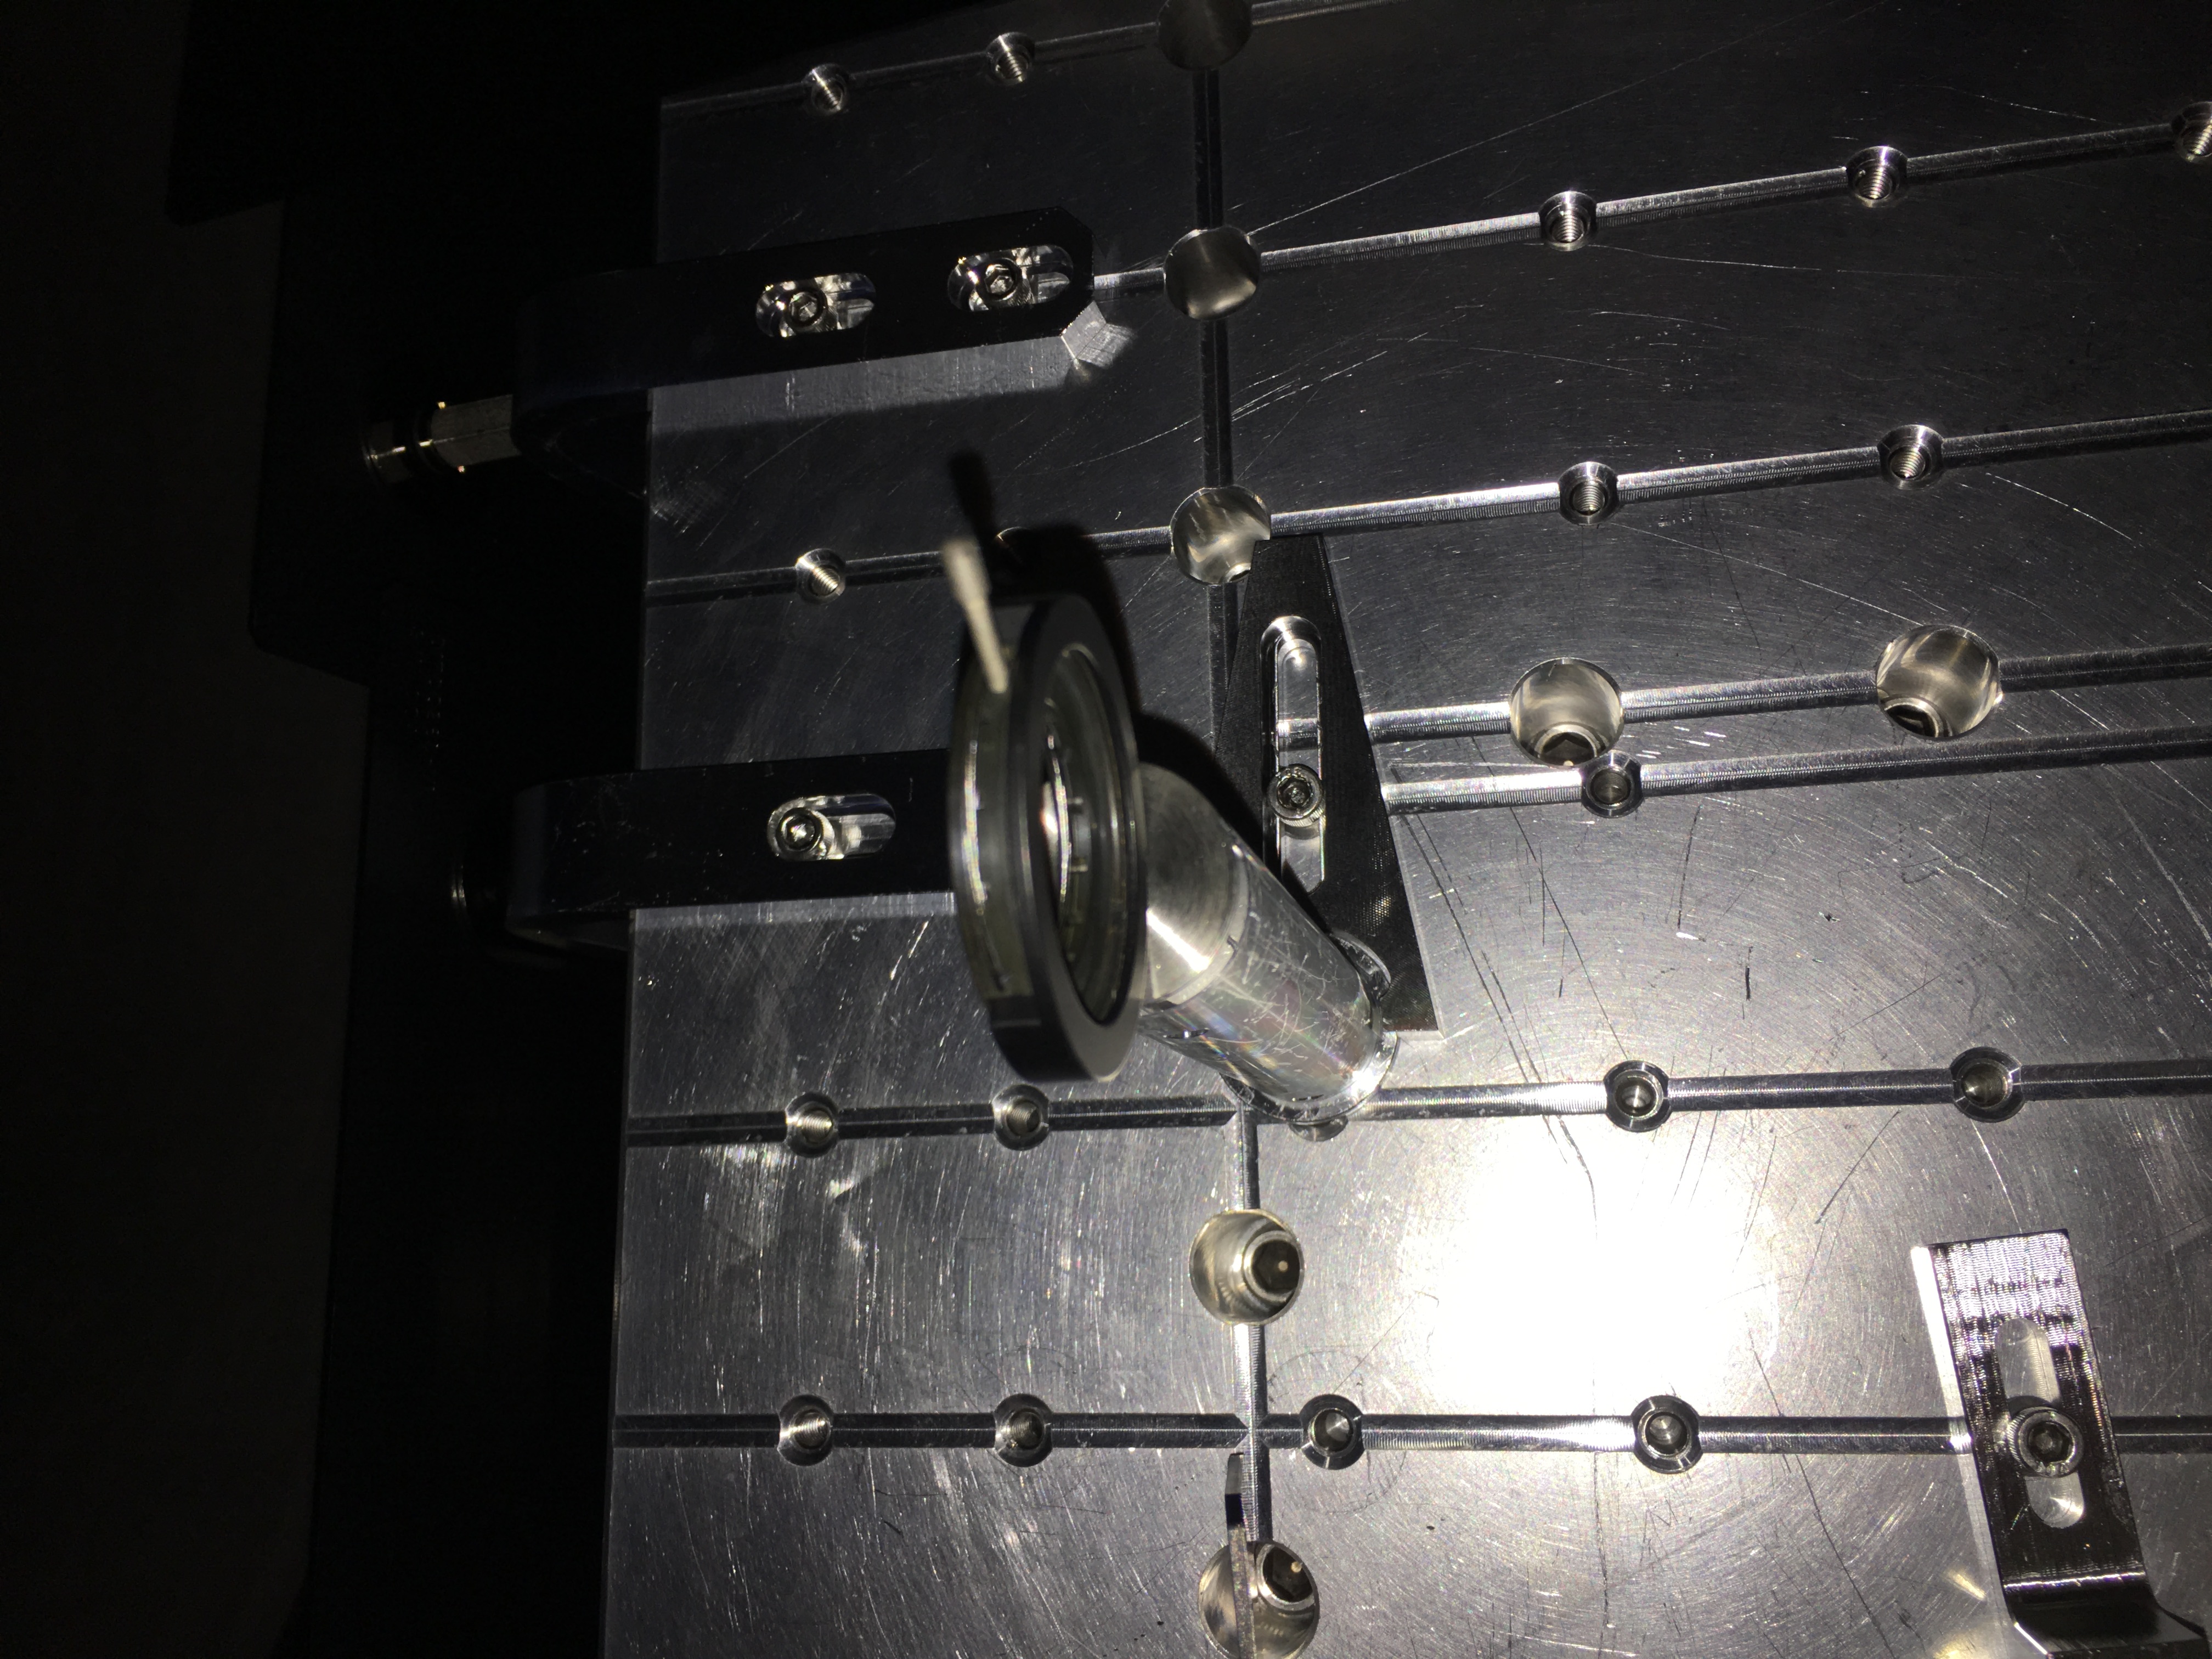
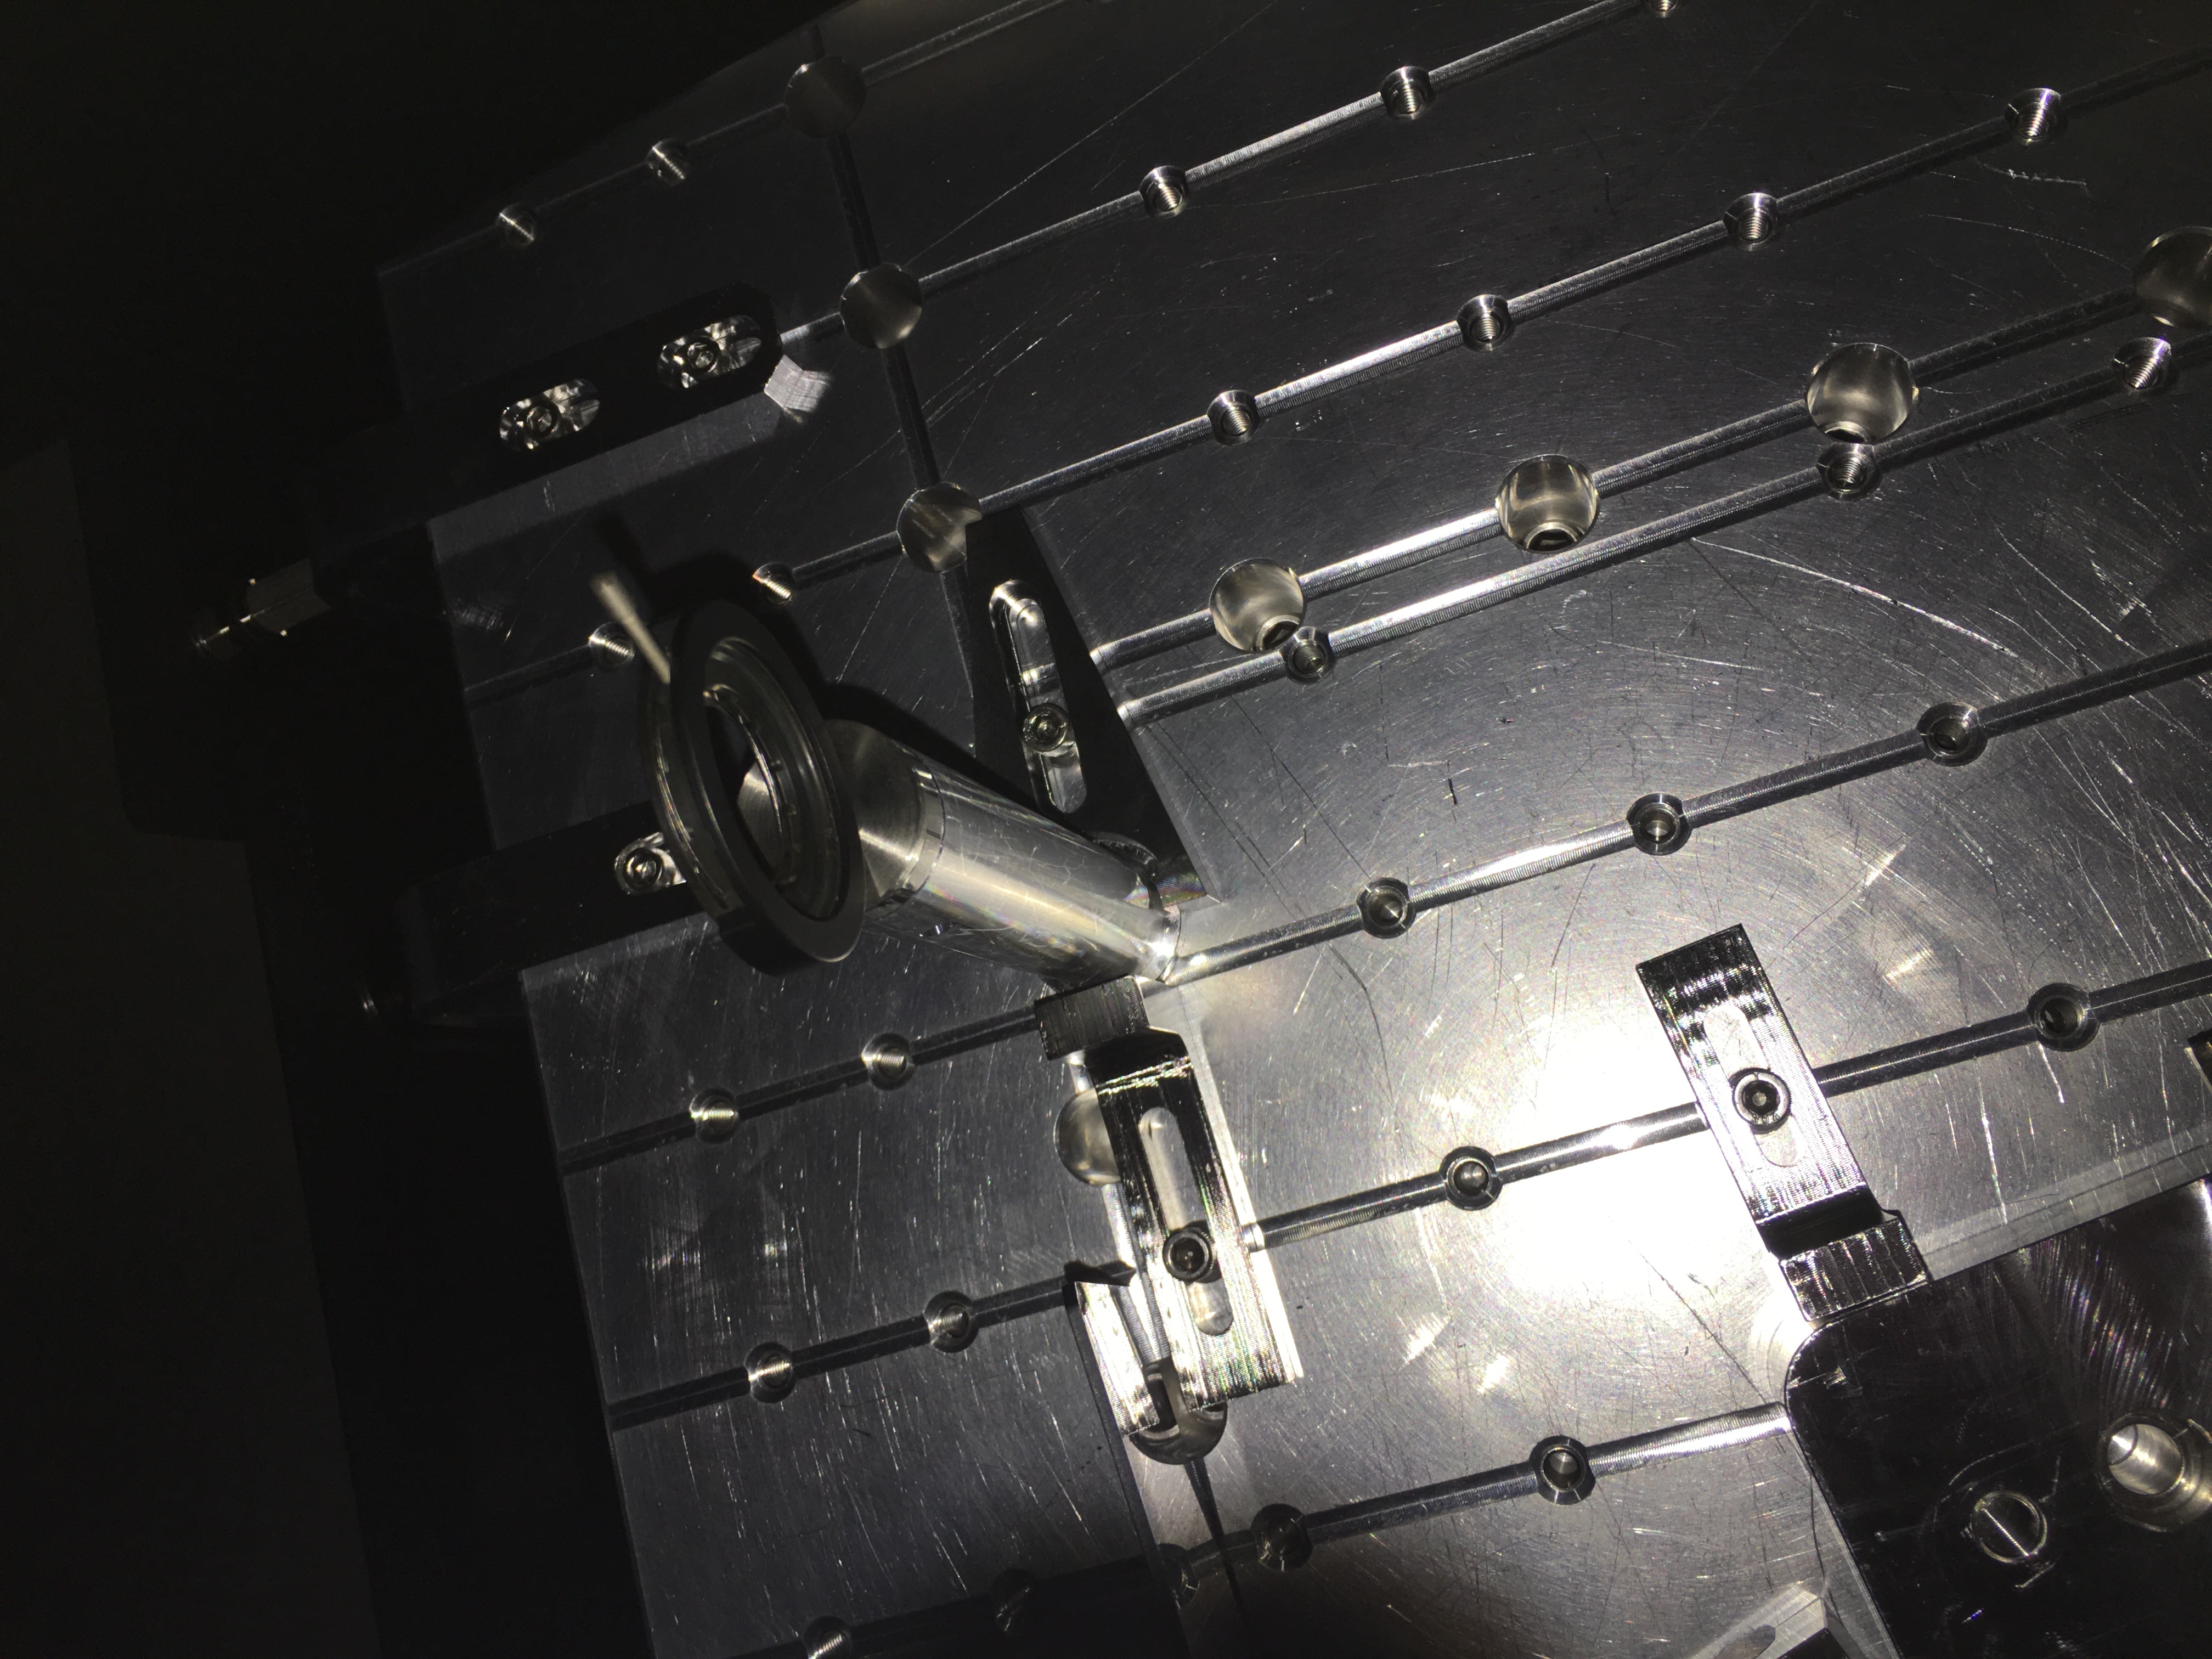
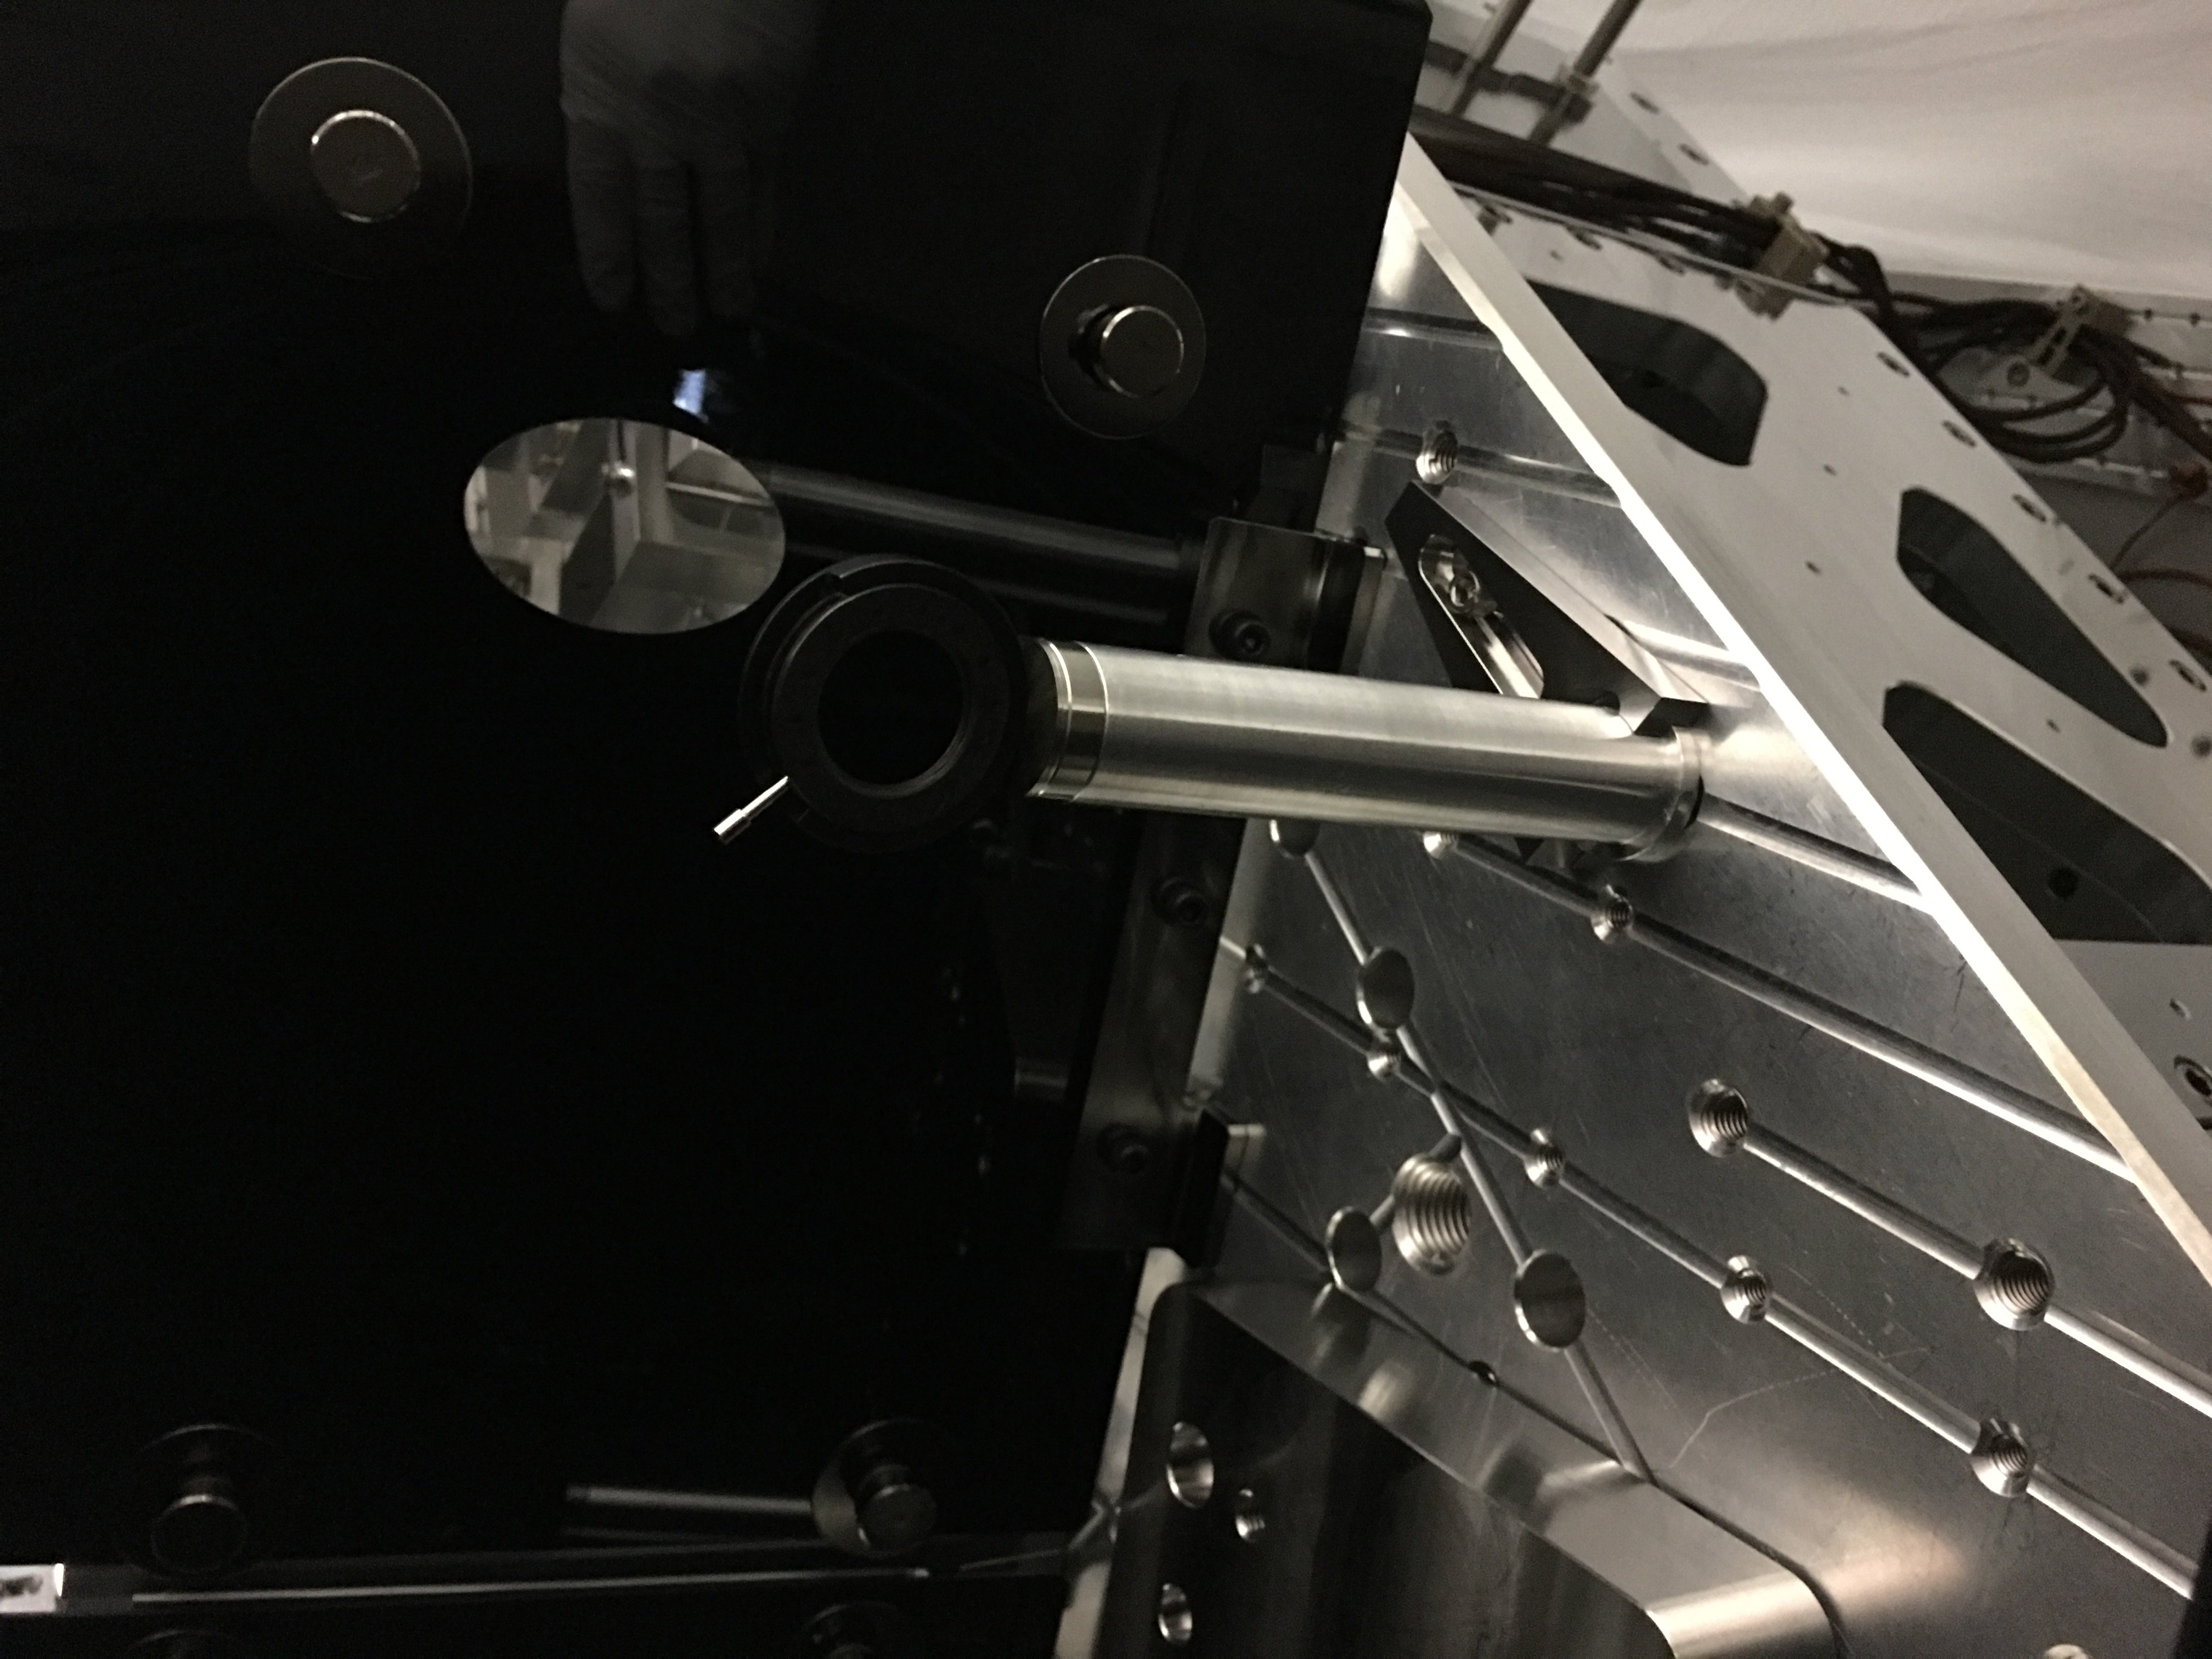
Darkhan and I moved the table back to HAM4 the other day, it's not quite in position yet because we haven't coupled to the viewport. After that, I set up an oplev laser to connected to the beam launcher so that we can align during laser safe.
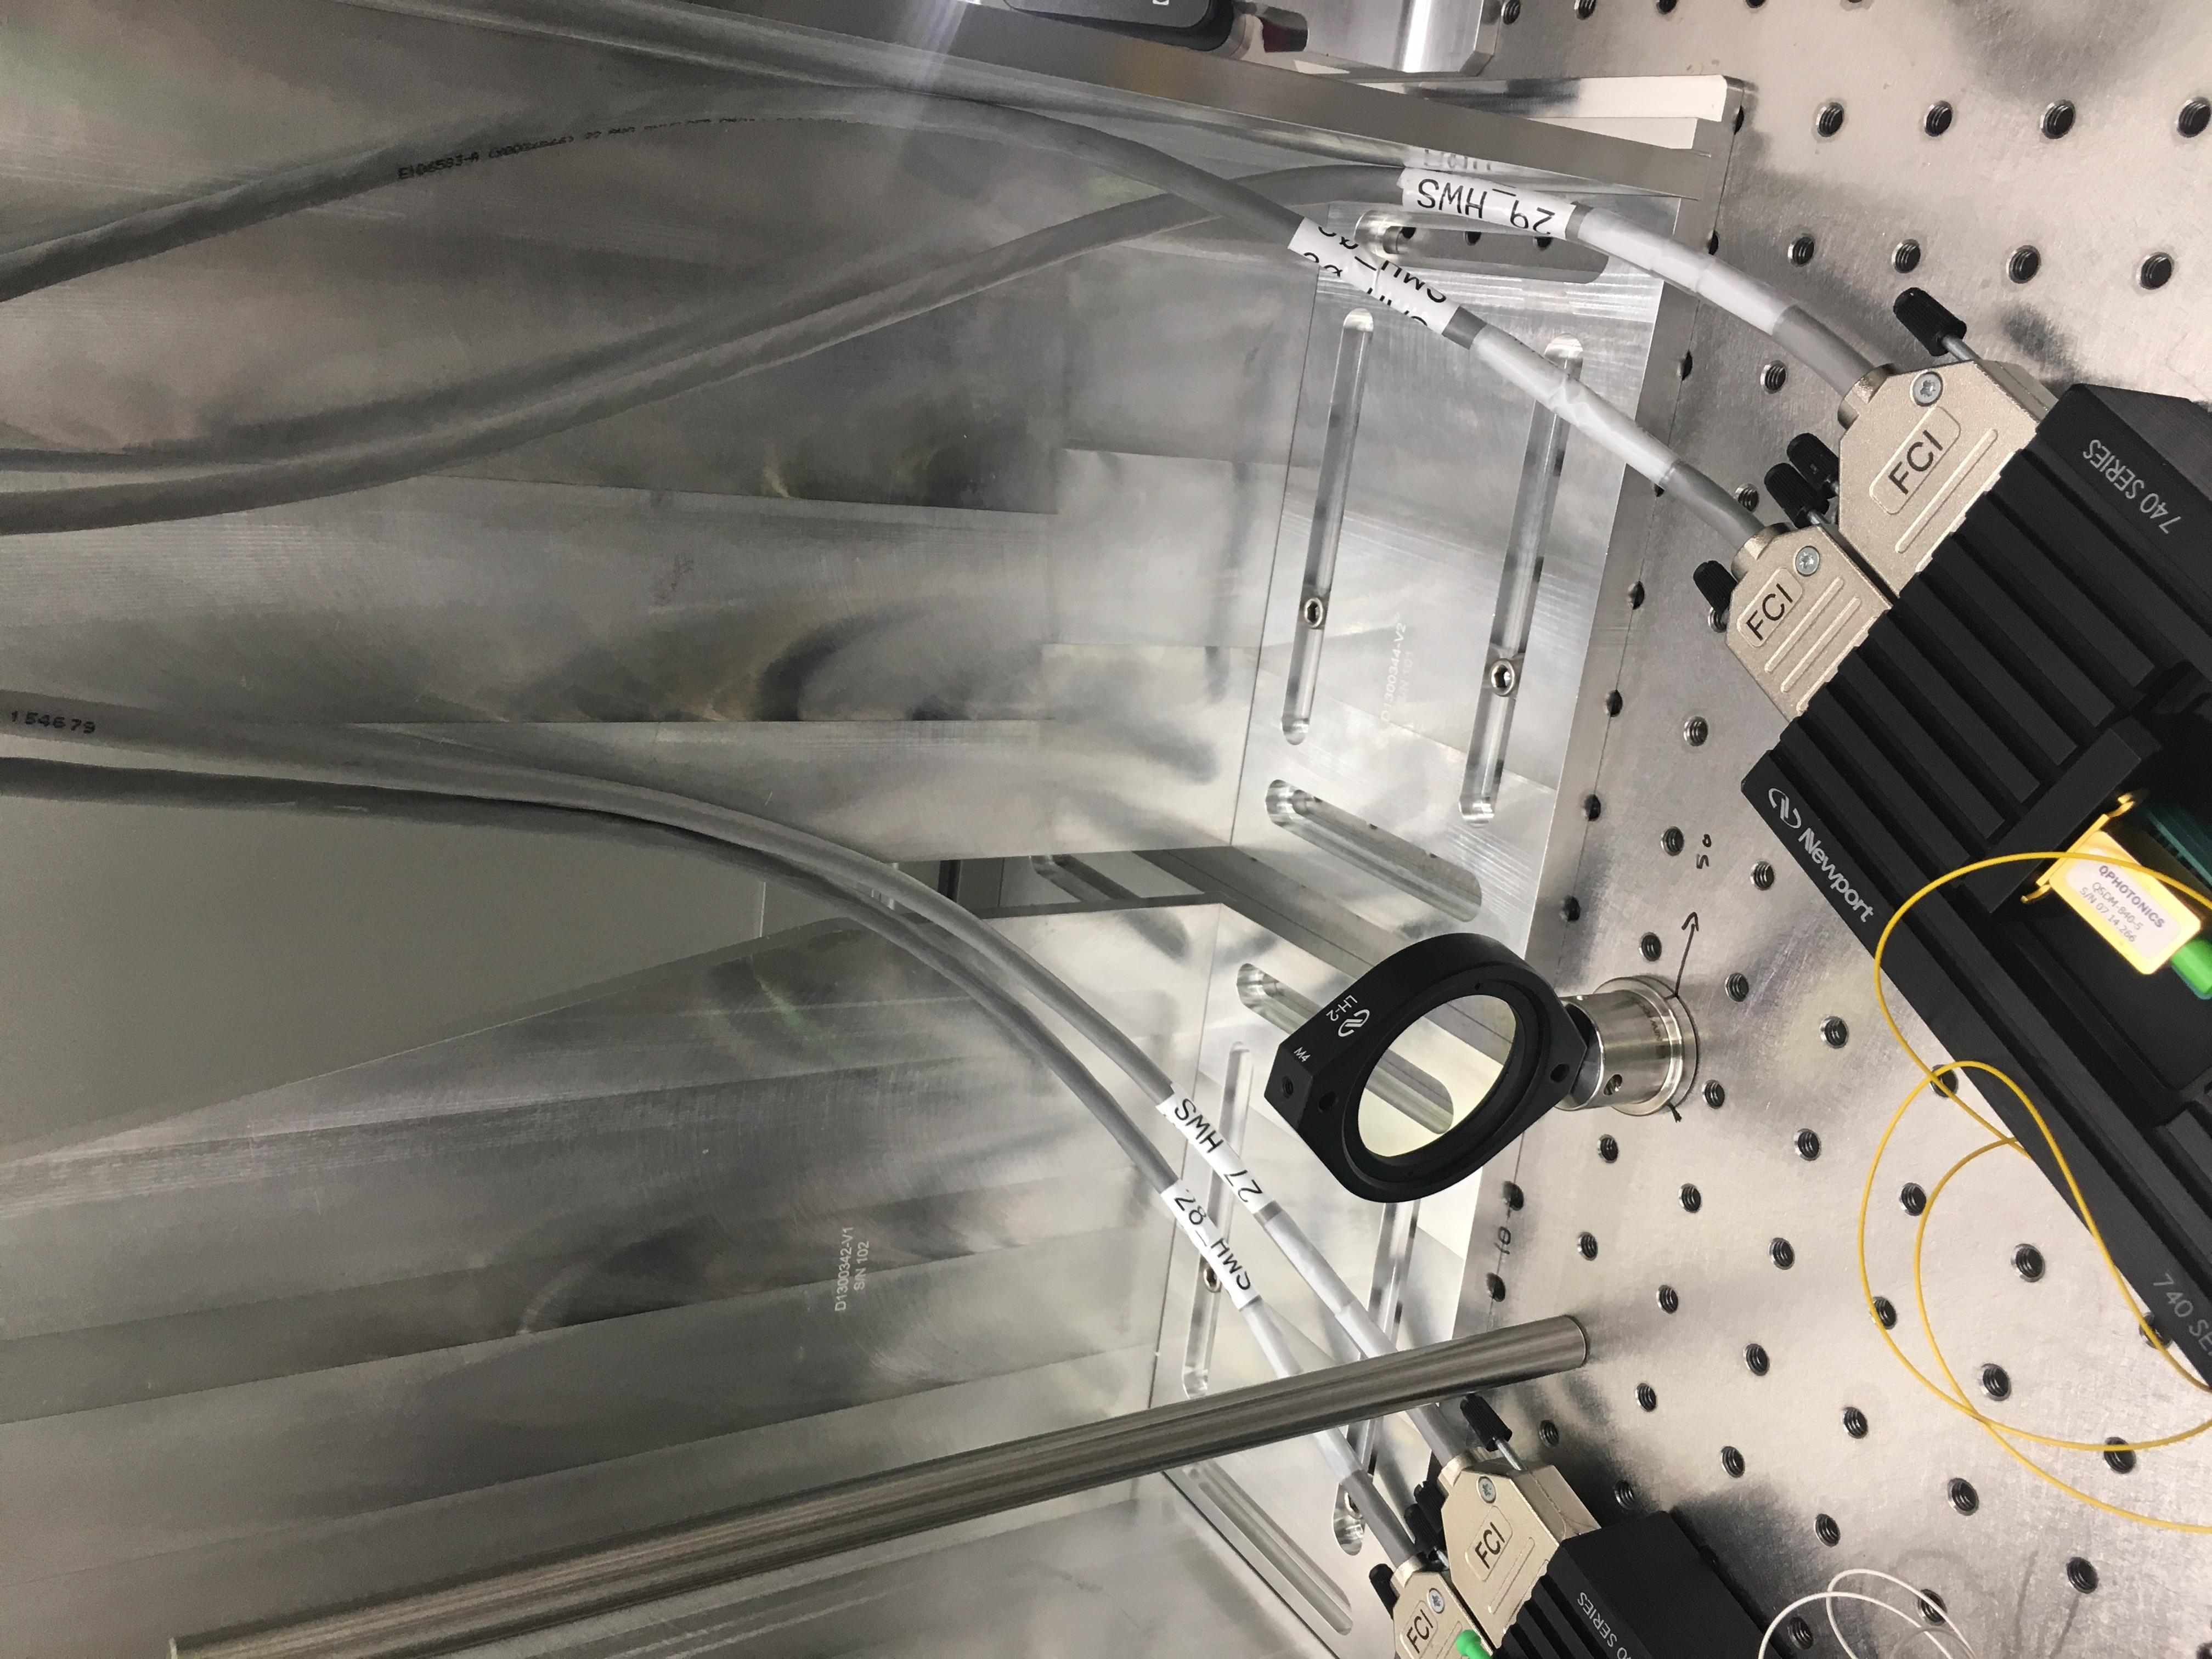
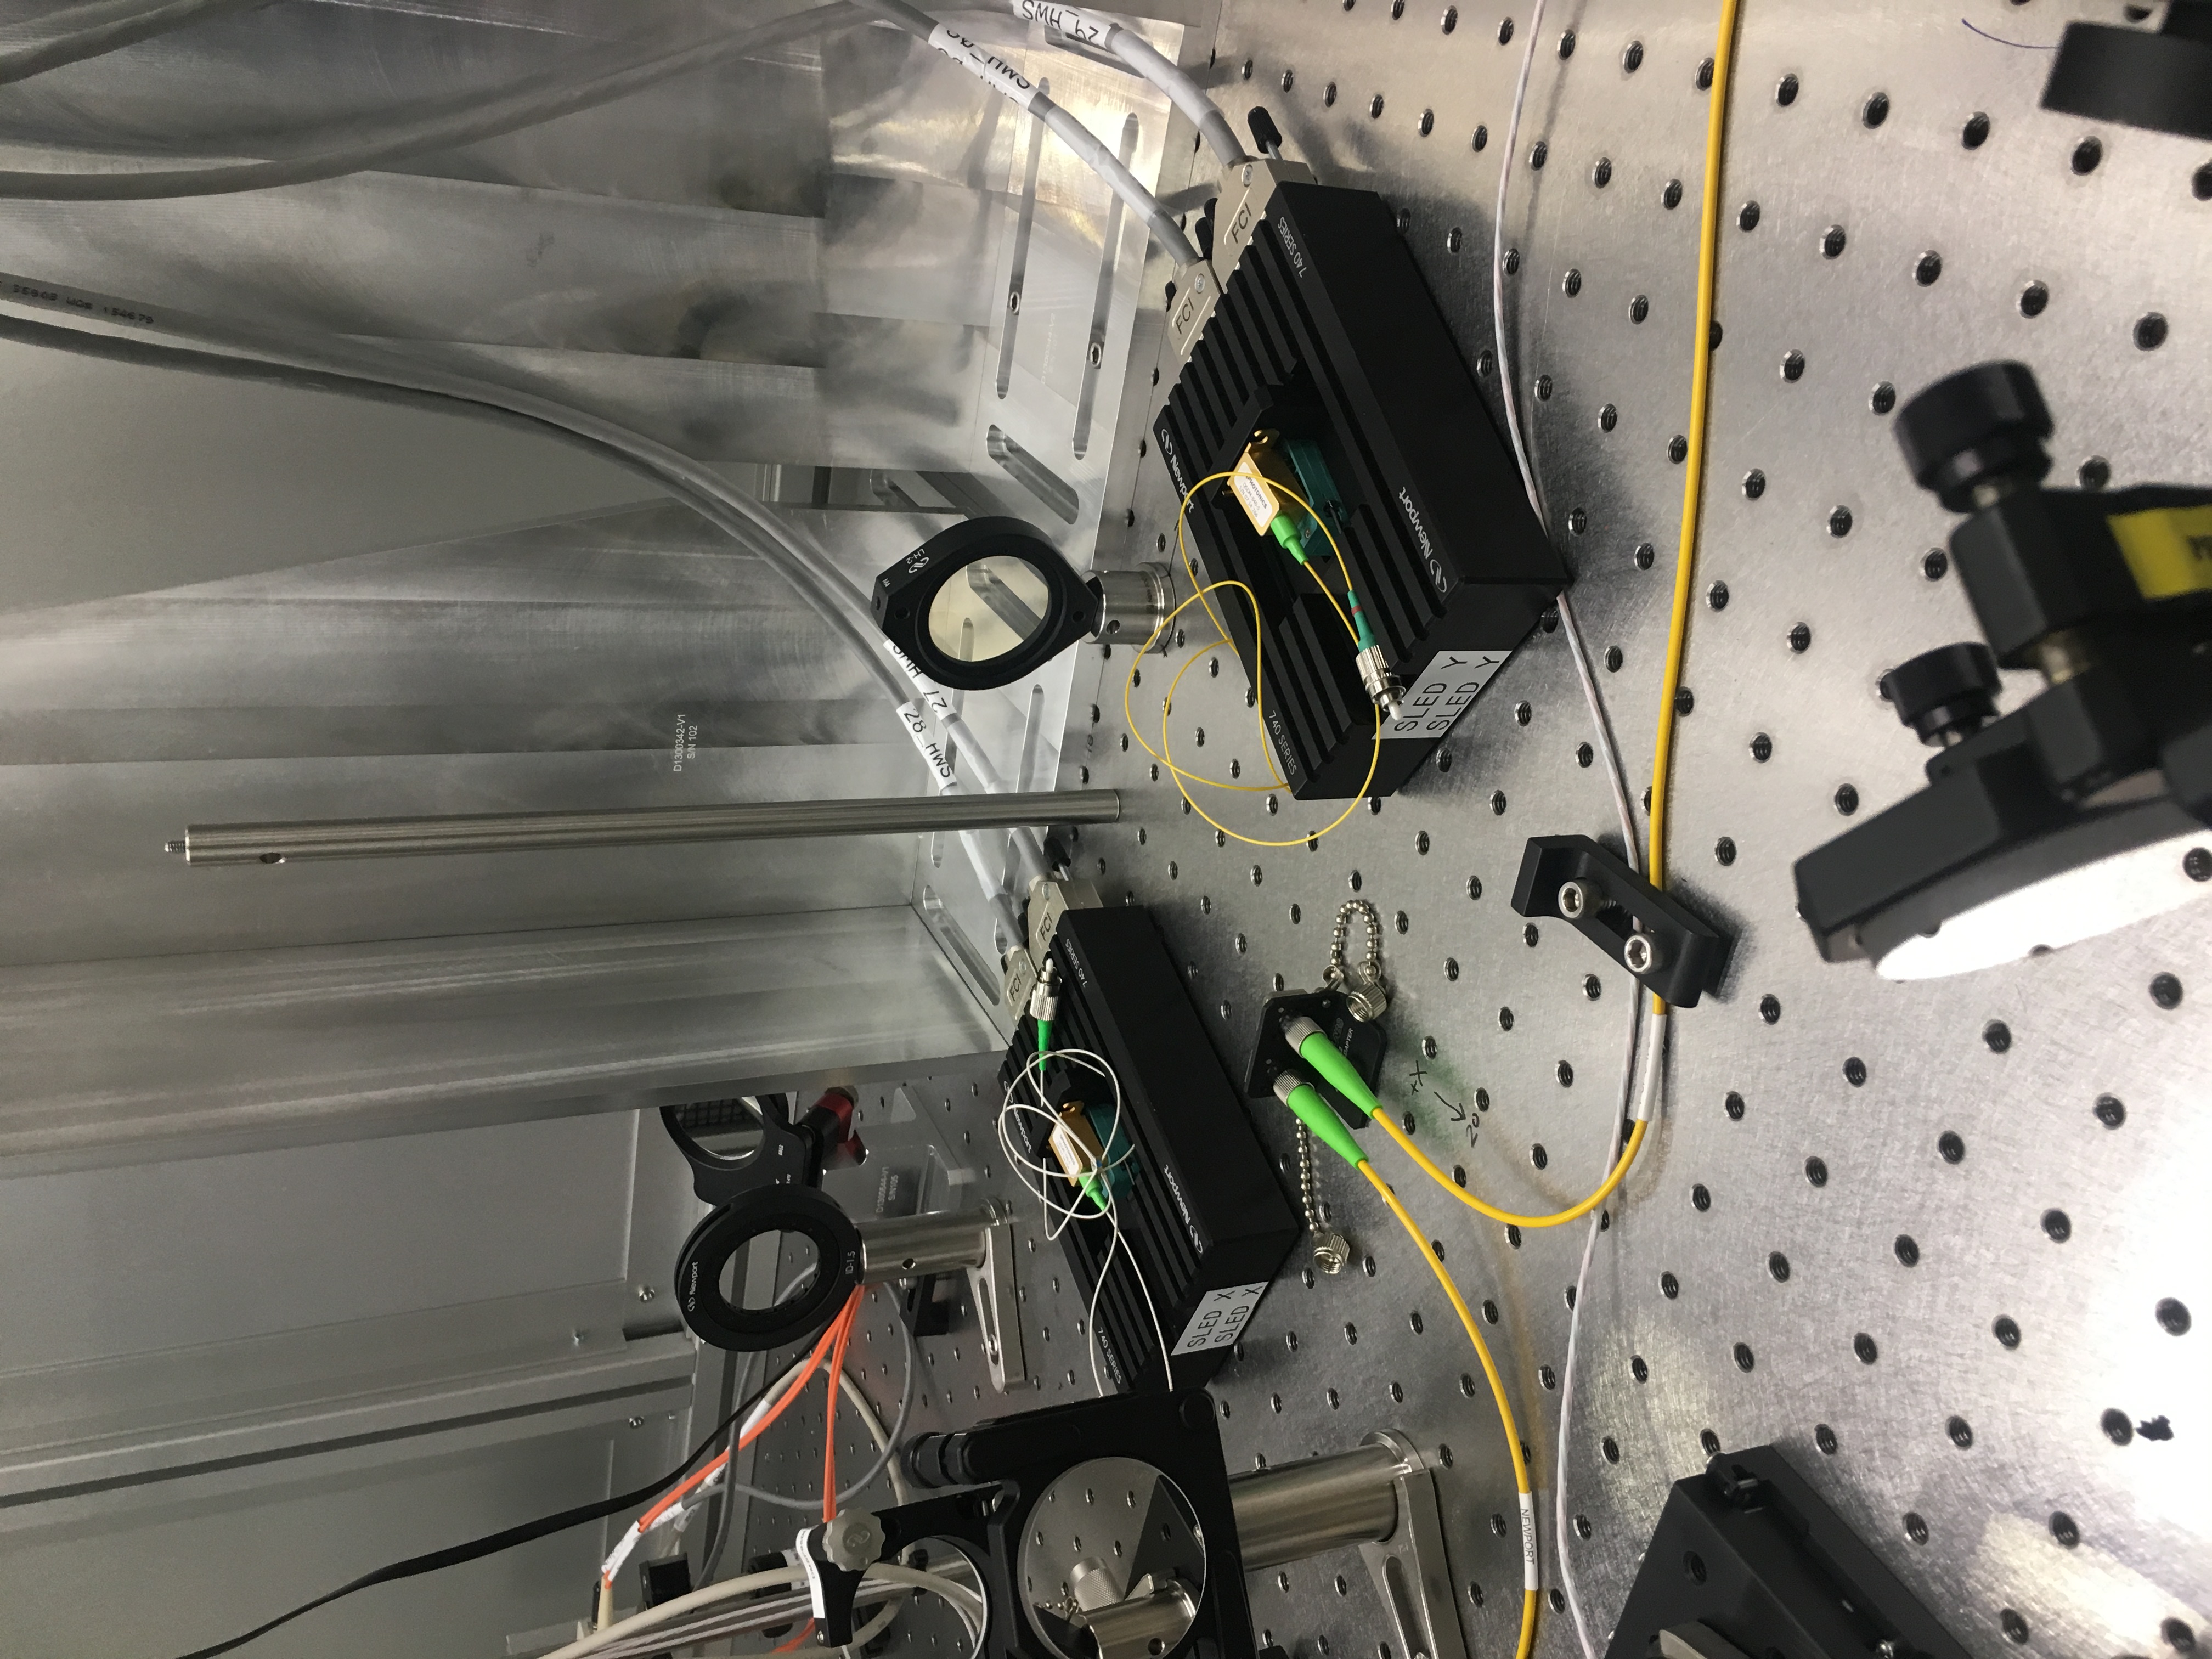
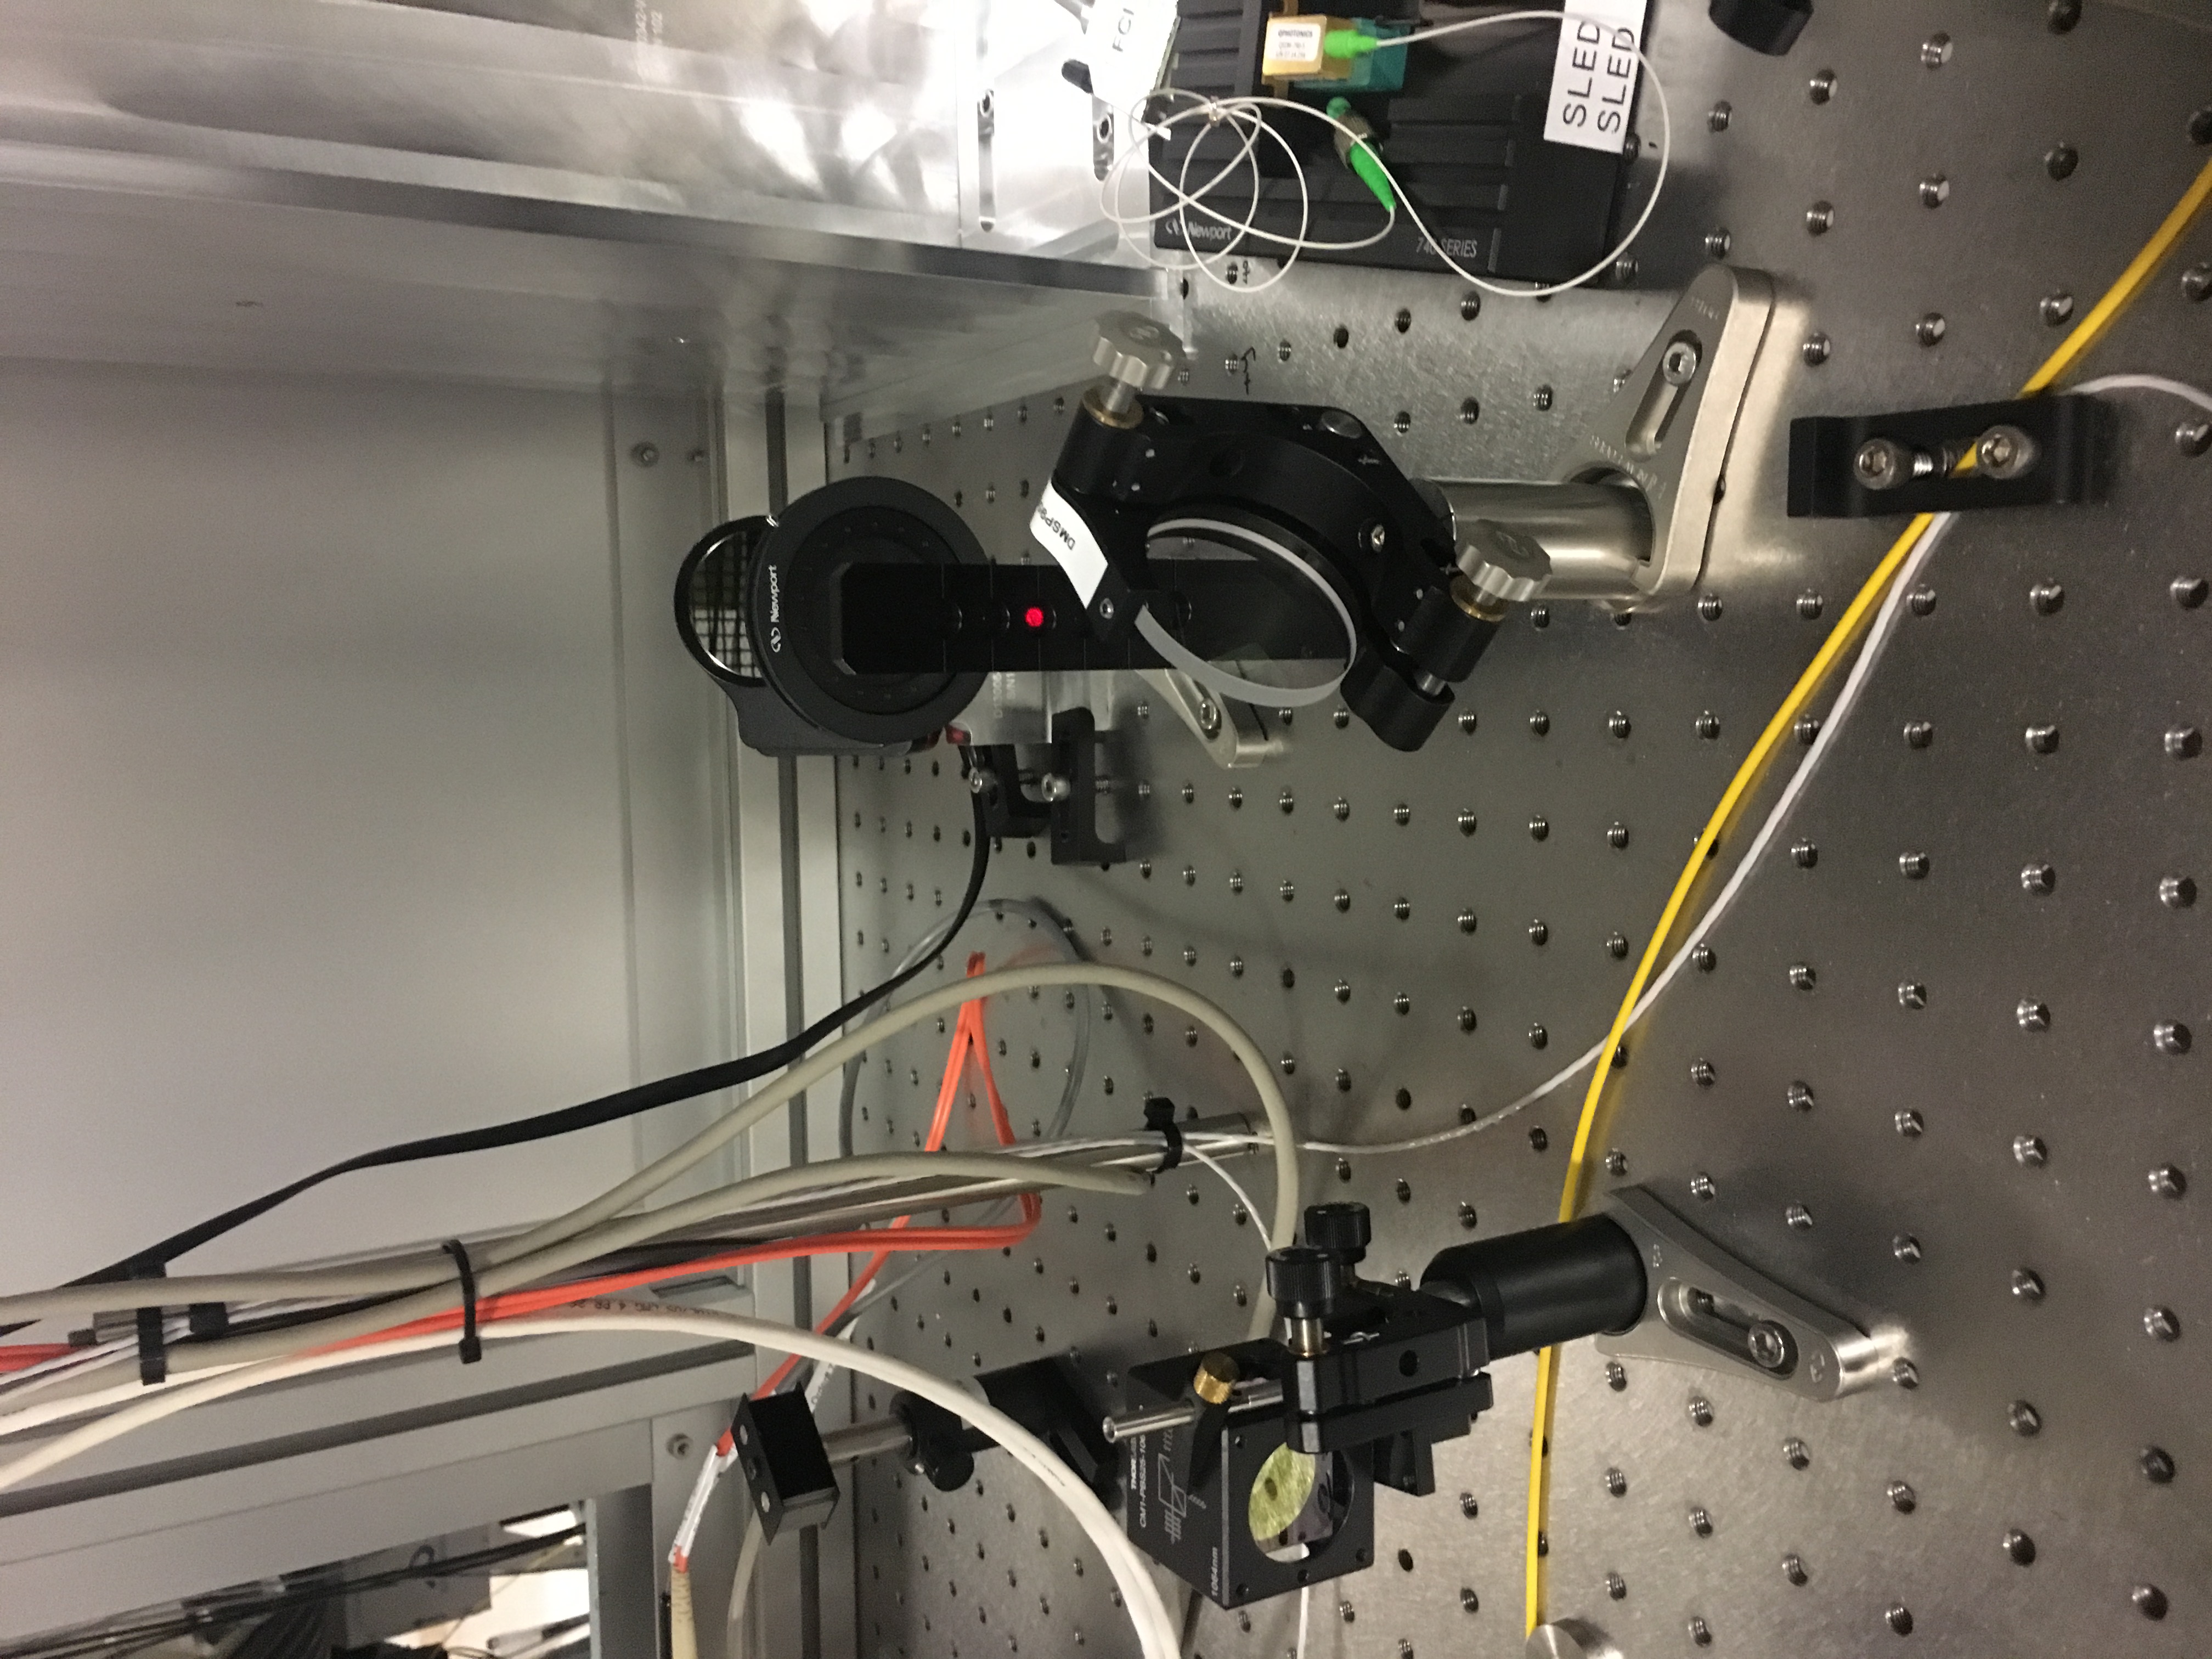
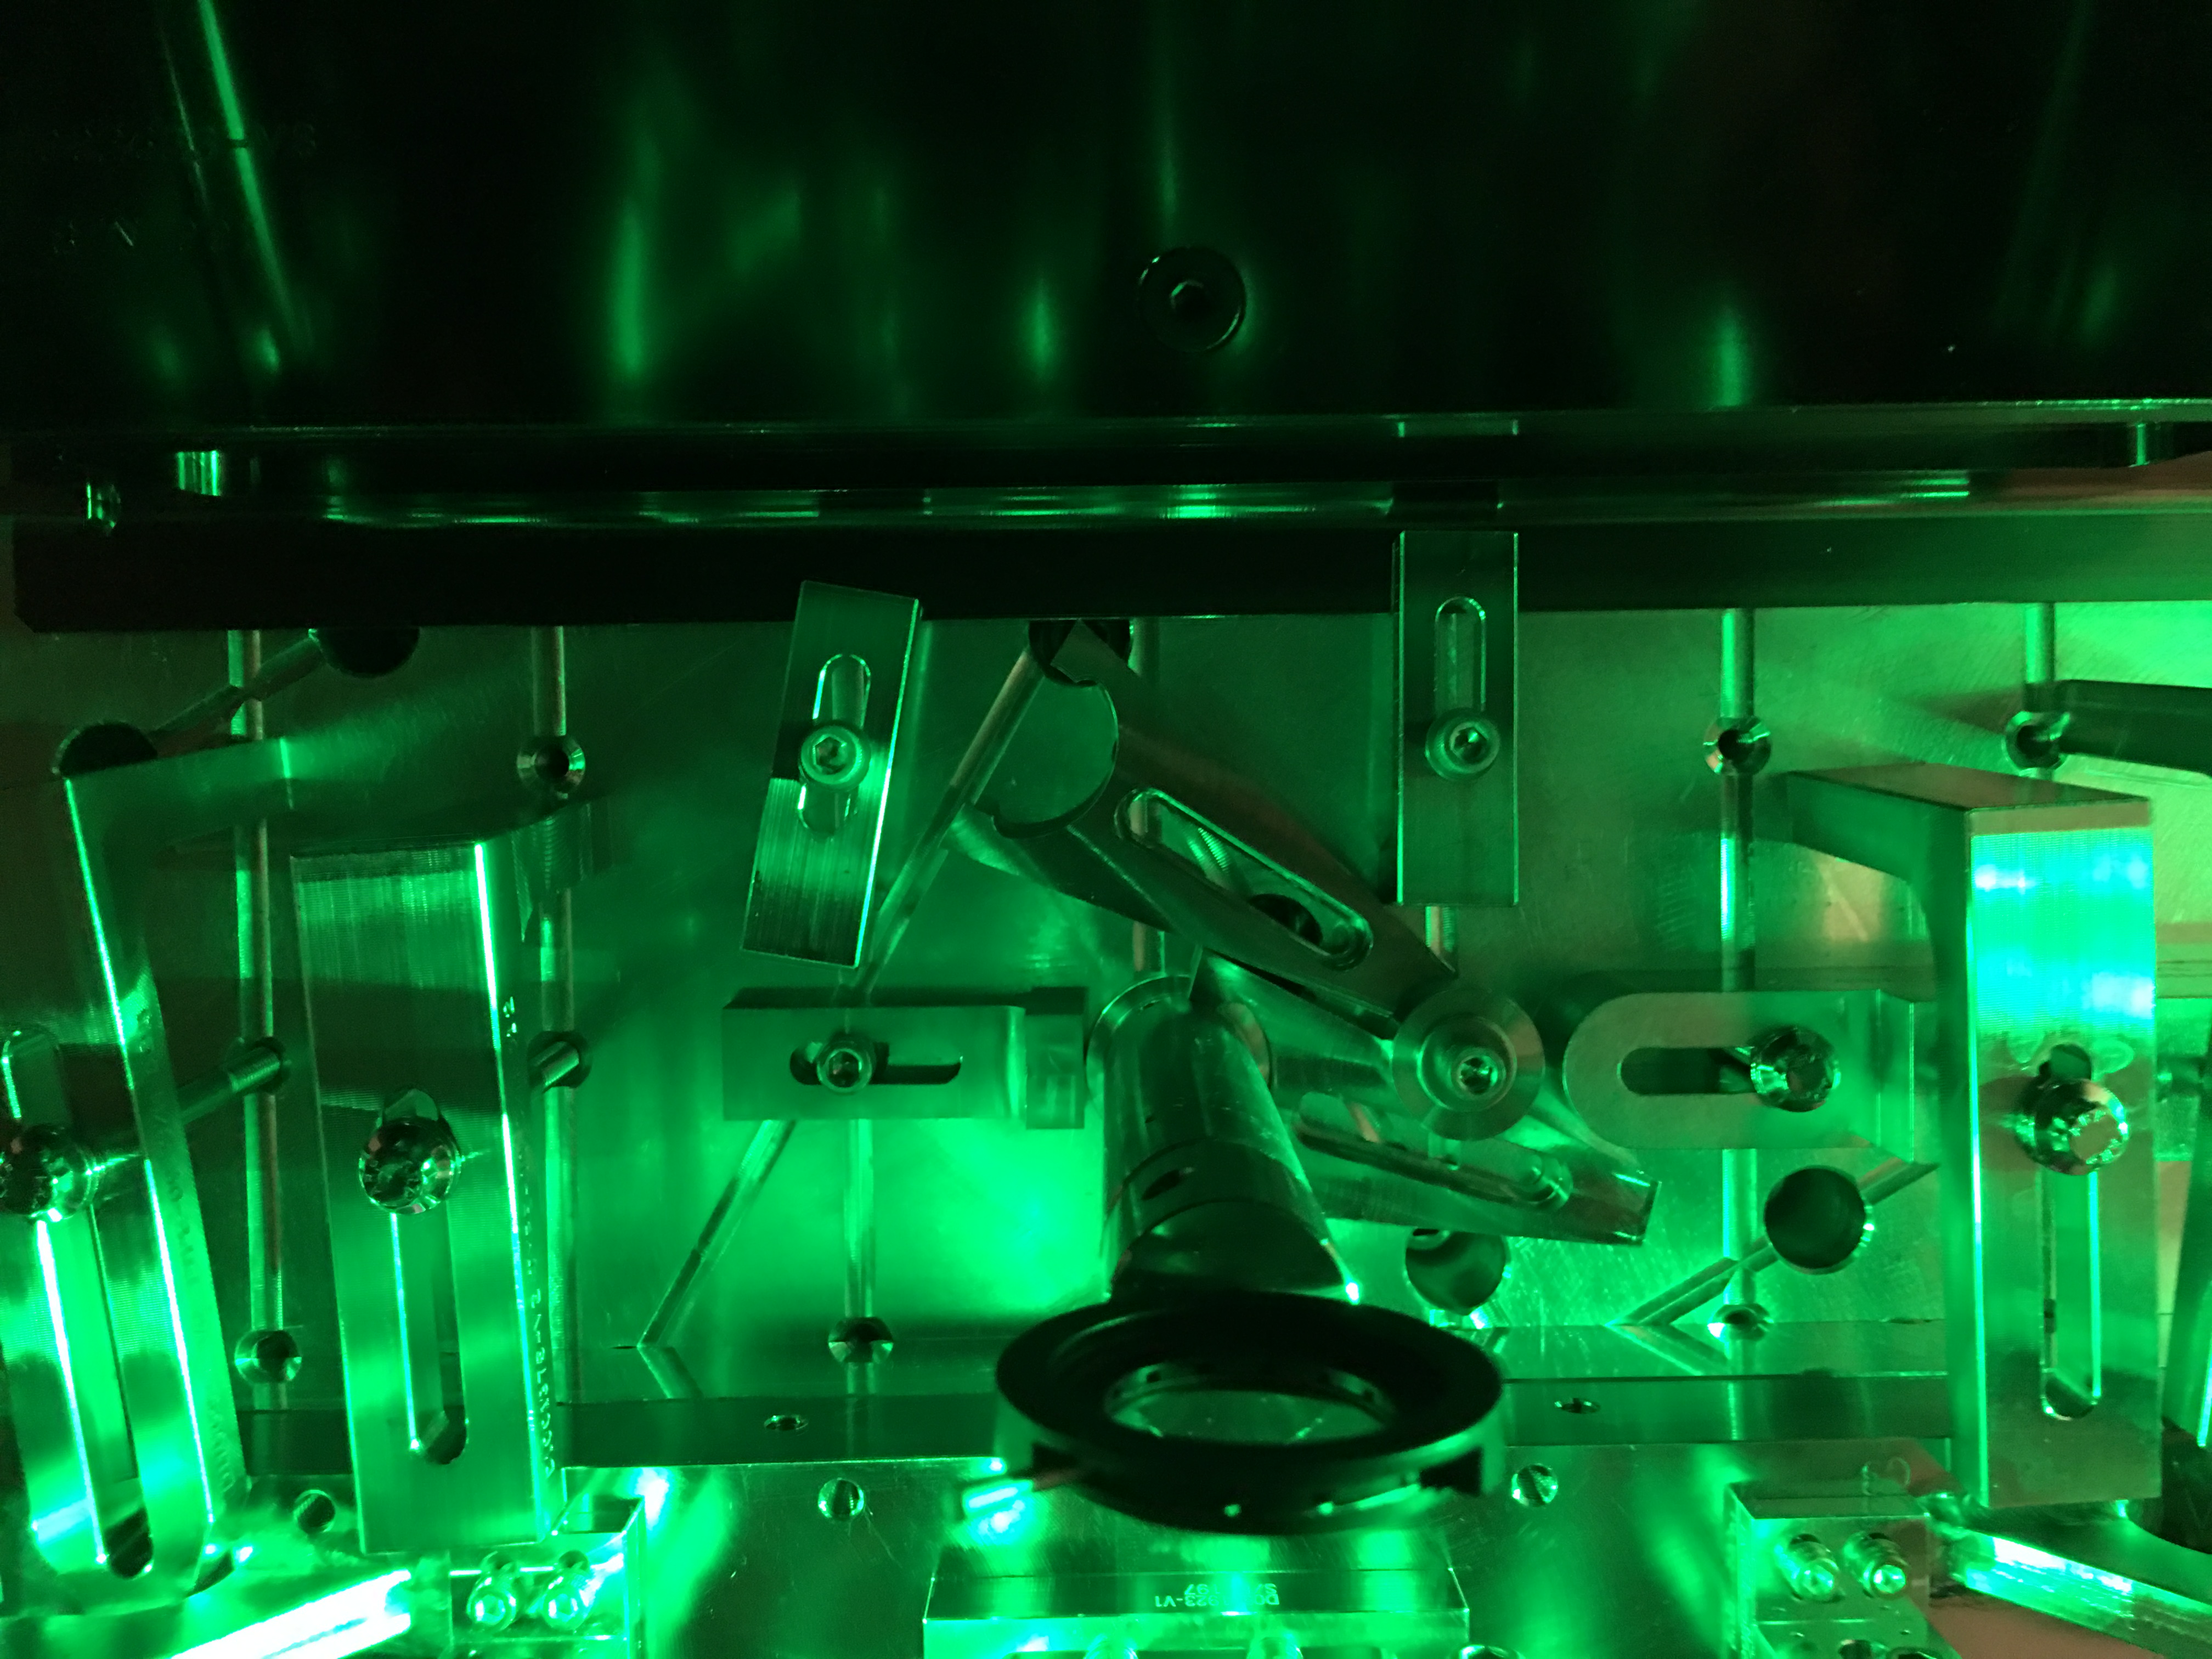
Greg and I swapped M6, M7, M8, M9 , M10 and Source M2 silver mirrors for dielectric fused silica mirrors via ECR 1700295 for both ITMX and ITMY HWS. We aligned the mirrors to the current in-air beam path but since we've done some work in chamber and moved the tables around, we'll have to realign the in chamber beam path to the table before it's all said and done.
We still have to replace one more in-air beamsplitter with a mount that allows for larger aperture, but I'm still trying to locate it.