I made a few measurements tonight, and we did a little bit more work to be able to go to observe.
Measurements:
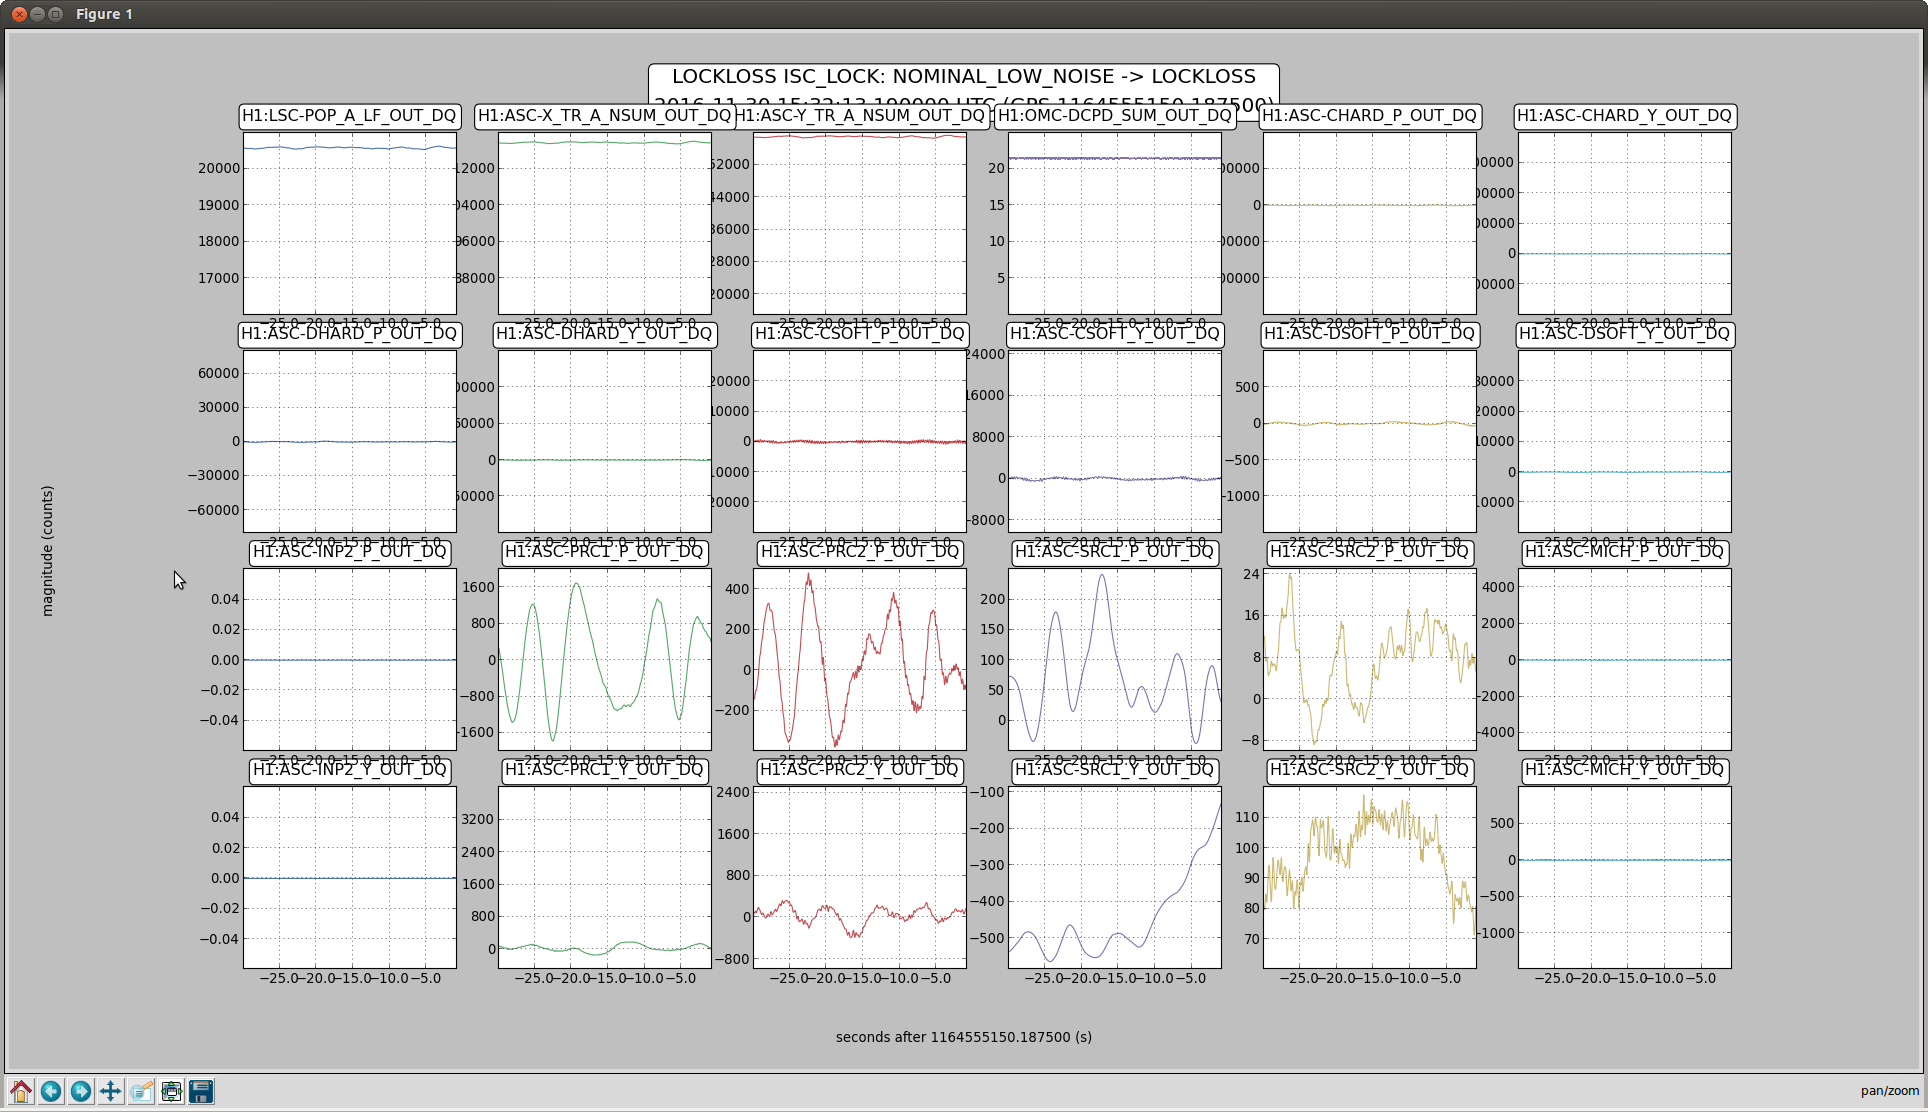
First, I tried to look at why our yaw ASC loops move at 1.88 Hz, I tried to modify the MICH Y loop a few times which broke the lock but Jim relocked right away.
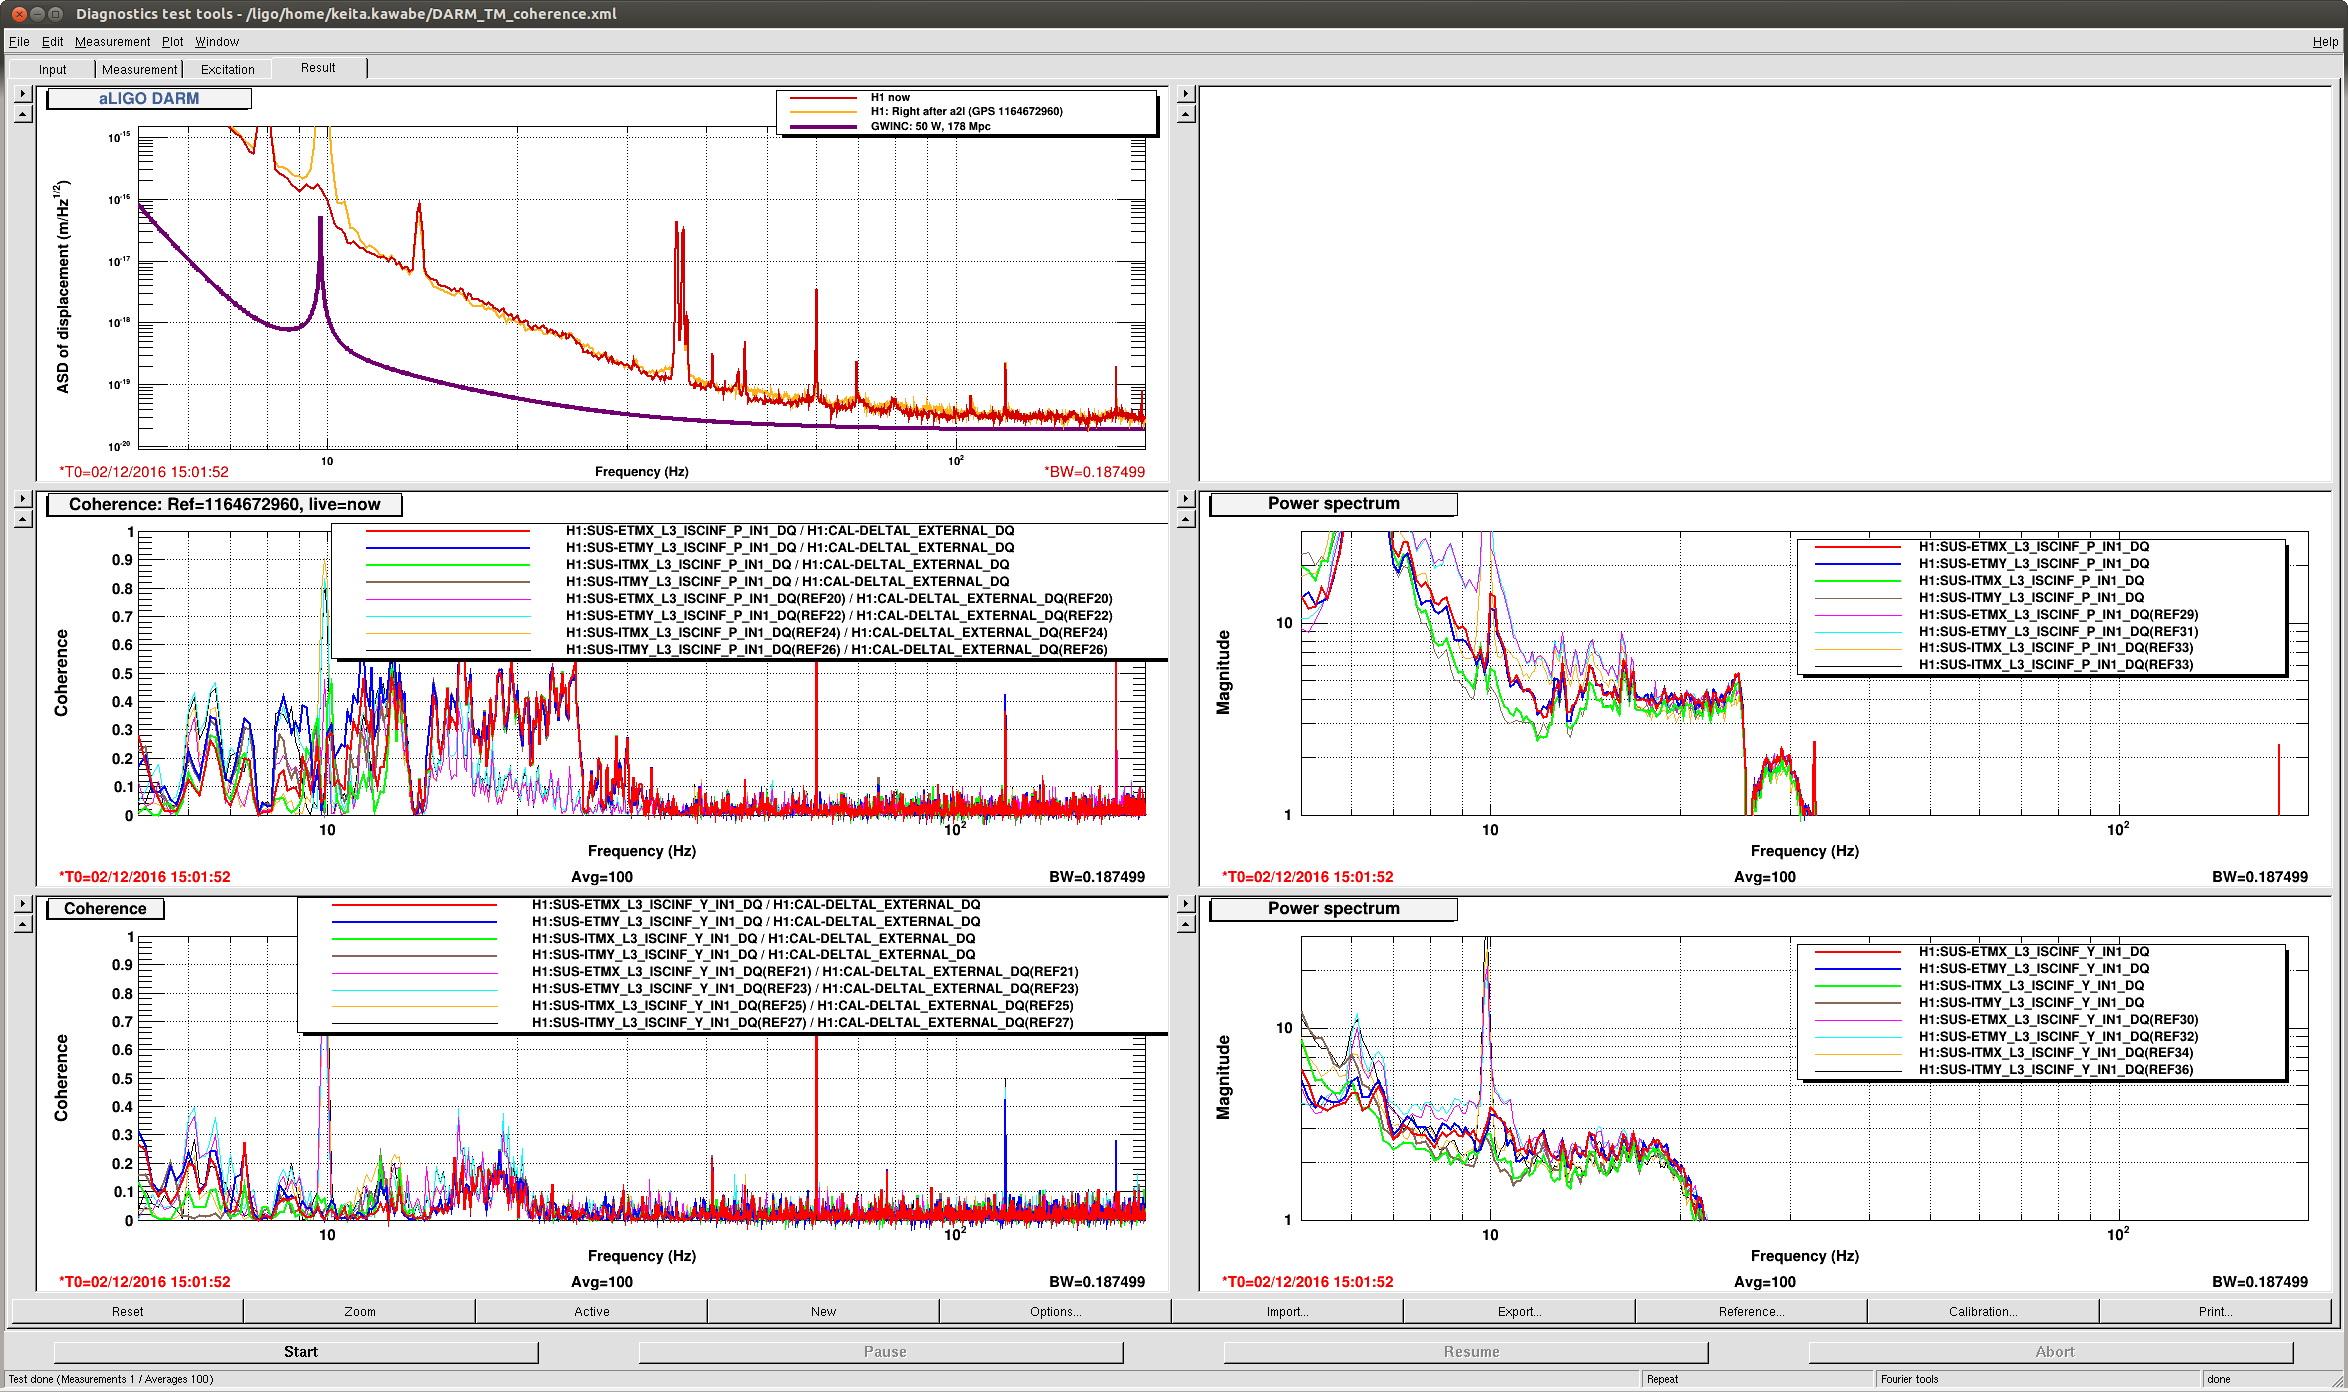
Then I did a repeat of noise injections for jitter with the new PZT mount, and did repeats of MICH/PRCL/SRCL/ASC injections. Since MICH Y was about 10 times larger in DARM than pit, (it was at about the level of CHARD in DARM) I adjusted MICH Y2L by hand using a 21 Hz line. By chaning the gain from 2.54 to 1, the coupling of the line to DARM was reduced by a bit more than a factor of 10, and the MICH yaw noise is now a factor of 10 delow darm at 20Hz.
Lastly, I quickly checked if I could change the noise by adjusting the bias on ETMX. A few weeks ago I had changed the bias to -400V, which reduced the 60Hz line by a factor of 2, but the line has gotten larger over the last few weeks. However, it is still true that the best bias is -400V. We still see no difference in the broad level of noise when changing this bias.
Going to observe:
I've added round(,3) to the SOFT input matrix elements that needed it, and to MCL_GAIN in ANALOG_CARM
DIAG main complained about IM2 y being out the nominal range, this is because of the move we made after the IMC PZT work (31951). I changed the nominal value from -209 to -325 for DAMP Y IN1
A few minutes after Cheryl went to observe, we were kicked out of observe again because of fiber polarization, both an SDF difference becuase of the PLL autolocker and because of a warning in DIAG main. This is something that shouldn't kick us out of observation mode because it doesn't matter at all. We should change DAIG_MAIN to only make this test when we are acquiring lock, and perhaps not monitor some channels in SDF observes. We decided the easiest solution for tonight was to fix the fiber polarization, so Cheryl did that.
Lastly, Cheryl suggested that we orgainze the gaurdian state for ISC_LOCK so that states which are not normally used are above NOMINAL_LOW NOISE, I've renumbered the states but not yet loaded the guardian because I think that would knock us out of observation mode and we want to let the hardware injections happen.
REDUCE_RF9 modulation depth guardian problem:
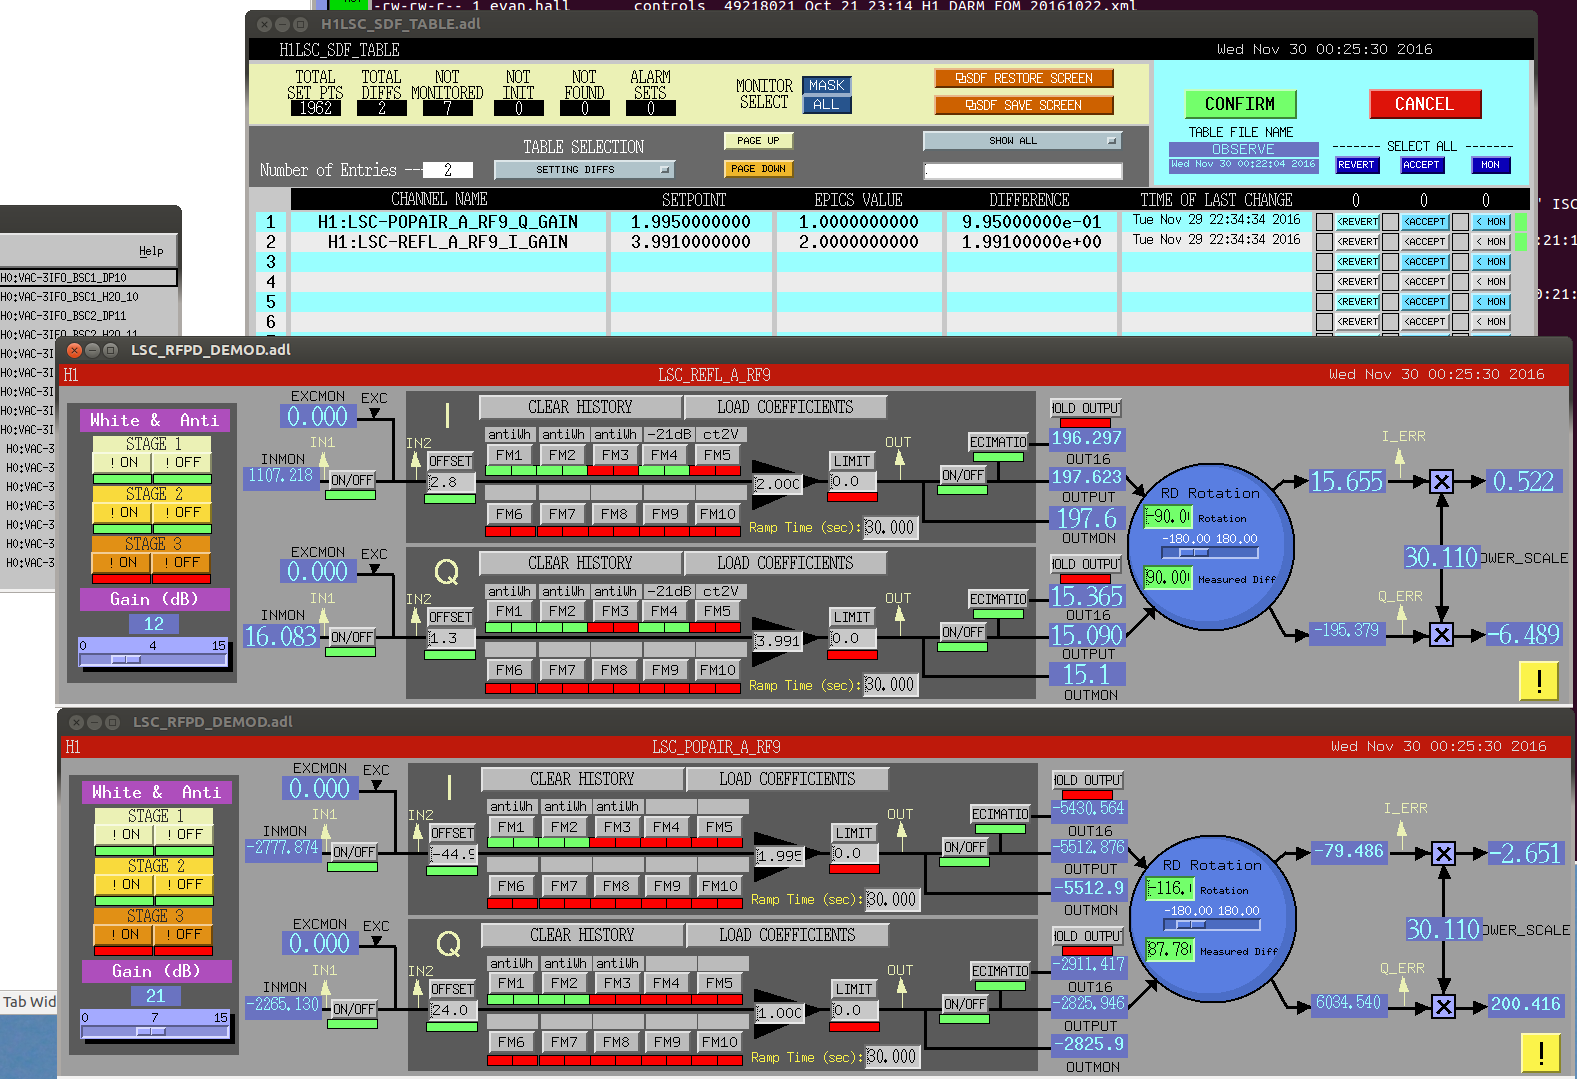
It seems like the reduce RF9 modulation depth state somehow skips restting some gains (screenshot shows the problem). (noted before in alog 31558). This could be serious, and could be why we have occasionally lost lock in this state. I've attached a the log, this is disconcerting because the guardian log reports that it set the gains, but it seems not to have happened. For the two PDs which did not get set, it also looks like the round step is skipped.
2016-11-30_06:34:34.450020Z ISC_LOCK [REDUCE_RF9_MODULATION_DEPTH.main] ezca: H1:LSC-REFL_A_RF9_I_GAIN => 3.99052462994
2016-11-30_06:34:34.461120Z ISC_LOCK [REDUCE_RF9_MODULATION_DEPTH.main] ezca: H1:LSC-REFL_A_RF9_Q_GAIN => 3.99052462994
2016-11-30_06:34:34.461760Z ISC_LOCK [REDUCE_RF9_MODULATION_DEPTH.main] ezca: H1:LSC-REFL_A_RF9_Q_GAIN => 3.991
2016-11-30_06:34:34.462600Z ISC_LOCK [REDUCE_RF9_MODULATION_DEPTH.main] ezca: H1:LSC-POPAIR_A_RF9_I_GAIN => 1.99526231497
2016-11-30_06:34:34.463200Z ISC_LOCK [REDUCE_RF9_MODULATION_DEPTH.main] ezca: H1:LSC-POPAIR_A_RF9_I_GAIN => 1.995
2016-11-30_06:34:34.464820Z ISC_LOCK [REDUCE_RF9_MODULATION_DEPTH.main] ezca: H1:LSC-POPAIR_A_RF9_Q_GAIN => 1.995262314972016-11-30_06:34:34.450020Z ISC_LOCK [REDUCE_RF9_MODULATION_DEPTH.main] ezca: H1:LSC-REFL_A_RF9_I_GAIN => 3.990524629942016-11-30_06:34:34.461120Z ISC_LOCK [REDUCE_RF9_MODULATION_DEPTH.main] ezca: H1:LSC-REFL_A_RF9_Q_GAIN => 3.99052462994
2016-11-30_06:34:34.461760Z ISC_LOCK [REDUCE_RF9_MODULATION_DEPTH.main] ezca: H1:LSC-REFL_A_RF9_Q_GAIN => 3.991
2016-11-30_06:34:34.462600Z ISC_LOCK [REDUCE_RF9_MODULATION_DEPTH.main] ezca: H1:LSC-POPAIR_A_RF9_I_GAIN => 1.99526231497
2016-11-30_06:34:34.463200Z ISC_LOCK [REDUCE_RF9_MODULATION_DEPTH.main] ezca: H1:LSC-POPAIR_A_RF9_I_GAIN => 1.995
2016-11-30_06:34:34.464820Z ISC_LOCK [REDUCE_RF9_MODULATION_DEPTH.main] ezca: H1:LSC-POPAIR_A_RF9_Q_GAIN => 1.99526231497
2016-11-30_06:34:34.466310Z ISC_LOCK [REDUCE_RF9_MODULATION_DEPTH.main] ezca: H1:LSC-REFLAIR_A_RF9_I_GAIN => 0.498815578742
I reported this in bugzilla
1062 and committed the guardian code as revision 14719
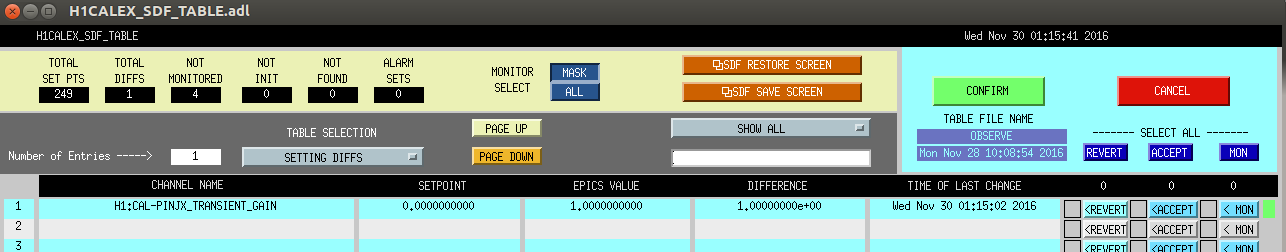
We accepted the wrong values (neither of these PDs is in use in lock) in SDF so that Adam could make a hardware injection, but these are the wrong values and should be different next time we lock. The next time the IFO locks, the operator should accept the correct values


8:40 AM restarted h1hwsmsr computer again. This time with cameras and frame grabbers turned off.
~9:00 AM We restarted h1hwsmsr again.