Jeff B, Cheryl, Travis and Kiwamu,
In the past two days, Jeff, Cheryl and Travis performed a random walk on the CO2 settings for me (30920 and comments therein). I don't see significant change so far. In fact, it might have deteriorated the jitter peaks slightly.
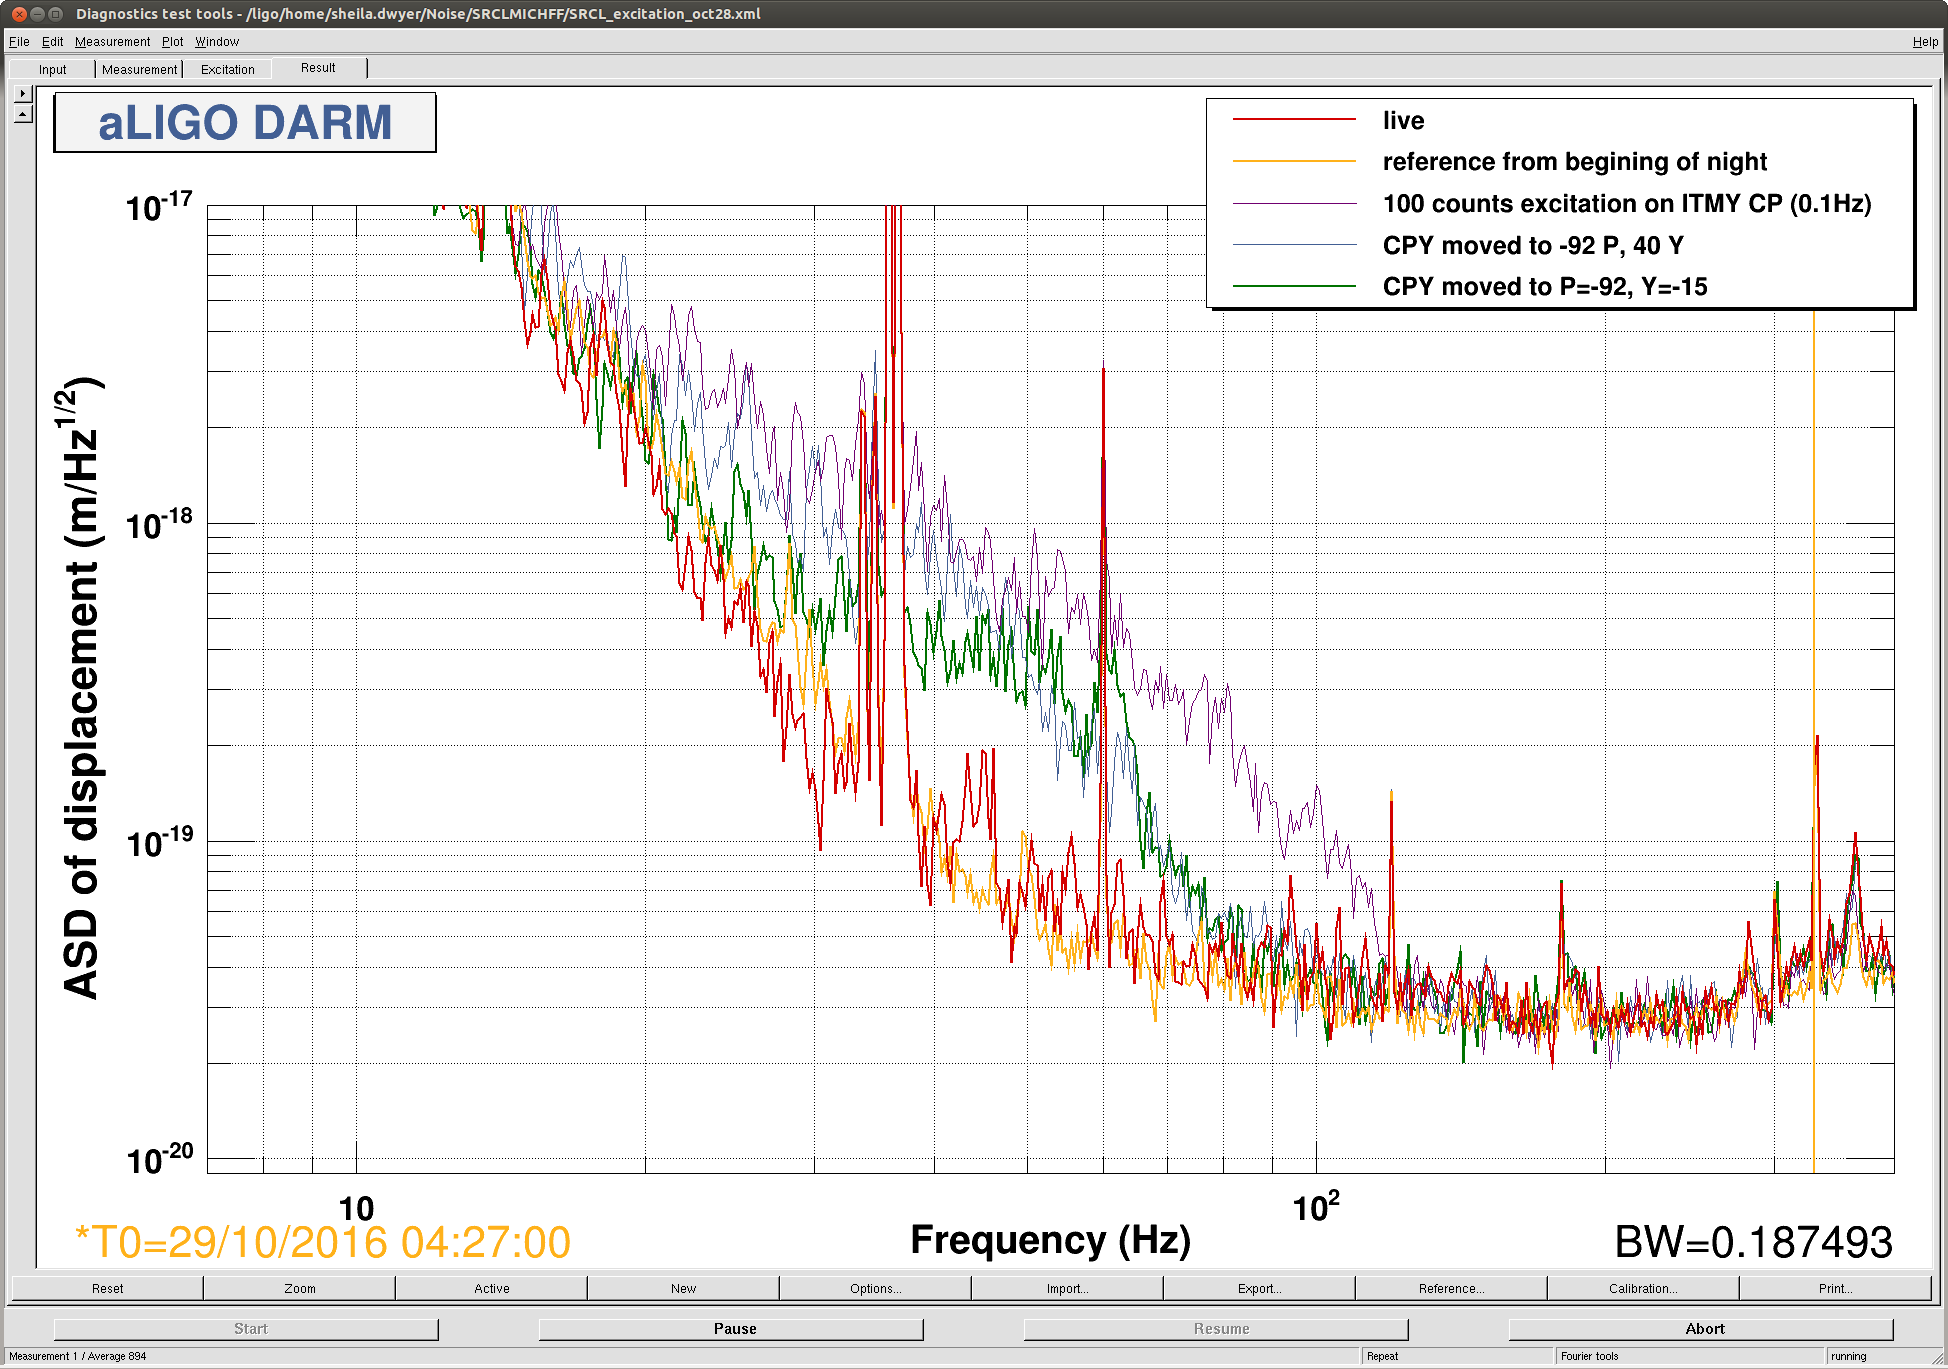
I now ask the operators to perform differential scans instead (e.g. raising only one CO2 at a time).
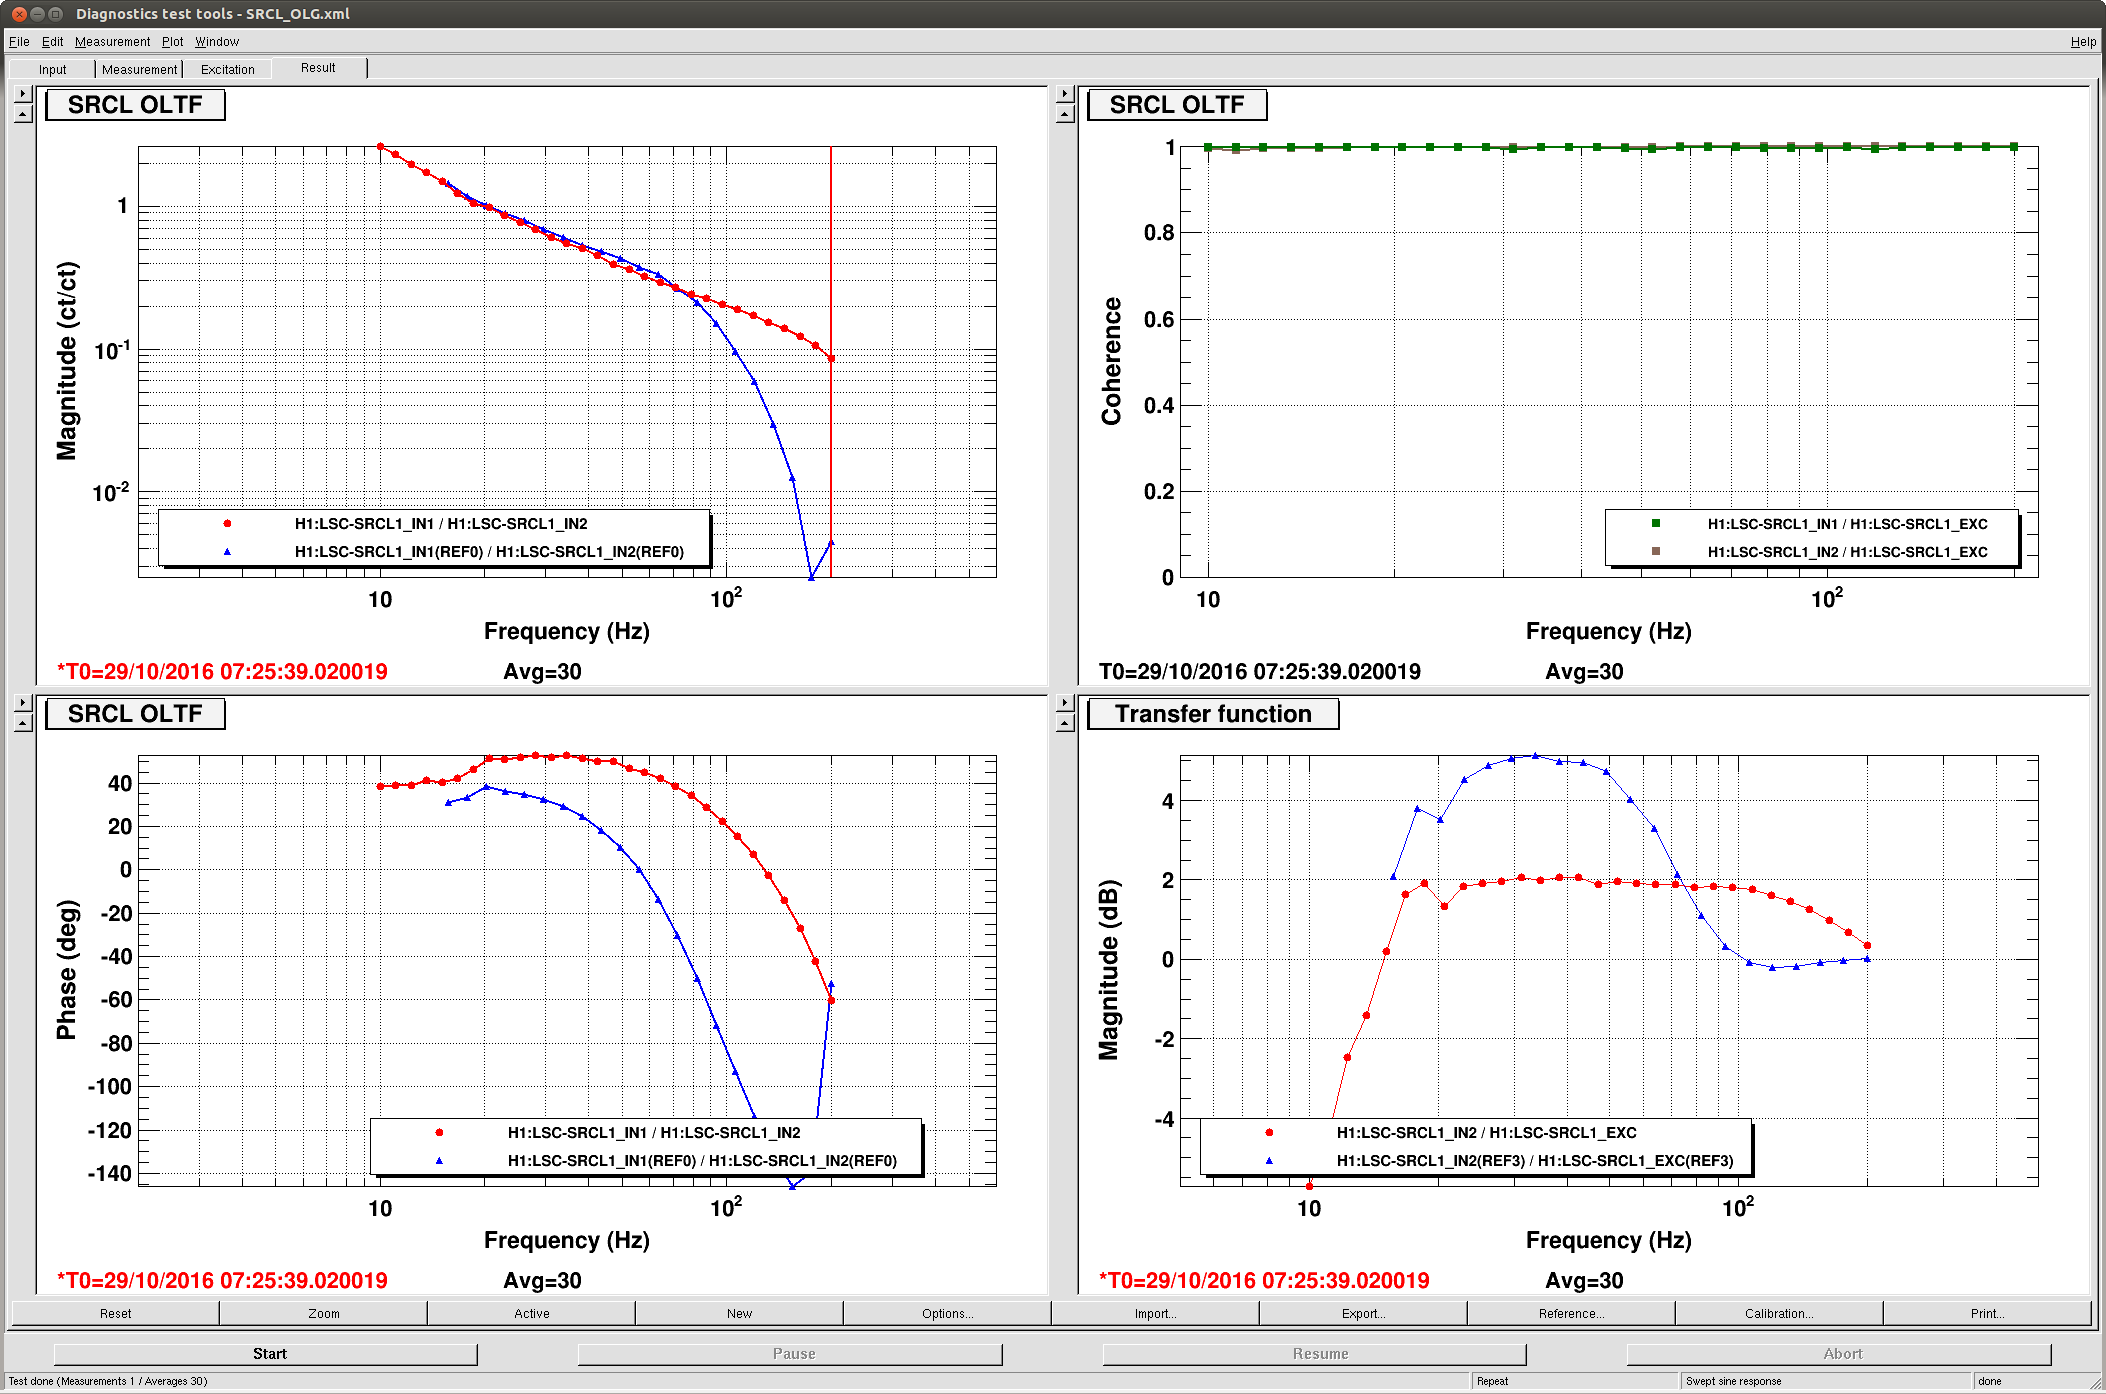
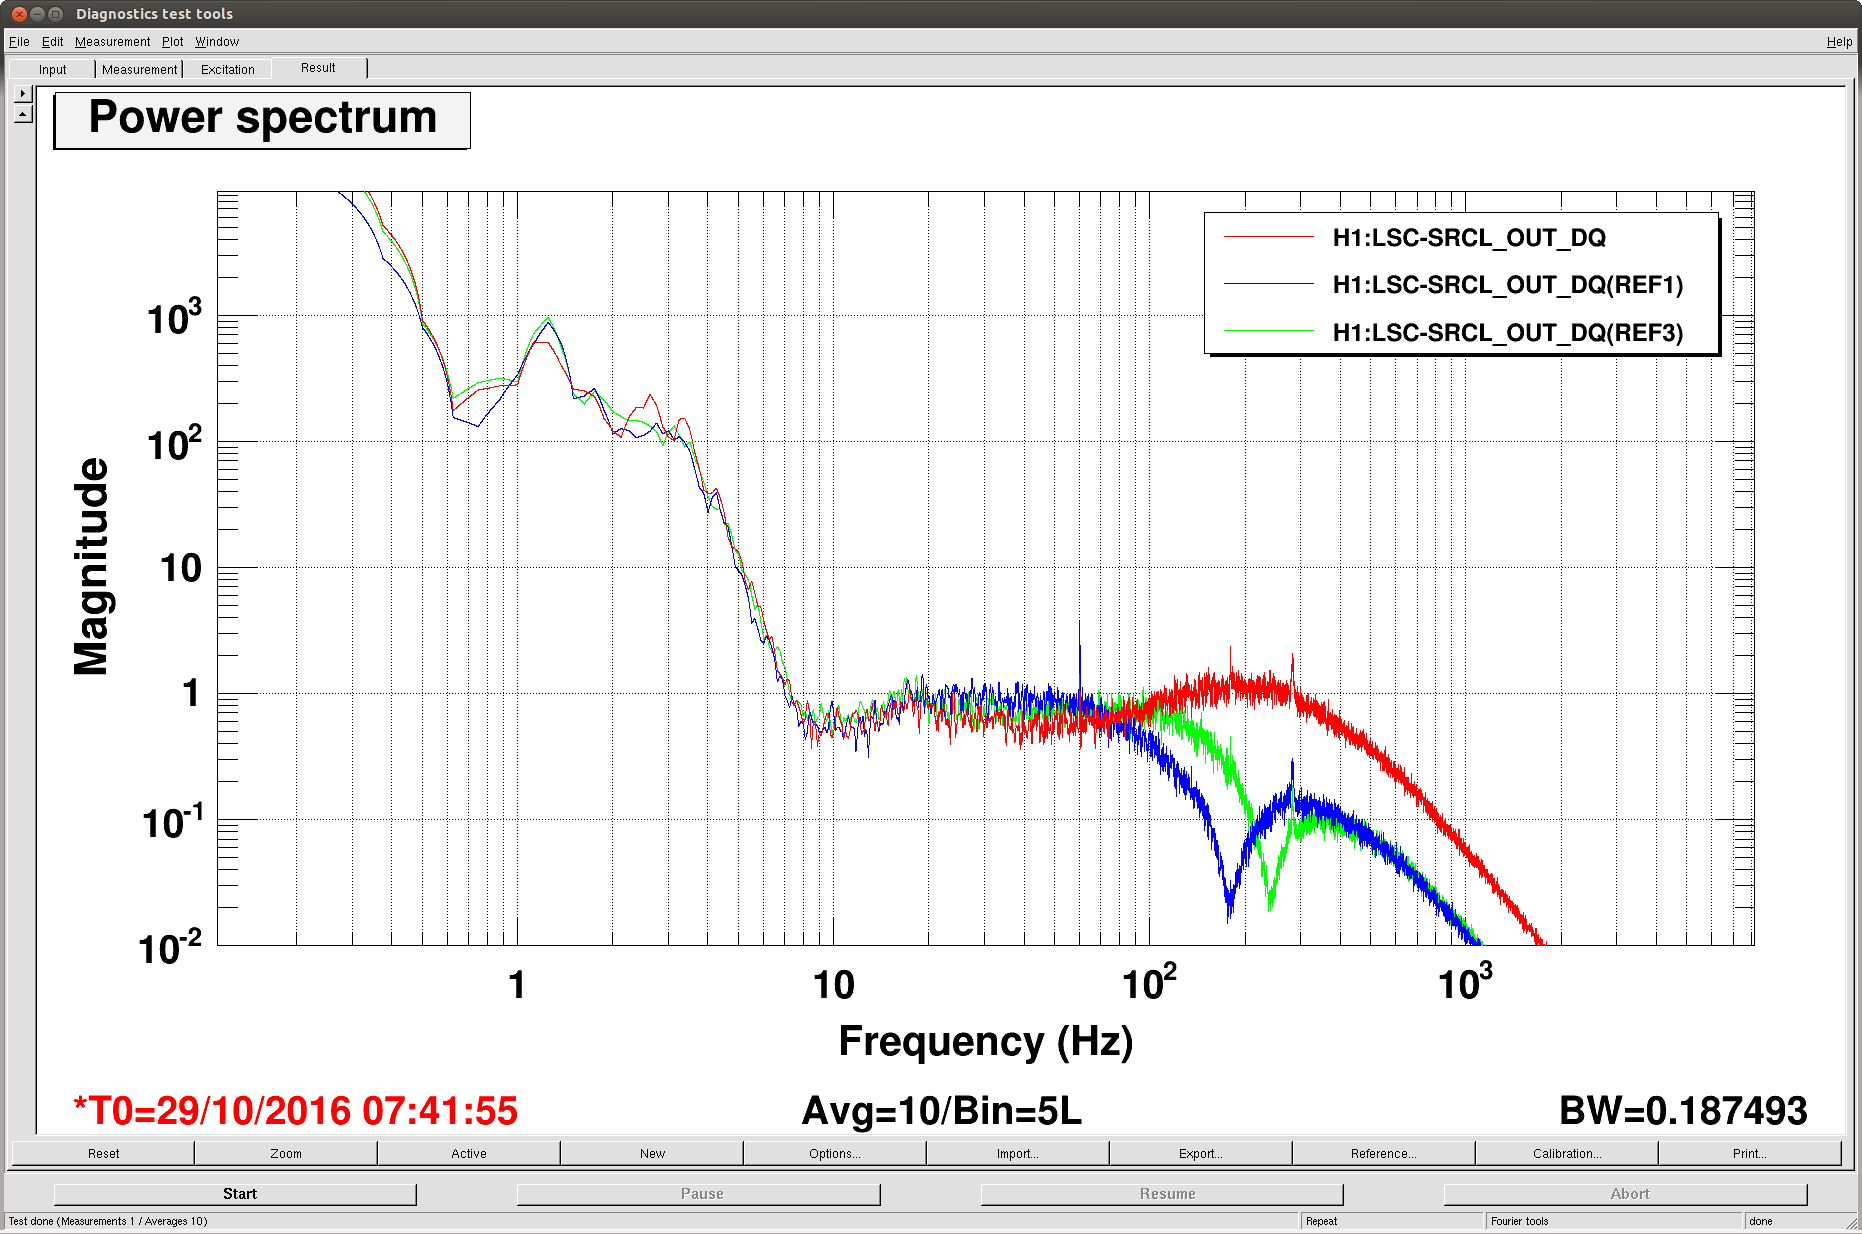
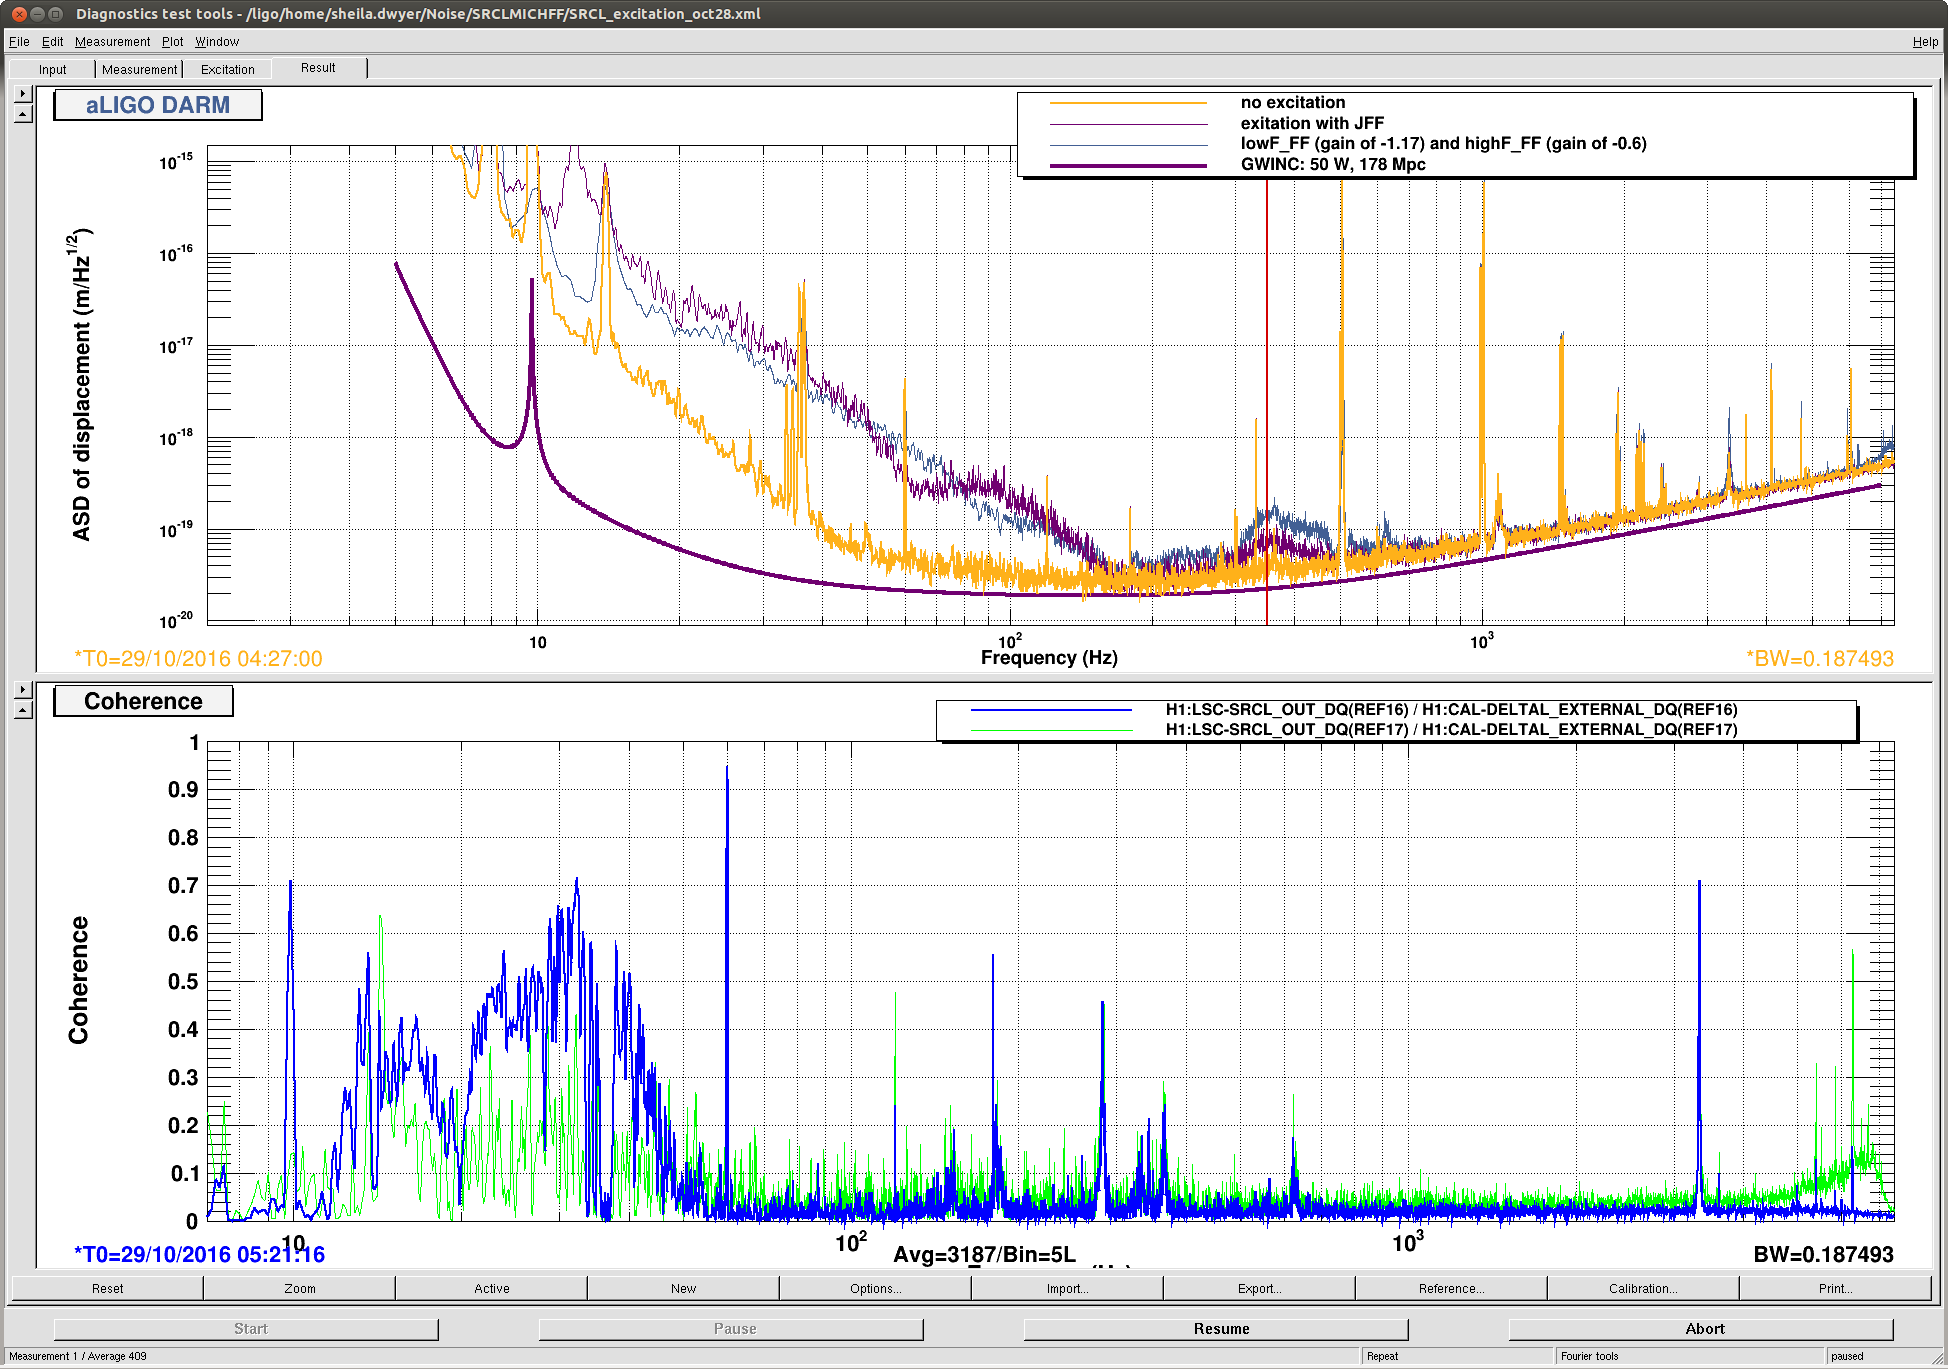
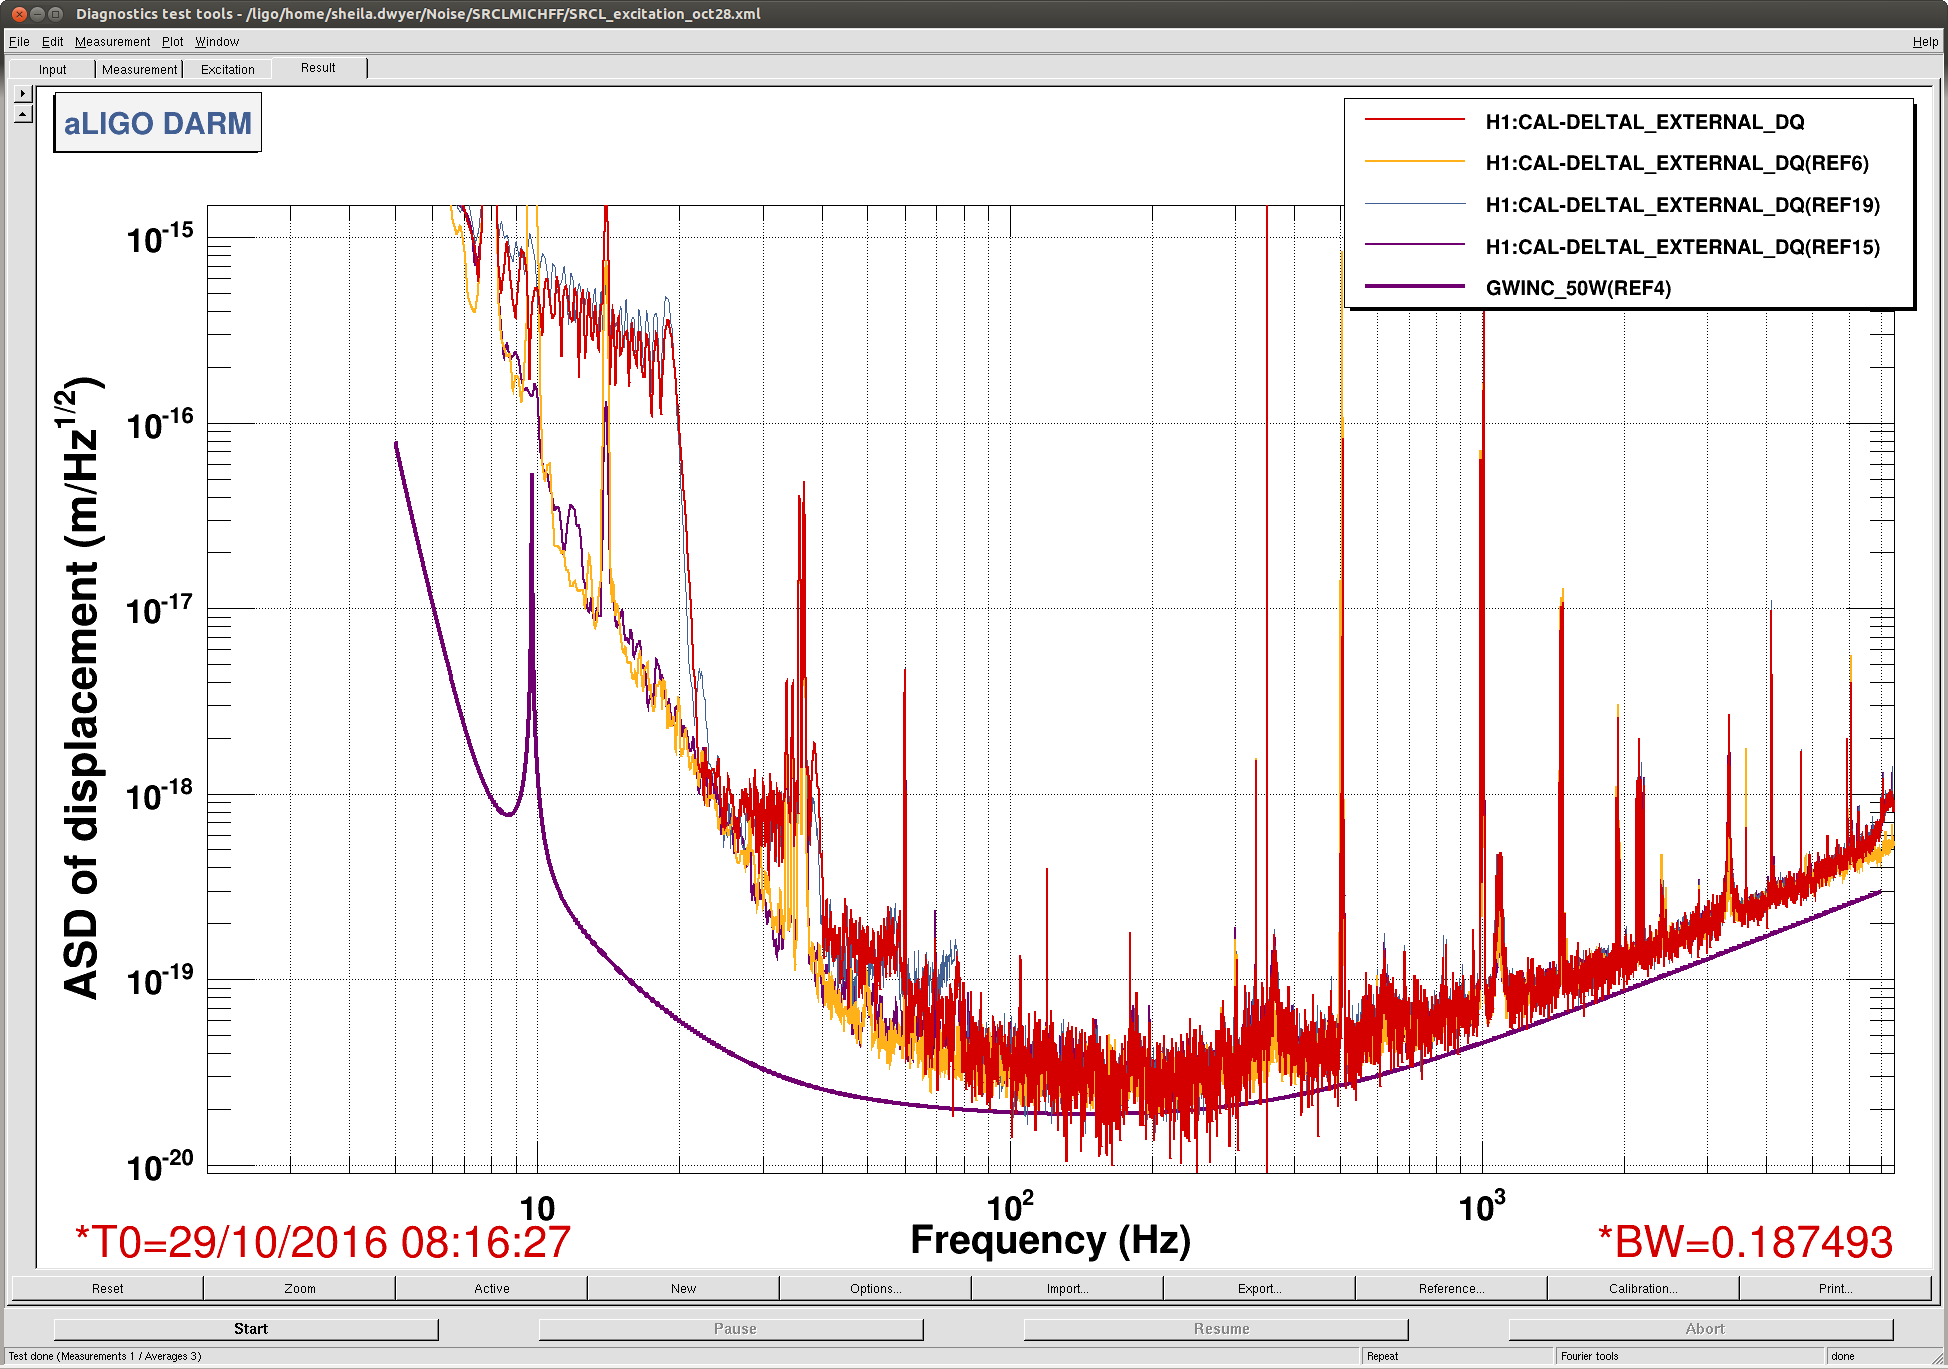
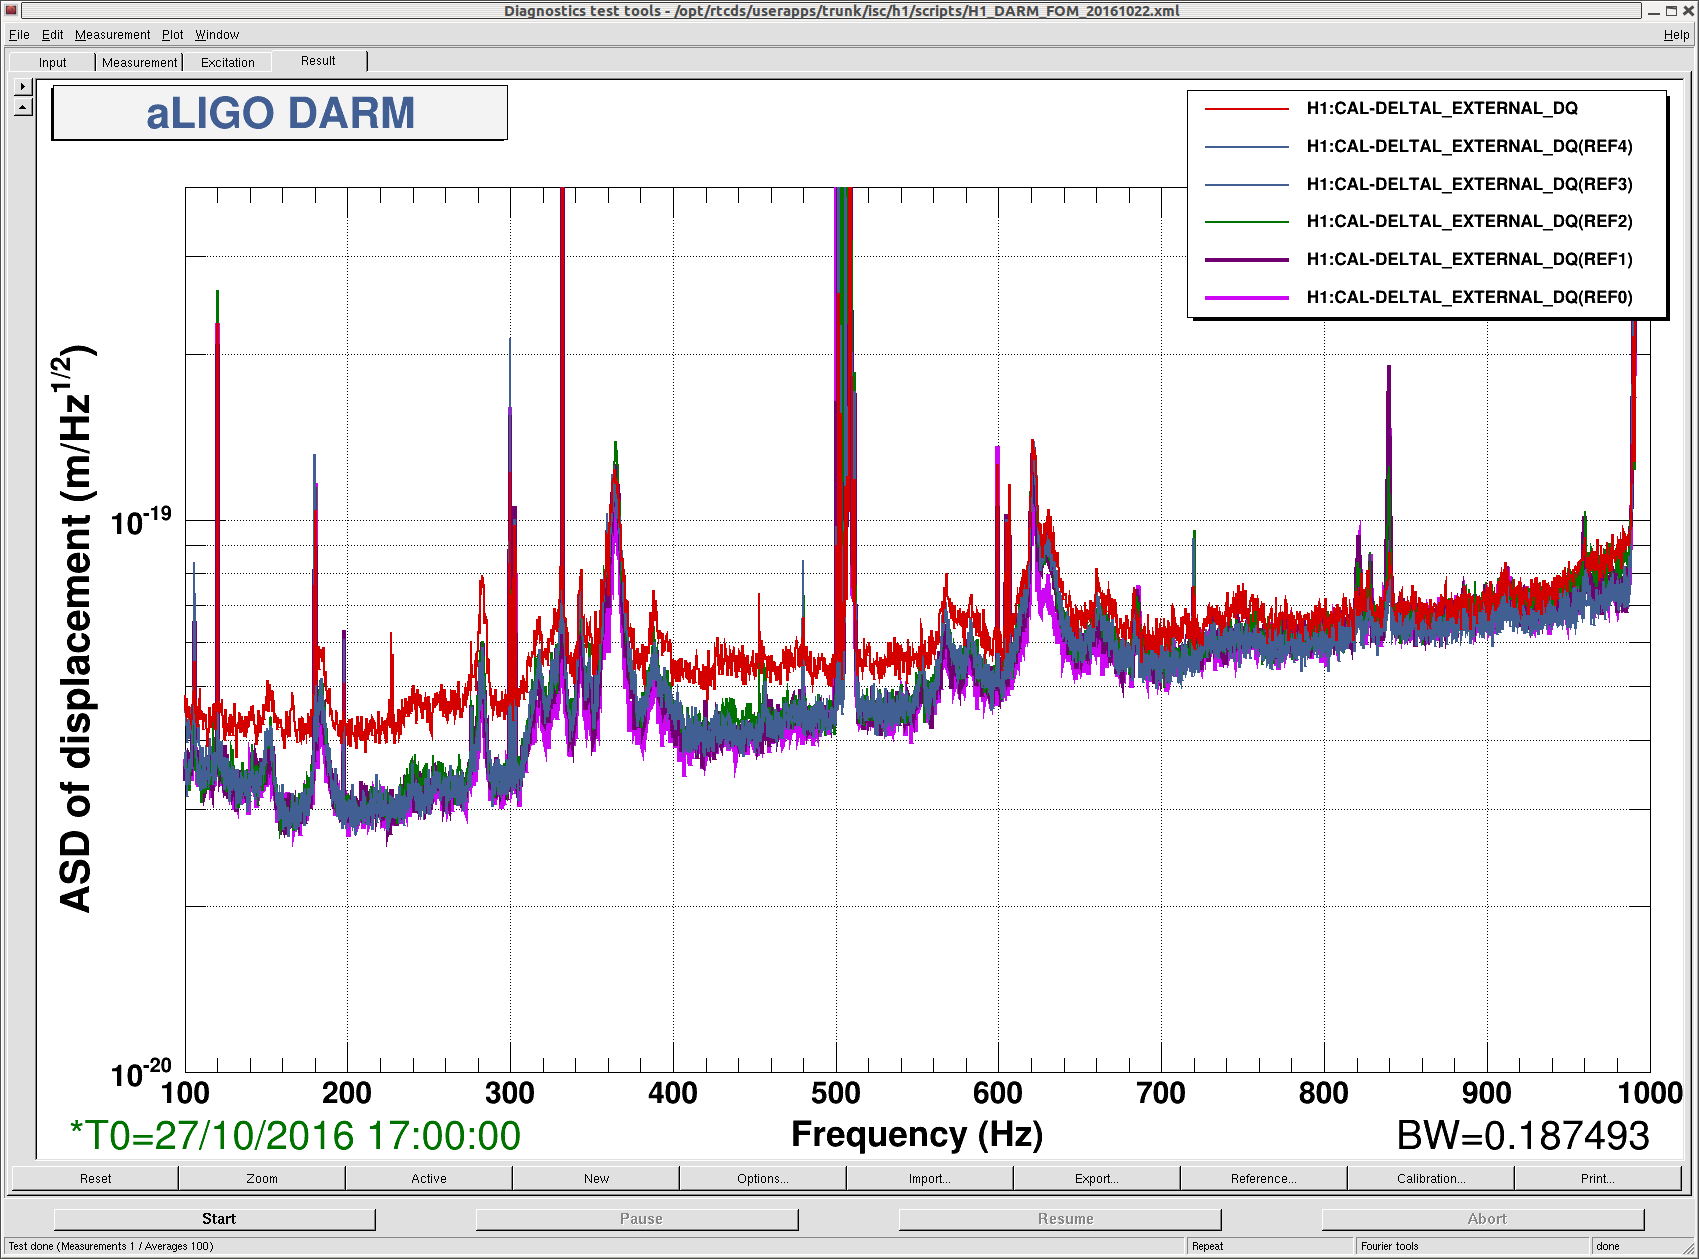
The motivation was to see if we can exert any kind of effects on the jitter peaks in 200-1000Hz by changing the CO2 settings. Because TCS measurements usually take a long time, I have asked the operators to do some random walk on the TCS settings when possible. So far we have done a common scan (i.e. raising both CO2 powers simultaneously) and I don't see big change in the jitter peaks in 200-1000 Hz, in particular the ones at 285, 365 and 620 Hz. The attached shows DARM spectra with different CO2 settings.
These curves correspond to the following time.
-
ref 0: 27/10/2016 9:40:00 UTC
-
ref 1: 27/10/2016 11:30:00 UTC
-
ref 2: 27/10/2016 17:00:00 UTC
-
ref 3: 28/10/2016 11:30:00 UTC
-
ref 4: 28/10/2016 13:00:00 UTC
-
live: 28/10/2016 15:30:00 UTC
As you can see, the ambient noise (most of the time appears to be shot noise) varies depending on the time because some of them overlapped with the active injection tests by Robert. But, this is not something I am looking for. Among the 6 noise curves, the best jitter noise was obtained from 27/10/2016 9:40:00 UTC which is actually before the series of CO2 tests started. So it is possible that the common CO2 may have deteriorated the jitter peaks slightly. We should do a differential scan next.
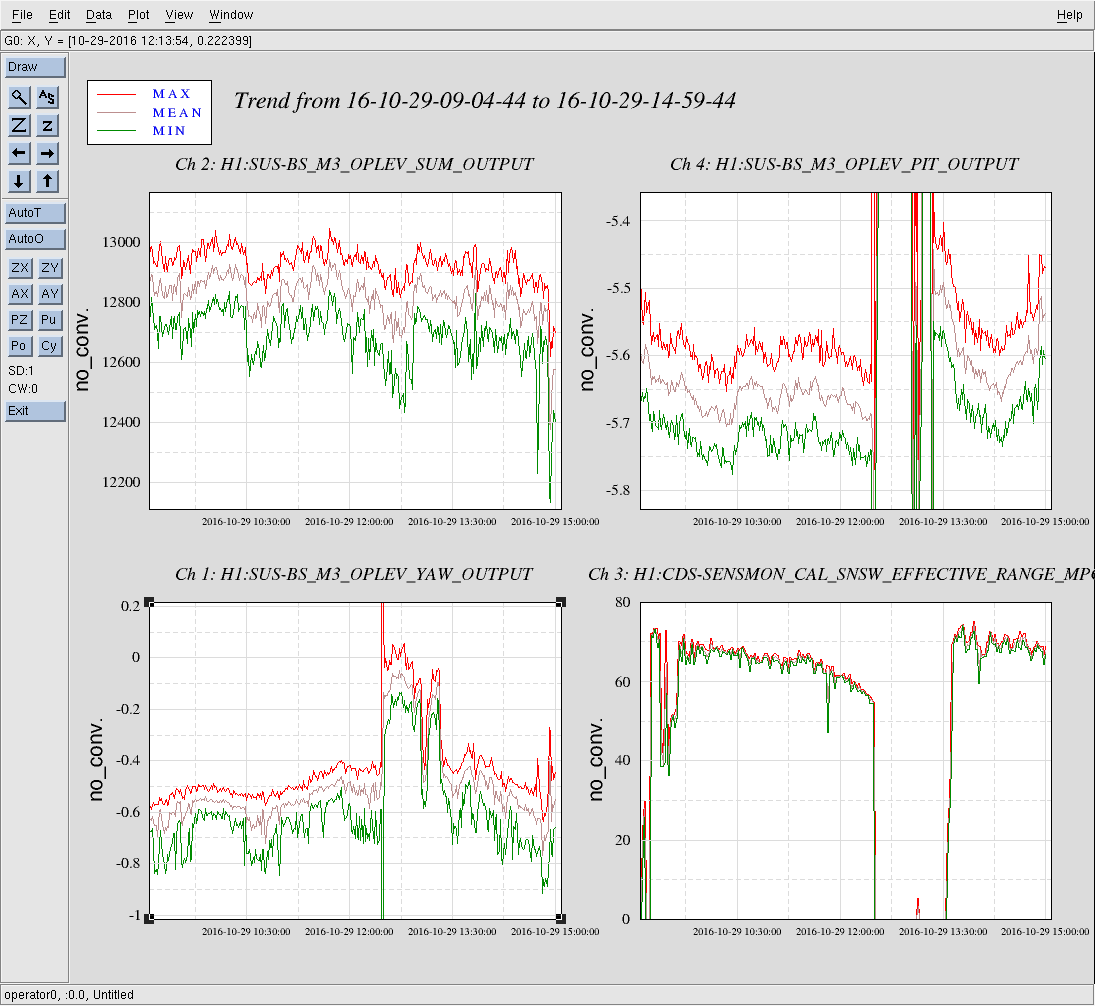
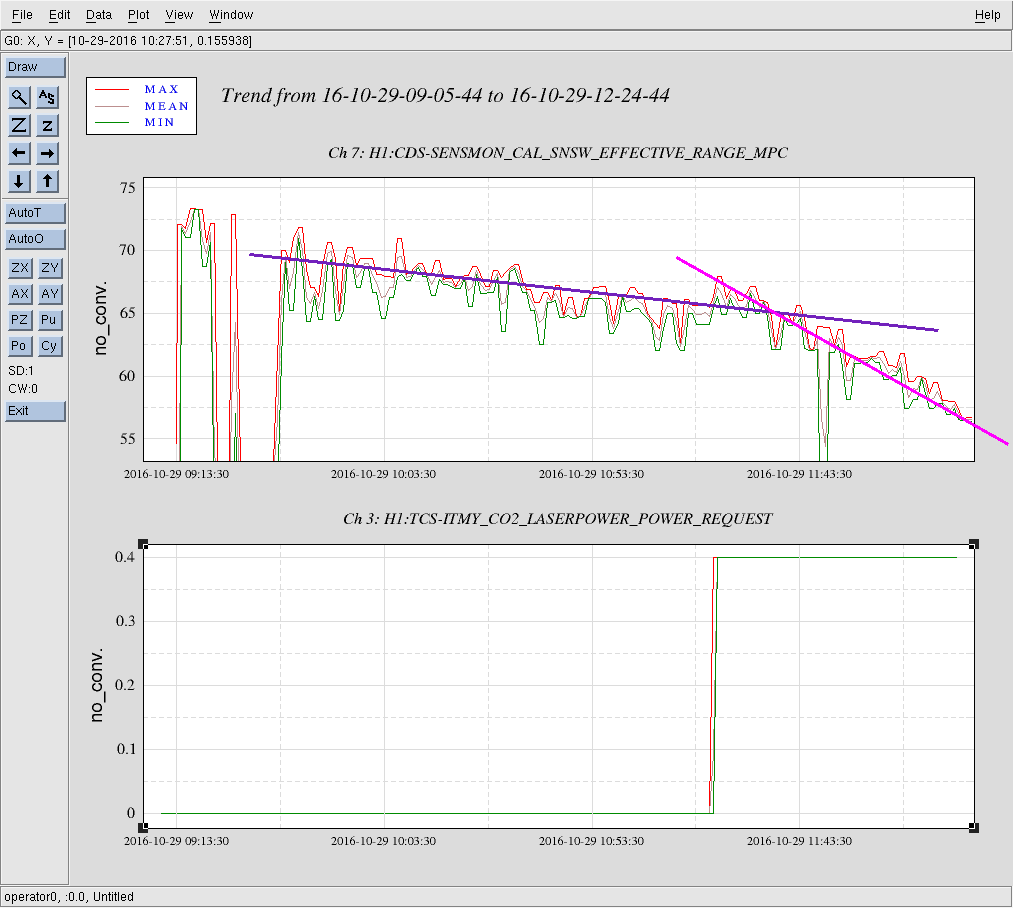


Holding off on any changes to TCS since Robert is doing work. Current lock approaching ~4hrs. Have been hovering between 50-60Mpc.
10:28: Turning BRSx back ON (Robert came to check in saying he'll head back out to EY, but won't be at EX for a few hours.) Thought of making a change on TCSy, but decided to hold off so we don't possibly cause a lockloss---want to give Robert his time.
He plans to transition EY to do possible black glass measurements at viewports (per WP 6274).