In an attempt to bring some clarity into the beam jitter discussion I looked at the Gouy phase evolution of the input beam. I collected distance and focal length information from a variety of sources, notably T1200470 and E1200616.
The biggest uncertainty I had was the PSL persicope to HAM1 viewport distance - if someone knows that, let me know.
The MATLAB script with all the numbers is in ~controls/sballmer/20160930/inputBeamCalc.m. It creates a structure of the following form, fully describing the beam and optical mode:
IMC =
lambda: 1.0640e-06 % The wavelength in m
q: 0.2325 +13.3832i % The input Gaussian beam parameter q=z+izR in m
N: 4 % number of optics
dist: [16.2406 16.2406 0.2325 0.2325 0] % Distances between the optics (one more than N)
ifoc: [0.0731 0 0 0] % inverse focal length for all lenses and mirrors (f=R/2 for mirror)
label: {'MC2' 'MC3' 'Waist' 'MC1'} % optic names
The attached .mat file contains the following structures of that form::
IMP: Input beam: From PSL periscope to MC3
IMC: Input Mode Cleaner
IMCp: Input Mode Cleaner from MC1 to MC3 only (output path inside IMC)
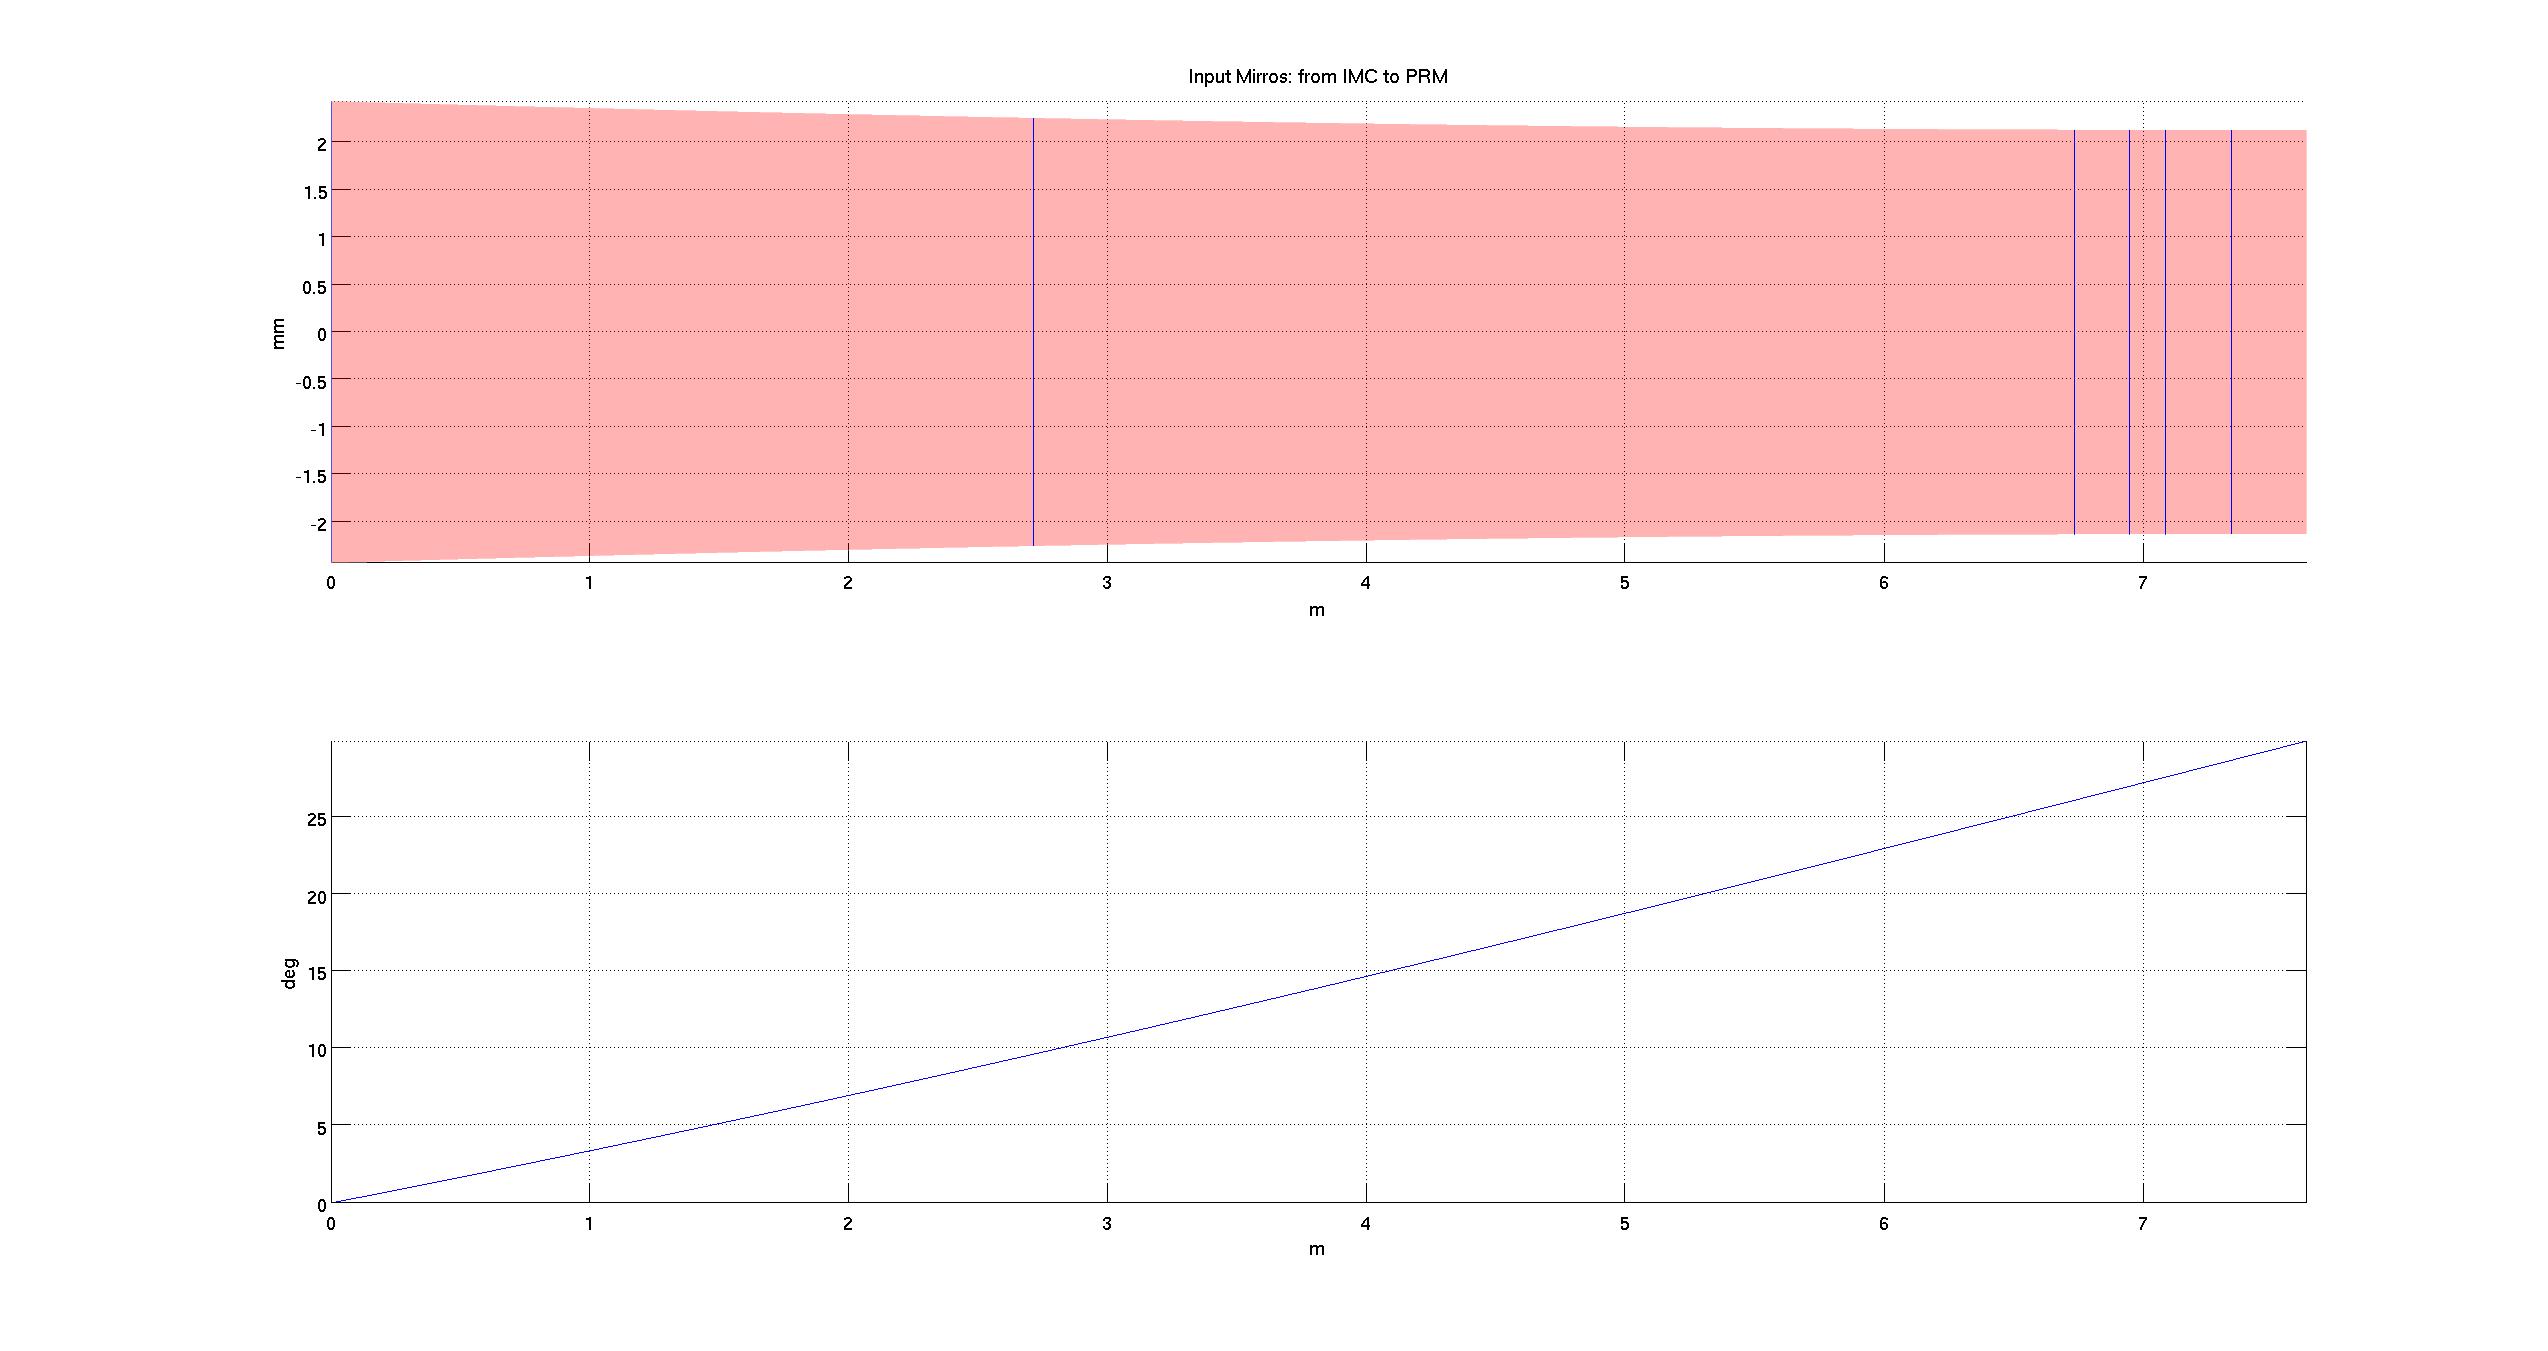
IM: Input Mirros: from IMC to PRM
PRC: Power Recycling Cavity forward path
PRCr: Power Recycling Cavity return path
PRCrt:Power Recycling Cavity round trip
Below are plots and data for the different beam segments.