TITLE: 1/13 Day shift: 16:00-00:00UTC (08:00-16:00 PDT), all times posted in UTC"
STATE Of H1: Observing at 80 Mps for 11 hours
OUTGOING OPERATOR: Travis S
QUICK SUMMARY: Winds <5mph, useism 0.6um/s, CW inj running, PSL 21.5W.
Title: 1/13 Owl Shift 8:00-16:00 UTC (0:00-8:00 PST). All times in UTC.
State of H1: Observing
Shift Summary: Locked in Observing for my entire shift. No issues.
Incoming operator: TJ
Activity log:
9:33 GRB alert
13:13 GRB alert
15:30 Chris S. to fan room
Another GRB alert at 13:13 UTC.
We received a GRB alert at 9:33 UTC.
J. Kissel, E. Goetz Having a few new breakthrough ideas on the UIM actuation system (see LHO aLOG 24914), we explored whether we are modeling the [m/N] L1/UIM force to L3/TST displacement transfer function incorrectly. This was done by driving the UIM out to 600 [Hz] and measuring the response in DARM. Not only did we find the expected-but-not-yet-modeled wire violin modes at ~330 [Hz], 420 [Hz], and some at ~500 [Hz], but we found several bending-mode resonances at 111 [Hz] and 166 [Hz]. Indeed, upon first glance, we think the 111 [Hz] resonance is the remaining missing frequency dependence that explains the turn-up seen at 100 [Hz] in all previous measurements of the UIM to TST transfer function. We'll process in more detail some time in the future, but check out the attached screen shots and be amazed at how not 1/f^6 the L1 to L3 transfer function is. -------- We'd started by exciting the L1 stage via awggui in a broad-band fashion such that we could catch all of the wire violin mode frequencies watching DARM. As Evan mentions, we had suspected that these wire resonances -- documented in T1300876 -- were the source of the deviation from 1/f^6, and they'd just not been included in the SUS dynamical model -- [[EDIT -- Brett has now included them in the model, and they are a non-negligible effect; see LHO aLOG 24915]]. This broadband TF is shown in the first attachment. Black is the with excitation ON, and red is ambient (to distinguish the ~505 [Hz] fiber violin modes from the ~495 [Hz] TOP to UIM wire violin modes, and the Beam Splitter violin modes & 331.7 [Hz] calibration line from the Sus. Point to TOP wire violin modes). Only the peaks of the wire violin mode resonances are visible above the DARM noise; driving them any higher breaks the IFO's lock. Just in case, we drove down to the same ~80 [Hz] region, and BINGO! We also found new, unexpected resonances at 166 [Hz] and even as low as 111 [Hz]! (see second and third attachments) Our best guess for the source of these resonances are imperfect actuators. Perhaps the bending of the L-bracket that mounts the OSEM coil to the reaction chain's UIM (see D060375, see page 1 for the total assembly, lock at pg 14 for the L-bracket). Though, if it were these L brackets, I'd suspect there would be 4 independent resonances... also it doesn't look like enough moving mass to have resonance frequencies as low as ~100 [Hz]... dunno, will think more. Finding something at 111 [Hz], we then took a careful swept sign measurement covering it, and indeed, it looks strikingly like another piece of the UIM puzzle. (see 4th attachment). We also grabbed a PCAL to DARM transfer function over this frequency vector, so we can turn the TF into an absolute calibration later. For future reference, the templates for the swpet sine TFs are here: /ligo/svncommon/CalSVN/aligocalibration/trunk/Runs/PostO1/H1/Measurements/FullIFOActuatorTFs/ 2016-01-12_L1toDARM_FullLock.xml 2016-01-12_PCALYtoDARM_FullLock.xml and I attach screenshots of the awggui sessions used to excite L1 and PCAL in a broad-band fashion (DARM_IN1 ASDs during the broad-band excitations were taken using the standard wall FOM for DARM).
Weird about the 111 Hz and 160 Hz modes. If it is a mechanical mode of the UIM OSEMs, it is probably more likely to be the magnet-flag assembly, which makes a nice long cantilever, and is attached to the main chain itself. See page page 16 of D060375. Additionally, if for some reason the set screw holding the flag assembly in place is loose, you met get lower frequency modes.
The L bracket is on the reaction chain, so if the mode was in that it have to couple through to the main chain via the magnetic field gradient inside the coil; it's possible but one more step removed.
You could try exciting these modes one OSEM at a time, to see if it is coming from one in particular. If we get lucky, maybe we'll find there is a simple fix, like tightening a set screw.
I also wonder if these features exist on other test mass suspensions.
The 111Hz feature is very likely from the first internal mode of the UIM blades which is not surprising sicne it will ebt there at some level due to cross-coupling. The frequency is very close - see for example https://alog.ligo-la.caltech.edu/aLOG/index.php?callRep=16740 where the frequencies were measured at LLO for their quads to be in the range ~111 to 112 Hz. As for the 166 Hz, I don't have a good idea. It is not the second resonance of these blades. Lab measurements of such a blade here at Caltech give the second mode at around 325 Hz. Funnily enough this is ~twice the observed feature, but I can't think why we would see something at half the frequency of a blade mode.
I was asked by Jeff to fit the UIM data so that we can include the peaks at 111 and 167 Hz in our calibration model. After some struggle, I ended up doing an emperical zpk model which gave me the following parameters:
=========================
gain = 2.270401e-09
f:pole0 = 1.113398e+02
Q:pole0 = 5.596904e+14
f:pole1 = 1.950899e+02
Q:pole2 = 4.743158e+00
f:zero0 = -1.133450e+02
Q:zero0 = 6.220362e+01
=========================
In addition to these fitted parameters, I had fixed zpks which are 6 poles at 1 Hz and 1 complex pole at 166.7 Hz with a Q of 200. The attached shows a comparison of the fitting and data. I have used fminsearch to minimize a weighted residual. I didn't have an energy to compute the uncertainties in the estimated parameters.
One thing I don't like with this fitting is that the fitted model falls faster than the nominal 1/f^6 slope above approximately 160 Hz due to the extra poles that I put in to make the fitting better at frequencies below.
The code and resultant figure can be found at:
Activity Log: All Times in UTC (PT) 00:00 (16:00) Take over from TJ 00:19 (16:19) Lockloss – Robert doing hardware injections in CS 00:24 (16:24) Gerardo – In LVEA to speak with Robert and look at viewports 0035 (16:35) HFD – On site to check alarm panel at Mid-Y 00:38 (16:38) Gerardo – Out of the LVEA 00:57 (16:57) Reestablish lock at NOMINAL_LOW_NOISE, in commissioning mode. 01:00 (17:00) HFD – Back from Mid-Y – Corrected trouble with alarm panel 01:01 (17:01) Robert – Back into the LVEA for more calibration work 01:48 (17:48) Lockloss – Commissioning work 02:29 (18:29) Relocked at NOMINAL_LOW_NOISE, in commissioning mode 03:00 (19:00) Robert – Finished in the LVEA. He did a sweep before exiting 03:30 (19:30) Lockloss – Commissioning work 04:00 (20:00) Relocked at NOMINAL_LOW_NOISE, in commissioning mode 04:10 (20:10) Lockloss – Commissioning work 05:20 (21:20) Relocked at NOMINAL_LOW_NOISE, in commissioning mode 07:53 (23:53) Set the intent bit to Observing - Commissioners are finished for the evening 08:00 (00:00) Turn over to Travis End of Shift Summary: Title: 01/12/2015, Evening Shift 00:00 – 08:00 (16:00 – 00:00) All times in UTC (PT) Support: Jenne, Kiwamu, Jeff K., Evan G Incoming Operator: Travis Shift Detail Summary: Lock was broken several times during the shift, due to commissioning and calibration work. Relocking was not too difficult and did not require an initial alignment. The wind has come up a bit (3 to 10 mph). Seismic was slightly rang up due to a mild EQ; but has since recovered. Microseism is elevated but within bounds. Commissioning work has finished for the evening and the IFO is back into Observing mode.
Evan G., Jeff K.
Revisiting measurements Jeff made in the field [1],[2],[3] and new measurements with those I took in the EE lab, we compared with the UIM residuals measurements obtained using the Pcal and ALS DIFF measurements. Attached is a figure showing the electronics chain and comparing with the residuals obain. We find that the BOSEM electronics account for some of the residuals found in the UIM measurements, but not all. At this point, we have only clues, but no solid evidence for what remains of the residuals. We have three theories:
I set up in the EE shop a UIM driver, satellite box, and BOSEM to repeat Jeff's measurements and verify we observe the same effects. Indeed, I observed similar issues that Jeff had observed in his measurements from the floor. We put these measurements on top of the UIM actuation residuals measurement/model but, unfortunately, find that they are not completely accounted for by the electronics chain.
We started to think about what else could be going wrong with the residuals, but so far have come up with the only three theories above. To undertand this effect in more detail, Jeff is currently undertaking exploratory measurements of the UIM-->DARM and Pcal-->DARM to frequencies higher than 100 Hz. Hopefully these measurements will shine some light on this effect.
The quad model on the svn does not have UIM-PUM wire violin modes. I just drafted an update that does include these, which I used to generate the attached figures. I'll commit this update if it appears consistent with measurements.
The plot ViolinModes_12Jan2016.jpg compares the model UIM L to Test L transfer function with and without the UIM-PUM modes, but with the fiber modes in both cases. I guessed the UIM-PUM violin modes to be a Q of 100,000, but that could be off an oder of magnitude or two. The second figure plots the ratio of these 2 transfer functions.
According to this second figure, the UIM-PUM violin modes explain some, but not all of the discrepancy seen between the measurements and the model in the log above. So either the model is not correct, or there is still something in the feedback loops we are missing.
For the Bench measurements, the data is stored at:
/ligo/svncommon/CalSVN/aligocalibration/trunk/Runs/PostO1/H1/Measurements/Electronics/BenchUIMDriver/2016-01-12
Attached are plots showing the individual components of the coil driver electronics fitted with the vectfit program in Matlab and using LISO. I report the fitted LISO values below with respective uncertainties.
Dummy BOSEM connected, with output impedance network (see figure UIM_out_impedance.pdf):
Best parameter estimates: zero0:f = 84.1507169277 +- 1.627 (1.93%) pole0:f = 303.5726548020 +- 5.431 (1.79%) pole1:f = 127.6915337428k +- 3.535k (2.77%) factor = 2.2065872530m +- 17.45u (0.791%)
This fit shows the calibration of 2.2 mA/V, one zero at 84.15 Hz, and two poles at 303.57 Hz and 127.7 kHz.
BOSEM only (output impedance network divided out so only BOSEM transfer function remains, see figure UIM_bosem.pdf):
Best parameter estimates: zero0:f = 334.8526120460 +- 3.892 (1.16%) zero1:f = 1.2383234778k +- 43.39 (3.5%) zero2:f = 8.2602408615k +- 320.8 (3.88%) pole0:f = 747.0160319882 +- 27.6 (3.69%) pole1:f = 5.3613221192k +- 210.2 (3.92%) pole2:f = 25.8483289876k +- 310.1 (1.2%) pole3:f = 232.8627791989k +- 3.041k (1.31%) factor = 11.6075630096m +- 14.92u (0.129%)
For some reason, this transfer function is tricky to fit. These are the fewest number of zeros and poles I could put in LISO and still provide a good fit to the data. LISO does complain that strong correlation exists between pole1<-->zero2 and pole0<-->zero1. When I removed these pairs, the fit became much worse, so I left them in.
As a comparison with the full chain: digital AntiAcq x analog Acq (output impedance network) x BOSEM (see figure UIM_full.pdf). The model fits the measurement with 2% up in magnitude to 40 kHz, and within 1 degree in phase up to 50 kHz.
Finally, the previously shown plot in the original post divides out the full BOSEM measurement in the field ('field BOSEM'), but the model already takes care of the analog output impedance network, so this original plot was double-counting. I attach here a corrected version of the plot (see UIM_res_with_elec.pdf). This shows that the BOSEM does indeed correct for some of the excess residual, it is not the dominant contributor to the behaviour above ~60 Hz.
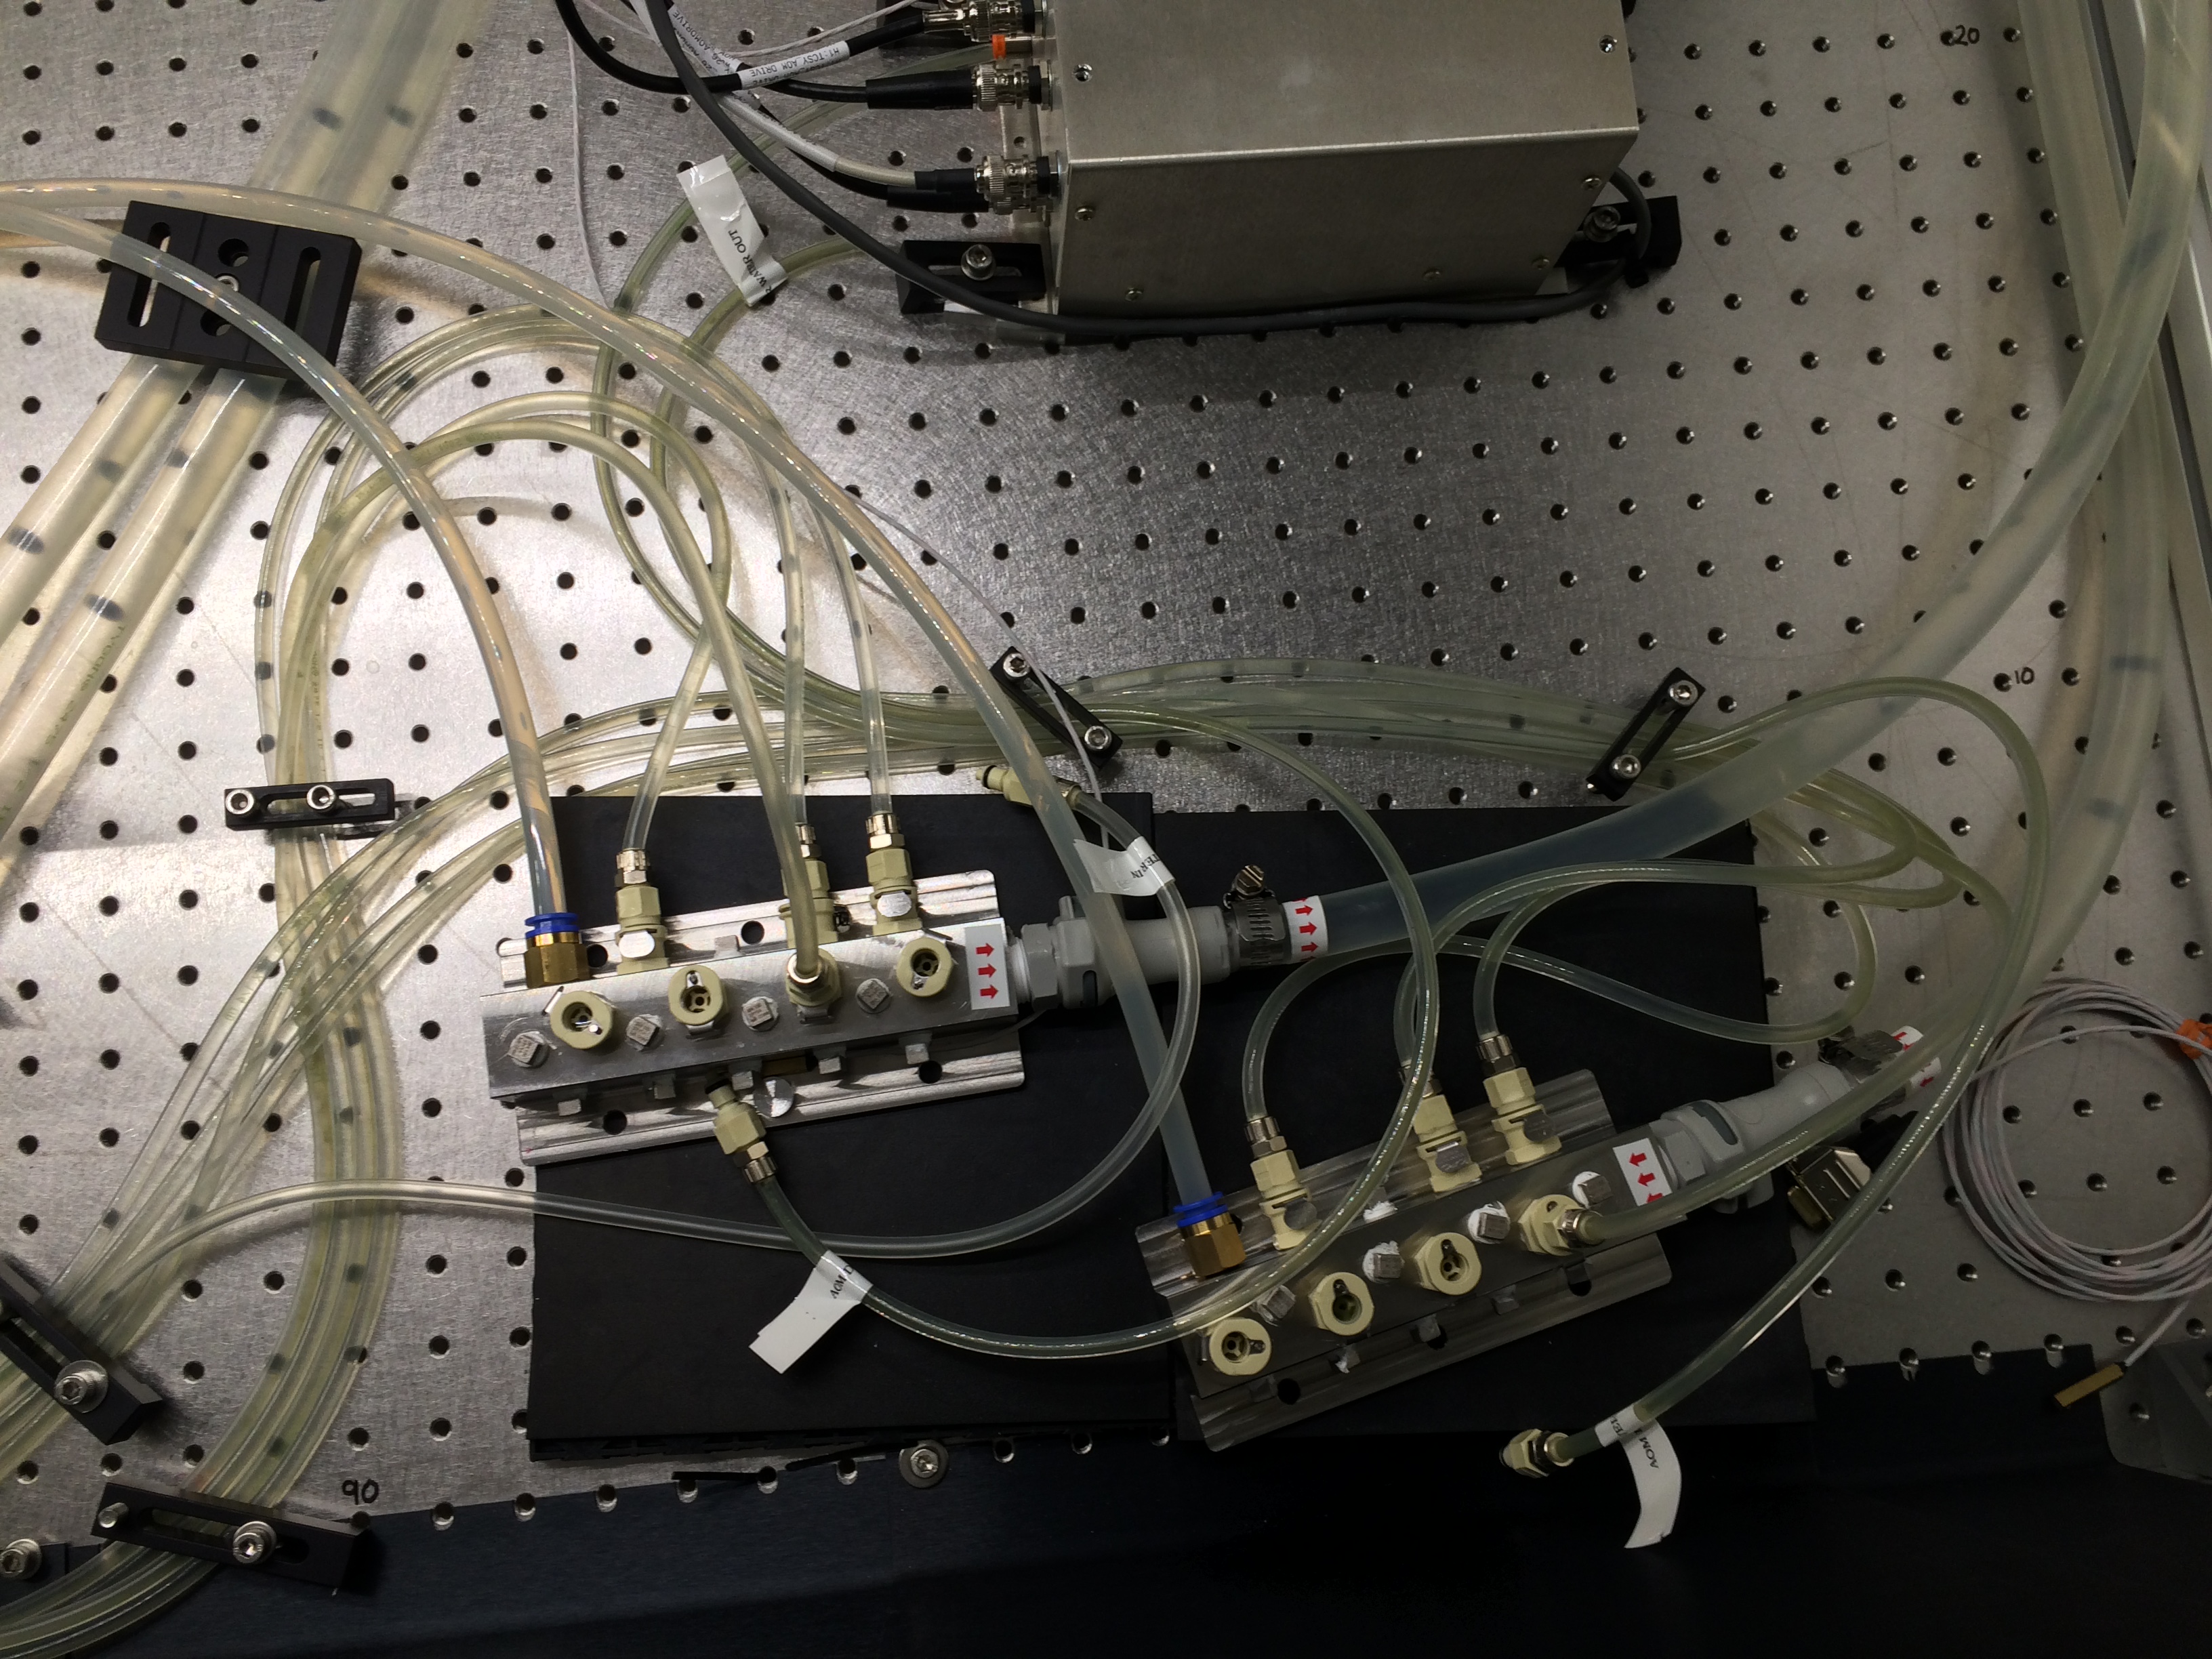
Found leak in OSB kitchen ceiling. Put catch bucket under leak and cleaned up water on floor and opened FSR #4211.
IFO mostly locked in Commissioning mode supporting commissioning/calibration work. There have been several lockloss events during the shift. Relocking has been relatively easy and has not yet required an initial alignment. Microseism has been trending up for the past couple of hours, but the other environmental conditions are OK. Commissioning/calibration continues.
J. Kissel, While tuning the drive amplitudes on some explorative transfer functions regarding the UIM actuation discrepancy, I aborted a measurement which resulted in a huge spike from my excitation channels (much higher than my requested excitation) and broke the lock. This remains an open CDS Bug, open since this past July (see Bug 897); hopefully now that the run is over, we can install some updates to software such that this finally gets fixed.
Opened FRS ticket 4210.
While investigating an issue with x1seibsctim04 Jim Batch and I noticed that the power supply on the x1seiex IO chassis was dead. We replaced the power supply with a spare unit from the self. The new power supply appears to be getting 5v (some leds where lit), but it would not turn on (the fans would start to spin up and then stop).
Further investigation is needed. For now x1seiex has been disconnected from the dolphin network and turned off.
FRS 4218
https://services.ligo-la.caltech.edu/FRS/show_bug.cgi?id=4218
From the FRS: --- Comment #1 from richard.mccarthy@LIGO.ORG --- Turns out the an ADC interface board had a short dragging the power supply down. Replaced the board and returned the unit to service.
Transition Summary: Title: 01/12/2016, Evening Shift 00:00 – 08:00 (16:00 – 00:00) All times in UTC (PT) State of H1: IFO locked and in Commissioning, for calibration work. Outgoing Operator: TJ
TITLE: 01/12 Day Shift: 16:00-00:00UTC (08:00-16:00 PDT), all times posted in UTC"
STATE Of H1: Nominal Low Noise, Calibration injections ongoing
SHIFT SUMMARY: Quiet day in terms of maintenance, no problems I can think of. The commissioning and PEM work has been the cause of a few locklosses, and it came up easy every time (I didn't touch anything this last time)
INCOMING OPERATOR: Jeff B
ACTIVITY LOG:
Attached are 7 day pitch, yaw, and SUM trends for all active H1 optical levers.
Centering: All oplevs within acceptable operating range, no re-centering required.
Glitching: No change from last week.
FRS 4177, Bugzilla 960 The wmctrl package has been installed on most Ubuntu control room workstations. The workstations that have NOT had wmctrl installed are opsws6, opsws9, and operator0.
operator0 now has wmctrl installed.
opsws6 now has wmctrl installed.
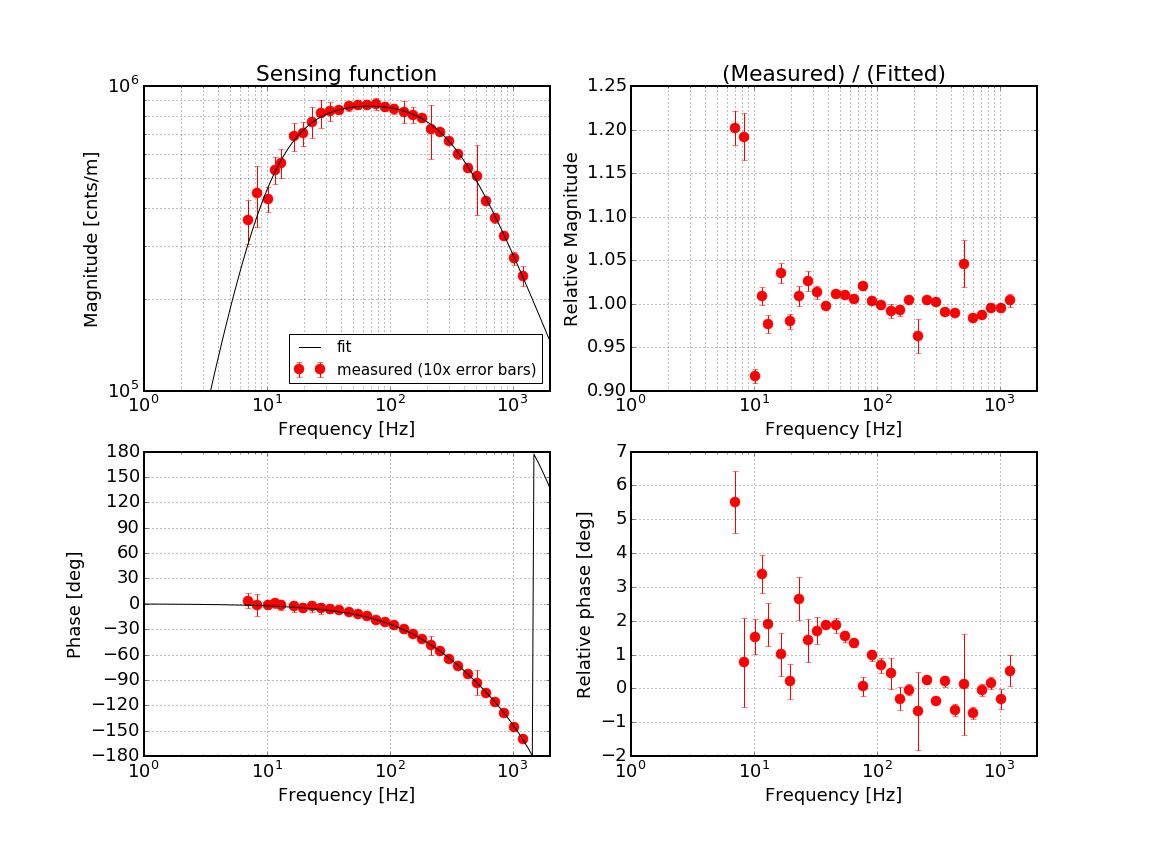
J. Kissel In order to begin exploring the systematic discrepancy between model and measurement below ~30 [Hz] in the IFO's sensing function (see, e.g. LHO aLOG 24709), we've taken PCAL2DARM and DARMOLGTF transfer functions at the normal amplitude and at half amplitude. Sadly, the IFO lost lock during the last few (low frequency) data points of the last half amplitude DARMOLGTF, but I think we have enough data to make a comparison. Premiliminary message: there's no obvious, unexpected difference between normal and half amplitude. Coherence is less, so the data points are a little more scattered, but no surprise there. One thing of note, while watching the DARM ASD during the measurement, there are no signs of higher harmonics in the PCAL excitation, but once the DARM OLGTF (as driven by the ESD and subsequent upper stages) reaches ~20 Hz, one can clearly see a second harmonic in the ASD meaching along right behind the fundamental excitation frequency. To give a feel, during the normal amplitude drive, once the excitation hit ~15 [Hz], the second harmonic's amplitude was roughly 3.5 orders of mangitude below the fundamental (but still clearly visible thanks to the discrepancy between the 10 and 30 [Hz] sensitivity). Recall that the linearization for ETMY is *not* on in the IFO's lowest noise state. The EY bias voltage remains -380 [V] (with an effective bias voltage from charge of ~ -20 [V]; see LHO aLOG 24547). We leave the IFO down for the PCAL team to explore PCALX problems (see LHO aLOG 24726), and so Betsy can grab this week's charge measurements on ETMY. Analysis of the data to come later, but the files live here: /ligo/svncommon/CalSVN/aligocalibration/trunk/Runs/PostO1/H1/Measurements/DARMOLGTFs/ 2016-01-08_H1_DARM_OLGTF_7to1200Hz.xml 2016-01-08_H1_DARM_OLGTF_7to1200Hz_halfamp.xml /ligo/svncommon/CalSVN/aligocalibration/trunk/Runs/PostO1/H1/Measurements/PCAL 2016-01-08_PCALY2DARMTF_7to1200Hz.xml 2016-01-08_PCALY2DARMTF_7to1200Hz_halfamp.xml
Later, I have processed the transfer functions that Jeff took and I have made a comparison. I do not see any systematic change between the measurements with the nominal amplitudes and the ones with half amplitudes. See the attached pdf for more details. Note that we are seeking a systematic as large as 20 % at 10 Hz. There are seemingly statistical error in the measurement but they don't look systematic.
The analysis code lives in the SVN at: /ligo/svncommon/CalSVN/aligocalibration/trunk/Runs/PostO1/H1/Scripts/DARMOLGTFs/HalfAmp_20160112.m
The resultant plot can be found at: /ligo/svncommon/CalSVN/aligocalibration/trunk/Runs/PostO1/H1/Results/DARMOLGTFs/2016-01-08_HalfAmp.pdf