Fil, Richard, Craig, Evan
Summary
We measured the voltage noise on the EY ESD in the nominal low-noise configuration, close to the flange. The measured noise is too small to impact DARM.
Above 50 Hz, the noise of each quadrant electrode relative to the bias electrode is about 25 nV/Hz1/2. At the nominal bias (380 V), this implies a white force noise at the test mass of 1.4 fN/Hz1/2, which amounts to 6×10⁻²³ m/Hz1/2 at 100 Hz.
Measurement details
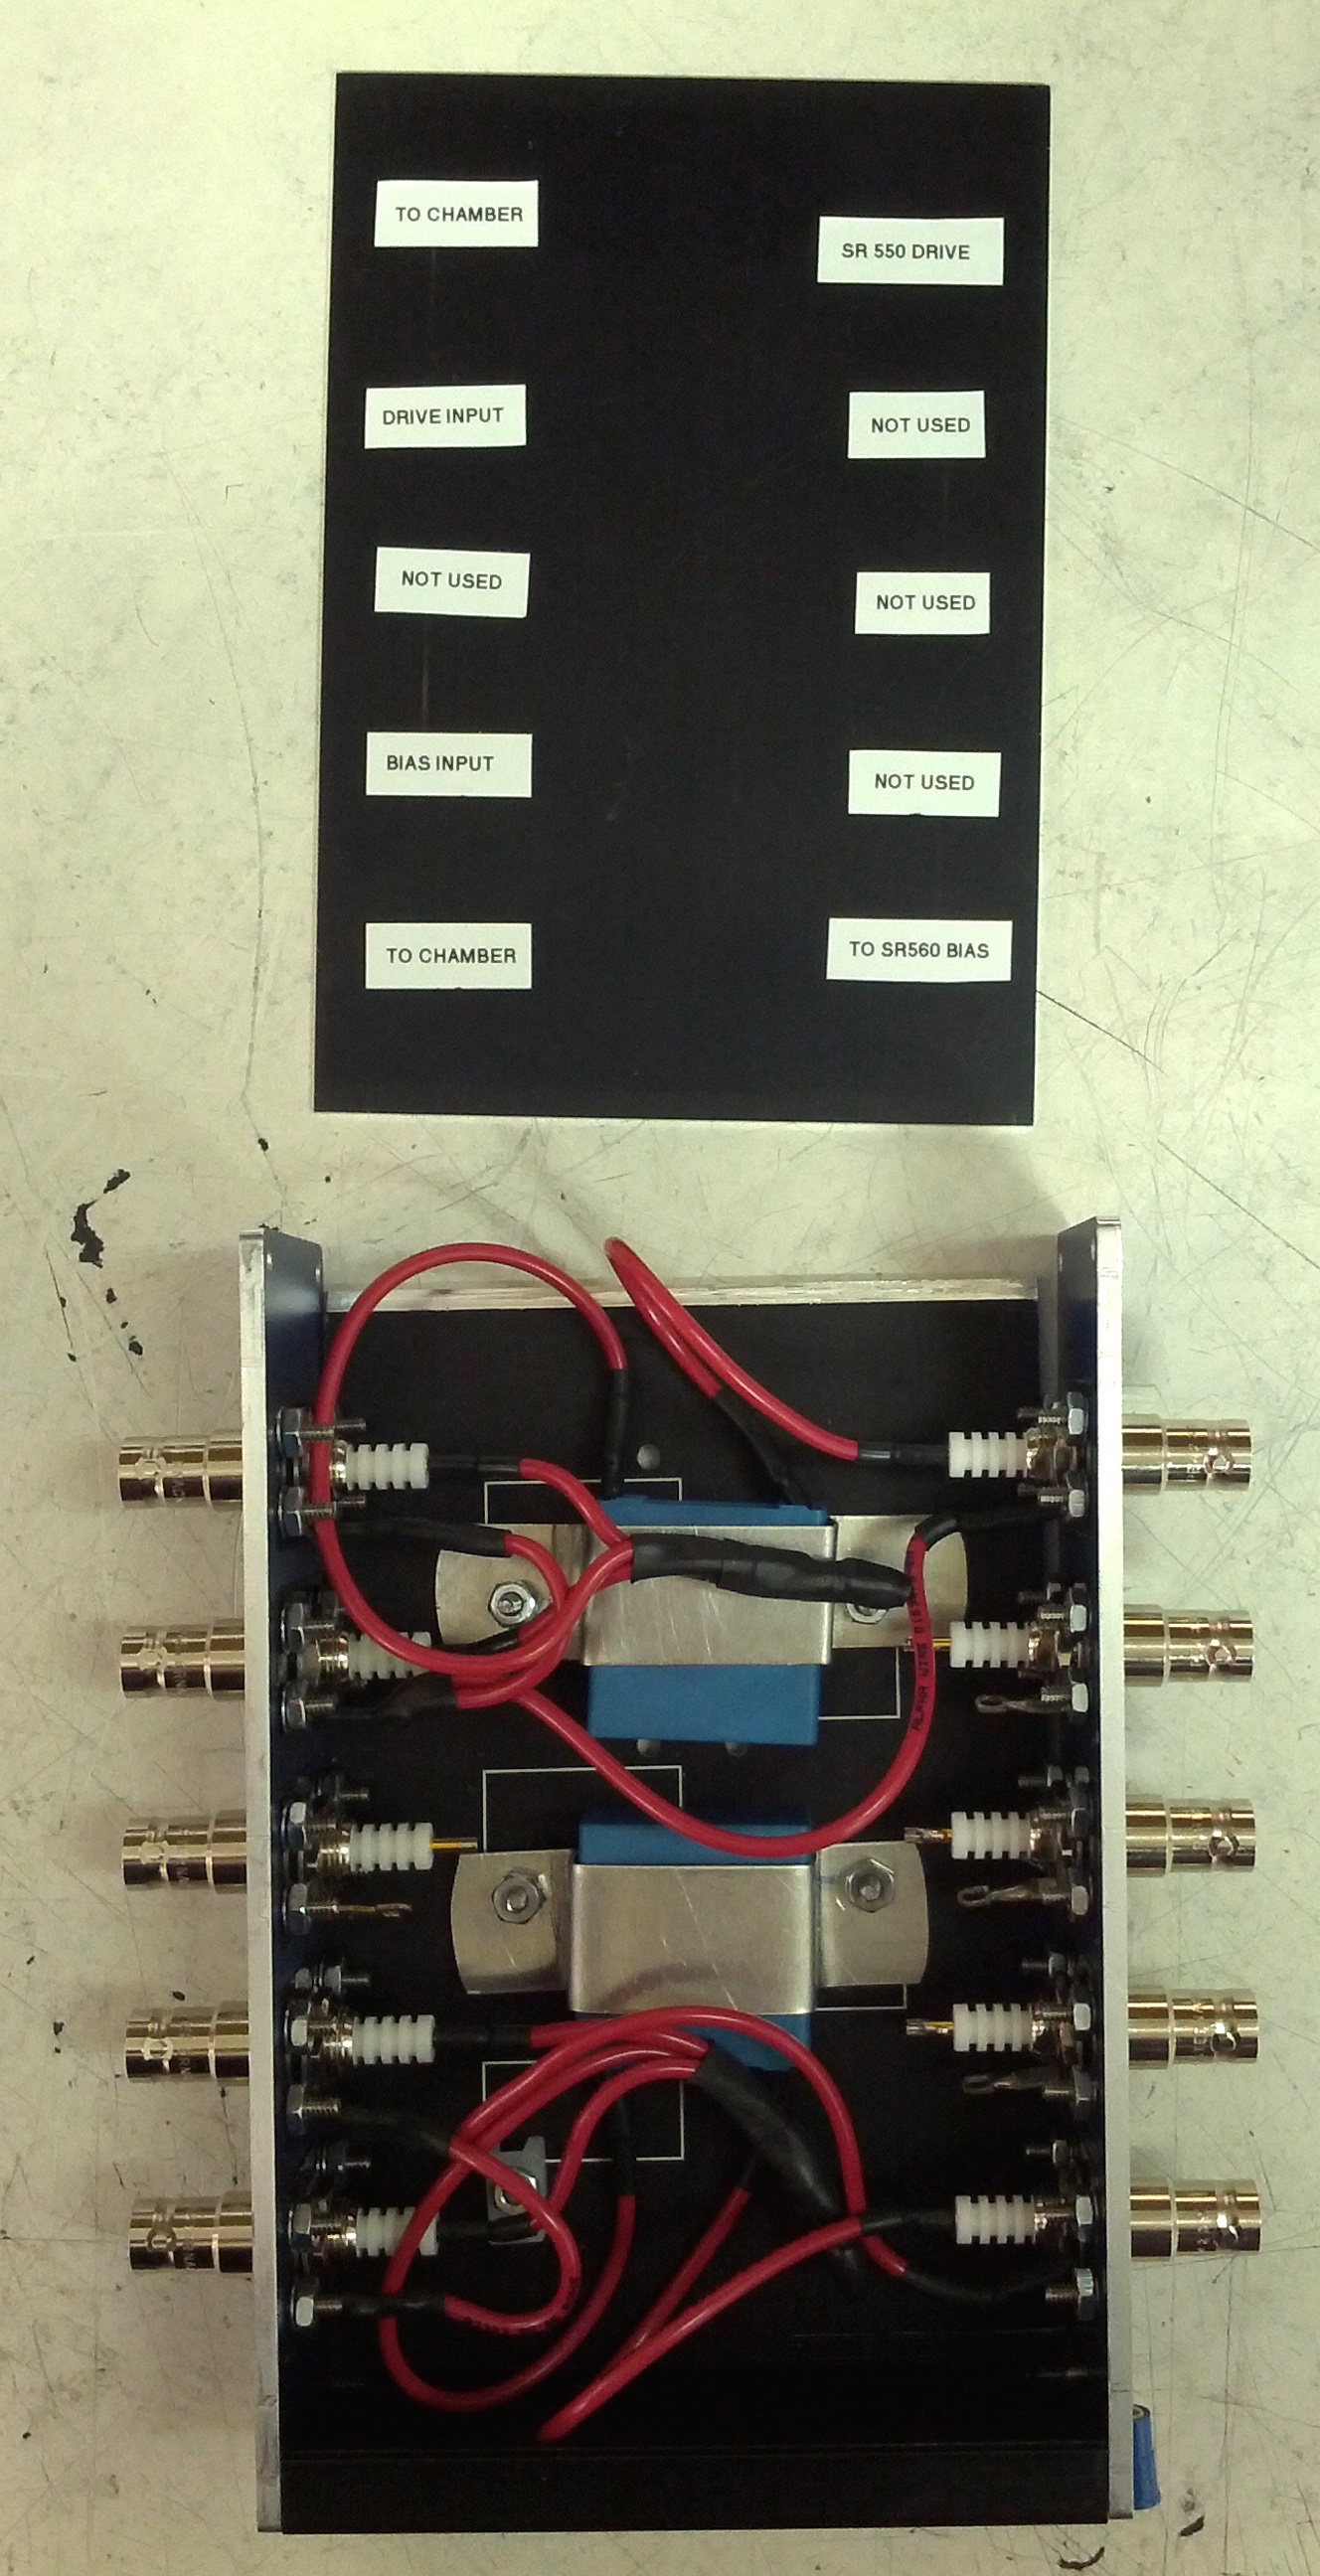
Based on a design by Rai (T1600088), Richard built a passive box which picks off the voltages going to the ESD and ac couples them with 5 µF capacitors (see attached image). This enables us to pick off the bias voltage and a particular quadrant voltage, ac couple them, and then differentially amplify them with a dc-coupled SR560. The 5 µF works against the 100 MΩ impedance of the SR560 to give a high-pass corner of about 0.3 mHz. The SR560 gain was 100, with an input-referred voltage noise of 4–6 nV/Hz1/2 above 10 Hz.
We installed the passive box after the current-limiting resistor box, which sits in the cable tray close to the cable feedthrough on the BSC.
We took two kinds of measurements.
First, we had the ESD signal pass through the passive box and into the chamber to the reaction mass electrodes. The bias electrode was held at 380 V. We measured the ac-coupled signal differentially between the bias signal and a particular quadrant signal. This measures the voltage noise being applied to the electrodes. On each quadrant, we had a calibration line running at 35 Hz, with an amplitude of a few hundred DAC counts.
Second, we disconnected all five driver signals before they entered the passive box, but left the connections to the chamber alone. We again measured the ac-coupled differential signal between the bias and the quadrant (LR only). This measures the voltage noise between the electrodes.
Results
The attached plot shows the results of the two measurements for LR. For the configuration with the driver connected, we also checked the other three quadrants and the spectra looked almost identical. We also briefly tried injecting band-limited white noise from 0.8 to 8 Hz, just to see if exercising the DAC had an effect on the noise floor above 50 Hz (it didn't).
We would like to take measurements on EX in its low-noise configuration, as well as with the driver disconnected.


This morning while the DAQ is running sans SUS-PI, I manually restarted daqd on h1fw1. Unfortunately it did panic crash on restart of daqd, the console gave a bit more information:
kernel panic - not syncing: Fatal exception in interrupt
paging request at 0000010000000000000
Shutting down cpus with NMI