jeffrey.bartlett@LIGO.ORG - posted 10:31, Monday 01 February 2016 (25289)
LVEA Laser Hazard
Kiwamu transitioned the LVEA to laser hazard
Kiwamu transitioned the LVEA to laser hazard
Pulled in new CPS Sync cabling from SUS-R1 to CPS units on BSC10.

Work still needed for install (EX/EY):

1. Install fanout chassis in SUS-R1
2. Run RF cable from Electronics Ebay to VEA SUS-R1 (71MHz)
3. Modifications to some of the CPS units (Converting units from masters to slaves)
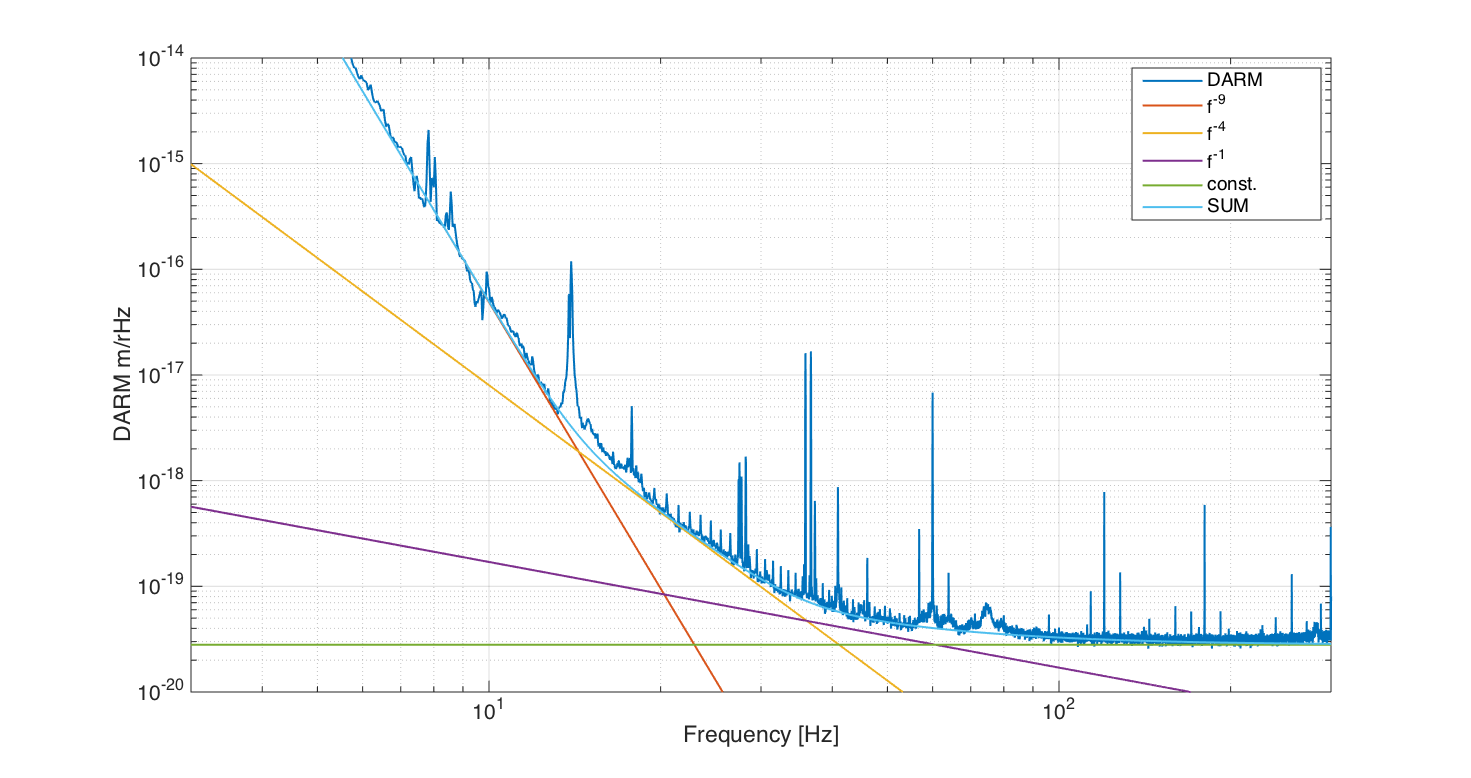
Aftef improving the angular decouplig and the feedforward, the noise curve looks quite smooth to me, except for a small bump betwen 15 and 20 Hz and some other bumps between 55 and 80 Hz, to be investigated.
So I played the noise slope fitting game, to see what kind of noise shape we would need to explain the curve. At high frequency there's shot noise (flat) and Kiwamu's 1/f noise. At very low frequency (below 14 Hz) the noise curve looks very steep, and it seems to be something like 1/f^9, although it's very difficult to properly estimate the slope here, it could easily be 1/f^10.
What's most interesting to me is that between 20 and 40 Hz, the noise floor is explanable with a 1/f^4 slope. I find this interesting because it points to suspension displacement or actuation noise in the second to last stage, for example excess noise in a DAC or coil driver in one of the test masses, or even in the BS.
Caveat: this is just a hint, the slopes and amplitudes I estimated might be very wrong, and there's no real indication that we only have three or four separate noise contributions.
P.S. I wanted to upload the MATLAB fig file, but it's 21 Mb and so it seems I can't attach it here.
SEI – OK
SUS – Charge measurements
CDS – OK
FMP – Final carpet installation on Wednesday. Ongoing shimming the LVEA main crane.
VAC – OK
PSL – High Power checkout work
TCS – Guardian updates, Check out and commissioning. Prep work to turn on TCS-Y laser
General commissioning work continues. Commissioning meeting at 09:00 in control room
Outreach – Dale will conduct two tours through the control room around noon

Outstanding work permits were reviewed.
Reviewed planned work for Tuesday maintenance
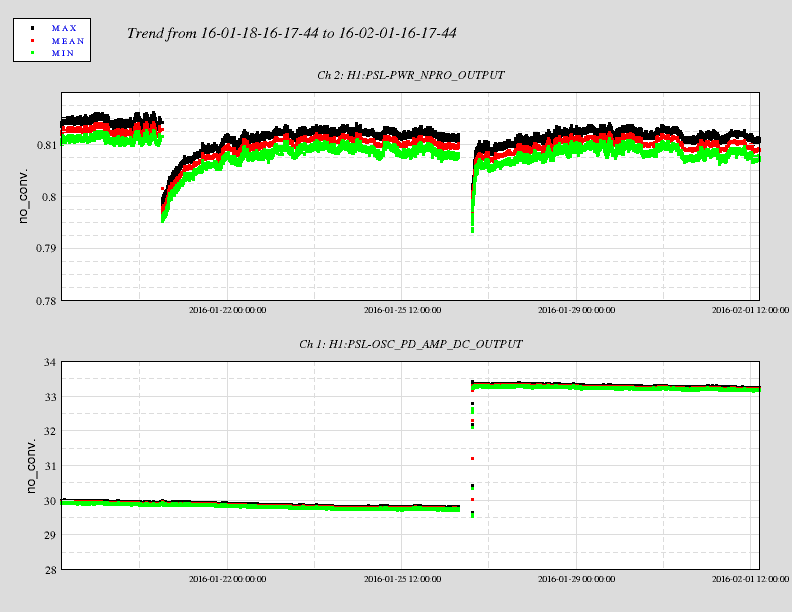
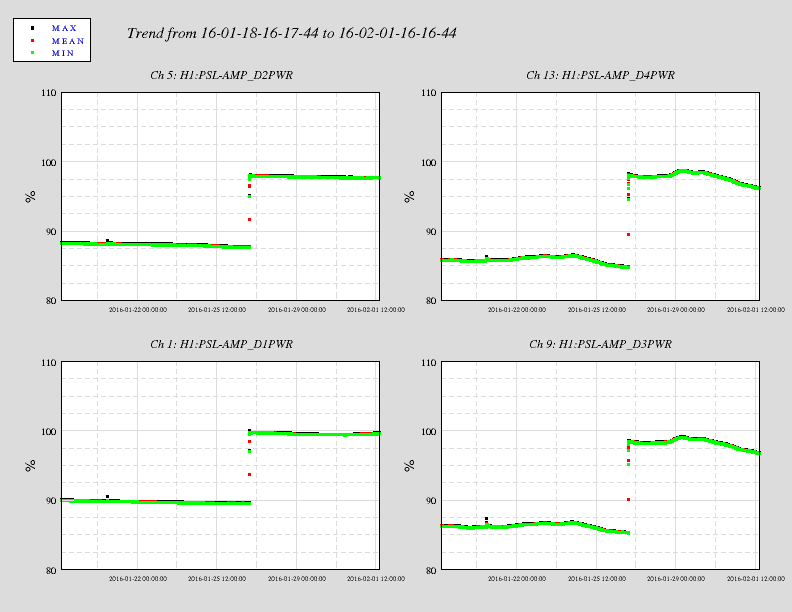
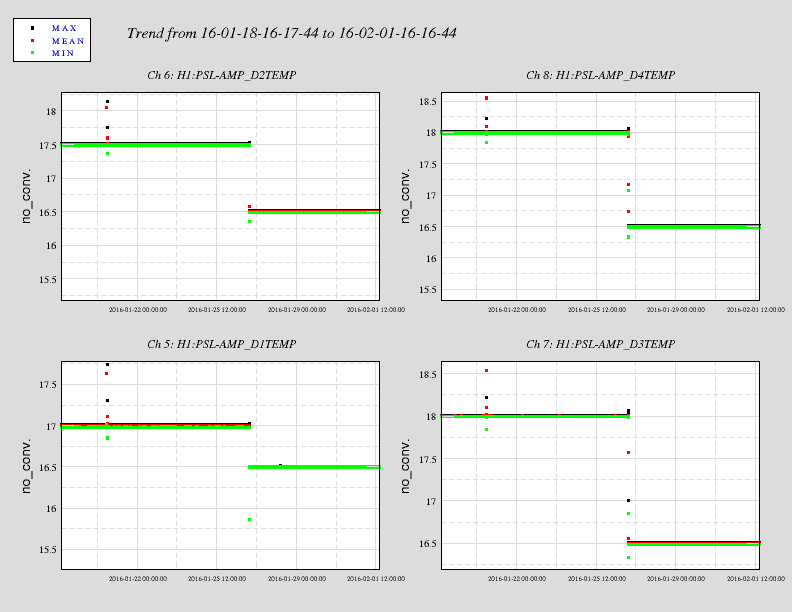
Attached are 14-day plots from turning up the front end laser pump diode current(s) and adjusting their
temperatures.

Note that even though the NPRO output power plot reads that the NPRO power is ~0.81W.  As measured by a
power meter placed after the phase-correcting EOM, the power is 1.46W.  The NPRO power monitoring photodiode
measures the power into the power amplifier.

Diodes 1 & 2: 51 A -> 55 A
Diodes 3 & 4: 51.6 A -> 57 A

Diode 1: 17 degC -> 16.5 degC
Diode 2: 17.5 degC -> 16.5 degC
Diode 3: 18 degC -> 16.5 degC
Diode 4: 18 degC -> 16.5 degC
             Transition Summary:
Title:  02/01/2016, Day Shift 16:00 – 00:00 (08:00 – 16:00) All times in UTC (PT)

State of H1: IFO unlocked – TCS commissioning work underway. Working on relocking.

Outgoing Operator: N/A
No restarts reported for all four days.
I remeasured the 45 MHz phase noise coupling into DARM, this time with broadband excitation. No surprises here; it looks the same as the swept-sine TF that we took before O1 (20783).
Setup is similar to the previous measurement, although in this case the PLL has a UGF around 20 kHz, so that the control signal going to the IFR can be read out directly in order to get the frequency deviation.
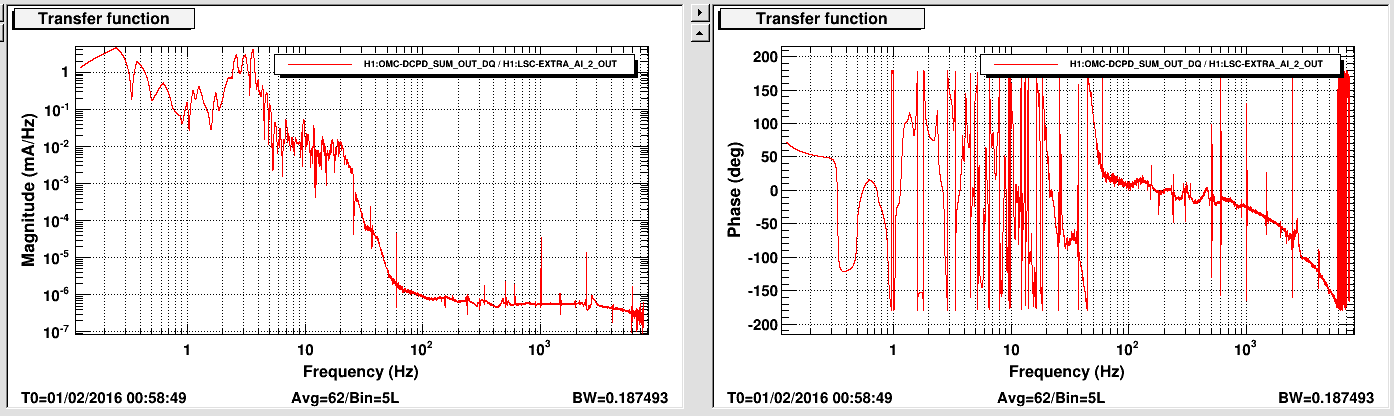
During this test, there was some glitching of the rfam stabilization.
The attachment shows the rfam OOL monitor (bottom) and the digital excitation to the IFR (top). Note the control signal glitches that appear even in the absence of IFR drive.
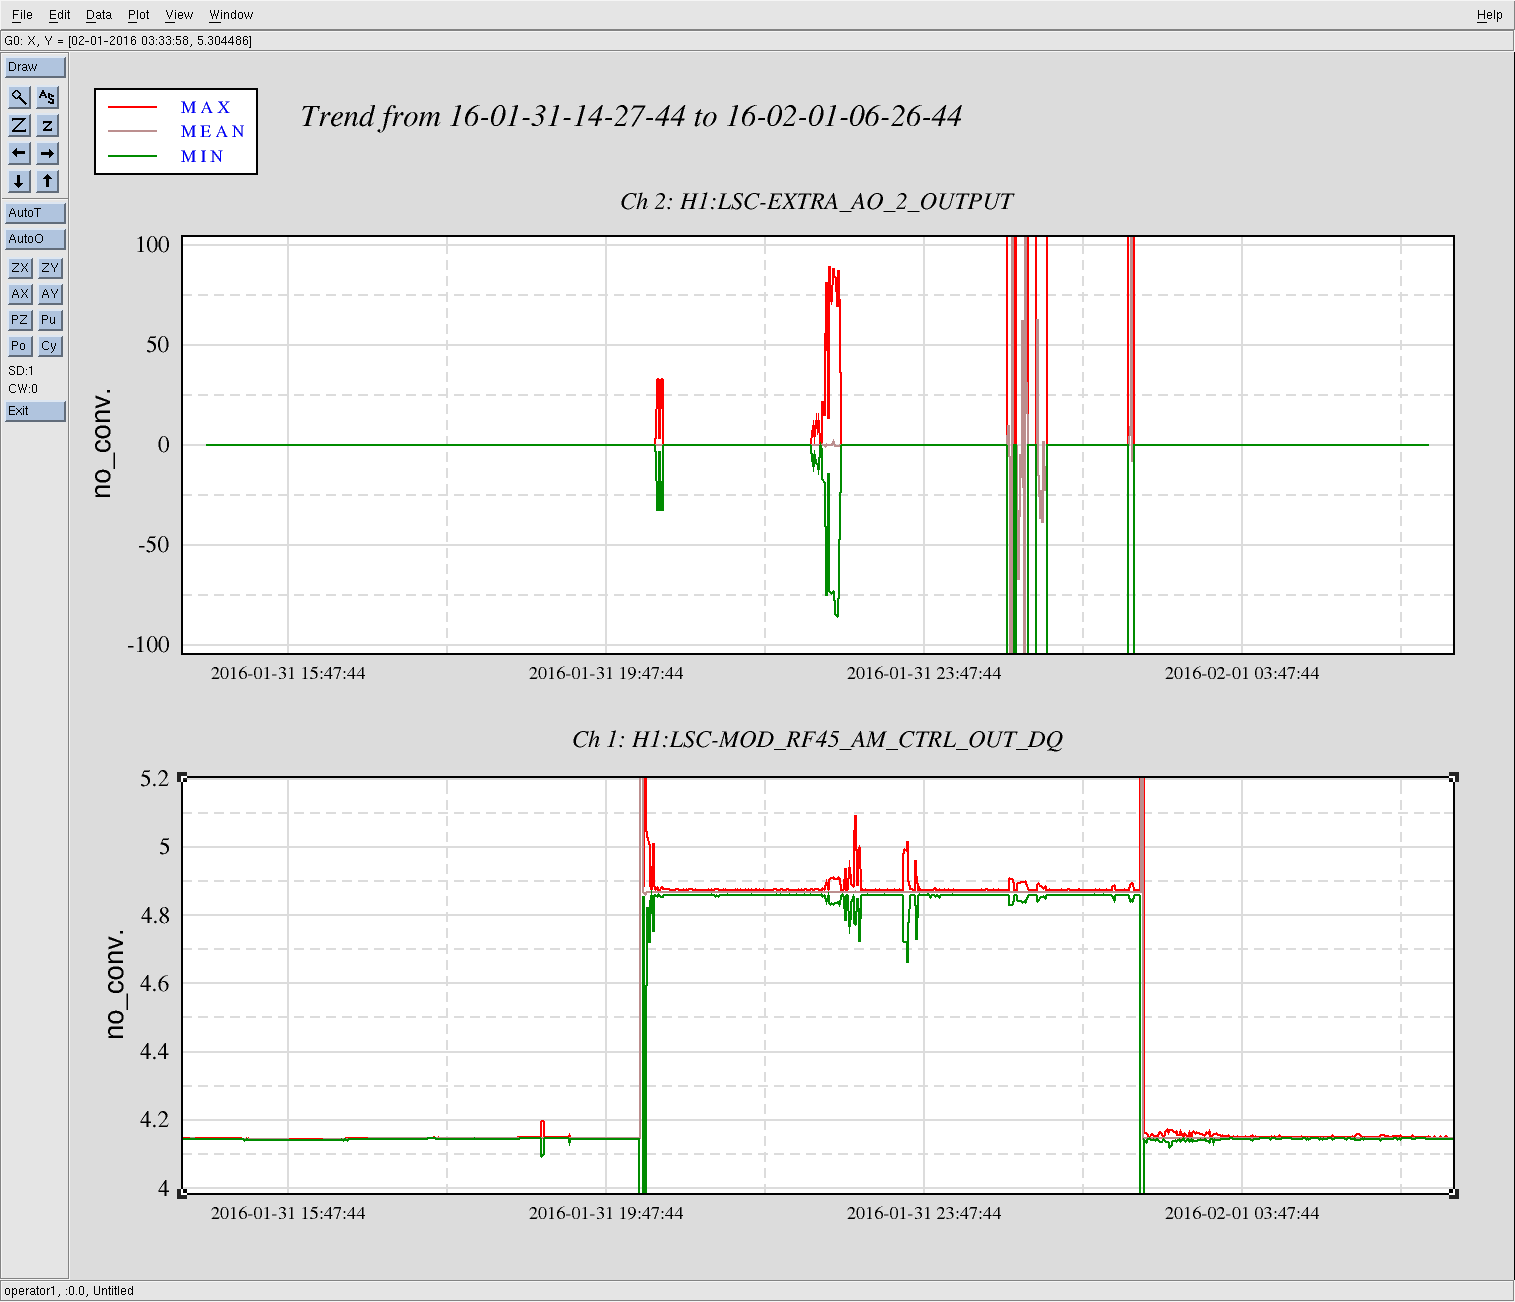
We have had multiple locklosses today from the beamsplitter coil driver switching.
This is puzzling, since this step was largely unproblematic during the run.
Opened FRS ticket 4325.

Unfortunately for the this study, the only BS's coil driver monitor channels stored are noise and voltmons, both of which are upstream of the output impedance network (so they don't measure the current effect of switching the "acquire" network off as is done here) *and* they're only stored at 1024 at the fastest.

I recommend we start by either
(a) installing an analog voltage breakout pick-off in-line with the M2 BOSEM chain down-stream of the coil driver to identify the amplitude of glitching which takes out the IFO's lock, and address from there, or
(b) Changing the h1susauxb123 front-end model to store the driver's FAST I MON at 16 [kHz]. (These can go in the commissioning frames, and also the noise and voltmon can be removed.)
Starting to look at this but have a question before I start.
Why is the Ramp on UL  0sec and the other filter 10 Sec.
Richard refers to the ramp time in COILOUTF bank; however the ramping between coils is performed by the new Ramp Matrix part not this bank. It's likely that this COILOUTF bank ramp times were "set" some long time ago (clearly more than 300 days ago!) and because it's not used for any ramping of control signals, it has merely remained untouched.
This problem has gotten worse and better in the past without any known cause, for example durring ER7 it was particularly bad.
The changes to the common ASC_MASTER ASC library part have been made, and committed to the svn.
Late last week, I made the changes for the 2f centering loops. Today I added excitation points (and monitors) at the output of the ASC servos, which will make sensing matrix measuring easier. I also added 2 more DC centering loops, which will be used to feed the Trans QPD signals to the transmons. Finally, I created 2 filter banks CHARD_A and CHARD_B for each pitch and yaw, so that we can do some frequency dependent error signal blending.
All of these changes compile, but nothing has been installed or restarted. We'll do that on Tues.
Medm screens are mostly done. I still need to increase the input and output matrix sizes, but since all the new stuff is at the end of the matrices, even if we restarted the model right now, we could use the screens as-is. I also need to add Exc notifications to the ASC overview screen for the new sensing matrix excitations.
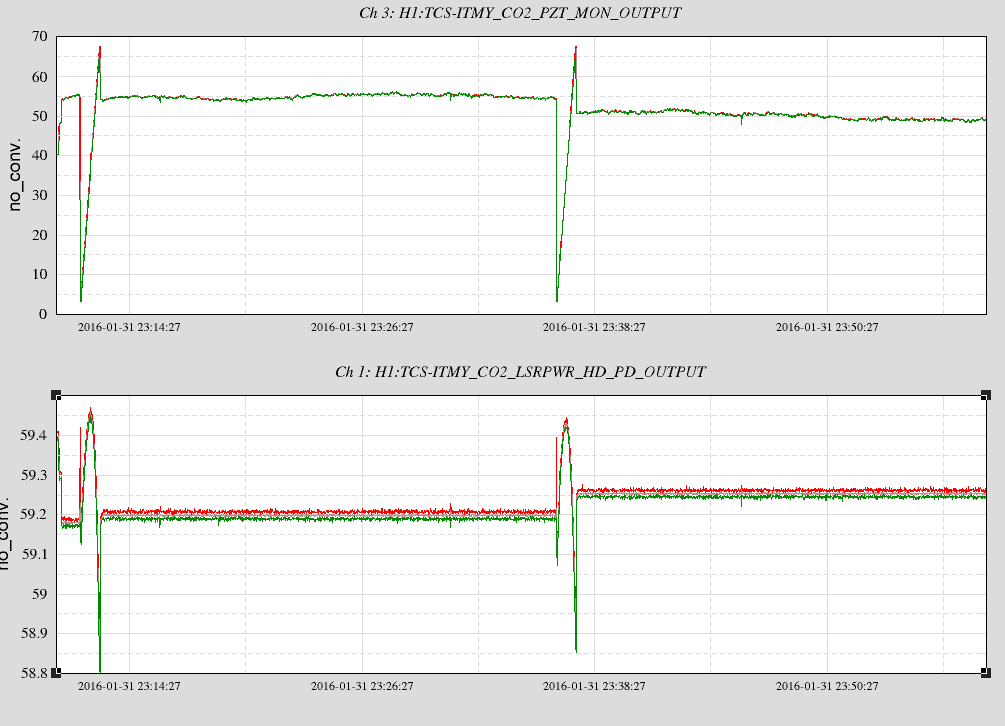
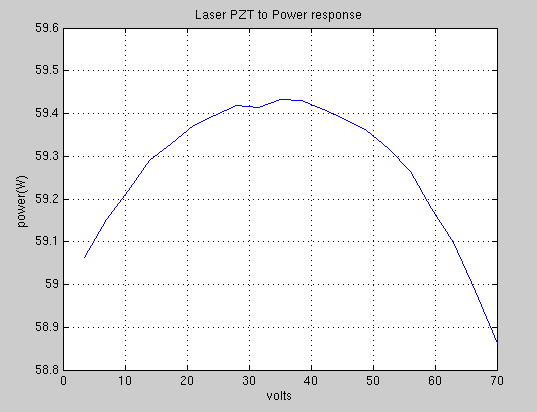
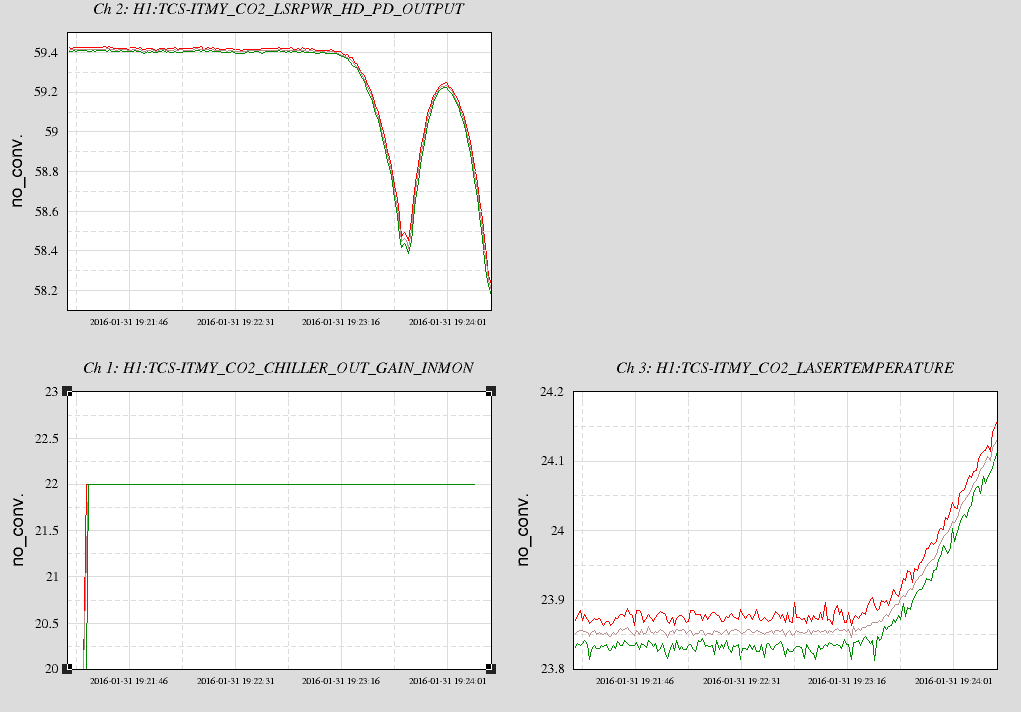
Today I've been working on the guardian controlled laser pzt servo. Using the Y-arm laser guardian can now scan the PZT, pick a locking point, calculate the slope at that point and use this to set the gain for the servo. The servo itself has a unity gain frequency of 0.5Hz and 1/f below that. After picking a locking point guardian sets the PZT to that voltage and waits for several seconds to allow the laser thermopile to come into equilibrium before re-measuring the power output which is then fed to the power setpoint. The servo is then engaged. This gets around problems that I was having where using the value taken directly from the power to voltage curve would cause a small but unmanagable offset in the setpoint at the point where the servo was engaged. The servo can cope with positive and negative slopes to the curve which reduces the number of times we will need to step the chiller temperature when trying to lock. We may want to do a little averaging across nearby points when calculating the gradient to get the servo gain, because I did see some instances where this seems a little higher than we might want, which could lead to an unstable value being used.
The first graph attached shows two cycles of using guardian to lock the laser, with graphs for the PZT voltage (effectively the control signal) and the power output (effectively the error signal). The second graph shows the data for power as a function of pzt voltage that was collected by guardian during the locking process.
I also ran a step function on the chiller to look at the time constant for the water to reach the laser (see attached graph). It came in at 110s, which is similar to a measurement made at LLO. We will use this to pick the unit gain frequency for the chiller servo loop. The laser took a significantly long time to come to equilibrium, though this is because the step made was large.
Tagging GRD as well
1415 - 1430 hrs. local -> To and from Y-mid

Next over fill to be Tuesday, Feb. 2nd before 4:00 pm
Attached plots are the comparison between X04 and C01 data where C01 is latest version of the calibration without the time varying parameters applied to it. X04 is the C01 data with time varying calibration parameters applied to it, except for the cavity pole. These comparsions are made only at the calibration line frequencies and includes data from Sep 30- Oct 9.
X04 agrees closely with PCAL both in phase and magnitude. The magnitude of C01 shows some discrepancy, especially at lower frequency, which can be attributed to the charging of testmass. There is 1 16-kHz cycle discrepancy in phase of C01 as well of which the calibration team is aware of and have plans to correct with the release of X04 (eventual C02).
I removed the mixer-based rfam monitor at ISC-R2 (23567). This was using outputs 7 and 8 of the 45 MHz distribution amp; these outputs are now terminated.
The N connectors on outputs 4, 5, and 6 of the distribution amp were not finger-tight for some reason (perhaps collateral damage from some other 45 MHz investigation?). I tightened them down.
I've been working on the Guardian script for locking the CO2 lasers. It now has the following states programmed:
DOWN : Resets the laser pzt position to center. Resets the chiller temperature to 20C. Turns off all servos
FIND_LOCK_POINT : Scans the internal pzt of the laser while measuring the power output using the thermopile. The thermopile is a little slow, so this takes a few seconds to do. It then looks at the slope of the resulting curve to work out if there is a suitable place to lock. It can lock to a positive or negative slope. If there is no good slope then it steps the chiller temperature by 0.03C (we may want to increase this) waits for 4minutes because there is a significant time lag (this may be too short to reach equilibrium temperture) and then retries to find a good point to lock the laser. It finishes by setting a setpoint value for the desired laser power and leaves the PZT at the voltage corresponding to this power.
LOCK_LASER: Engages an integrator between the thermopile readout and the PZT.
RESET_PZT_VOLTAGE : Slowly hands off the DC offset in the PZT voltage from the offset box to the integrator. The offset ends up at 37.5V, which is the centre of the PZT range. This offset plus the integrator output will now correspond to the PZT voltage for the desired laser power.
ENGAGE_CHILLER_SERVO: The voltage from the PZT integrator is used as the error signal to drive the servo for the chiller. The servo is engaged and gains are set.
ISS_ENGAGE : We don't yet need the intensity stabilization system so this state is just bypassed
LASER_UP : This state will be used to monitor the system while in use, looking to see if the power output of the laser exceeds certain boundaries, or whether the laser PZT reaches the limits of its range, which would indicate that the servo has lost lock on the laser.
We still need to setup the gains on the integrator stages for the laser pzt and the chiller. The chiller one is particularly awkward to monitor because the unit gain frequency is so low. The guardian script is currently located in the TCS folder /opt/rtcds/userapps/trunk/tcs/common/guardian/TCS_CO2.py
Tagging GRD
