The message:
The second harmoinc upconversion we see in DARM is much larger than can be explained by a quadratic term in the actuator response on any one of the suspension stages we use to drive DARM. Also, the coil balancing for ETMY L2 is a little bit off.
Details:
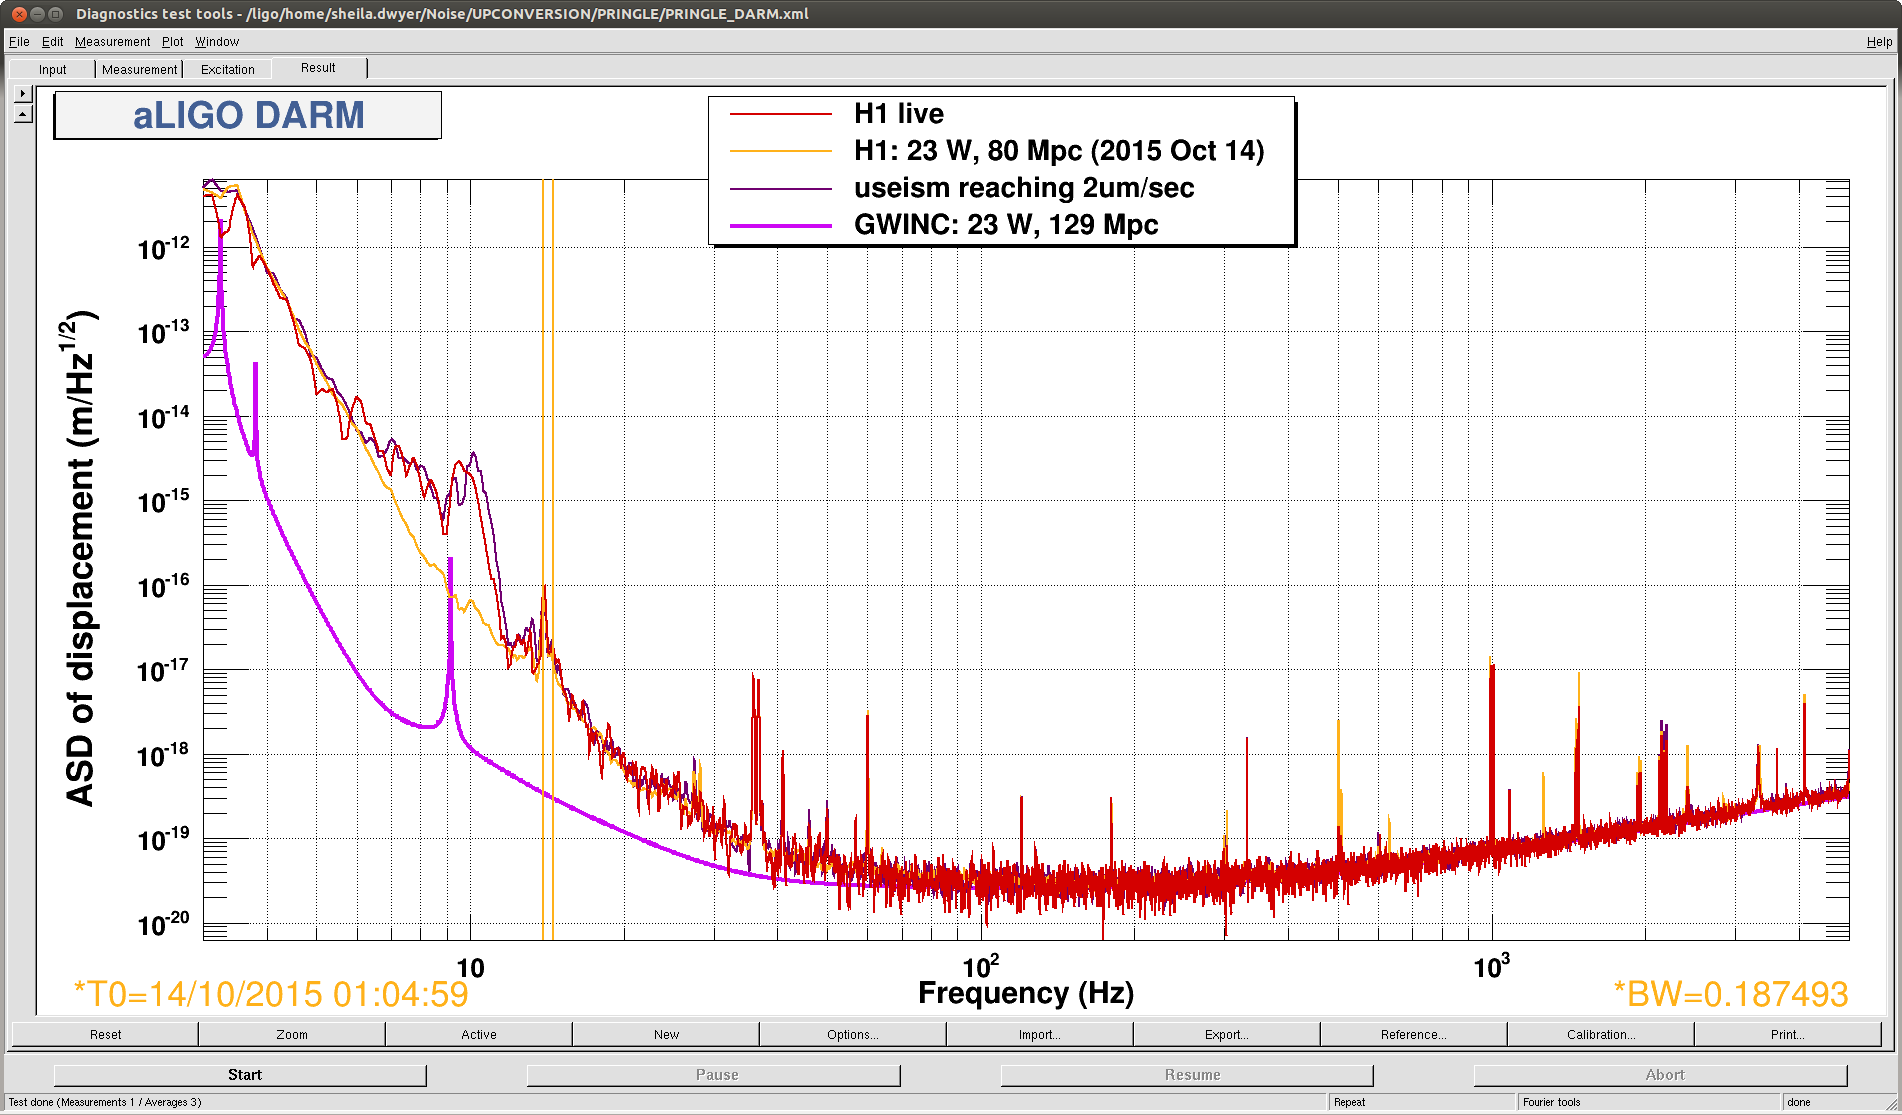
We have seen that driving DARM at frequencies from 5-10 Hz creates a second harmonic in DARM (alog 21240). One of the tests Evan and I have been thinking about doing for a while is driving each suspension stage in pringle to look for a second harmonic in DARM. The idea is that if we drive pringle, as long as the coil balancing is good there should be no longitudnal DARM motion at the drive frequency, although there would be longitudnal motion at the second harmonic frequency. This allows us to look for a quadratic actuator reposnse without having to worry about any quadratic effect in the sensors.
The second harmoinc upconversion we see in DARM is much larger than anything we can see by driving pringle on EMTY L1, L2, L3 or ETMX L2. (all the stages we use for DARM, plus ETMX L2 as an extra).
I repeated an injection similar to what we did in alog 21240, injecting a 500 counts at 6Hz into ETMY ISCINF. This resulted in a similar level of second harmonic. Then, using the lockin I excited pringle on each stage individually, creating a drive to each actuator that was significantly larger than the drive generated by the DARM excitation.
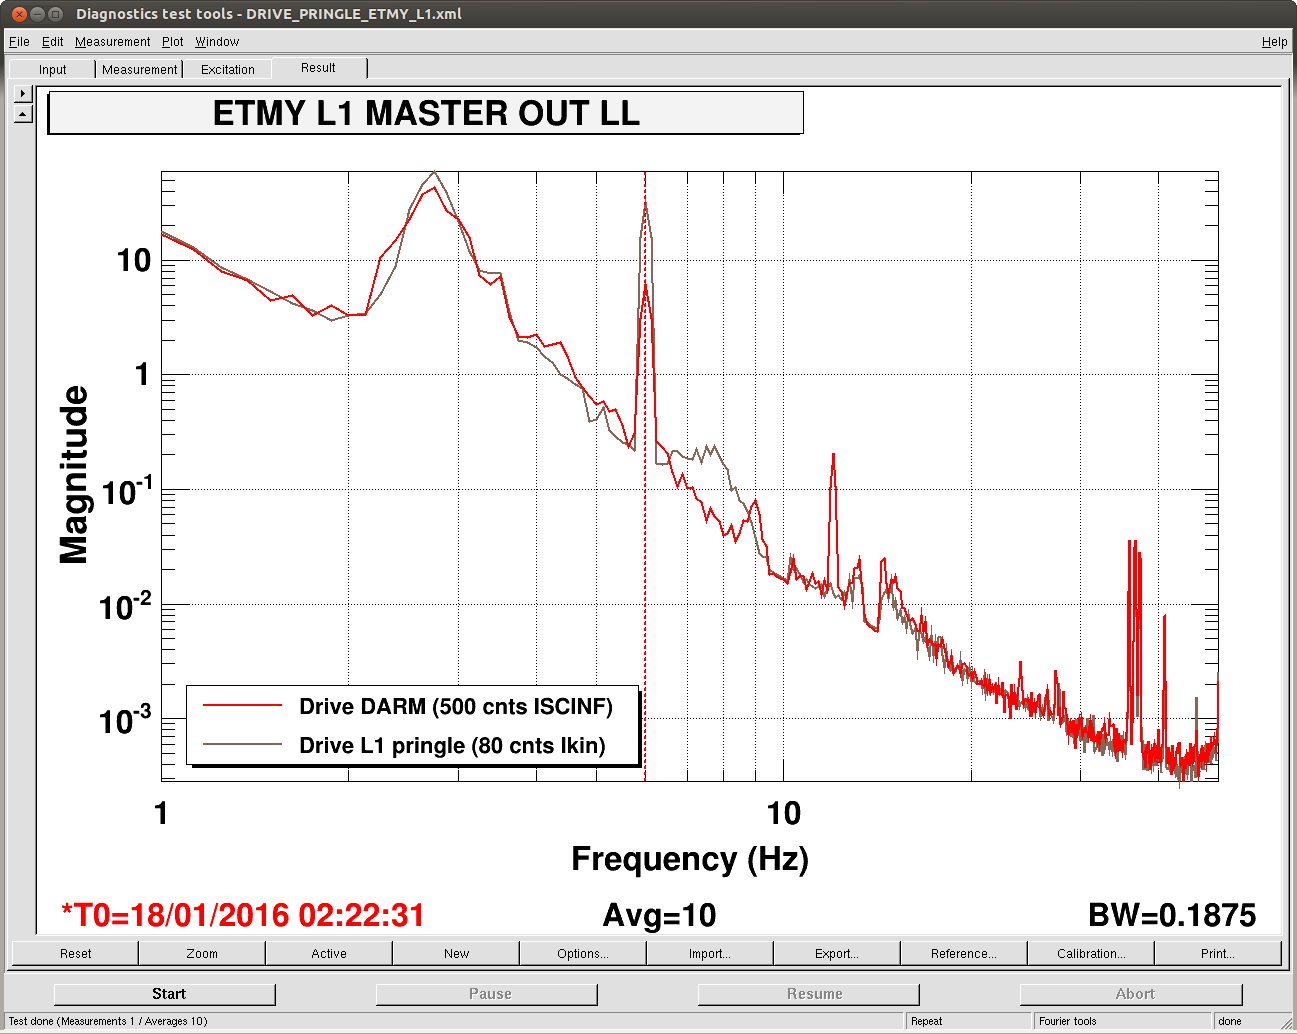
First attachment: ETMY L1 pringle drive. In the case where I was driving DARM you can see the excitation at 6 Hz in L1 MASTER OUT and the second harmonic at 12 Hz, when I drove pringle a factor of 5 harder on each osem, there is no second harmonic showing up.
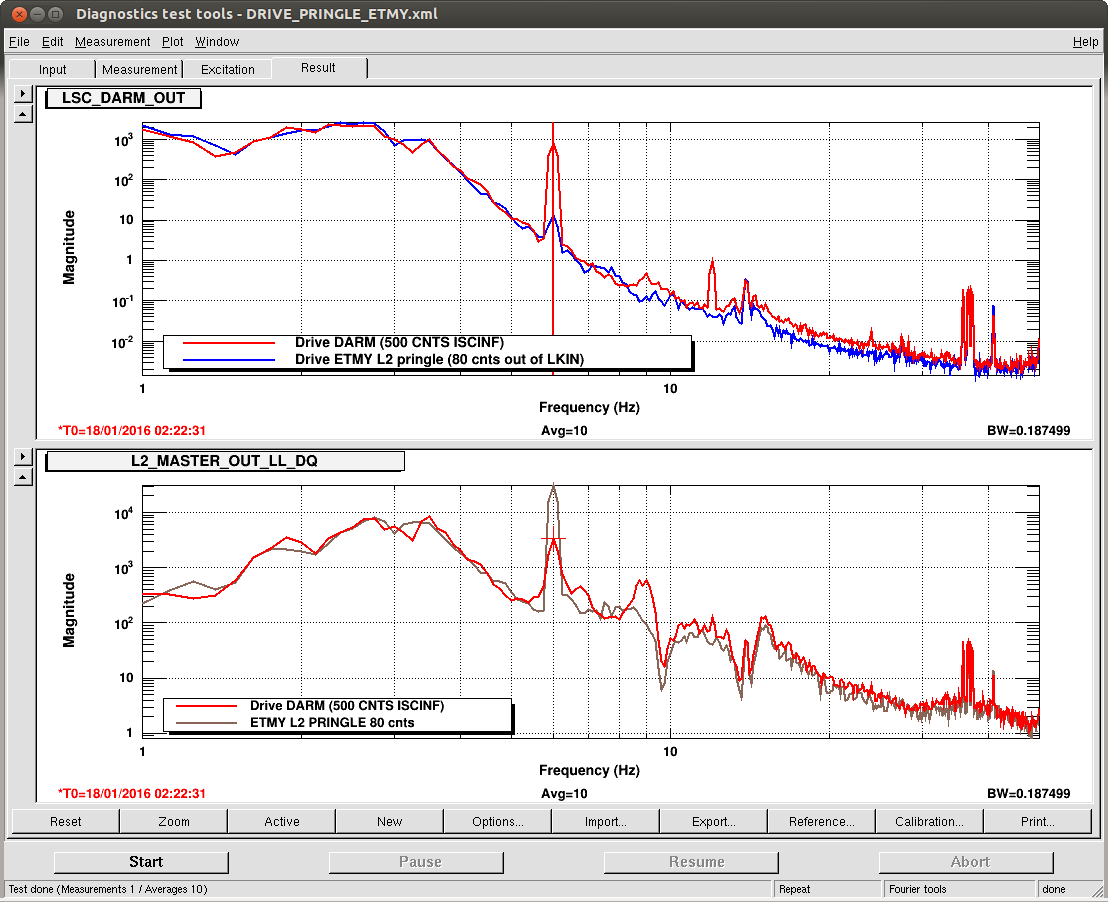
Second attachment: Same for ETMY L2, driven a factor of 10 harder for pringle than DARM. You can see in the DARM spectrum in the upper panel that the coil balancing is a little off, so the pringle drive couples to DARM at 6 Hz a little bit. Also it is difficult to see the darm second harmonic in the master out for L2, probably because ASC drive signals dominate. I did a similar test for ETMX L2, and there is similarly no second harmoinc in DARM.
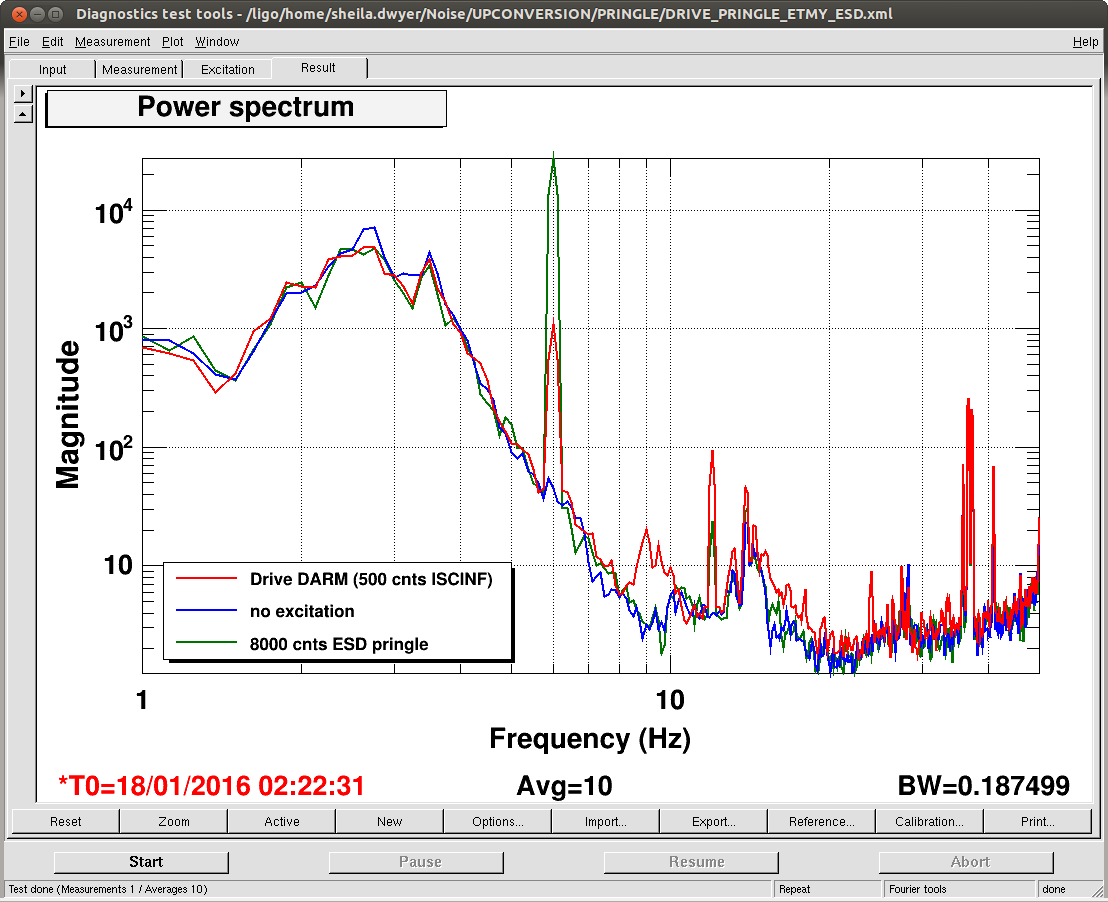
Third attachment: Same for EMTY ESD. We would expect to have some quadratic term to the ESD actuation since we don't use the linearization for ETMY, and you can see that even in the green trace where pringle is driven. However, this quadratic term is clearly much smaller than the one that causes the second harmonic when we drive DARM.
There is a script to help set these measurements up, in /sheila.dwyer/Noise/UPCONVERSION/PRINGLE_SETUP.py
It seems like the next thing to check is the sensors, for which we would like to transition DARM control to a true differential arm.