thomas.shaffer@LIGO.ORG - posted 05:44, Saturday 31 October 2015 (23001)
Lockloss
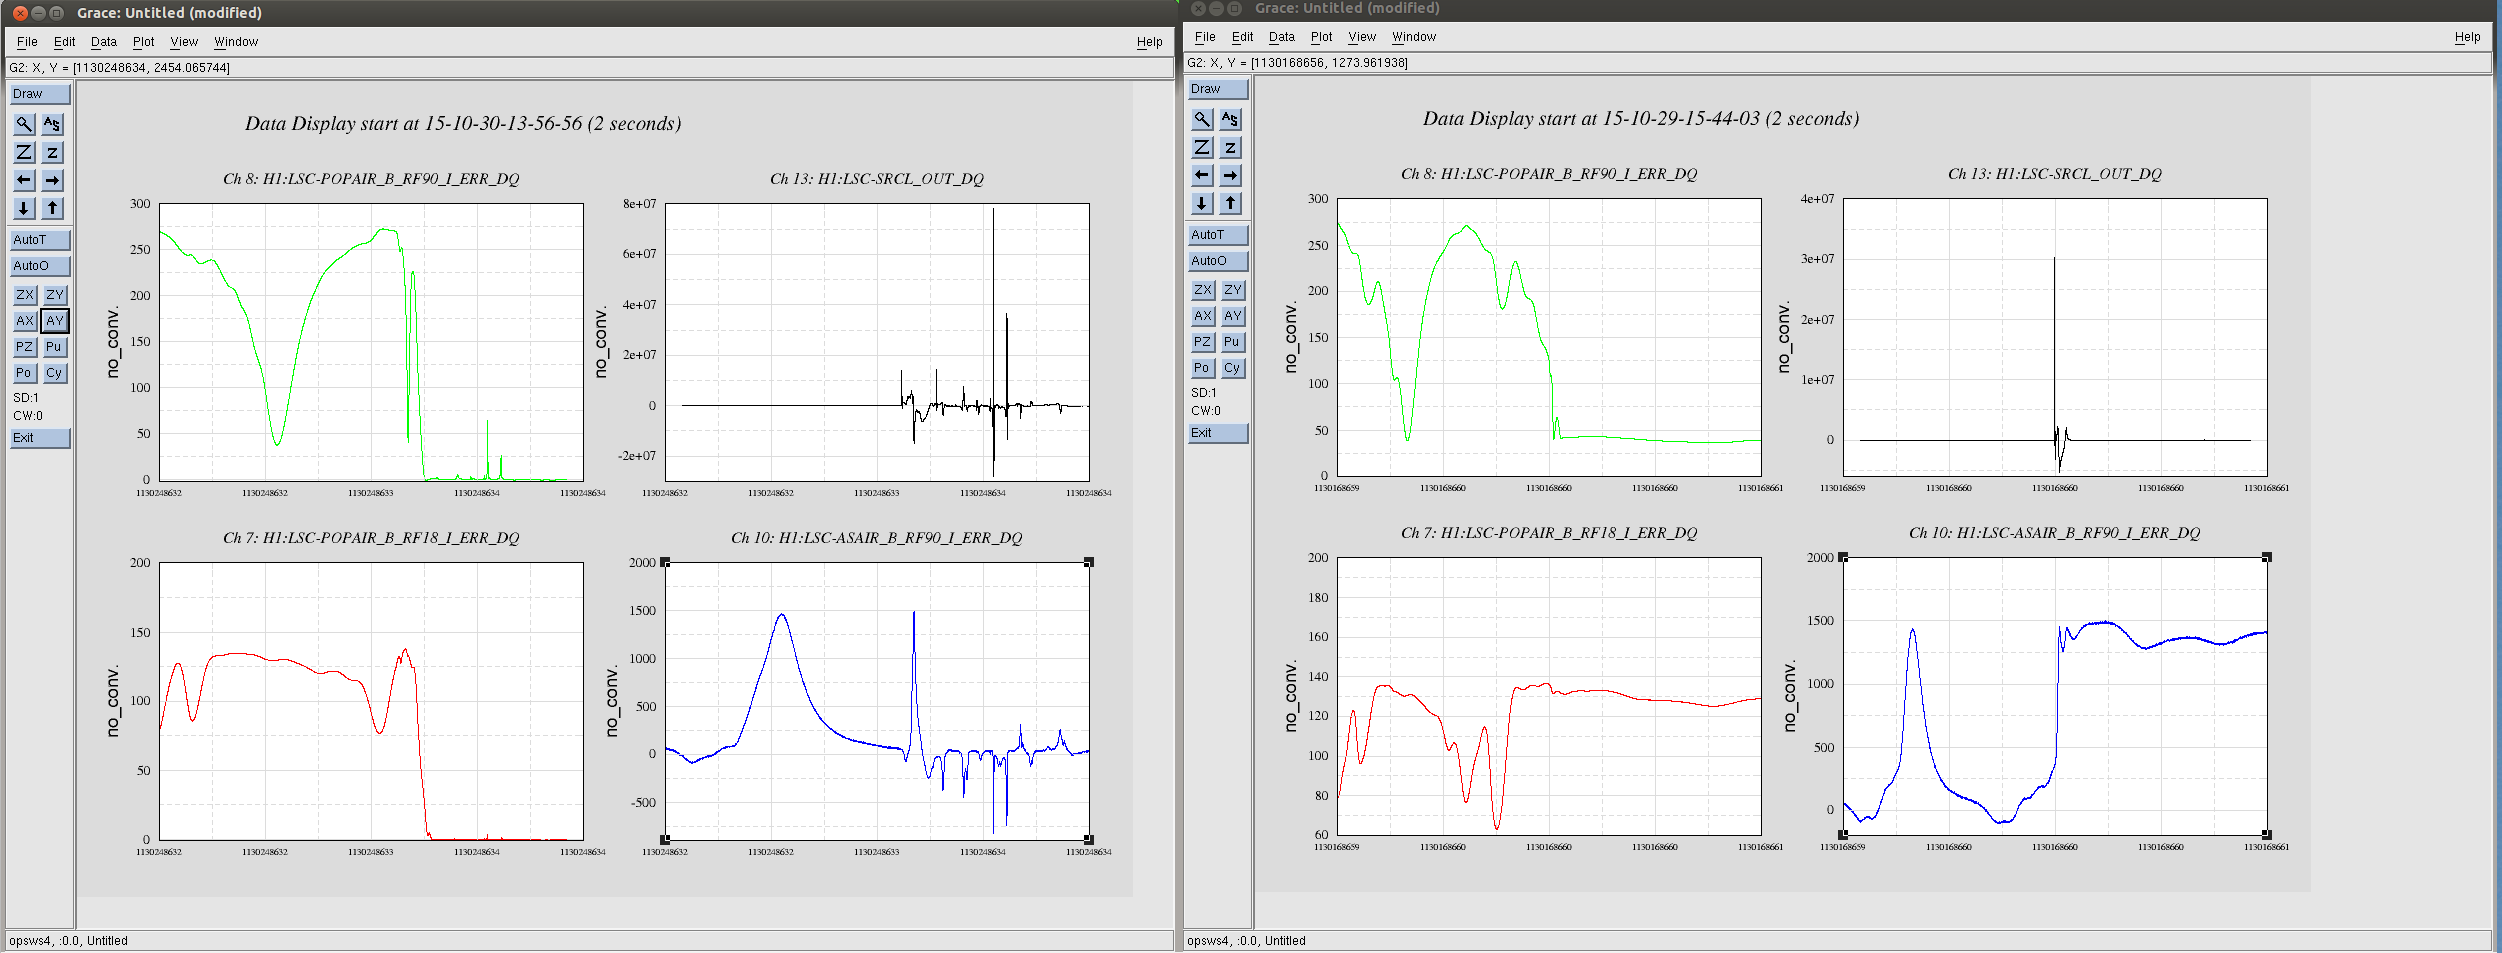
Lockloss at 12:41 UTC
Wind ~20mph, useism 0.4um/s. I will post plots momentarily.
Lockloss at 12:41 UTC
Wind ~20mph, useism 0.4um/s. I will post plots momentarily.
Observing @ 72Mpc
Environment:
For the Operator Thursday Maintenance item that was tmissed this week, I topped off the chiller with 150mL.
Title: 10/30 Eve Shift 23:00-7:00 UTC (16:00-24:00 PST). All times in UTC.
State of H1: Observing
Shift Summary: After the wind calmed to a reasonable level a few hours into my shift, I began a slow progression of locking. I got to do a few things that were new to me, such as being involved in restarting a (really) frozen guardian node, and engaging the ISS 2nd loop manually. Locking in Observing after engaging 45 mHz blends. Microseism coming up slowly. Winds calm, at last.
Incoming operator: TJ
Activity log:
0:07 Jeff K starting charge measurements
1:28 Jeff K done
1:52 HAM 1 HEPI restored after Hugh's measurements finished
1:53 Start locking
2:30 Adjusted ISS ref. signal after diffracted power low notification
3:01 Jeff K attempts restart of PRM guardian node
4:45 Start initial alignment after many unsuccessful locking attempts
5:15 PRMI to DRMI transition unsuccessful
5:51 GRB alert
6:00 45 mHz blends turned on
6:26 manually engaged ISS 2nd loop after getting stuck
6:34 Observing
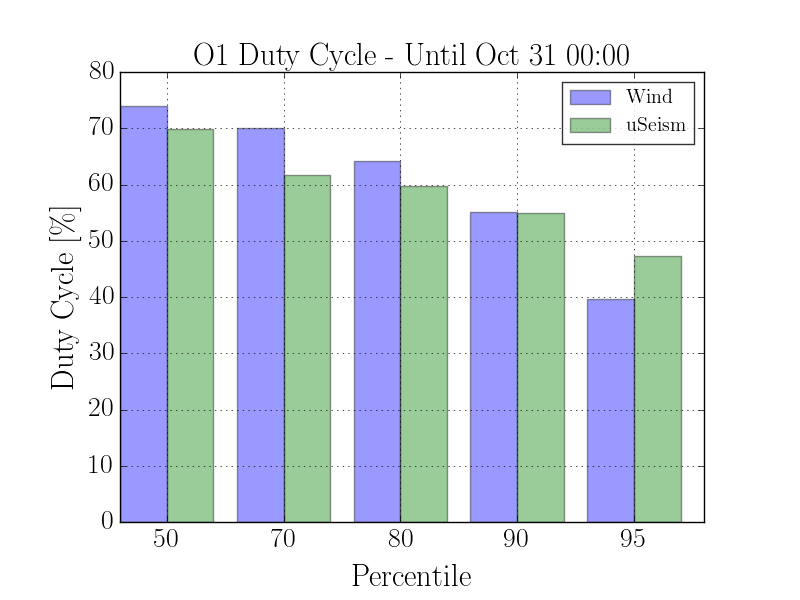
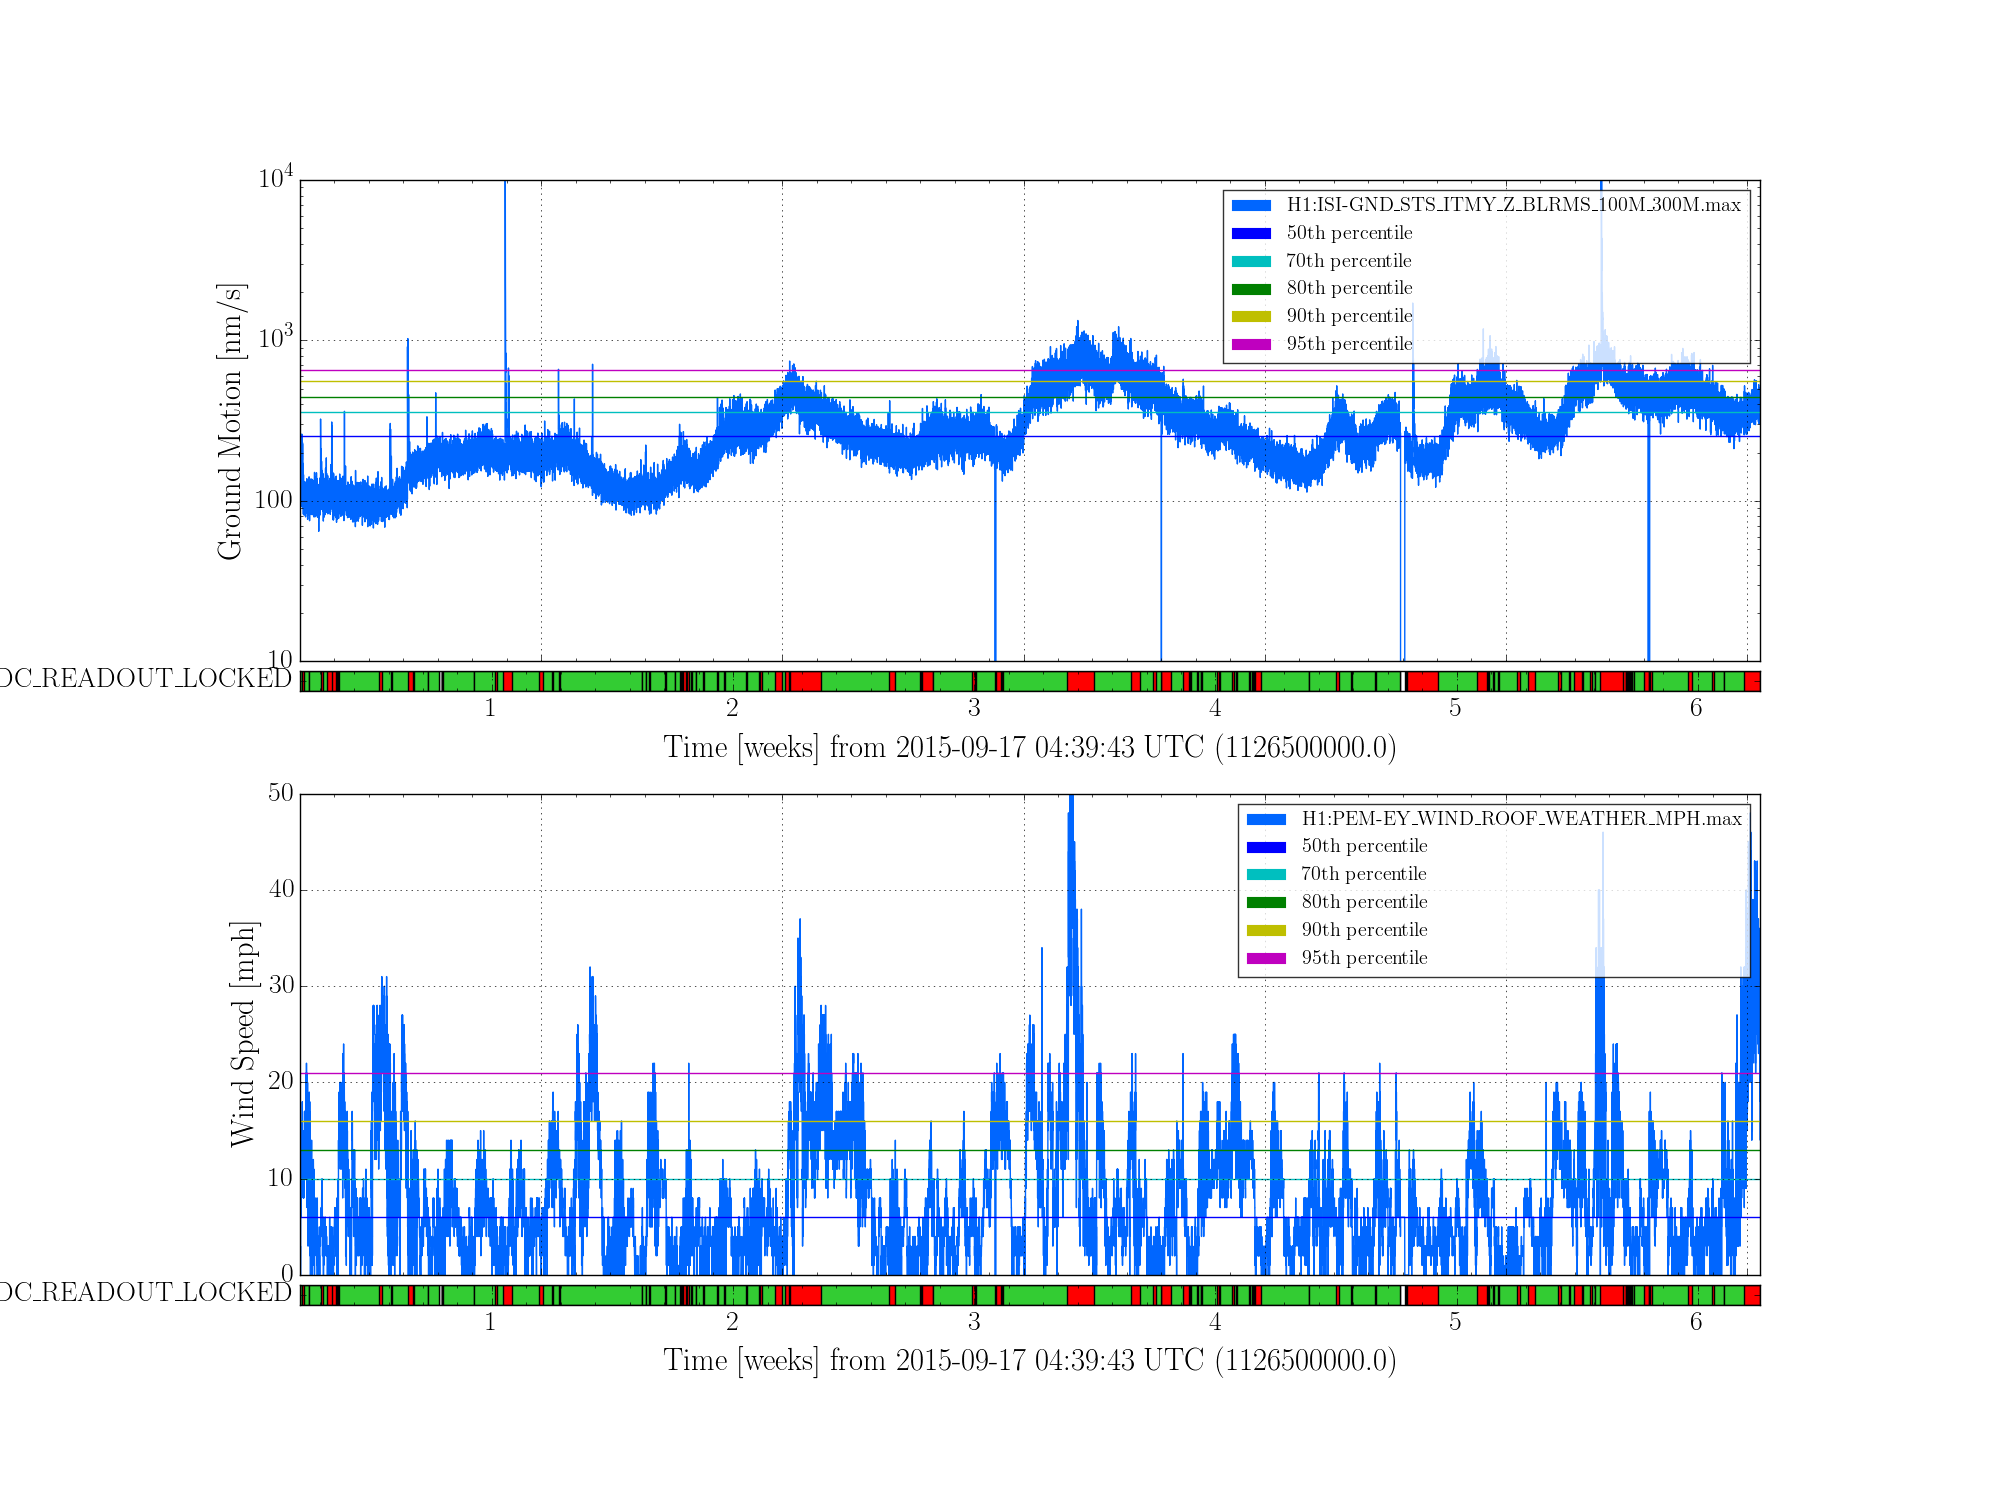
I made some plots to get a sense of how wind and microseism are affecting our duty cycle so far in O1. The first plot is a histogram of duty cycle vs percentiles of wind/microseism. The second plot is a timeseries that shows the microseism and wind plotted for all of O1 (until Oct 31 00:00 UTC) with the percentiles of each superimposed and locked segments along the bottom. All data are minute trend maximums. I used the flag H1:DMT-DC_READOUT_LOCKED for the locked state.
Comparing with long term wind / microseism statistics:
8-year wind study from Margarita: https://alog.ligo-wa.caltech.edu/aLOG/index.php?callRep=12996
Long term study of the seismic environment: P040015
Below I have included a table of actual values for each percentile. The 8 year study of wind has higher values (I inferred the 8-year percentiles from the first plot in Margarita's aLog). Note that the 8 year study used hourly max trend data as opposed to minute trends. Also, keep in mind Margarita's study has already shown that historically September / October are less windy then spring/summer months.
The long term microseism numbers (taken from fig. 5 of the paper) agree more closely with O1 results so far.
| Percentile | O1 Wind [MPH] | Eight Year Wind [MPH] | O1 Microseism [nm/s] | Long Term Microseism [nm/s] |
| 50 | 6 | 11 | 255 | 200 |
| 70 | 10 | 15 | 359 | 300 |
| 80 | 13 | 20 | 442 | 400 |
| 90 | 16 | 25 | 555 | 550 |
| 95 | 21 | 30 | 650 | 700 |
The code used to generate these plots is located here: https://ldas-jobs.ligo-wa.caltech.edu/~jordan.palamos/duty_cycle/
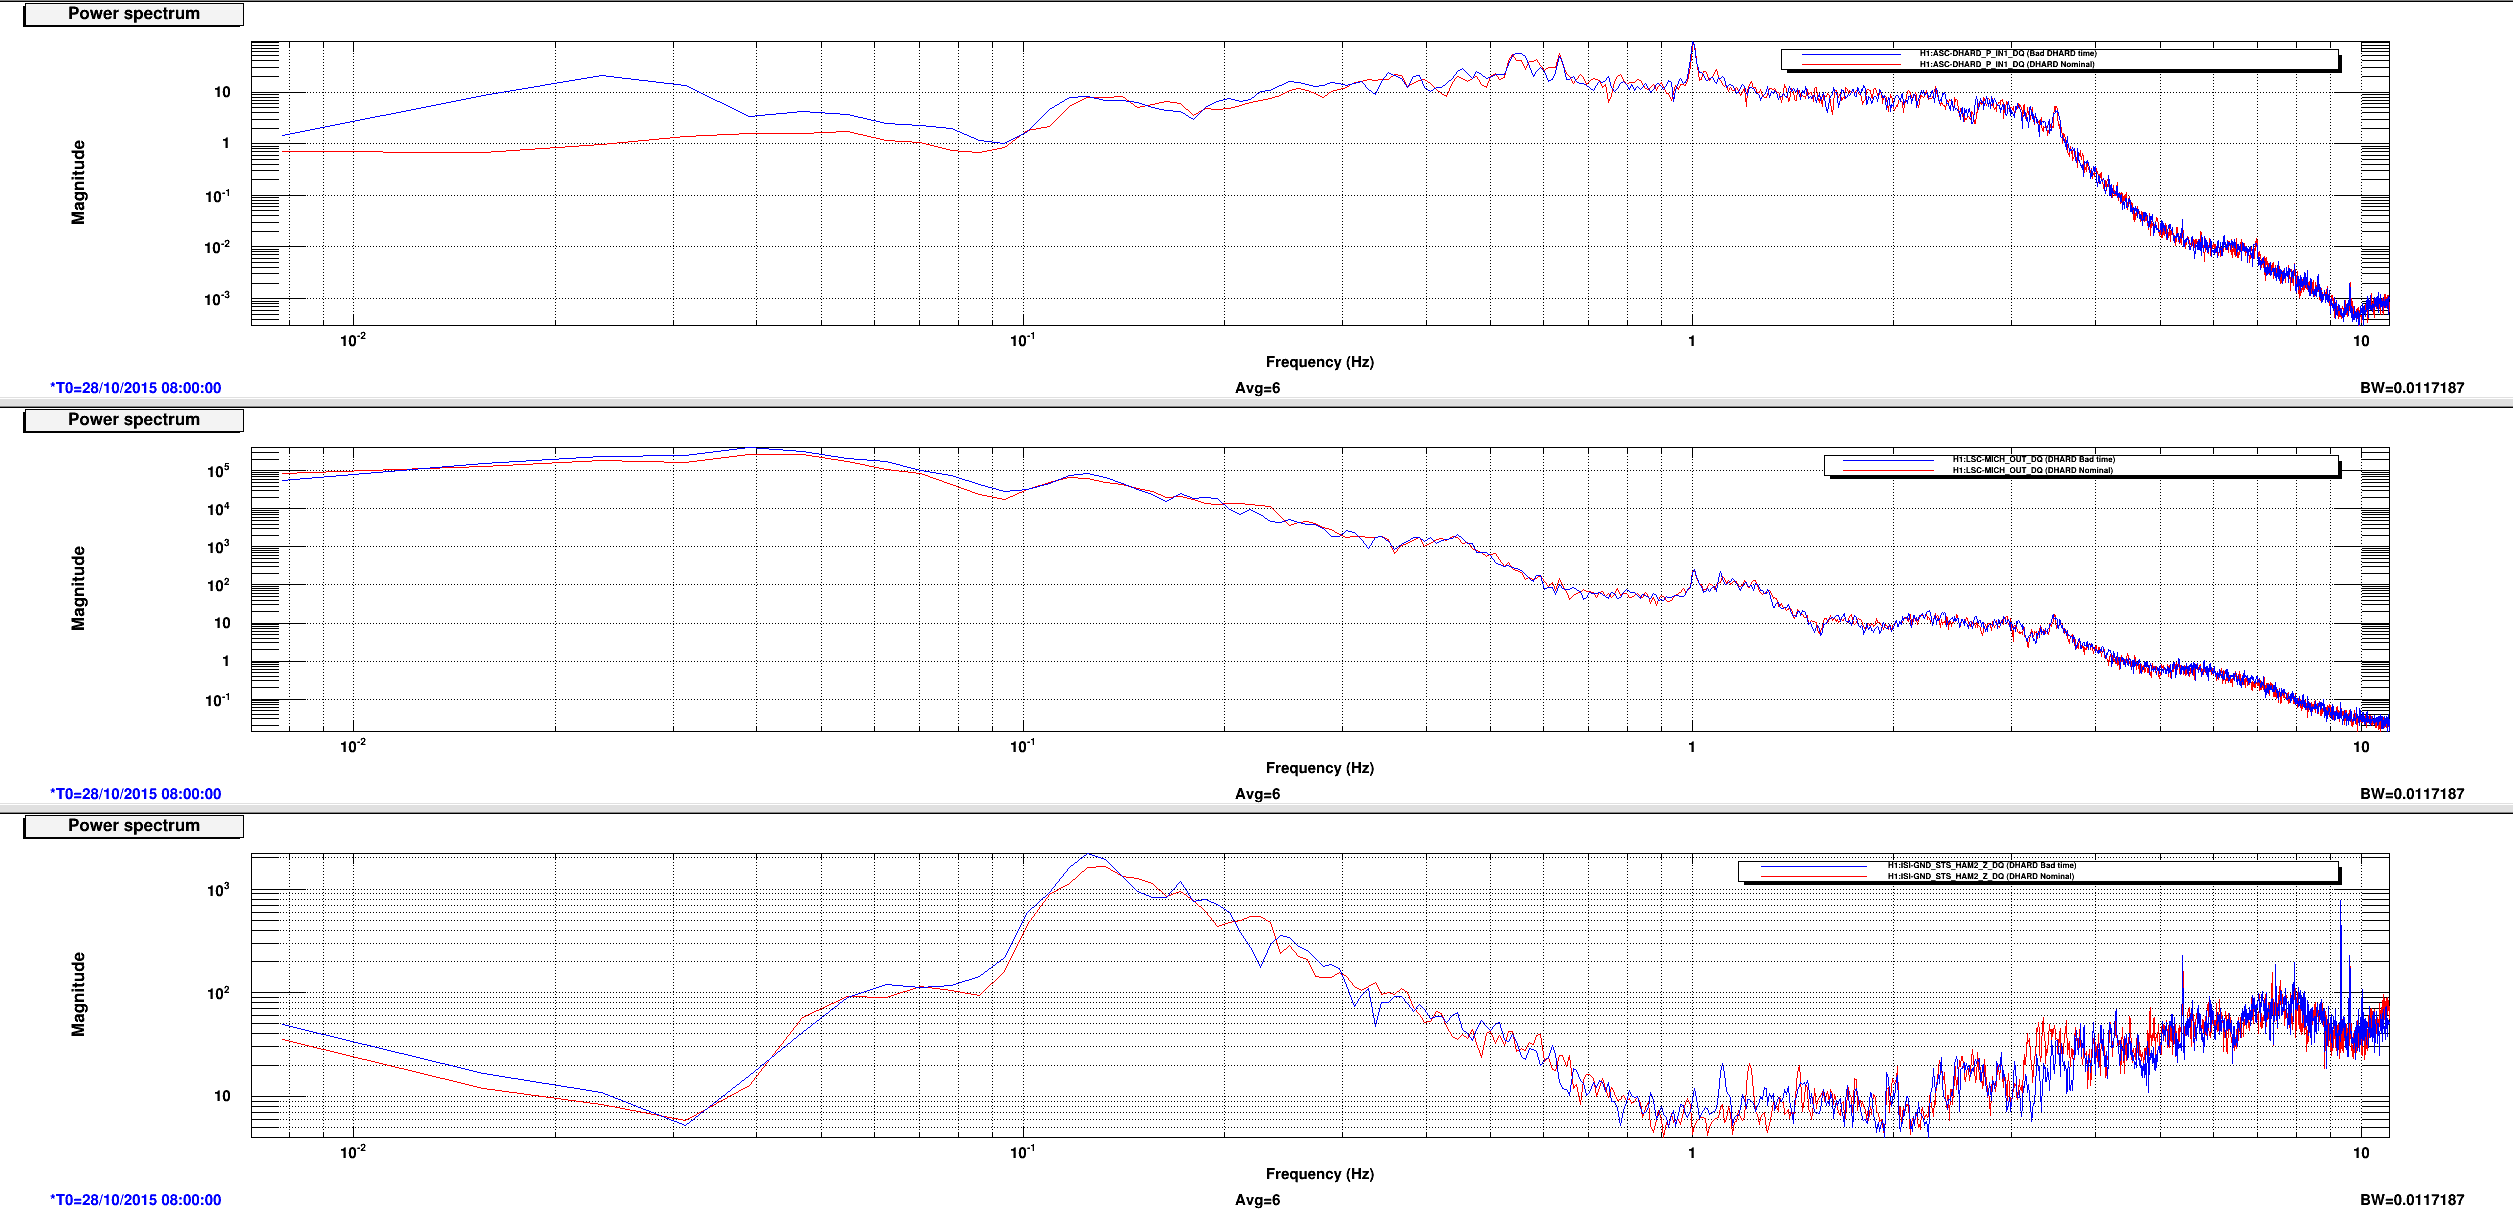
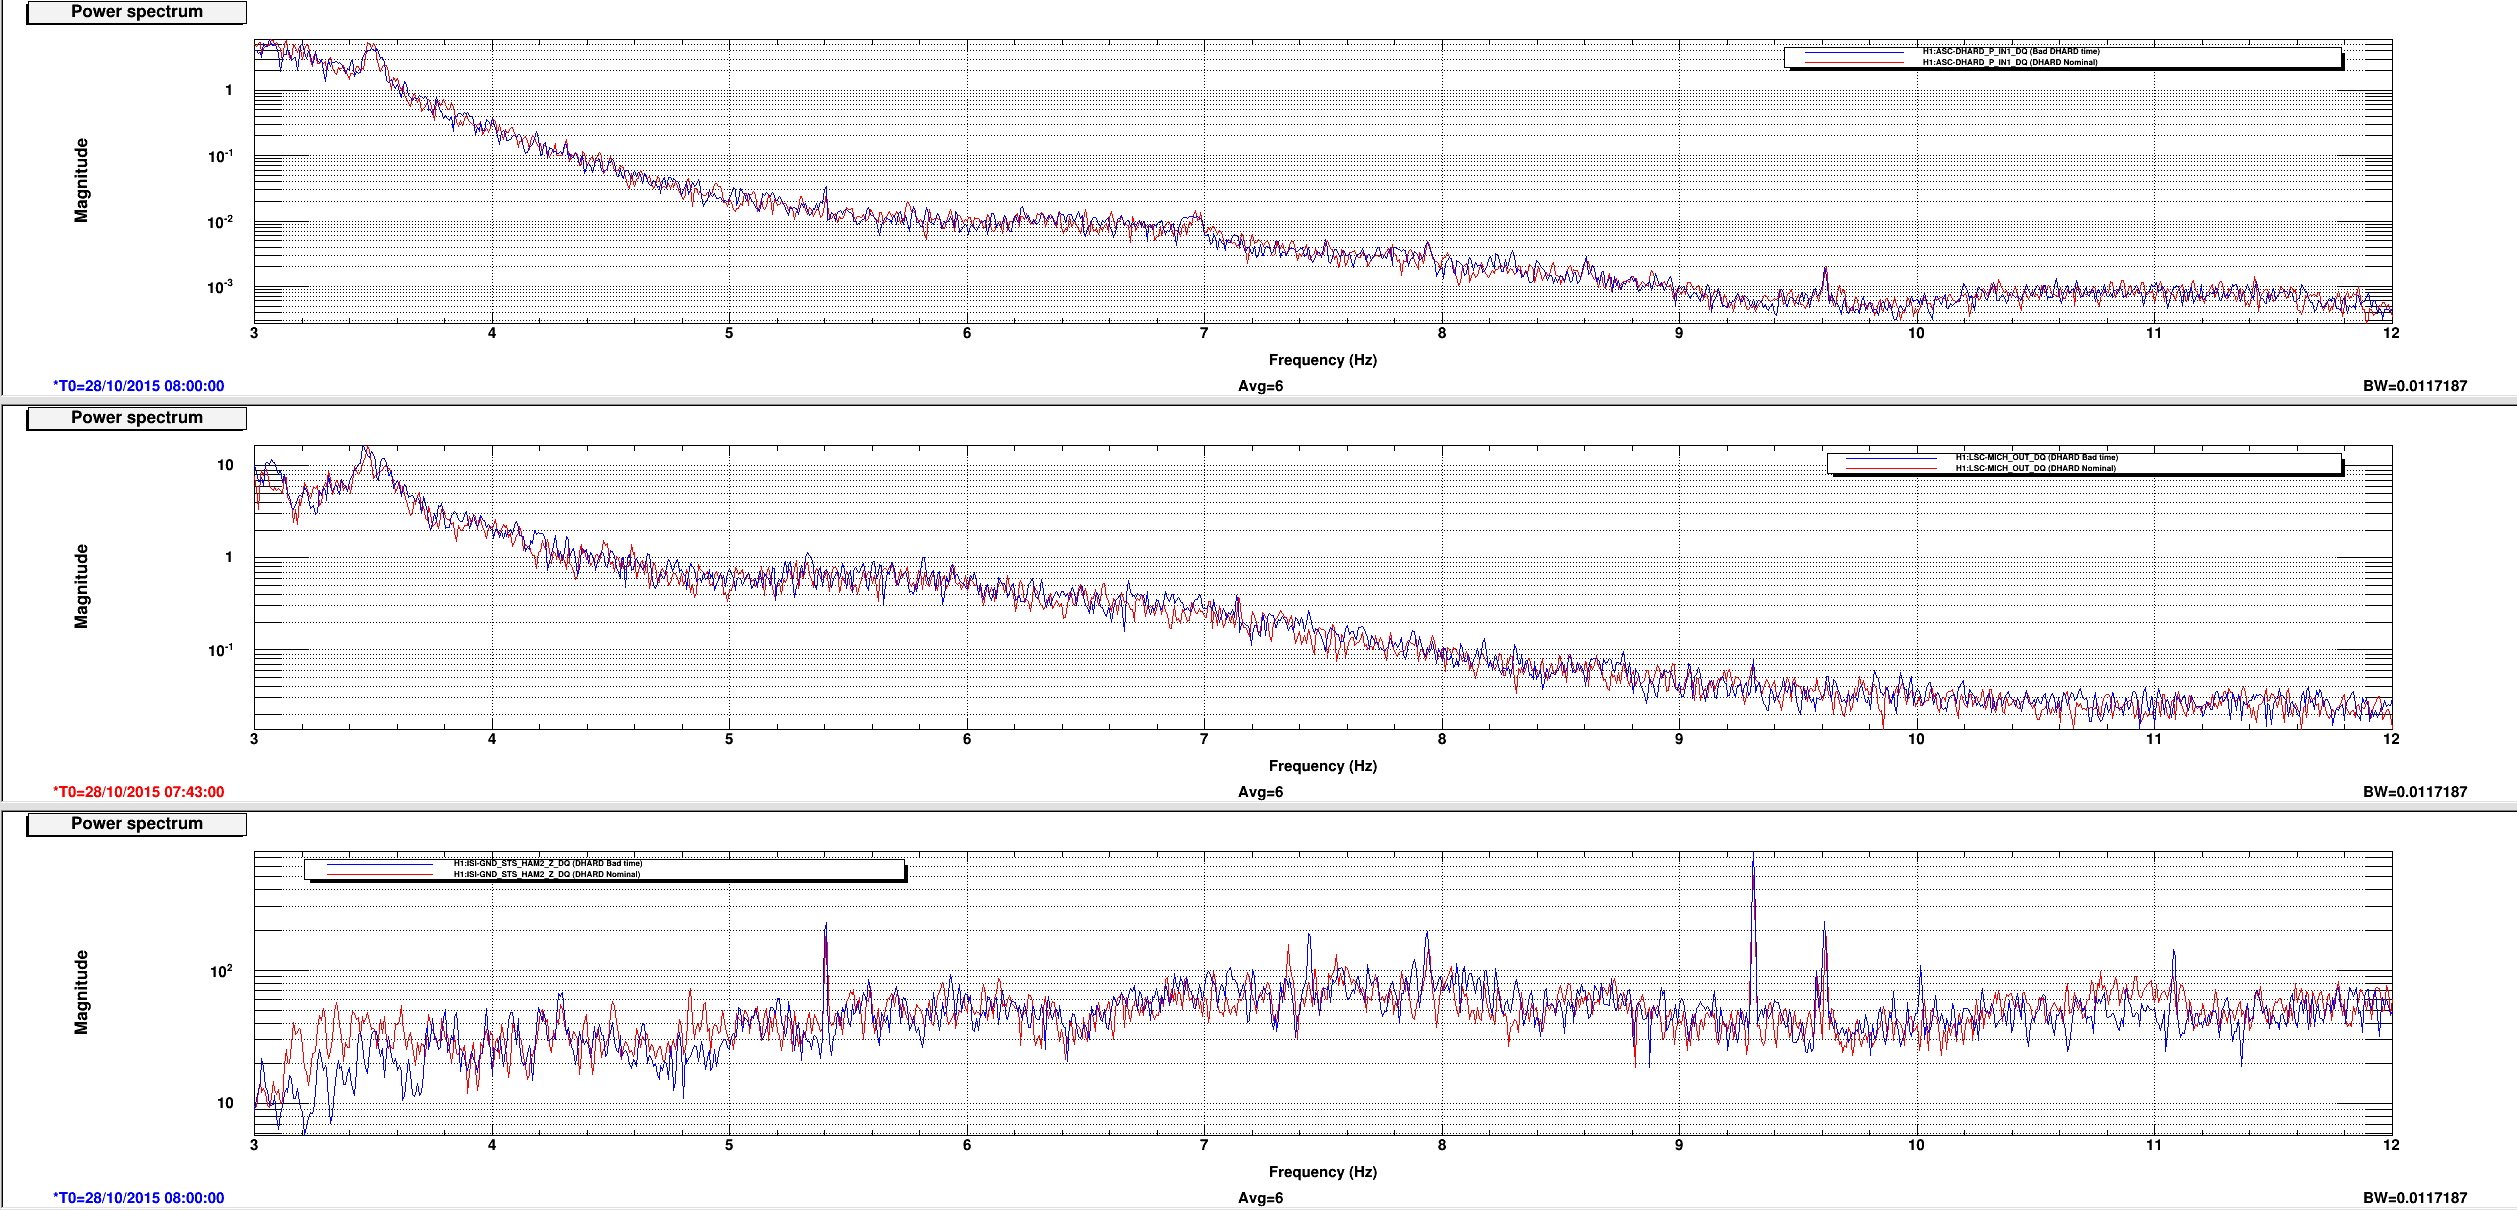
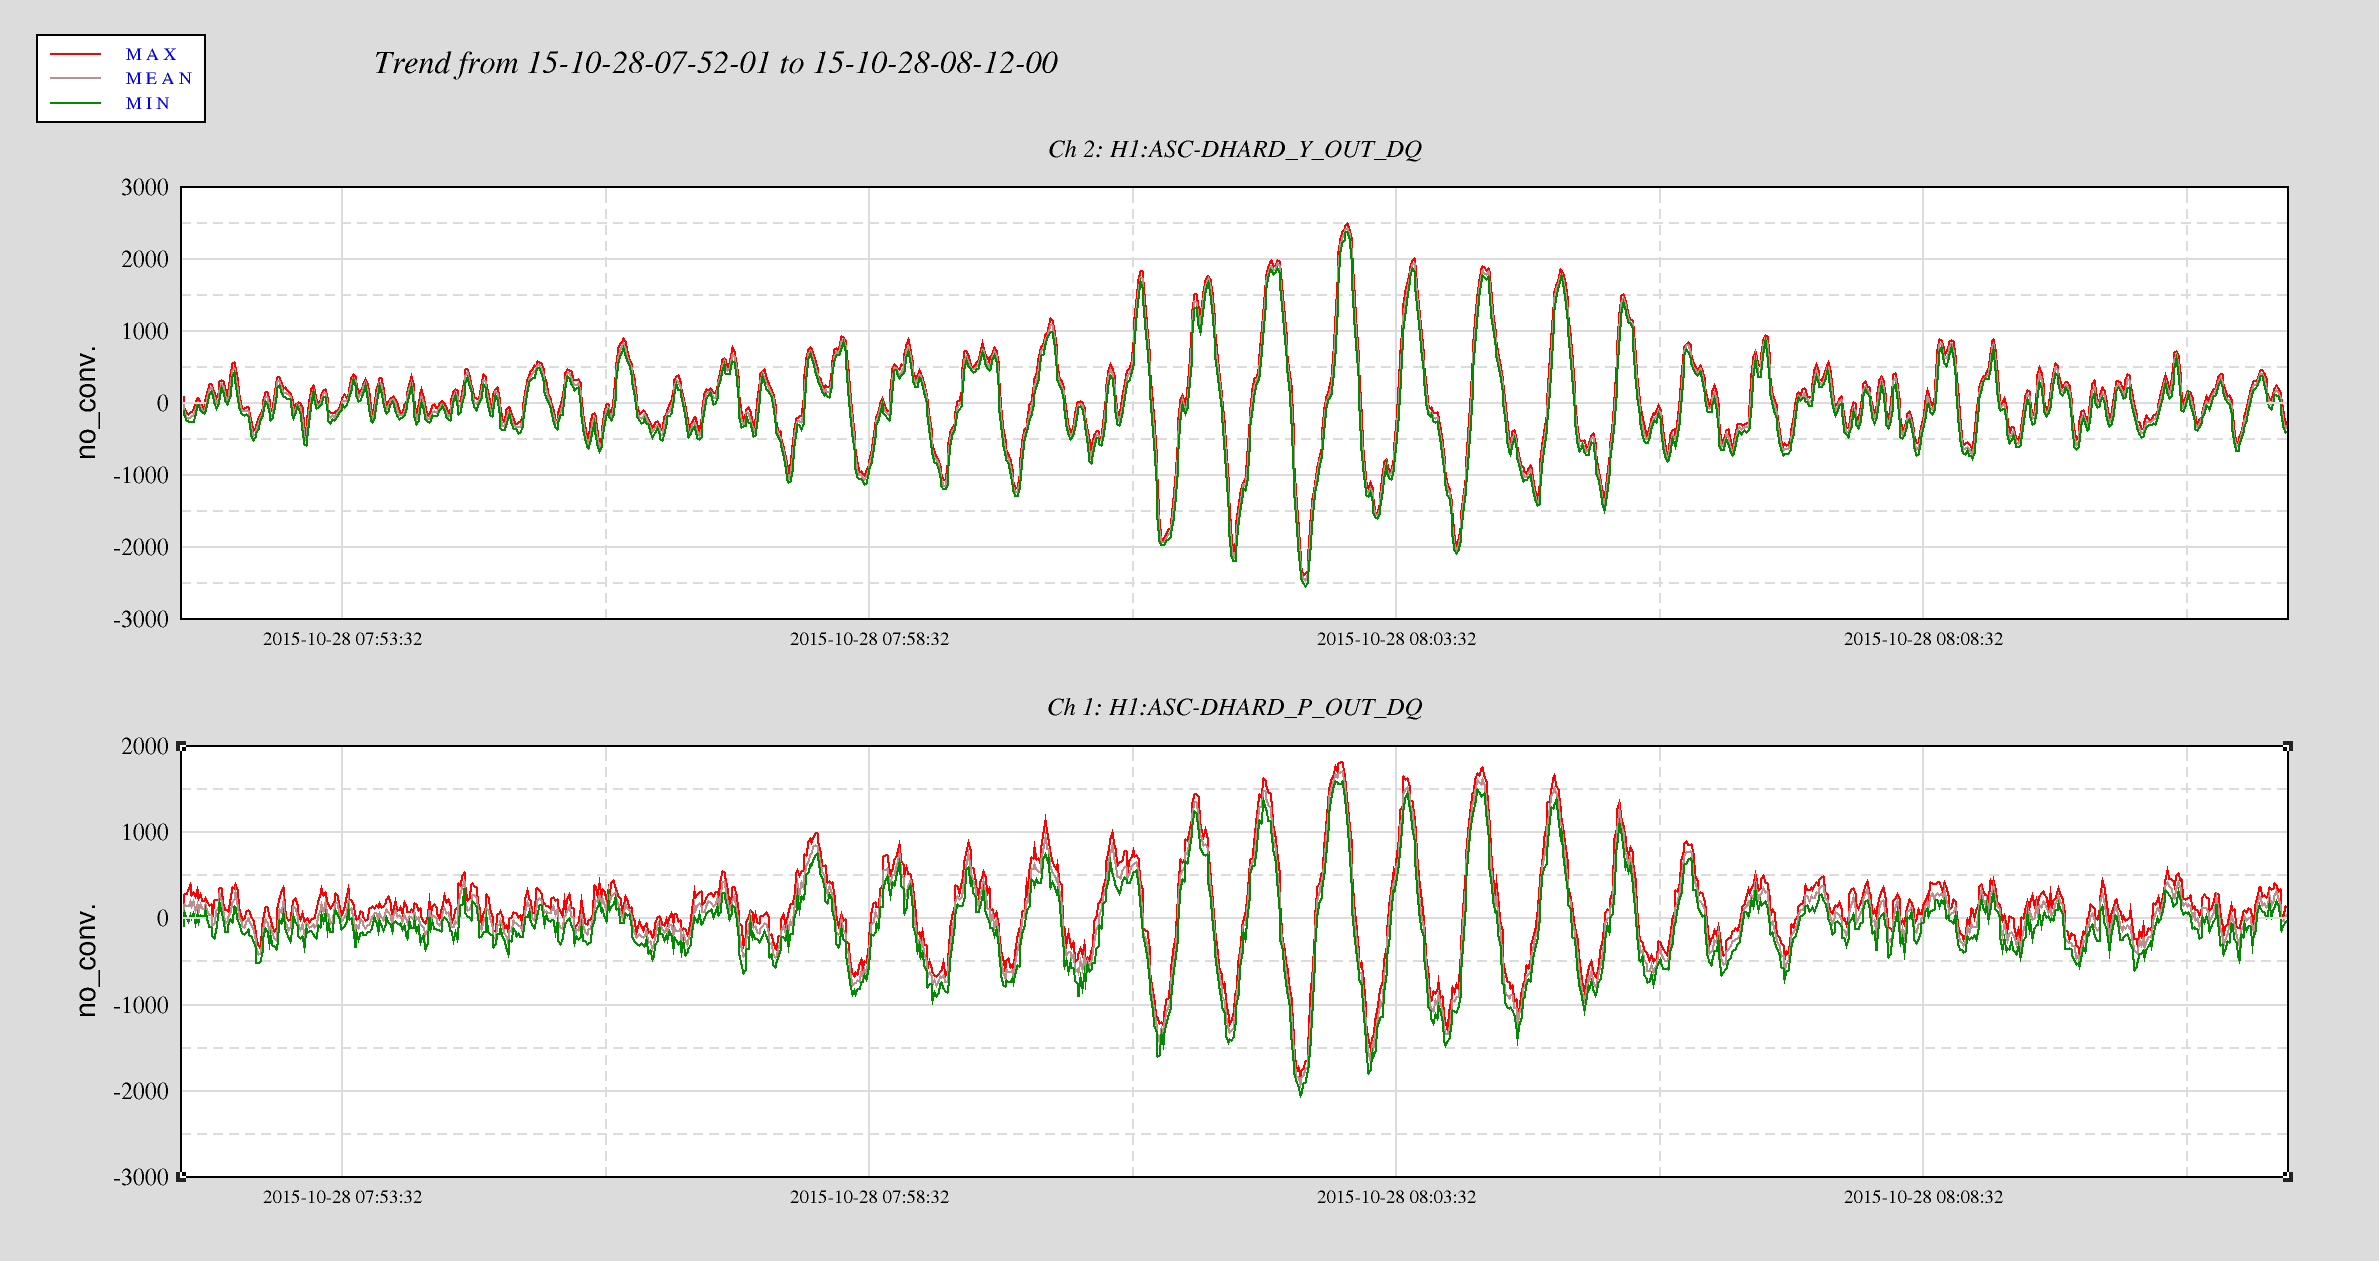
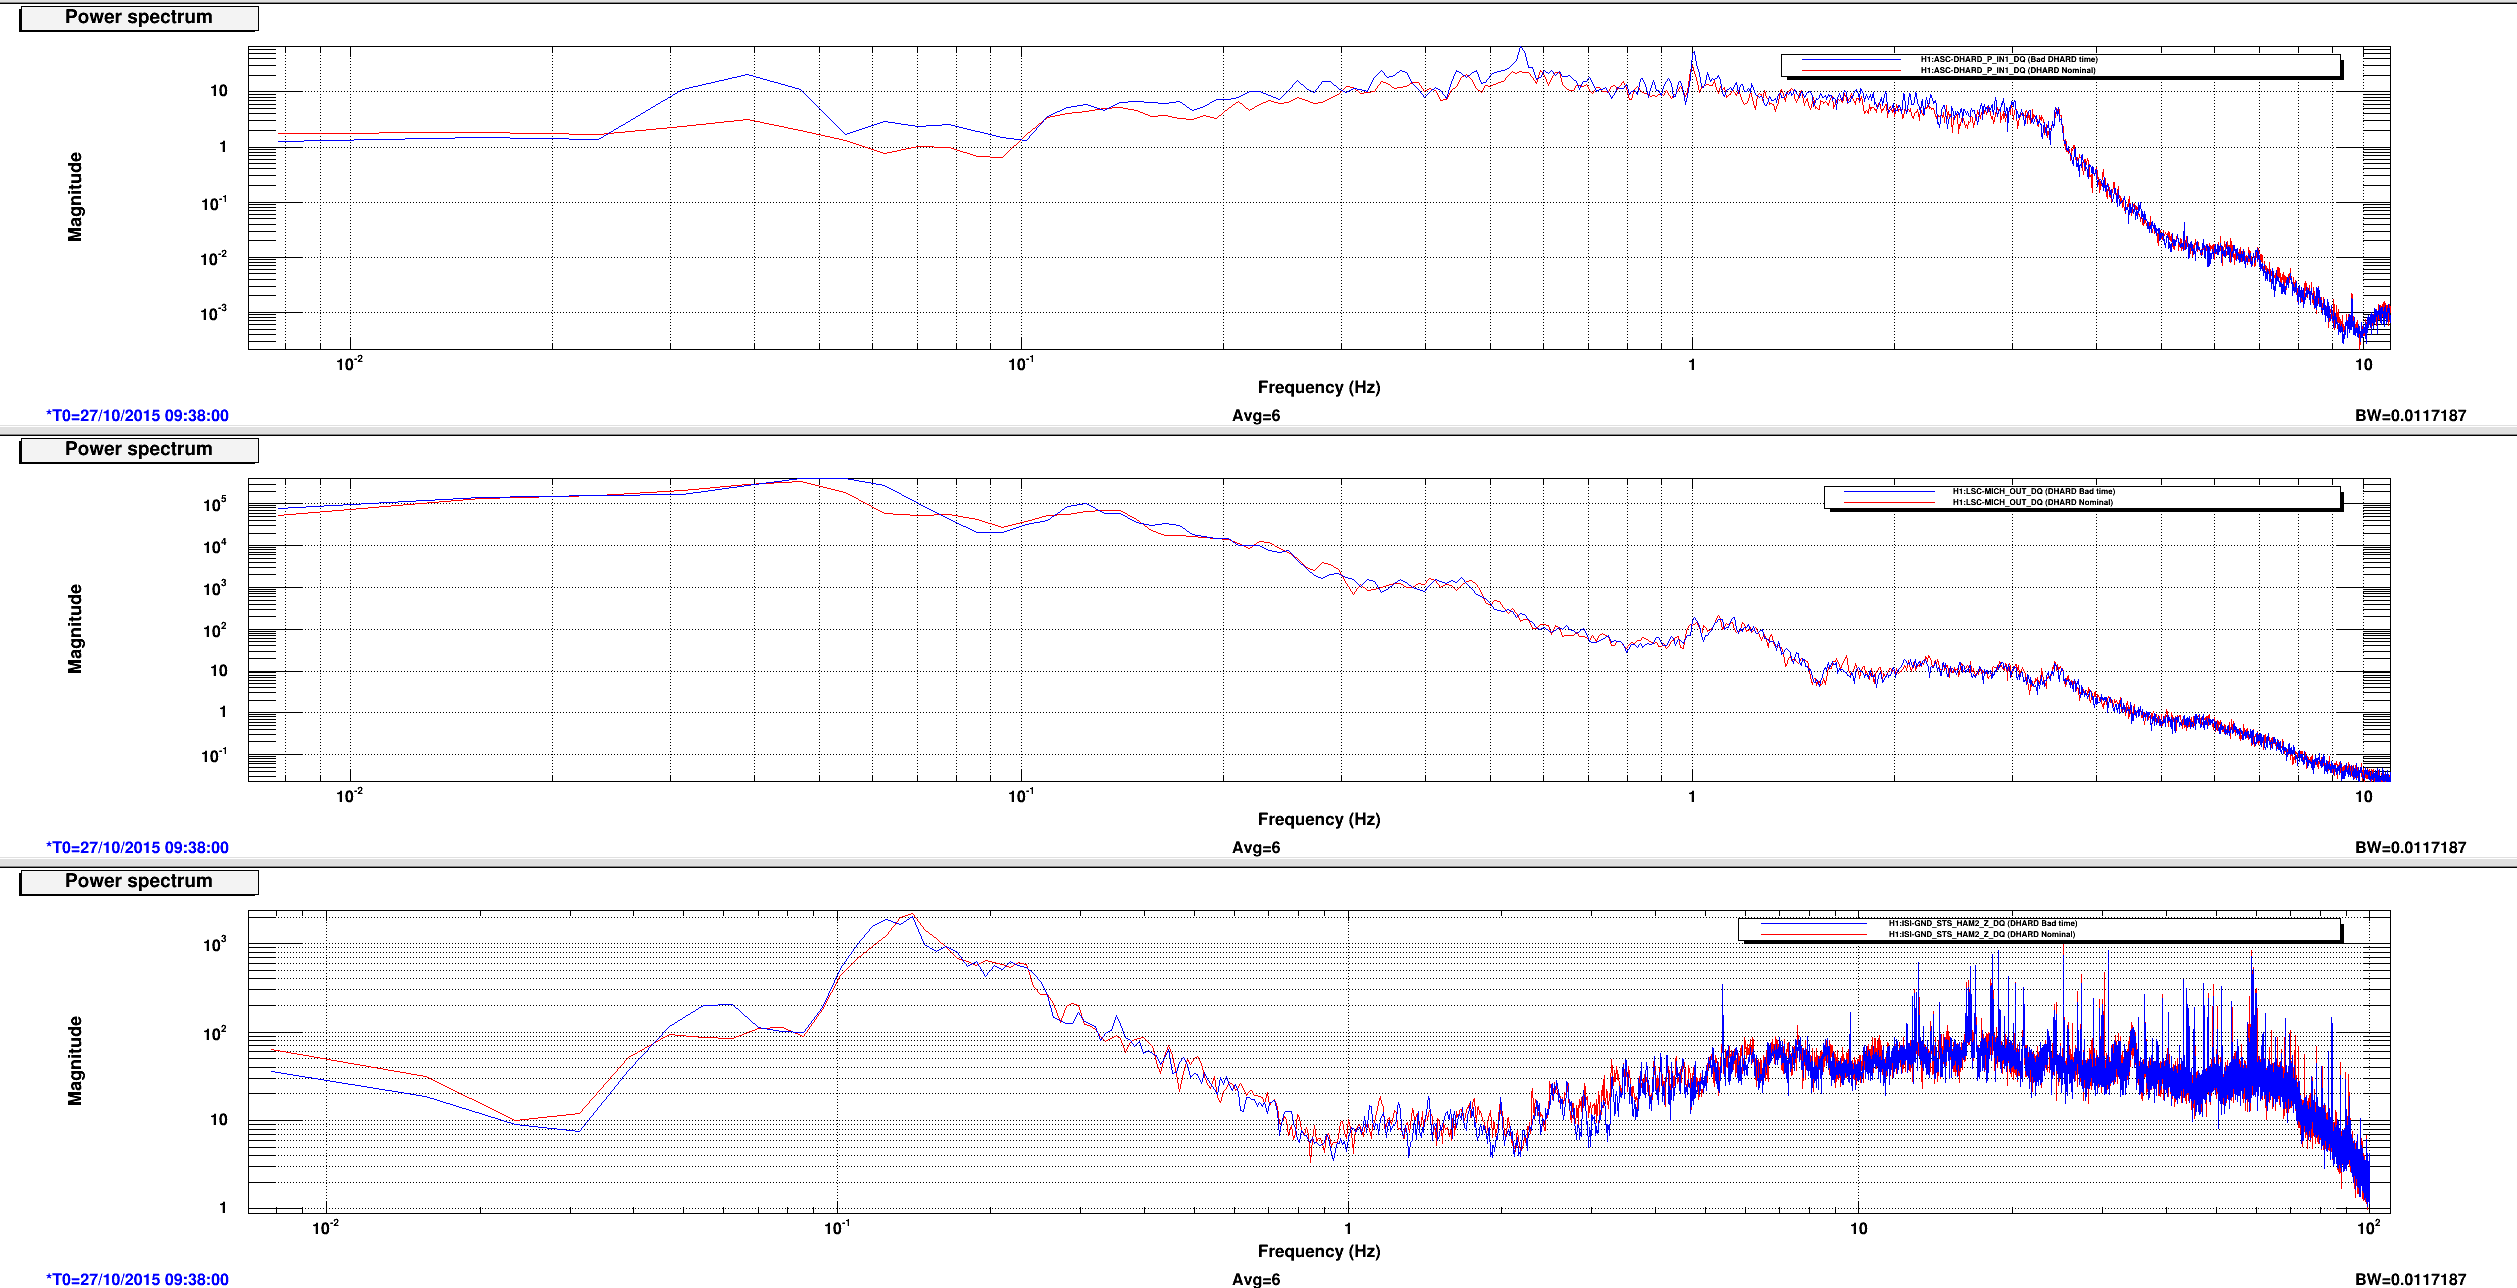
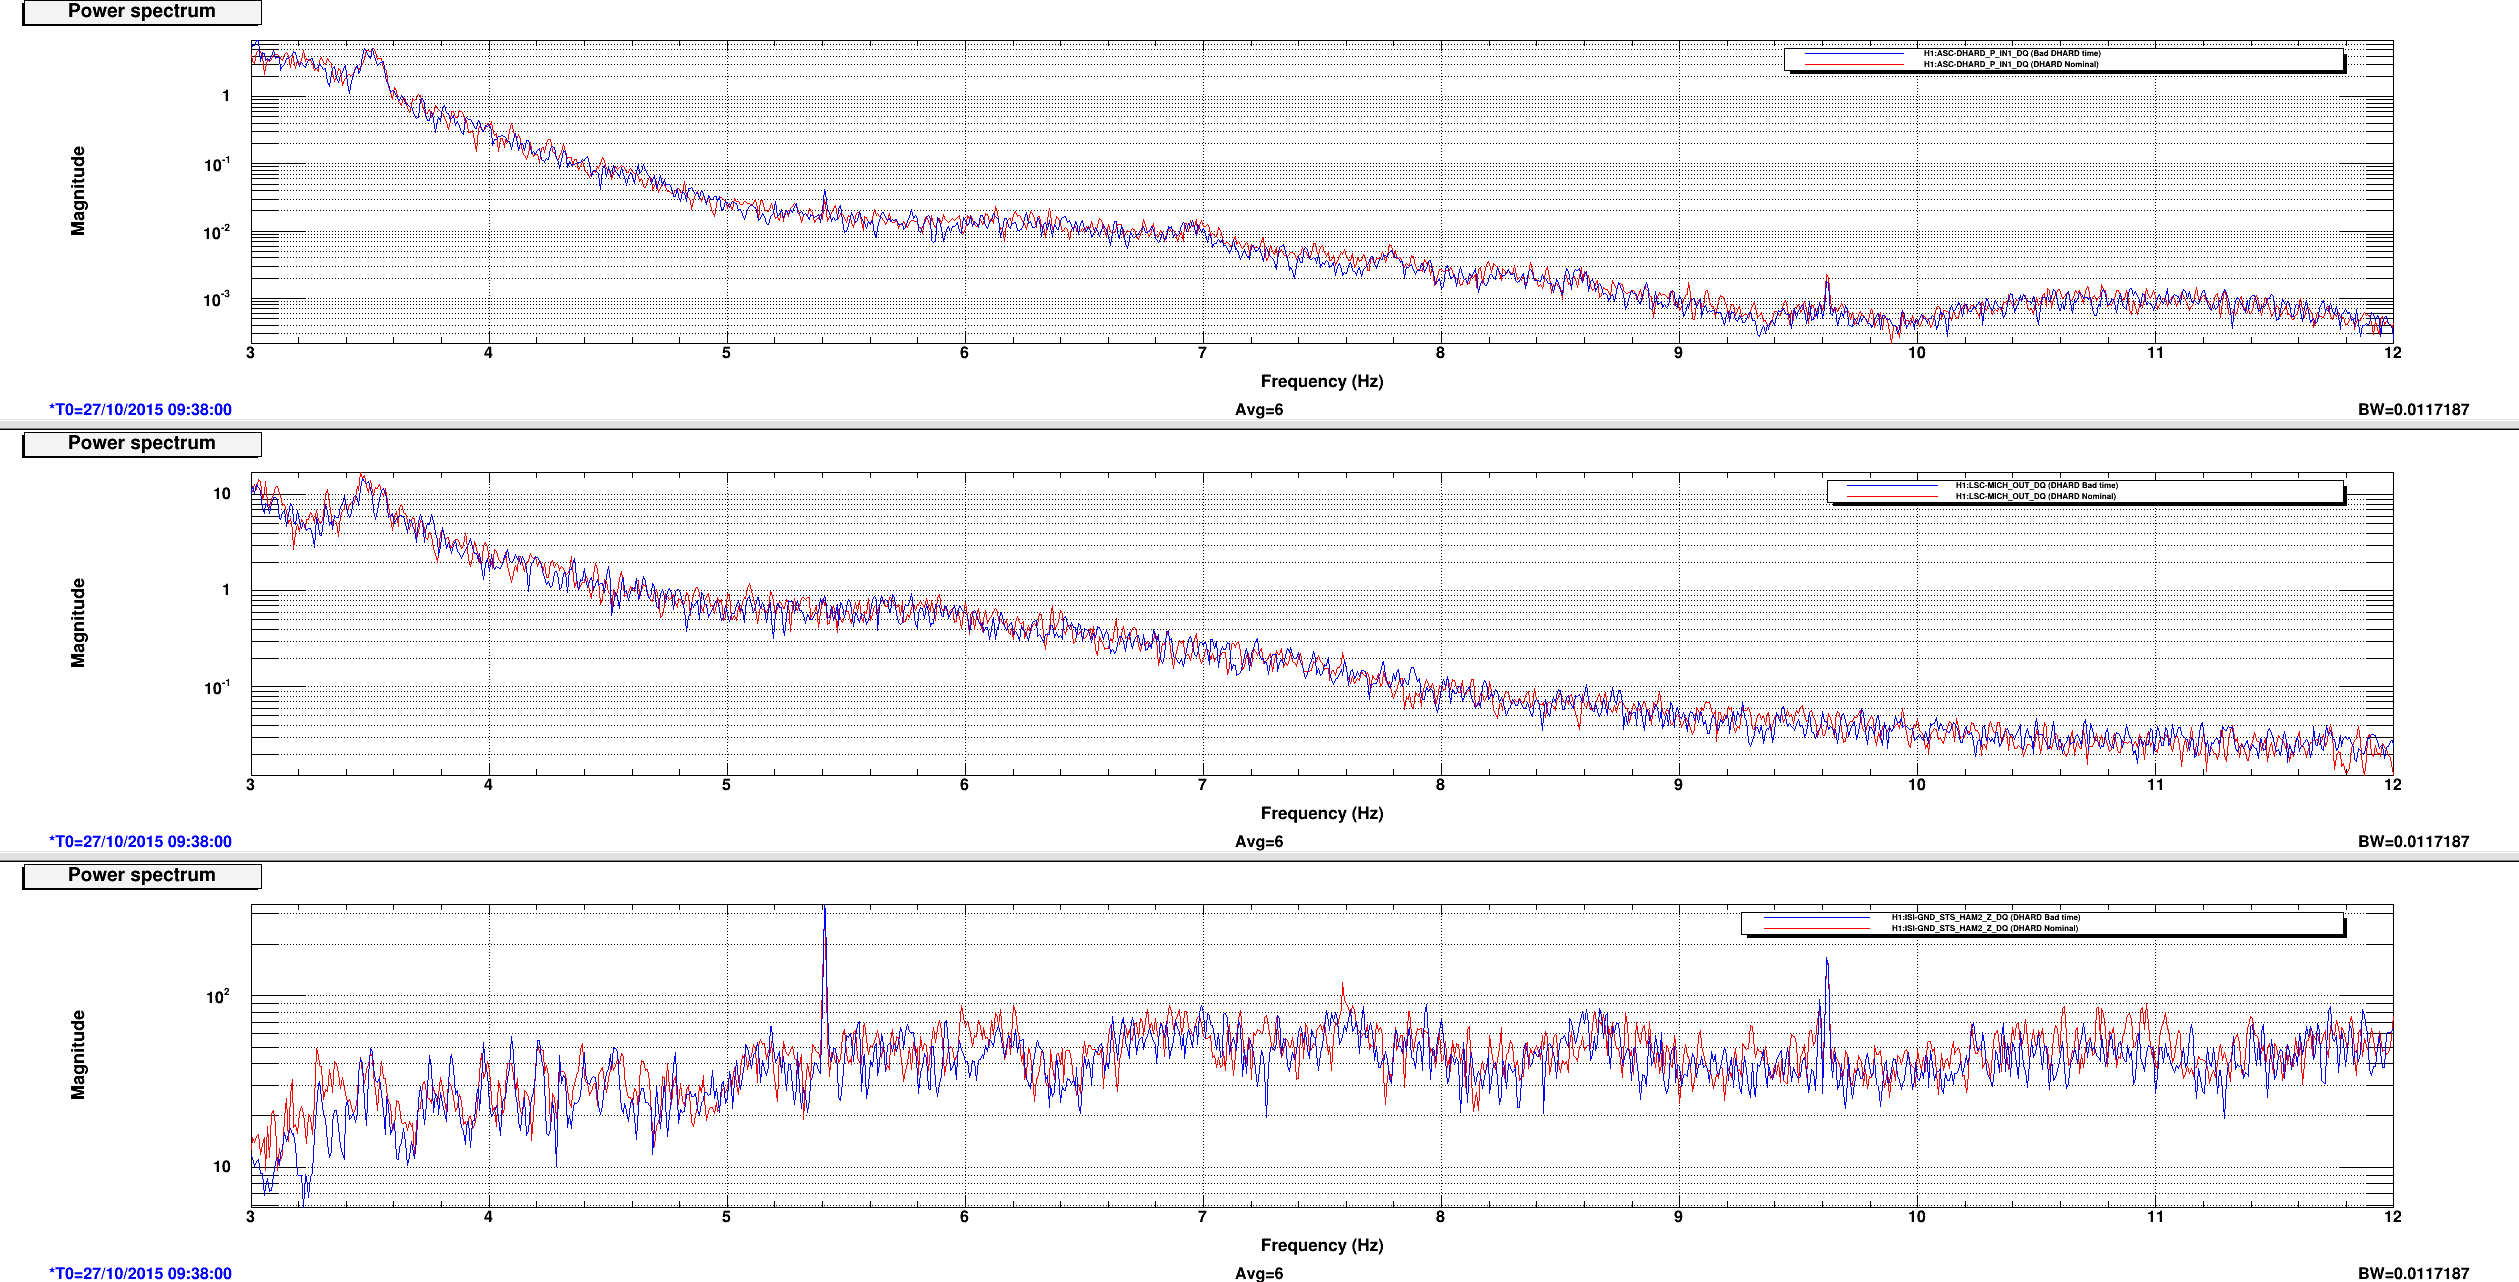
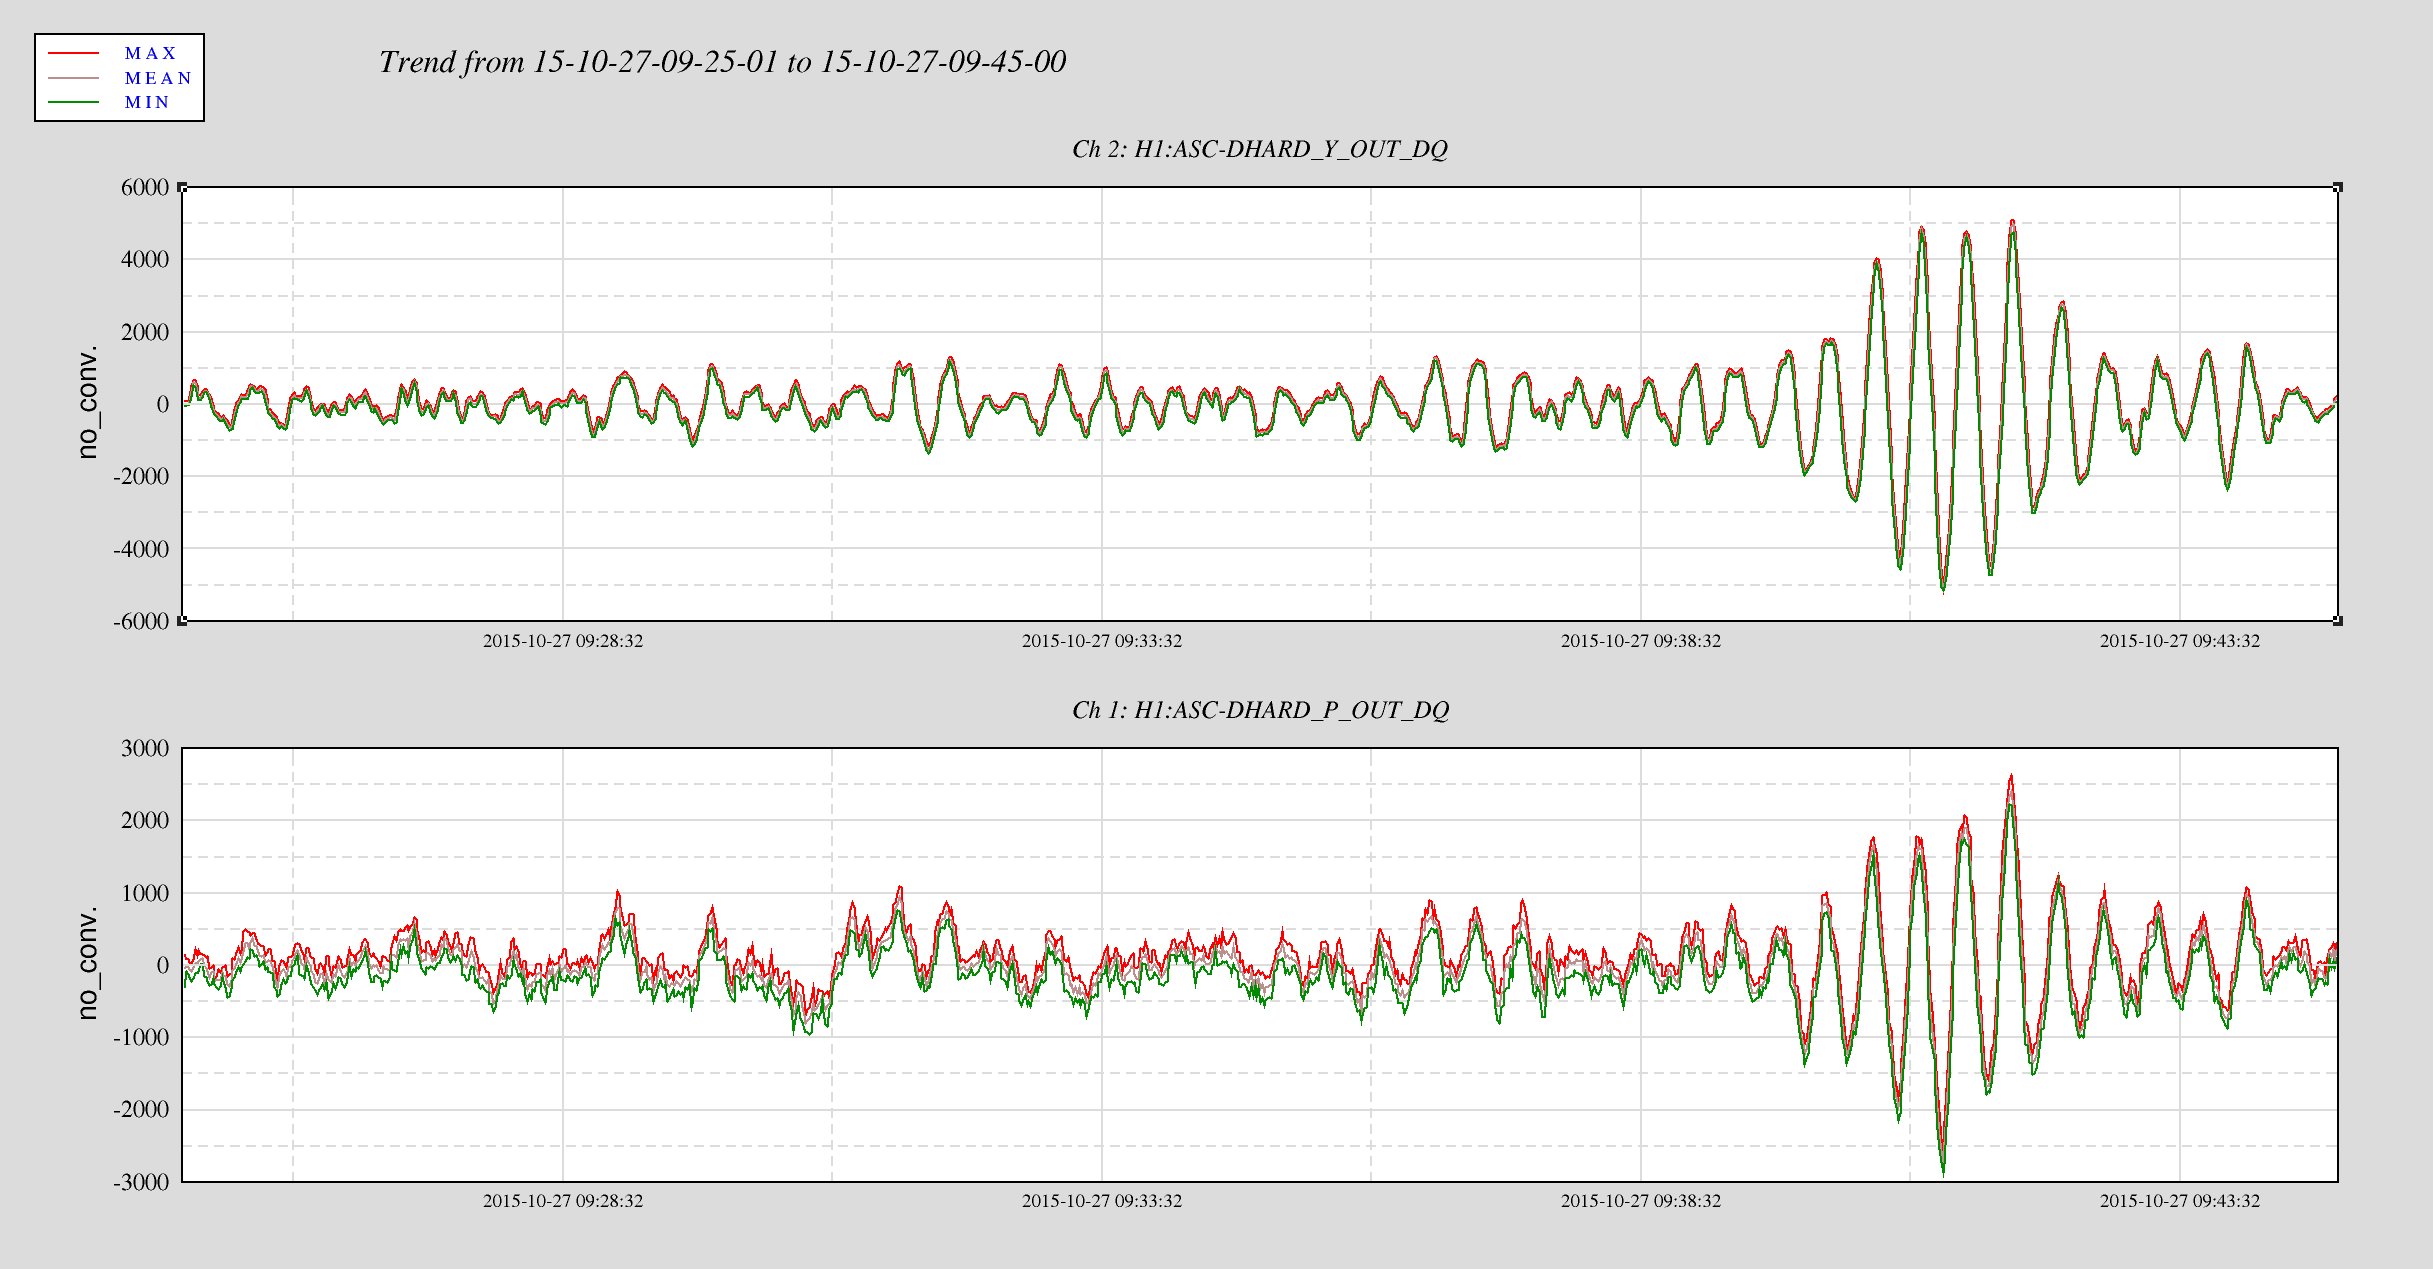
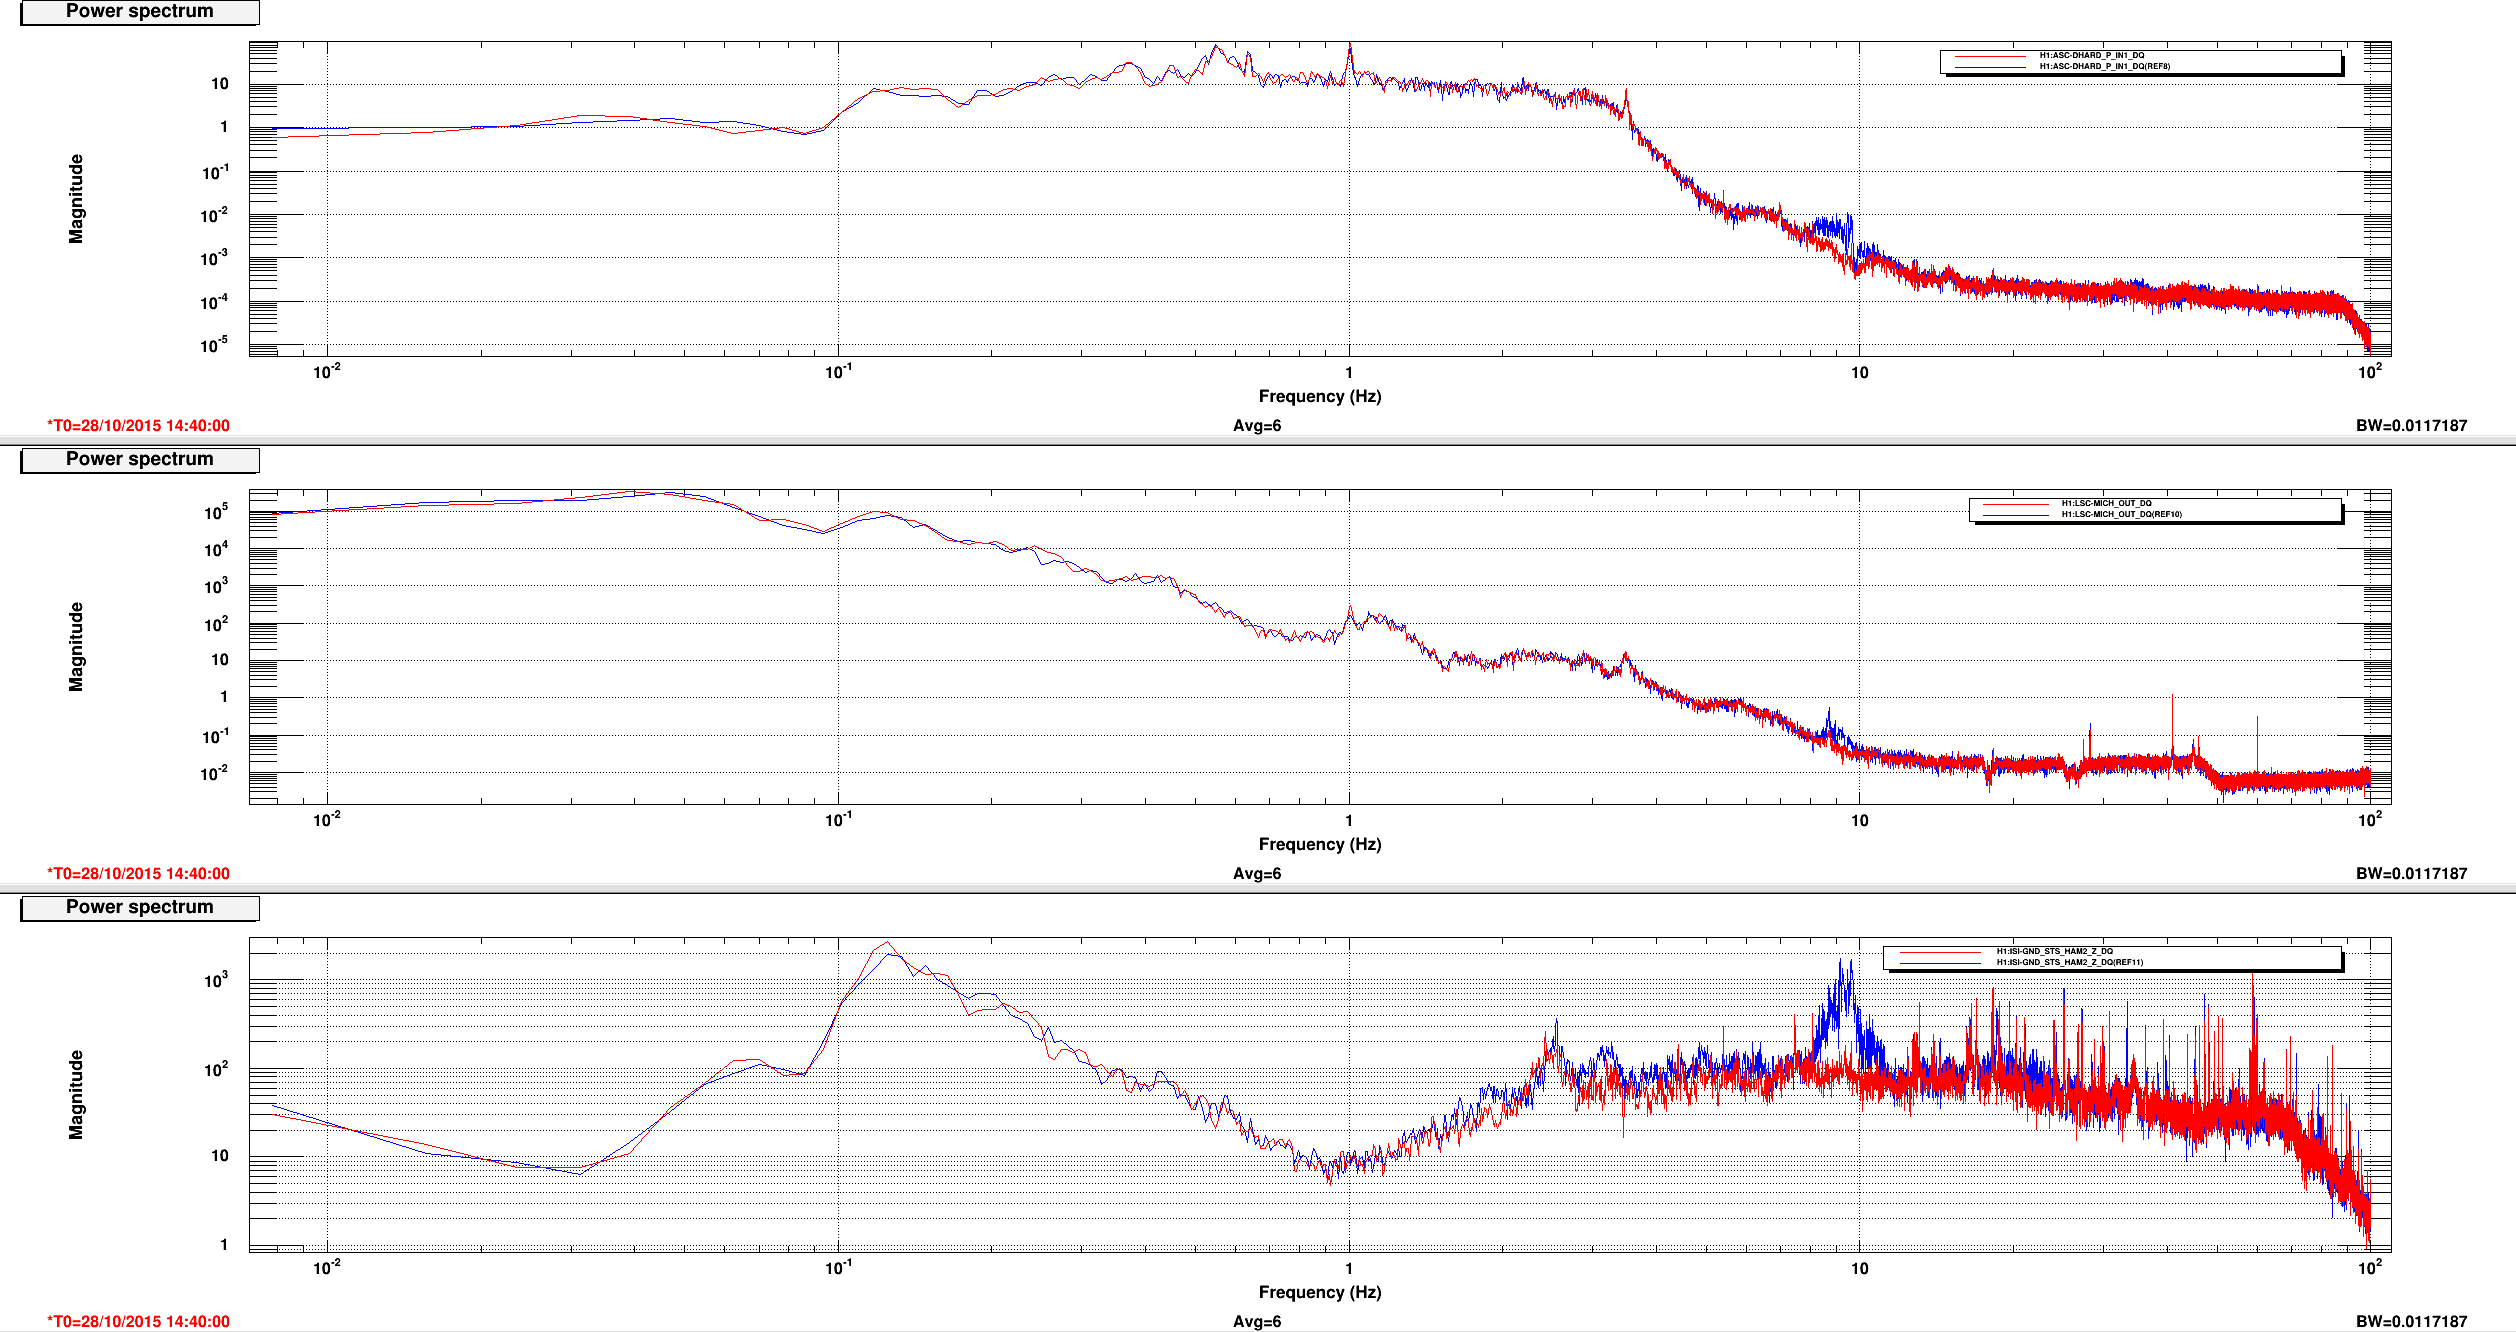
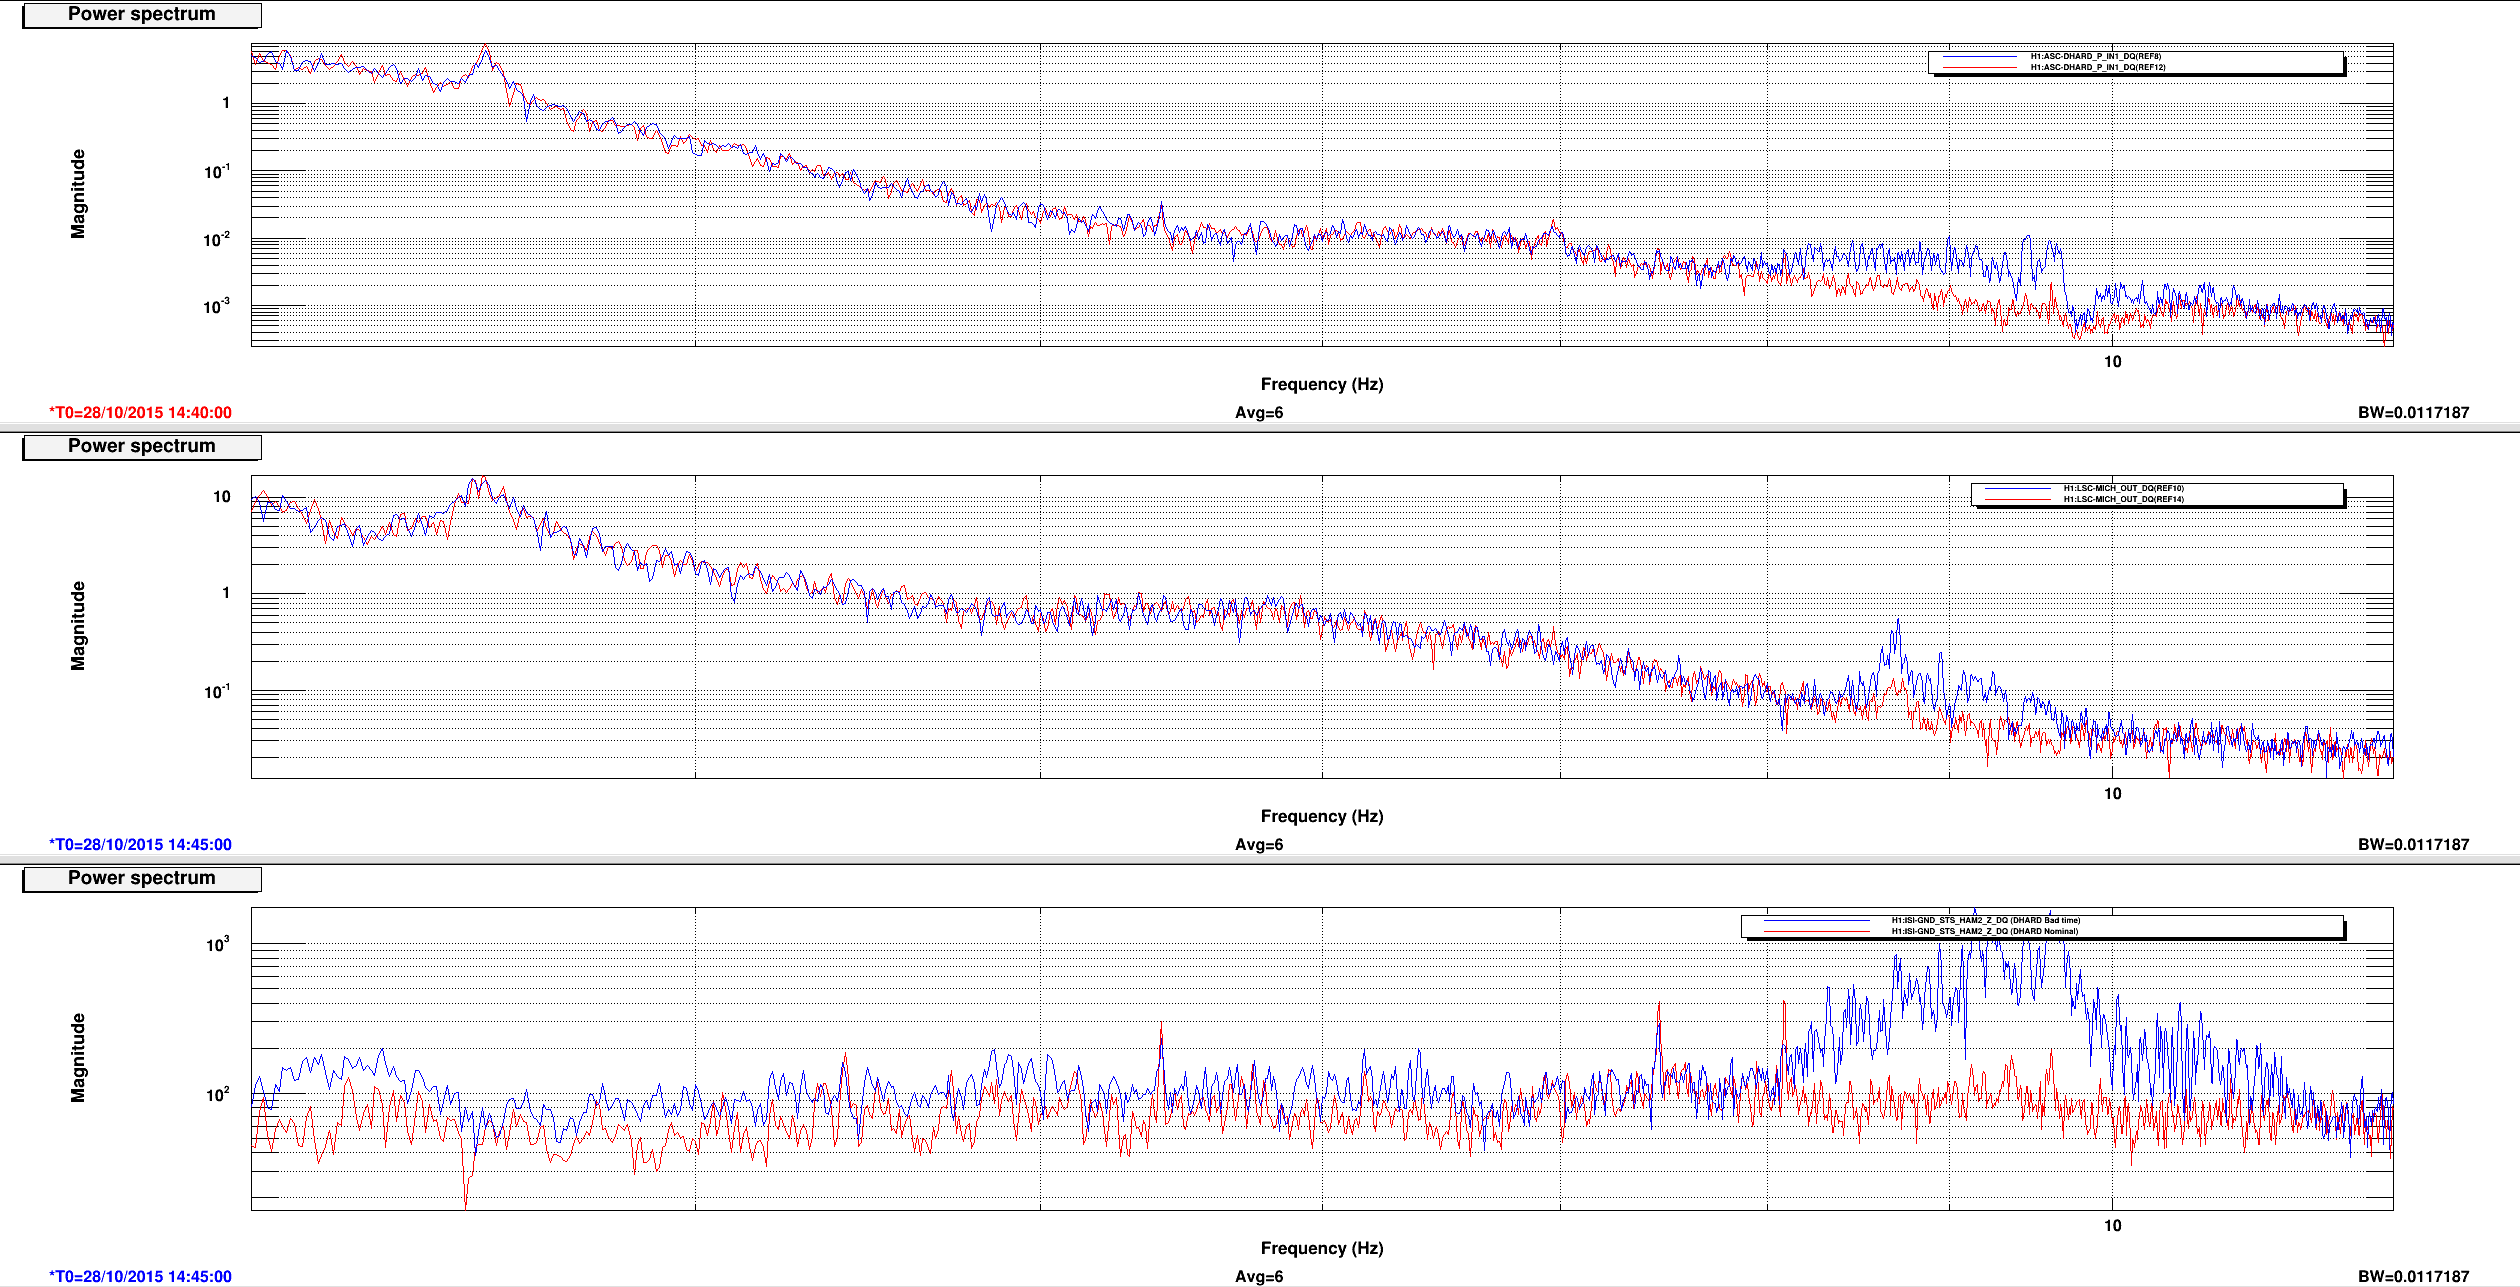
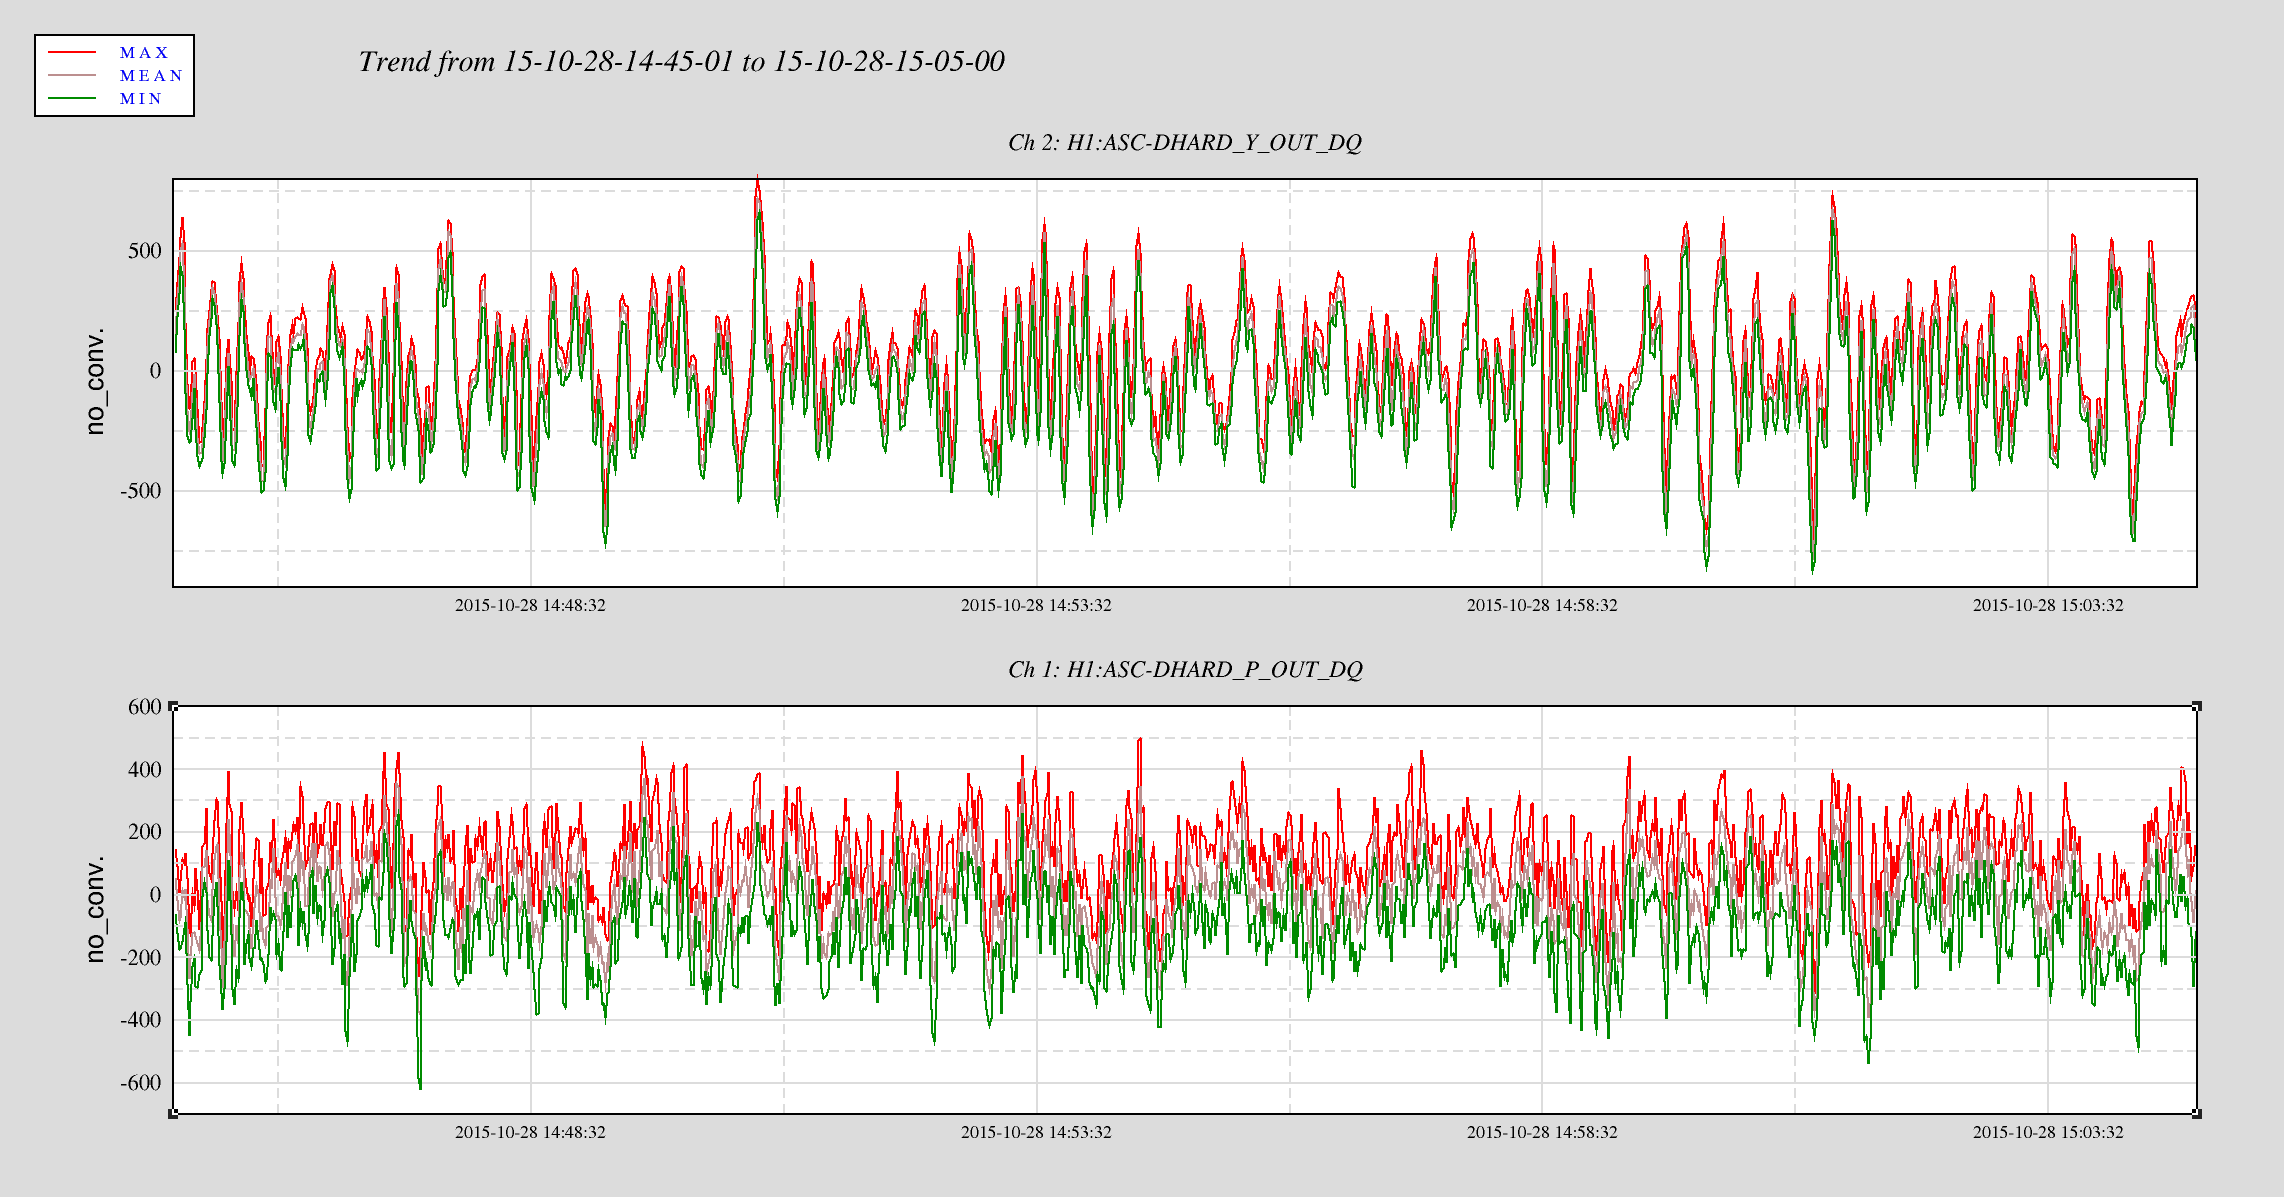
This is a followup on Ed's alog22918 where he reported seeing MICH glitch around the same time DHARD magnitude became large. Miquel found that the MICH "breathing" was actually a result of bad FFT windowing but it could have hidden the 8.6 Hz line that became apparent in DARM the morning of October 28th (and disappeared on the next day). Plot 1,2 and 4,5 attached show spectrum of DHARD Pitch, MICH, and ground motion near HAM2 during the time DHARD oscillation time reported in alog 22918 and alog 22875 compare to their nominal. Plot 3 and 6 are the timeseries of DHARD ptich and yaw during those time. DHARD oscillation frequency is ~21mHz on 10/28 plot and ~39 mHz on 10/27 plot. To show that this oscillation has nothing to do with MICH 8.6 Hz glitch I've attached a set of spectrum and timeseries during the time 8.6Hz began to make its appearence in DARM (7, 8, and 9). The low frequency oscillation isn't there and 8Hz peak shows up clearly in every channel.
I will continue to look for any environment factor that might have caused the DHARD instability. Although Jenne did mentioned that a wrong gain could have caused the loop to become unstable. I was told the that gain hadn't changed for months until somebody lowered it recently to help with the oscillation (Kiwamu?).
While locking DRMI, we noticed that the POP_90 signal looked strangely much larger than it normally does. Evan noticed that PRM was still aligned during this phase when it (and SRM) should normally be misaligned. The PRM guardian was showing that the request was 'MISALIGNED' while the state readback still showed 'ALIGNED'. Looking at the guardian log for PRM, I see that it stopped logging ~3 hours prior to starting to attempt locking. See attached screenshot for error messages.
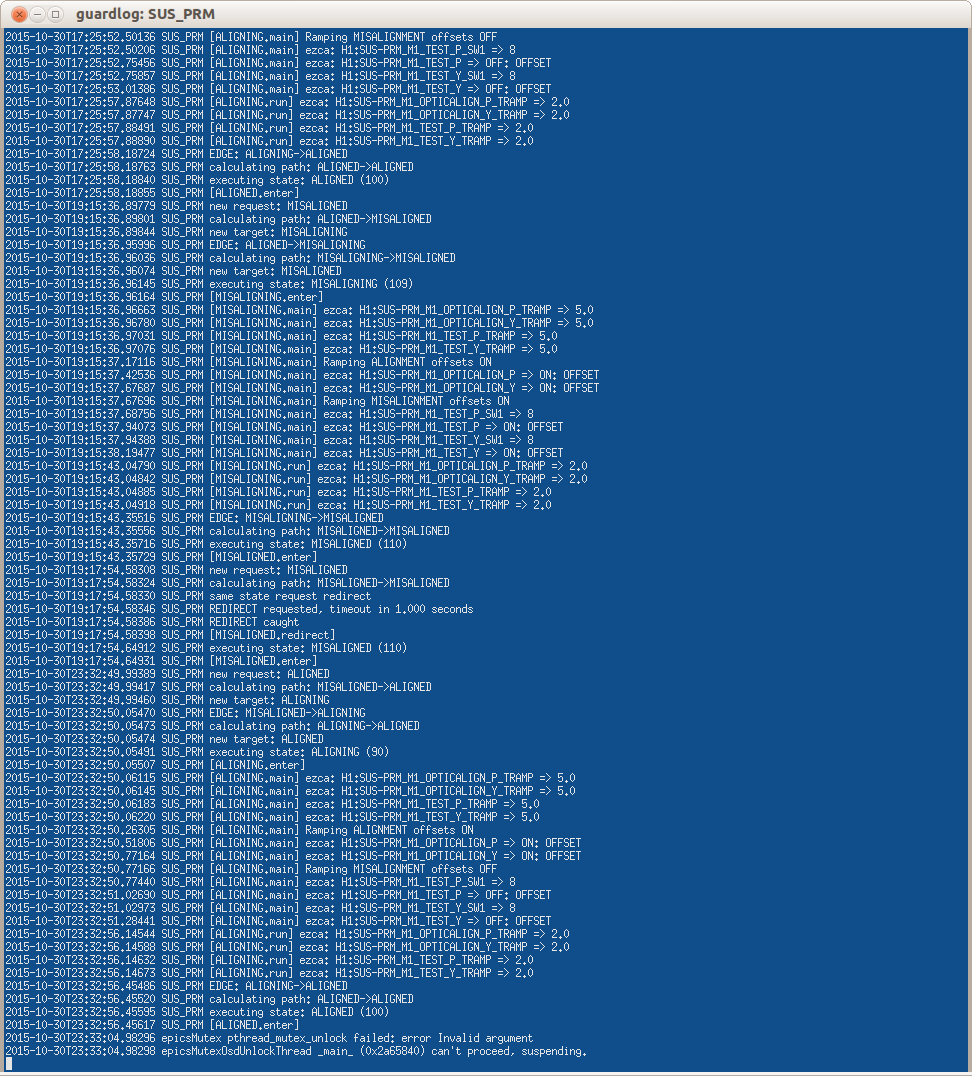
J. Kissel, N. Kijbunchoo, T. Sadecki
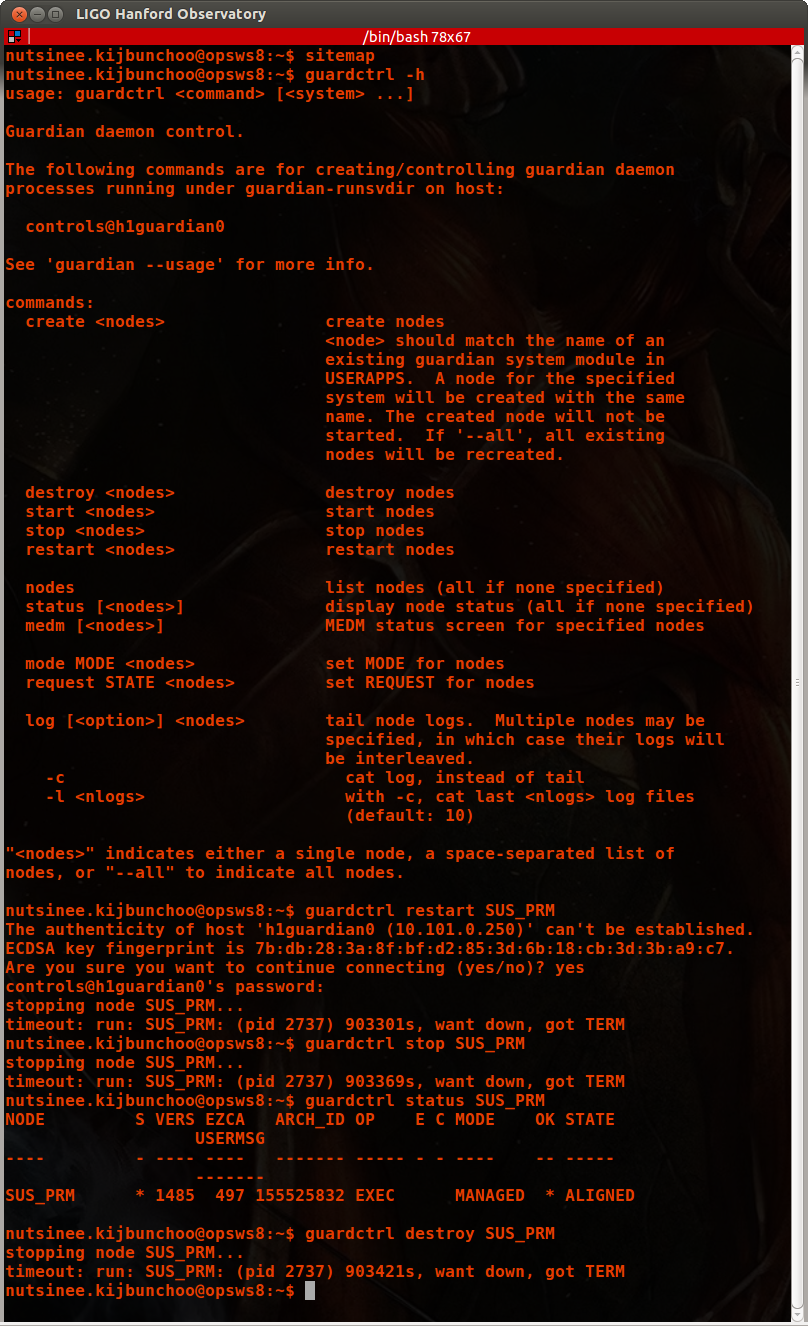
We'd tried several things to resurrect / fix the problem:
- Switch the operation mode from EXEC to PAUSE and back, from EXEC to STOP and back
- Restarting the node from the command line,
- Stopping the node from the command line,
- Destroying the node from the command line
all to no avail.
This doesn't seem to be a show stopping problem, so we're just going to continue as is and email people.
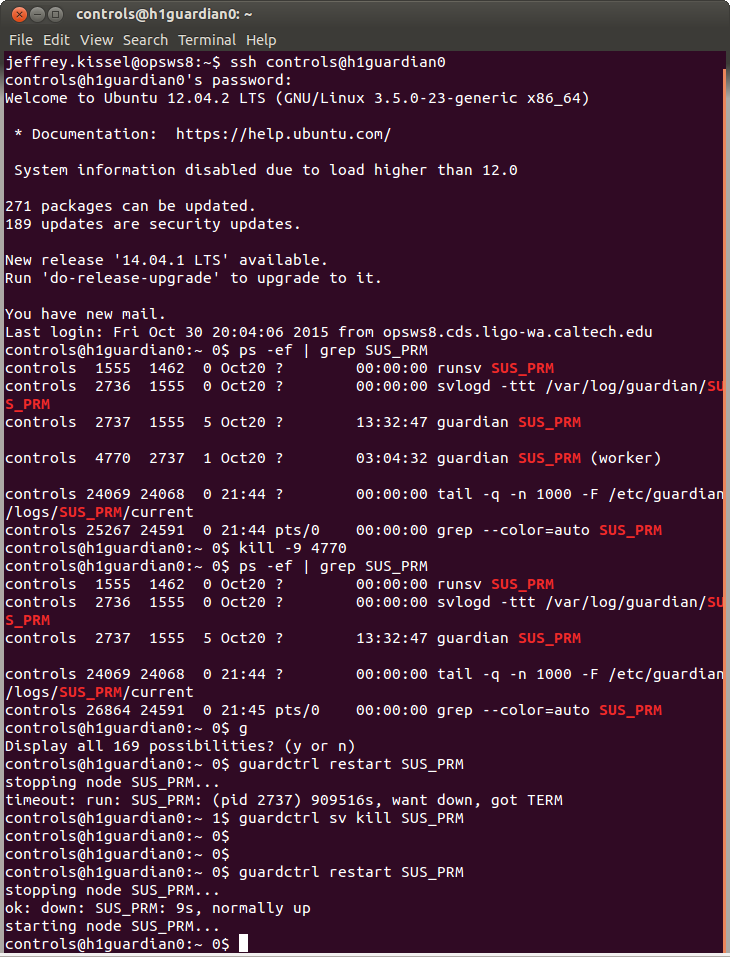
The procedure given in LHO aLOG entry 16880 has been 100% successful in restoring hung Guardian nodes at LLO. We have found that DAQ restarts are usually responsible for causing nodes to hang, hence we reboot the Guardian/script machine following Tuesday maintenance as a preventative measure.

n.b. Jamie has also provided a script to help expedite identifying the hung nodes, see LLO aLOG entry 20615.
J. Kissel, T. Sadecki

Stuart! You rock!

We followed the "procedure" from LHO aLOG 16880, and now SUS_PRM is no longer a member of the walking dead. The PRM node is now responsive to requests and has been remanaged by the ALIGN_IFO manager. Very good!
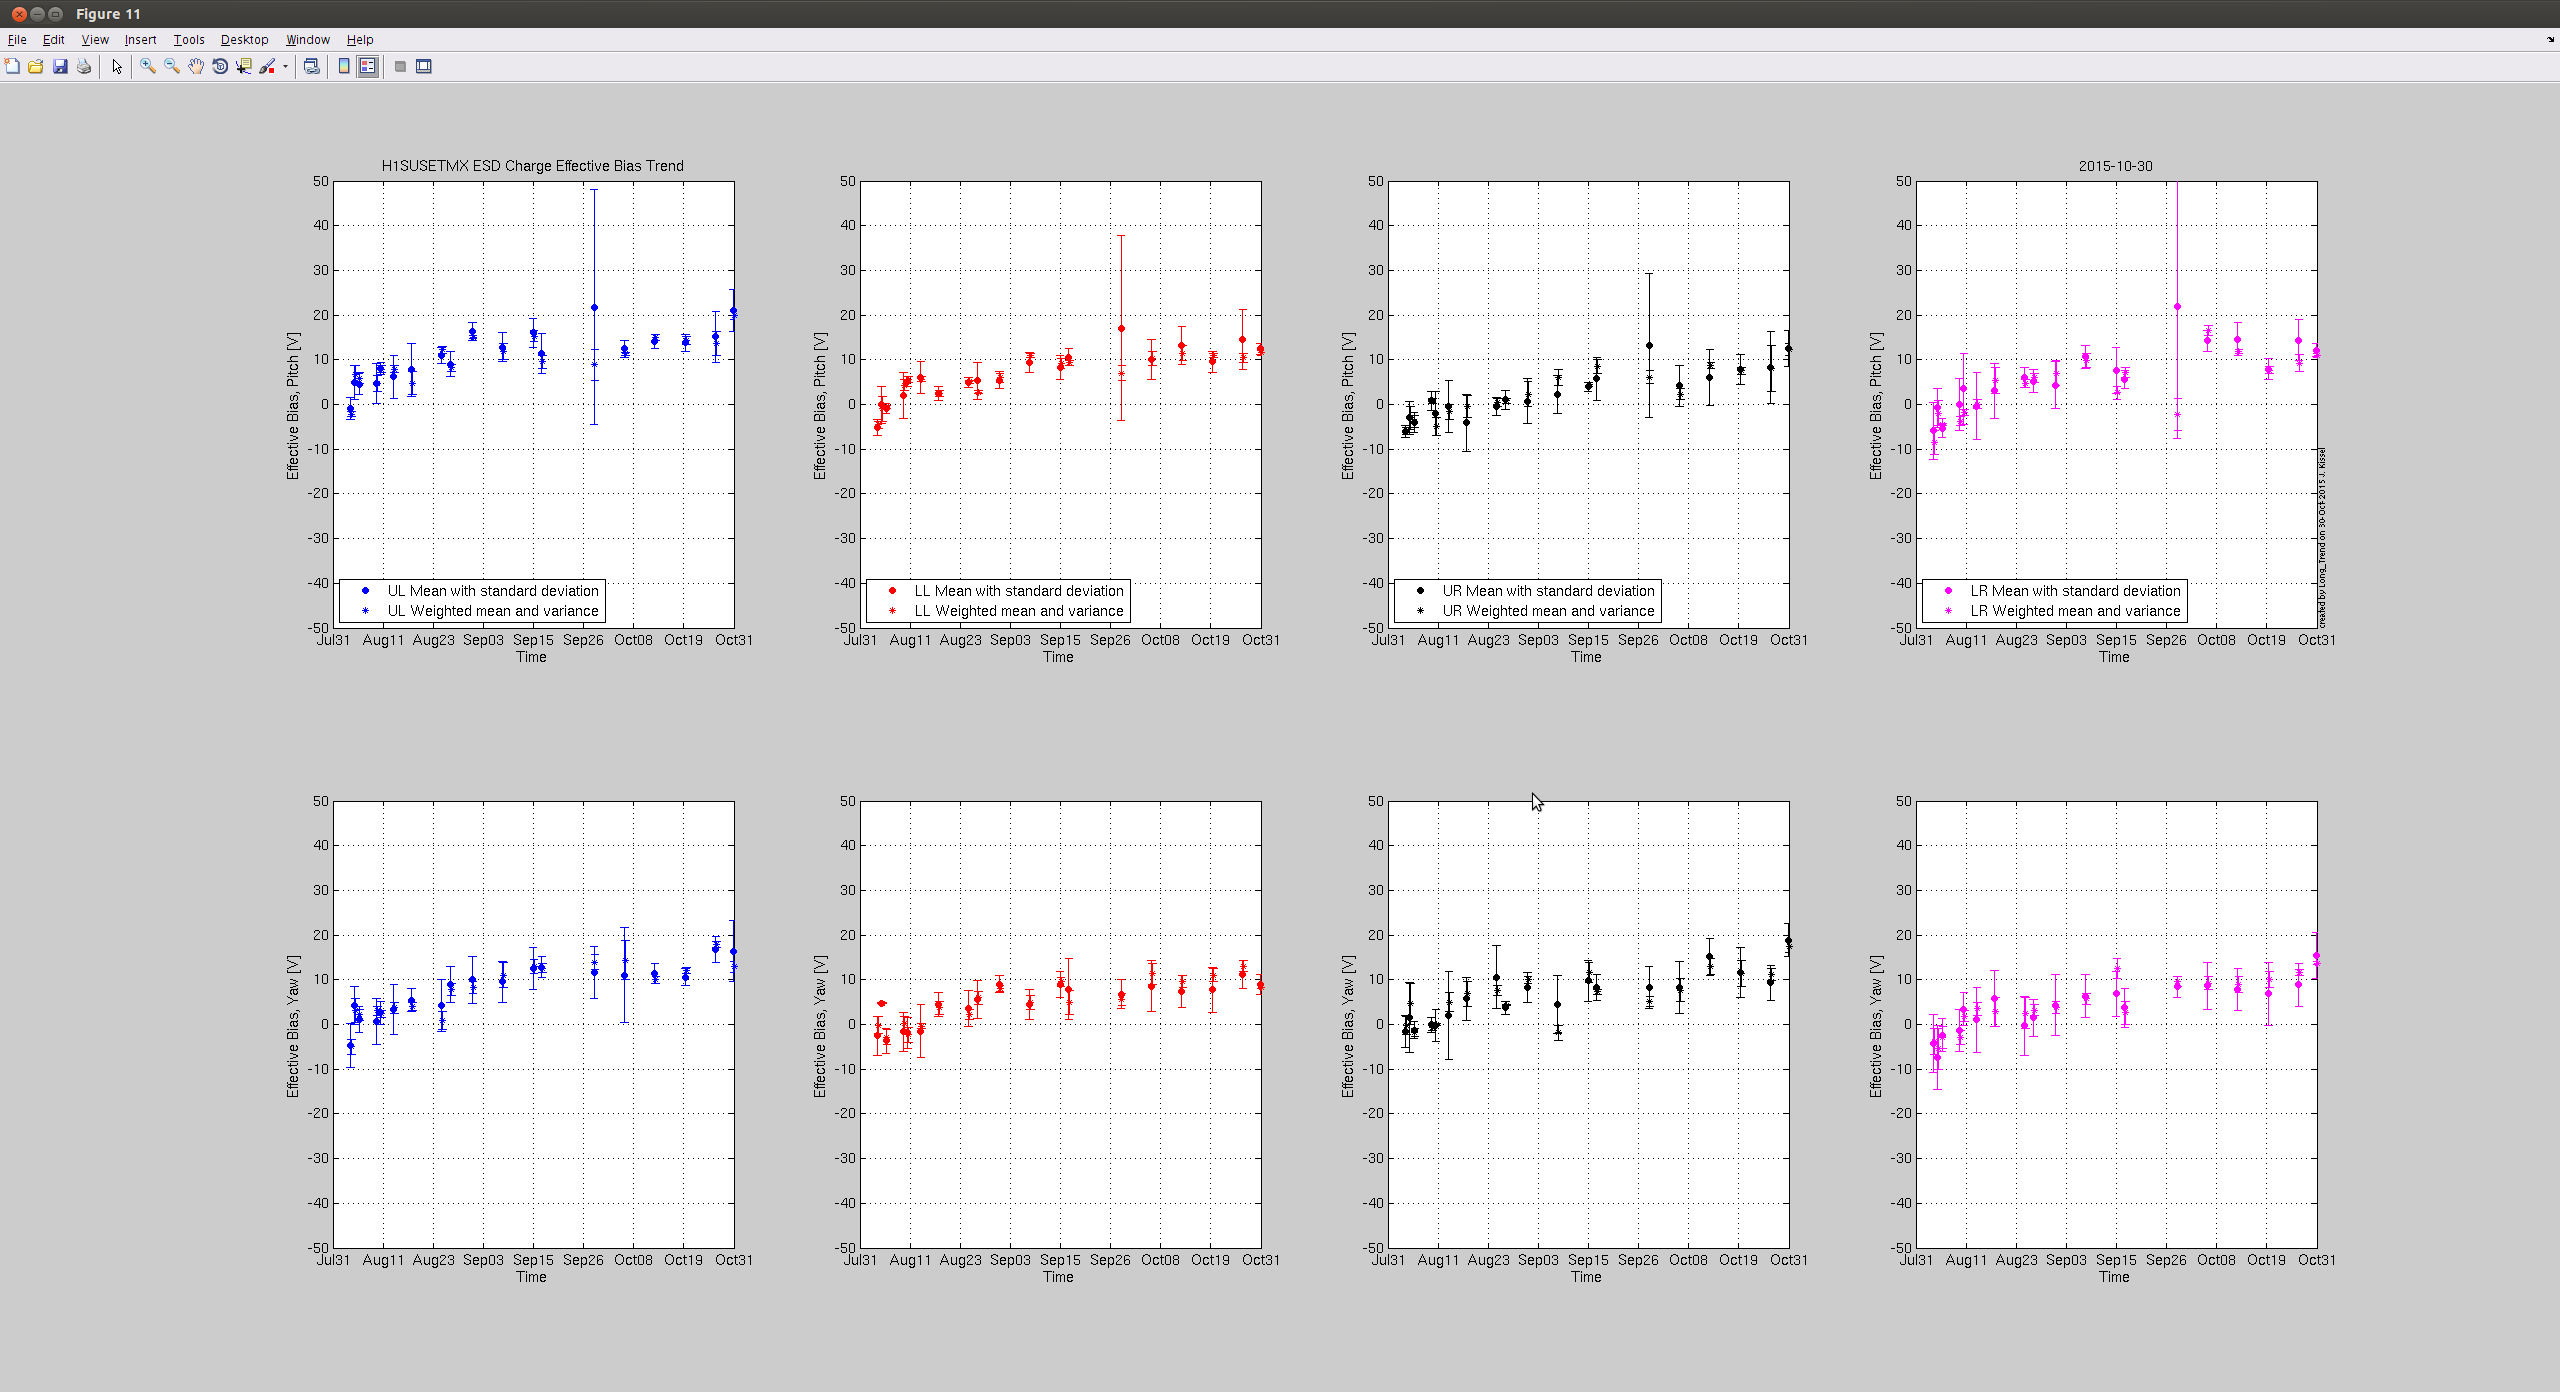
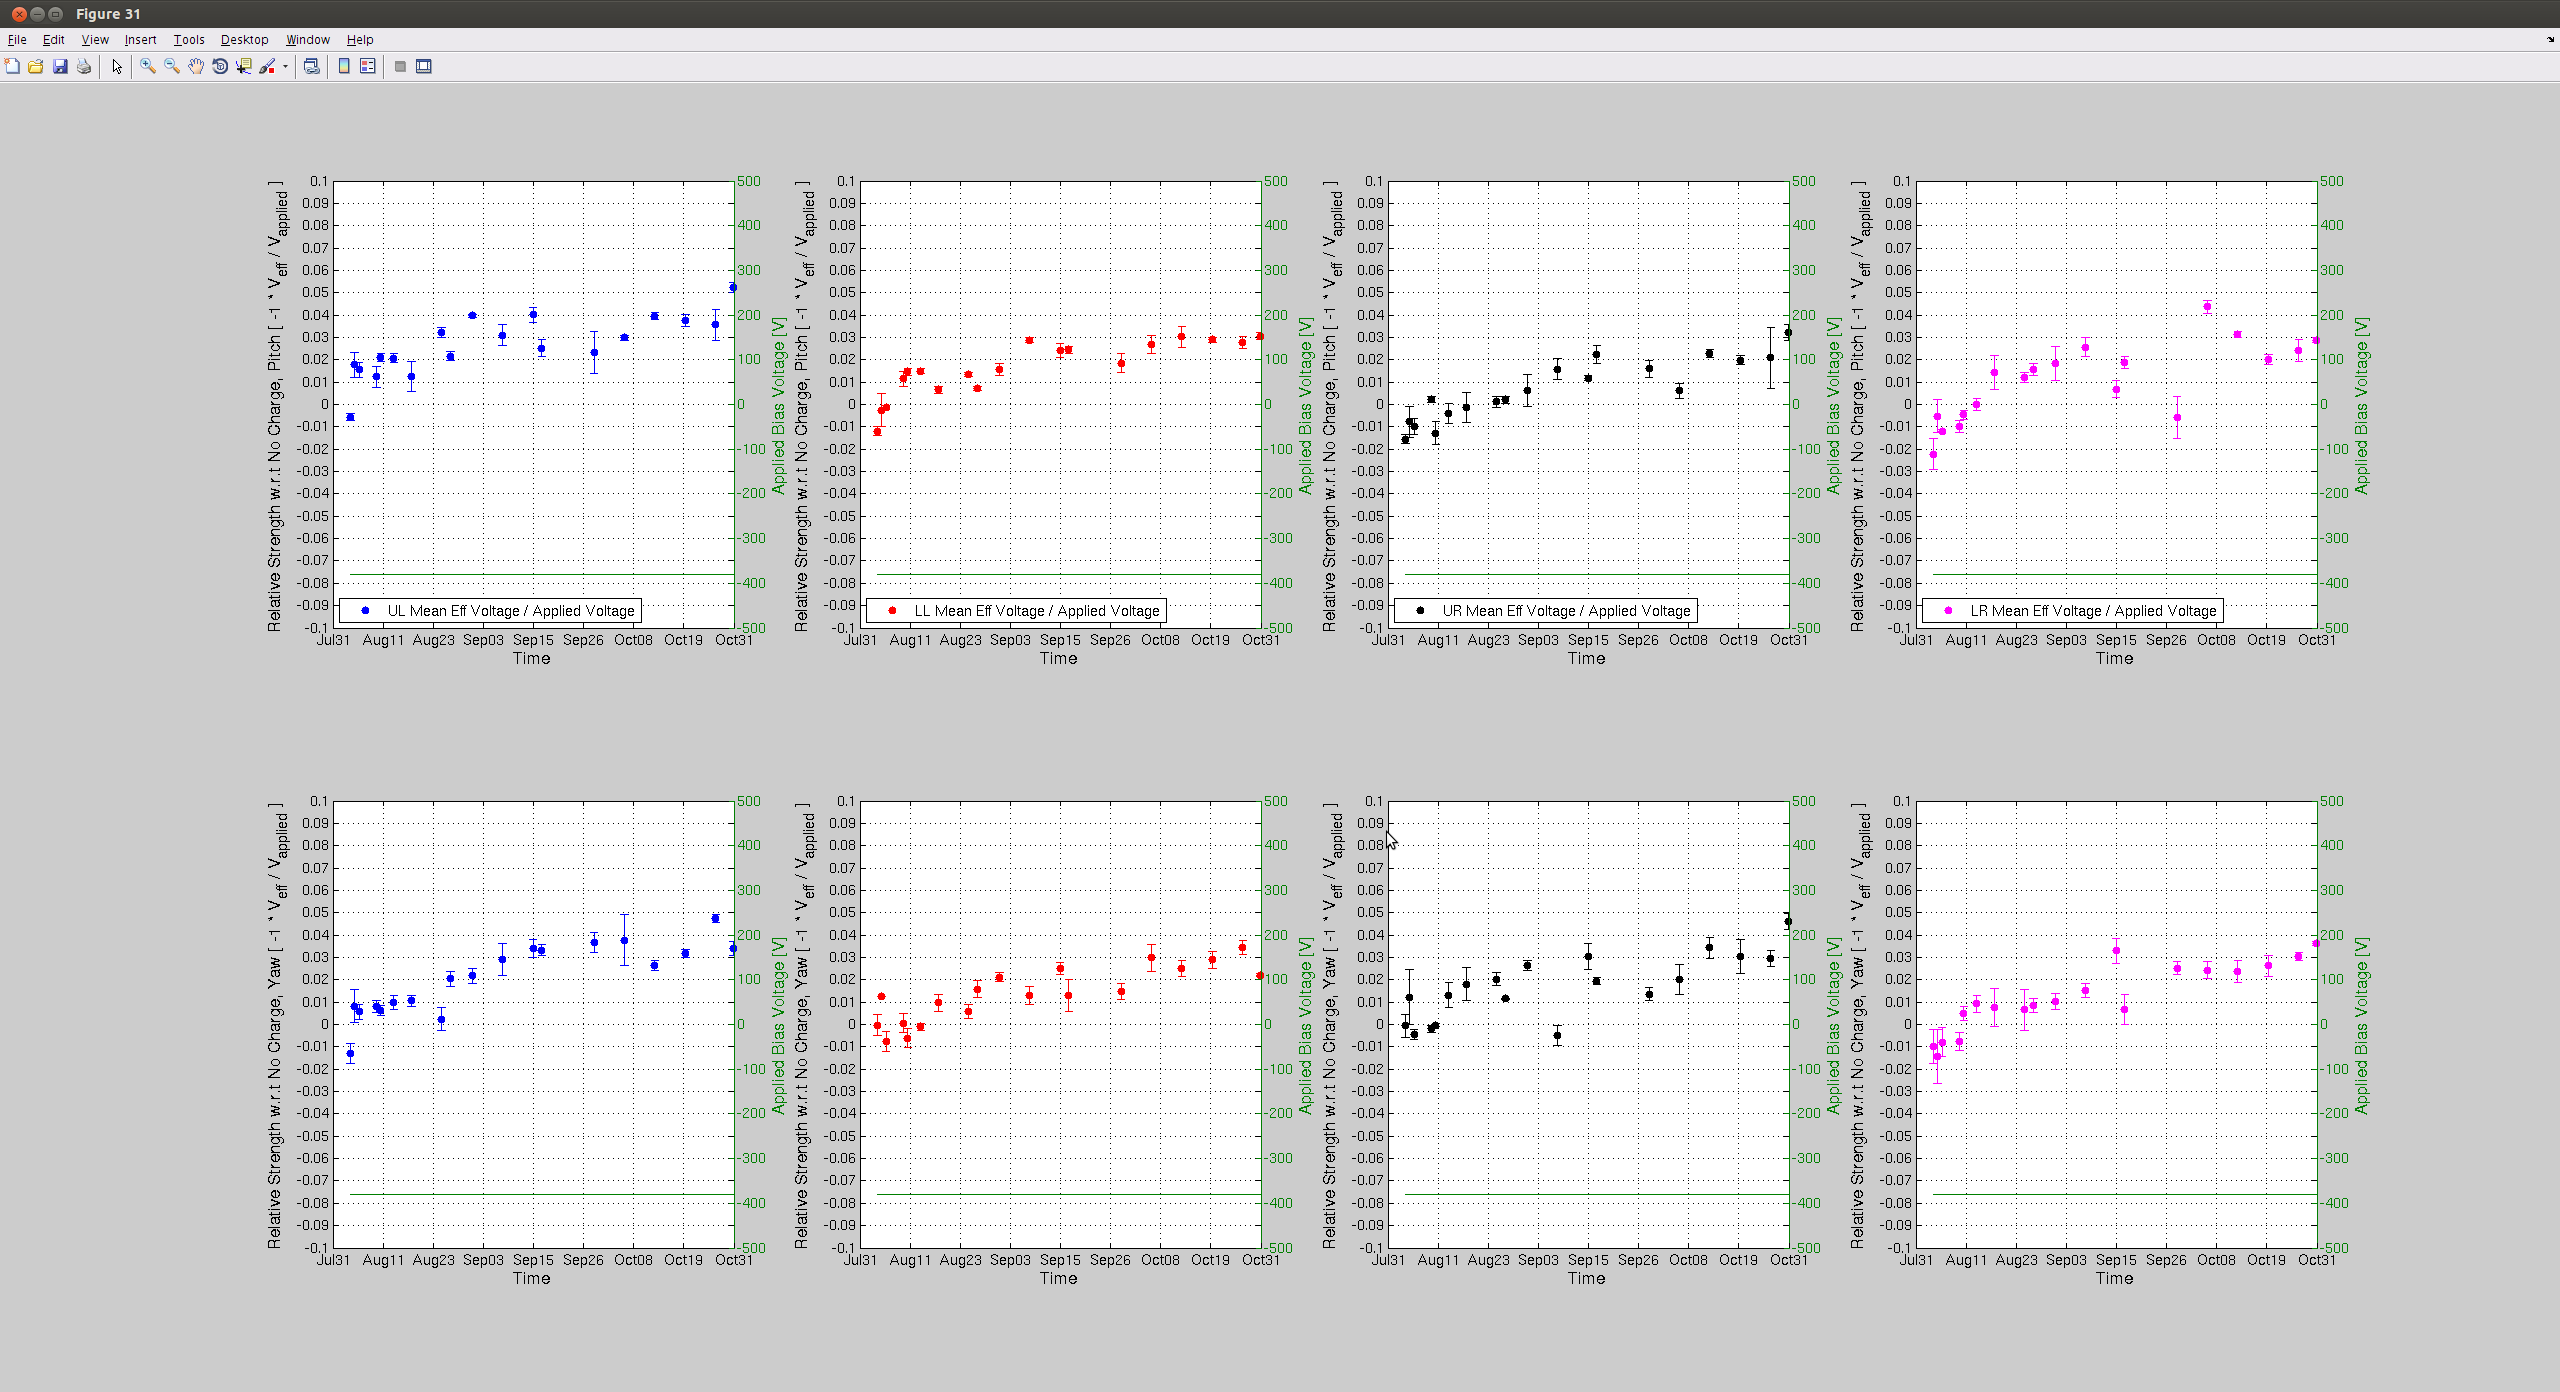
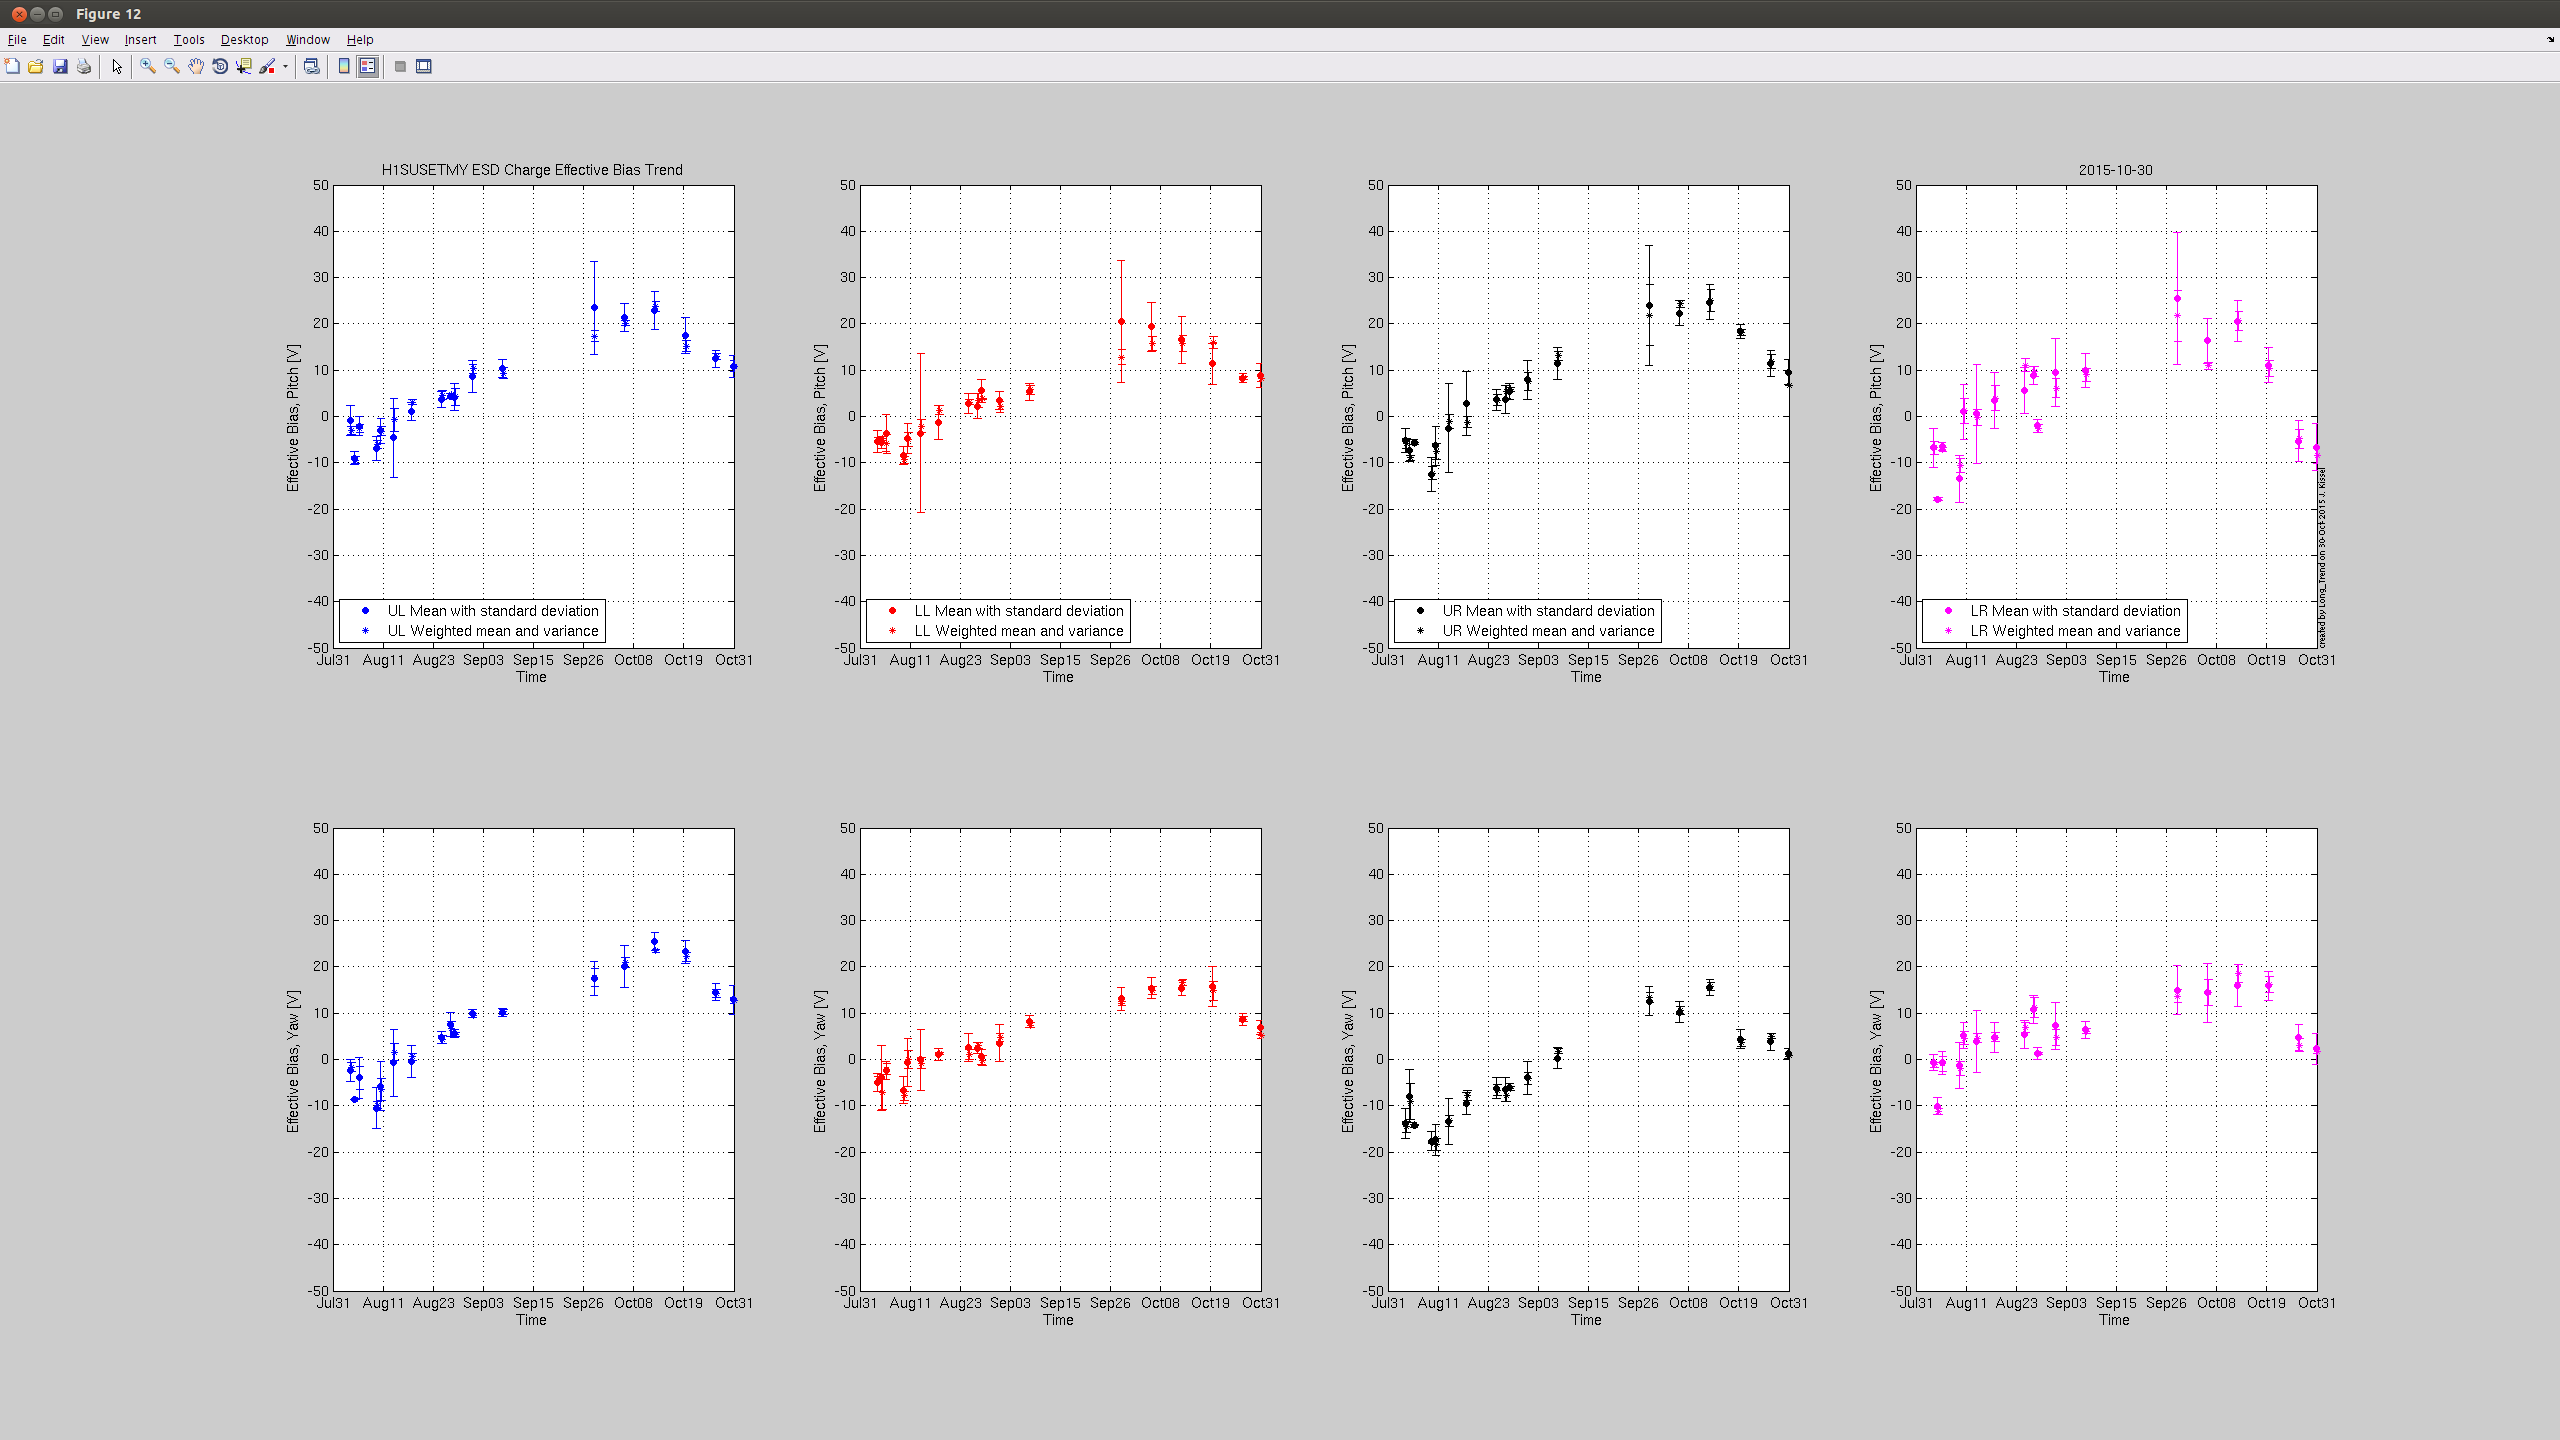
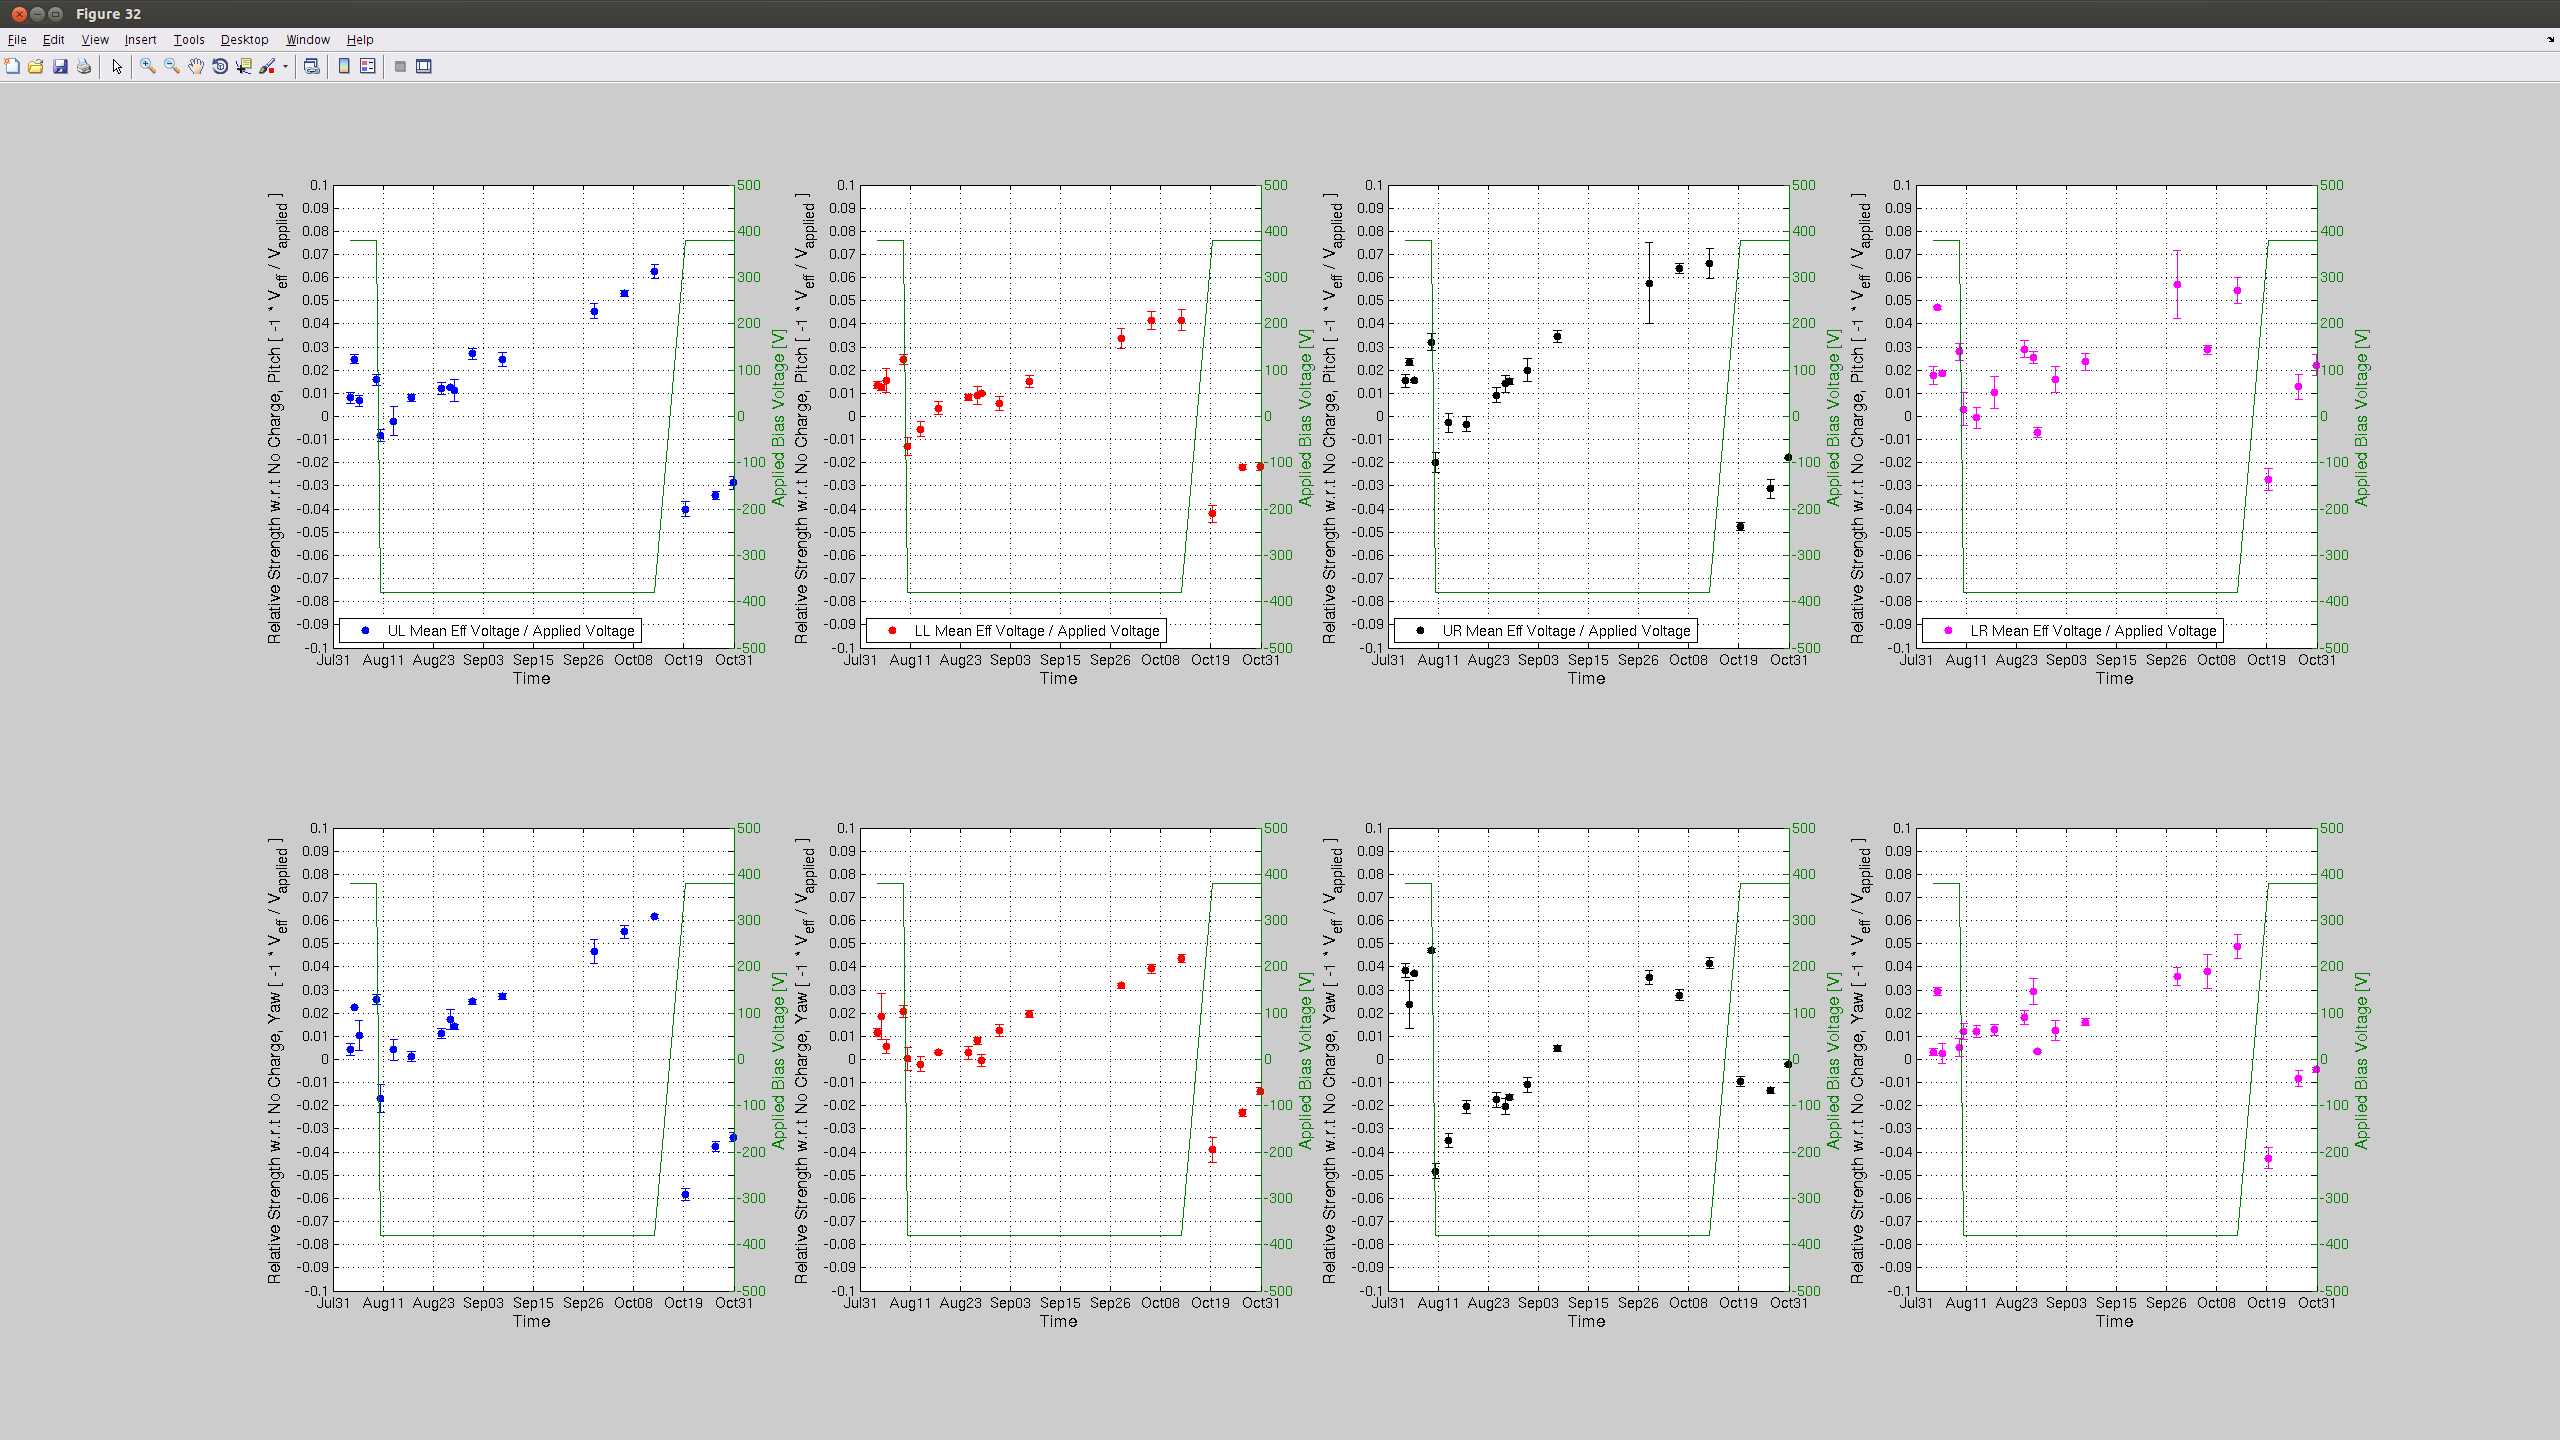
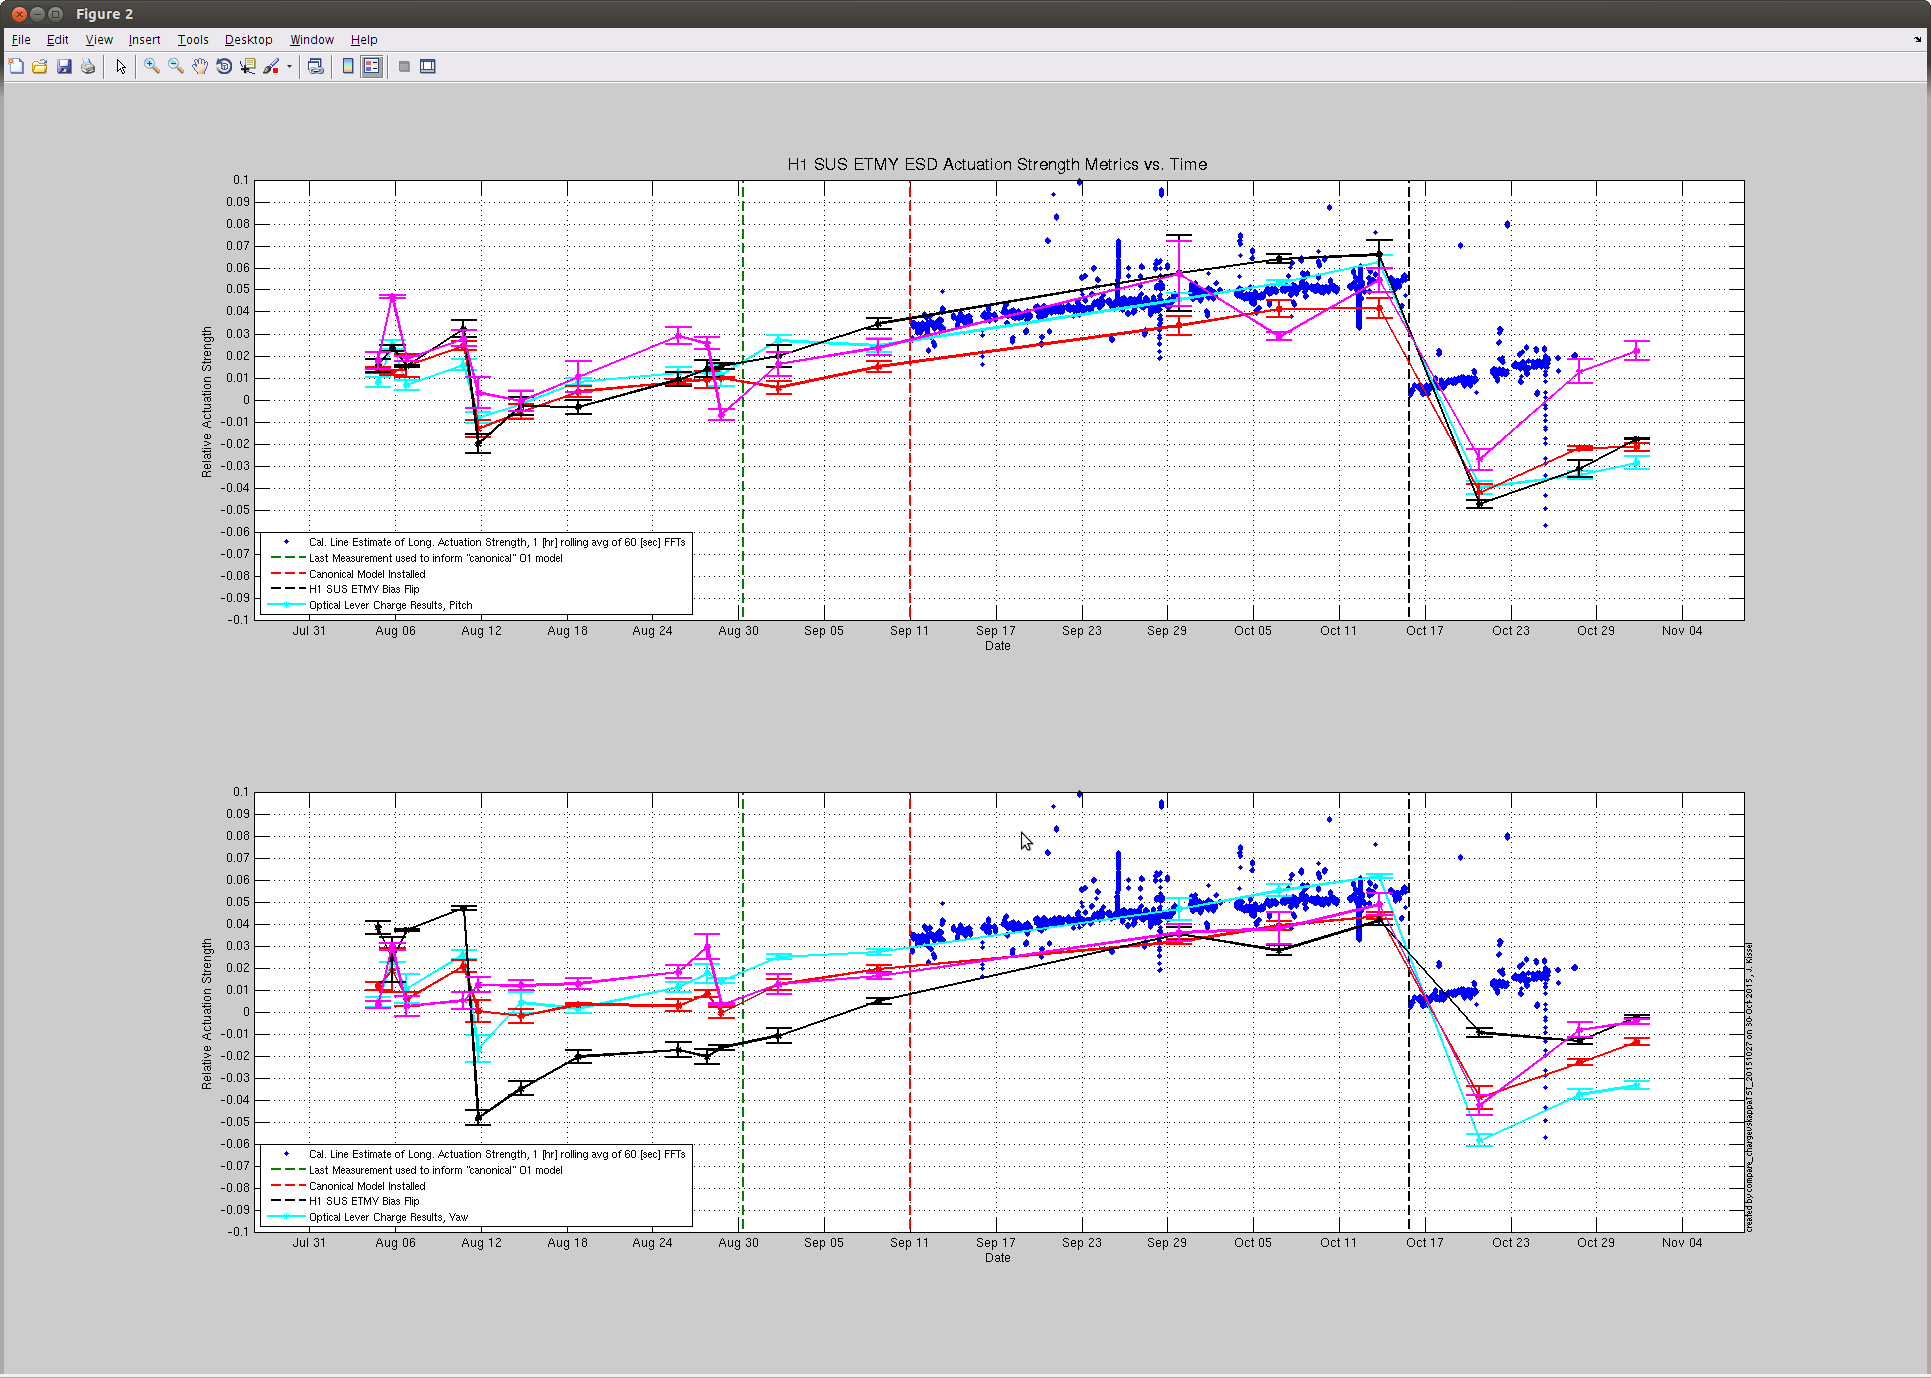
J. Kissel

Taking advantage of the windy down time, I grabbed another set of optical lever charge measurements this evening on both the ETMs. Two bits of news:
(1) The results from Tuesday had shown good agreement between optical lever vs. photon calibrator (cal lines, or kappa_TST) estimations of the H1 SUS ETMY ESD actuation strength, until the recent ETMY bias flip. However, with today's points, we can see that the first measurement after the flip was an outlier and the latests two match the slope much better. All is well, it just re-re-reminds us that it's difficult at best to claim a trend from only one or two optical lever charge measurements, you need several measurements over the course of days to establish a reliable trend.
(2) The H1 SUS ETMX effective bias voltage or charge continues to remain stagnant. Unlike prior to the start of the run, where the rate of increase (or decrease) in charge would stay constant after a bias sign flip, ETMX broke the mold by leveling off after teh start of the run. Recall that we've had a pretty good low-noise duty cycle, which means that the ETMX ESD Bias has been turned OFF for 70-80% of the past few months. This is great evidence to show how turning off or reducing the bias on the ESD attacts less charge. It's also good evidence to support the theory that it is indeed the high ESD bias voltage that is attracting whatever free charged particles are left in the chamber -- as opposed to the alternative mechanism of slow drift in the electric potential of the cage.

Apologies, I don't have updates to the kappa_TST coefficient, but given its consistency, I don't expect that it's slope has changed at all, and youu can just draw a mental line through the past ~week's trend.
The winds have died down to ~15 mph, so I have begun attempting to lock again.
TITLE: "10/30 [DAY Shift]: 15:00-23:00UTC (08:00-16:00 PDT), all times posted in UTC"
STATE Of H1: No lock attempt. Too windy to even try.
SUPPORT: Evan, Sheila, Hugh
SHIFT SUMMARY: We've tried to lock for several hours in the morning. The wind speed was higher when the time the ifo lost lock so we decided that it's not going to happen and left the ifo alone for the rest of the shift. Wind speed stays above 40mph for the past 10 hours.
INCOMING OPERATOR: Travis
ACTIVITY LOG:
15:12 Chris (with the sealing crew) going to X arm beam tube
15:14 Switched blend filters to 90 mHz (was at 45mHz)
15:53 switched back to 90mHz after lost lock while locking DRMI
16:13 switched from quiet 90 and quiet 250 to windy 90 (X,Y) and windy 250 (RX, RY). Leave ETMs with the quiet filters.
16:19 locked DRMI 4F
16:23 Lockloss at CARM 5PM
16:52 Switched EX and EY blend to Windy 90 (X,Y) and Windy 250 (RX, RY). I was awared of the ISI trip issue with these filters but I had nothing better to do. I was hoping that Once ISI trip we can untrip them and move on.
16:53 kyle to X28
16:54 Untripped all the ISI WD, but there was still some issue and we couldn't move on. I switched all the ETMs ISI blend back to Quiet.
17:27 DRMI locked very quickly this time. Took ~ 1 minute.
17:29 We decided to wait for the wind to calm down. No point continue kicking the optics.
18:59 Kyle back for lunch
19:32 Richard to EY to do some safety work (near electronic racks I think).
20:06 Richard back
Kyle to high bay then LVEA to retrieve some stuff.
20:24 Kyle out of LVEA and going back to X28
20:26 Switched all windy blends back to quiet.
20:54 Richard to HAM6 to do more safety work
21:11 Richard back
22:14 Kyle back from X28
22:30 Bubba to Mid to check on Chris.
22:51 Bubba back
This week we installed and caulked aluminum strips on a total of 120 meters of enclosure. We have completed the upper section on 840 meters of enclosure between Mid X and End X.
It is known that if the little test-masses in the STS-2s get too far from center, then noise of the instrument gets worse.
They should all be in the -2V -> +2V range, and one of the End-Y masses might be at -8 V.

Because we are fortunate, Ben Abbott attached the mass-location-monitor to our ADCs.
see pg 11 of the BSC SEI system wiring schematic
https://dcc.ligo.org/LIGO-D0901301
The UVW/ mass positions are being send to ADC 3, chns 20, 21, 22 (for nums 0-31)

Because we are knuckleheads, we do not seem to be monitoring these channels.
An integration issue has been filed: https://services.ligo-wa.caltech.edu/integrationissues/show_bug.cgi?id=1148

Because we are committed to excellence, all the inputs from the ADC are saved as EPICS records.
I think that the epics channels for the end station are
H1:IOP-SEI_EY_MADC3_EPICS_CH20
H1:IOP-SEI_EY_MADC3_EPICS_CH21
H1:IOP-SEI_EY_MADC3_EPICS_CH22

the other STSs should be at
   - end X -
H1:IOP-SEI_EX_MADC3_EPICS_CH20
H1:IOP-SEI_EX_MADC3_EPICS_CH21
H1:IOP-SEI_EX_MADC3_EPICS_CH22

and for the 3 in the corner station

S1:IOP-SEI_[B1|B2|B3]_MADC3_EPICS_CH[20|21|22]

(or maybe it is B6, but I don't think so)


I looked at the channels for End Y, and it seems that the STS-2 at End Y needs re-centering.

It would be smart to
1) watch the monitor channels when you mash the re-center button. If they are the right channels, it will be very clear.
2) check the other sensors, too.
We aren't trying to lock anymore. Just waiting for the wind to settle. Free maintence day today.
With commissioners and run manager approval, WP 5584, TFs were started at 1940utc. The forecast from the scripts is almost 6 hours but I hope that is good to 50%. This doesn't include the lowest frequency bands, I expect to get an opportunity to collect those on Saturday.
The full report is posted on the O1 DQ Shift wiki
Sheila, Nutsinee
I looked at the PRMI to DRMI transition attempts that TJ and Nutsinee logged in the past 2 days, (22972 and 22951), zoomed in plots of both are attached.
As you can see for the sucsesfull transition AS90 was high (about 400 counts in the unnormalized channel) when the SRCL feedback came on, and in the unsucsesfull one AS90 was low, about 50 counts. I have added code to the DRMI guardian that changes the SRCL trigger to AS90 before attempting to turn on the SRCL feedback, with an on threshold of 200 (the trigger uses the normalized channel, so this is something like 450-500 counts in the unnormalized channel ploted here) and an off threshold of 50 coutns. Since the wind is high today and locking the full IFO is not really an option, nutsinee will give this a try if it is compatible with Hugh's measurements.
I attempted to transition from PRMI to DRMI during the first locking attempt after the wind had died down. While the transition kept PRMI locked for quite a while (see screenshot of StripTool), it couldn't hold it long enough to grab DRMI.
I found a typo in ISC_DRMI guardian code after ISC_DRMI gave the connection error notification. H1:LSC-TRIG_MTRX_2_2 was written as H1:LSC_TRIG_MTRX_2_2. Fixed it and hopefully we can move on.
