We tested a set of waveforms to see if they would saturation the ETMY ESD.
Test the 15Hz waveform
Previously we have tested a waveform that began at 30Hz, see aLog 21838. It was requested we try it from 15Hz instead of 30Hz.
Here are the commands I ran for testing the 15Hz waveform:
ezcawrite H1:CAL-INJ_TINJ_TYPE 1
awgstream H1:CAL-INJ_TRANSIENT_EXC 16384 ../H1/coherenttest1from15hz_1126257408.out 0.1 -d -d >> log3.txt
awgstream H1:CAL-INJ_TRANSIENT_EXC 16384 ../H1/coherenttest1from15hz_1126257408.out 0.25 -d -d >> log3.txt
awgstream H1:CAL-INJ_TRANSIENT_EXC 16384 ../H1/coherenttest1from15hz_1126257408.out 0.5 -d -d >> log3.txt
awgstream H1:CAL-INJ_TRANSIENT_EXC 16384 ../H1/coherenttest1from15hz_1126257408.out 1.0 -d -d >> log3.txt
awgstream H1:CAL-INJ_TRANSIENT_EXC 16384 ../H1/coherenttest1from15hz_1126257408.out 1.0 -d -d >> log3.txt
awgstream H1:CAL-INJ_TRANSIENT_EXC 16384 ../H1/coherenttest1from15hz_1126257408.out 1.0 -d -d >> log3.txt
The start times of the injections from the log file (log3.txt):
SIStrOpen: Waveform starts at GPS=1127276638, epoch=0, sample=0
SIStrOpen: Waveform starts at GPS=1127276799, epoch=0, sample=0
SIStrOpen: Waveform starts at GPS=1127277026, epoch=0, sample=0
SIStrOpen: Waveform starts at GPS=1127277293, epoch=0, sample=0
SIStrOpen: Waveform starts at GPS=1127277517, epoch=0, sample=0
SIStrOpen: Waveform starts at GPS=1127277840, epoch=0, sample=0
I did not notice any ESD saturations.
John's waveforms
John V. has also provided 10 waveforms that I tested, see aLog 21964.
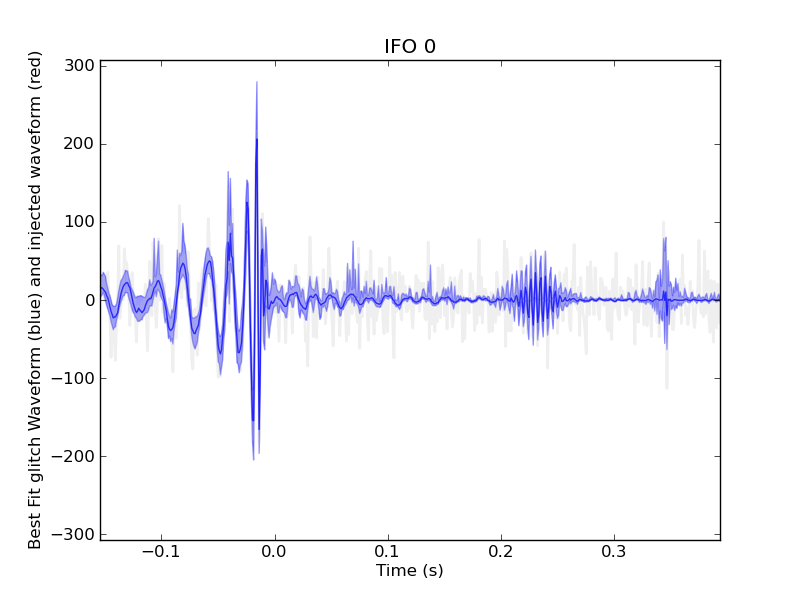
Cautiously testing the first waveform
Here are the command I entered as I slowly scaled up the first waveform's amplitude:
awgstream H1:CAL-INJ_TRANSIENT_EXC 16384 ../H1/posterior0_1126259455.out 0.2 -d -d >> log3.txt
awgstream H1:CAL-INJ_TRANSIENT_EXC 16384 ../H1/posterior0_1126259455.out 0.3333 -d -d >> log3.txt
awgstream H1:CAL-INJ_TRANSIENT_EXC 16384 ../H1/posterior0_1126259455.out 0.5 -d -d >> log3.txt
awgstream H1:CAL-INJ_TRANSIENT_EXC 16384 ../H1/posterior0_1126259455.out 0.6666 -d -d >> log3.txt
awgstream H1:CAL-INJ_TRANSIENT_EXC 16384 ../H1/posterior0_1126259455.out 0.75 -d -d >> log3.txt
awgstream H1:CAL-INJ_TRANSIENT_EXC 16384 ../H1/posterior0_1126259455.out 0.85 -d -d >> log3.txt
awgstream H1:CAL-INJ_TRANSIENT_EXC 16384 ../H1/posterior0_1126259455.out 1.0 -d -d >> log3.txt
awgstream H1:CAL-INJ_TRANSIENT_EXC 16384 ../H1/posterior0_1126259455.out 1.0 -d -d >> log3.txt
The start times for these injections:
SIStrOpen: Waveform starts at GPS=1127278105, epoch=0, sample=0
SIStrOpen: Waveform starts at GPS=1127278209, epoch=0, sample=0
SIStrOpen: Waveform starts at GPS=1127278748, epoch=0, sample=0
SIStrOpen: Waveform starts at GPS=1127279093, epoch=0, sample=0
SIStrOpen: Waveform starts at GPS=1127279520, epoch=0, sample=0
SIStrOpen: Waveform starts at GPS=1127279644, epoch=0, sample=0
SIStrOpen: Waveform starts at GPS=1127280123, epoch=0, sample=0
SIStrOpen: Waveform starts at GPS=1127280433, epoch=0, sample=0
SIStrOpen: Waveform starts at GPS=1127281232, epoch=0, sample=0
The injection that began at 1127280433 was near an ETMY alert from the robot voice. The ETMY alert happened a bit after the injection happened. SO I waited, I repeated the same injection, and there was no alert.
I did one of these injections with a padding of 10 minutes so if the search groups are going to followup one of these injections in more detail this would be a good choice:
awgstream H1:CAL-INJ_TRANSIENT_EXC 16384 ../H1/posterior0_1126259455.out 1.0 -d -d >> log3.txt # gave this guy a bit of time
The start time of this injection is:
SIStrOpen: Waveform starts at GPS=1127281956, epoch=0, sample=0
Testing the other nine waveforms
Then I tested the remaining 9 waveforms by beginning with a scale factor of 0.3333 and incrementing to 1.0. I did these with little spacing between the injections so I do not think this set is worth the analysis groups following up. However, I think the injections with scale factor 1.0 should be looked at for ESD saturation (I believe Andy has a script for that):
awgstream H1:CAL-INJ_TRANSIENT_EXC 16384 ../H1/posterior1_1126259455.out 0.3333 -d -d >> log3.txt
awgstream H1:CAL-INJ_TRANSIENT_EXC 16384 ../H1/posterior1_1126259455.out 0.6666 -d -d >> log3.txt
awgstream H1:CAL-INJ_TRANSIENT_EXC 16384 ../H1/posterior1_1126259455.out 1.0 -d -d >> log3.txt
awgstream H1:CAL-INJ_TRANSIENT_EXC 16384 ../H1/posterior2_1126259455.out 0.3333 -d -d >> log3.txt
awgstream H1:CAL-INJ_TRANSIENT_EXC 16384 ../H1/posterior2_1126259455.out 0.6666 -d -d >> log3.txt
awgstream H1:CAL-INJ_TRANSIENT_EXC 16384 ../H1/posterior2_1126259455.out 1.0 -d -d >> log3.txt
awgstream H1:CAL-INJ_TRANSIENT_EXC 16384 ../H1/posterior3_1126259455.out 0.3333 -d -d >> log3.txt
awgstream H1:CAL-INJ_TRANSIENT_EXC 16384 ../H1/posterior3_1126259455.out 0.6666 -d -d >> log3.txt
awgstream H1:CAL-INJ_TRANSIENT_EXC 16384 ../H1/posterior3_1126259455.out 1.0 -d -d >> log3.txt
awgstream H1:CAL-INJ_TRANSIENT_EXC 16384 ../H1/posterior4_1126259455.out 0.3333 -d -d >> log3.txt
awgstream H1:CAL-INJ_TRANSIENT_EXC 16384 ../H1/posterior4_1126259455.out 0.6666 -d -d >> log3.txt
awgstream H1:CAL-INJ_TRANSIENT_EXC 16384 ../H1/posterior4_1126259455.out 1.0 -d -d >> log3.txt
awgstream H1:CAL-INJ_TRANSIENT_EXC 16384 ../H1/posterior5_1126259455.out 0.3333 -d -d >> log3.txt
awgstream H1:CAL-INJ_TRANSIENT_EXC 16384 ../H1/posterior5_1126259455.out 0.6666 -d -d >> log3.txt
awgstream H1:CAL-INJ_TRANSIENT_EXC 16384 ../H1/posterior5_1126259455.out 1.0 -d -d >> log3.txt
awgstream H1:CAL-INJ_TRANSIENT_EXC 16384 ../H1/posterior6_1126259455.out 0.3333 -d -d >> log3.txt
awgstream H1:CAL-INJ_TRANSIENT_EXC 16384 ../H1/posterior6_1126259455.out 0.6666 -d -d >> log3.txt
awgstream H1:CAL-INJ_TRANSIENT_EXC 16384 ../H1/posterior6_1126259455.out 1.0 -d -d >> log3.txt
awgstream H1:CAL-INJ_TRANSIENT_EXC 16384 ../H1/posterior7_1126259455.out 0.3333 -d -d >> log3.txt
awgstream H1:CAL-INJ_TRANSIENT_EXC 16384 ../H1/posterior7_1126259455.out 0.6666 -d -d >> log3.txt
awgstream H1:CAL-INJ_TRANSIENT_EXC 16384 ../H1/posterior7_1126259455.out 1.0 -d -d >> log3.txt
awgstream H1:CAL-INJ_TRANSIENT_EXC 16384 ../H1/posterior8_1126259455.out 0.3333 -d -d >> log3.txt
awgstream H1:CAL-INJ_TRANSIENT_EXC 16384 ../H1/posterior8_1126259455.out 0.6666 -d -d >> log3.txt
awgstream H1:CAL-INJ_TRANSIENT_EXC 16384 ../H1/posterior8_1126259455.out 1.0 -d -d >> log3.txt
awgstream H1:CAL-INJ_TRANSIENT_EXC 16384 ../H1/posterior9_1126259455.out 0.3333 -d -d >> log3.txt
awgstream H1:CAL-INJ_TRANSIENT_EXC 16384 ../H1/posterior9_1126259455.out 0.6666 -d -d >> log3.txt
awgstream H1:CAL-INJ_TRANSIENT_EXC 16384 ../H1/posterior9_1126259455.out 1.0 -d -d >> log3.txt
The start times of these injections:
SIStrOpen: Waveform starts at GPS=1127282013, epoch=0, sample=0
SIStrOpen: Waveform starts at GPS=1127282066, epoch=0, sample=0
SIStrOpen: Waveform starts at GPS=1127282120, epoch=0, sample=0
SIStrOpen: Waveform starts at GPS=1127282173, epoch=0, sample=0
SIStrOpen: Waveform starts at GPS=1127282226, epoch=0, sample=0
SIStrOpen: Waveform starts at GPS=1127282278, epoch=0, sample=0
SIStrOpen: Waveform starts at GPS=1127282326, epoch=0, sample=0
SIStrOpen: Waveform starts at GPS=1127282377, epoch=0, sample=0
SIStrOpen: Waveform starts at GPS=1127282422, epoch=0, sample=0
SIStrOpen: Waveform starts at GPS=1127282476, epoch=0, sample=0
SIStrOpen: Waveform starts at GPS=1127282517, epoch=0, sample=0
SIStrOpen: Waveform starts at GPS=1127282577, epoch=0, sample=0
SIStrOpen: Waveform starts at GPS=1127282631, epoch=0, sample=0
SIStrOpen: Waveform starts at GPS=1127282681, epoch=0, sample=0
SIStrOpen: Waveform starts at GPS=1127282727, epoch=0, sample=0
SIStrOpen: Waveform starts at GPS=1127282770, epoch=0, sample=0
SIStrOpen: Waveform starts at GPS=1127282819, epoch=0, sample=0
SIStrOpen: Waveform starts at GPS=1127282964, epoch=0, sample=0
SIStrOpen: Waveform starts at GPS=1127283007, epoch=0, sample=0
SIStrOpen: Waveform starts at GPS=1127283048, epoch=0, sample=0
SIStrOpen: Waveform starts at GPS=1127283089, epoch=0, sample=0
SIStrOpen: Waveform starts at GPS=1127283160, epoch=0, sample=0
SIStrOpen: Waveform starts at GPS=1127283204, epoch=0, sample=0
SIStrOpen: Waveform starts at GPS=1127283245, epoch=0, sample=0
SIStrOpen: Waveform starts at GPS=1127283292, epoch=0, sample=0
SIStrOpen: Waveform starts at GPS=1127283338, epoch=0, sample=0
SIStrOpen: Waveform starts at GPS=1127283440, epoch=0, sample=0
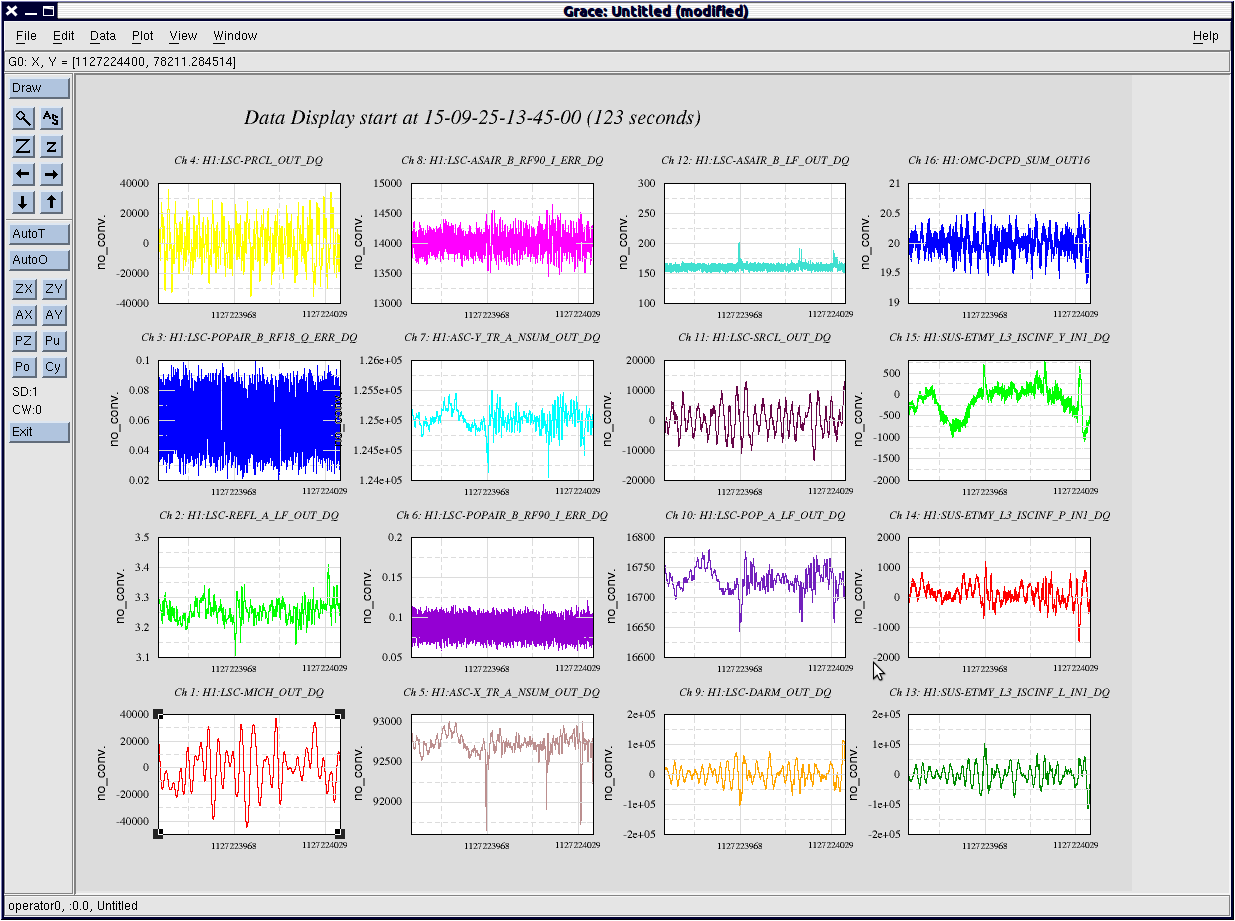
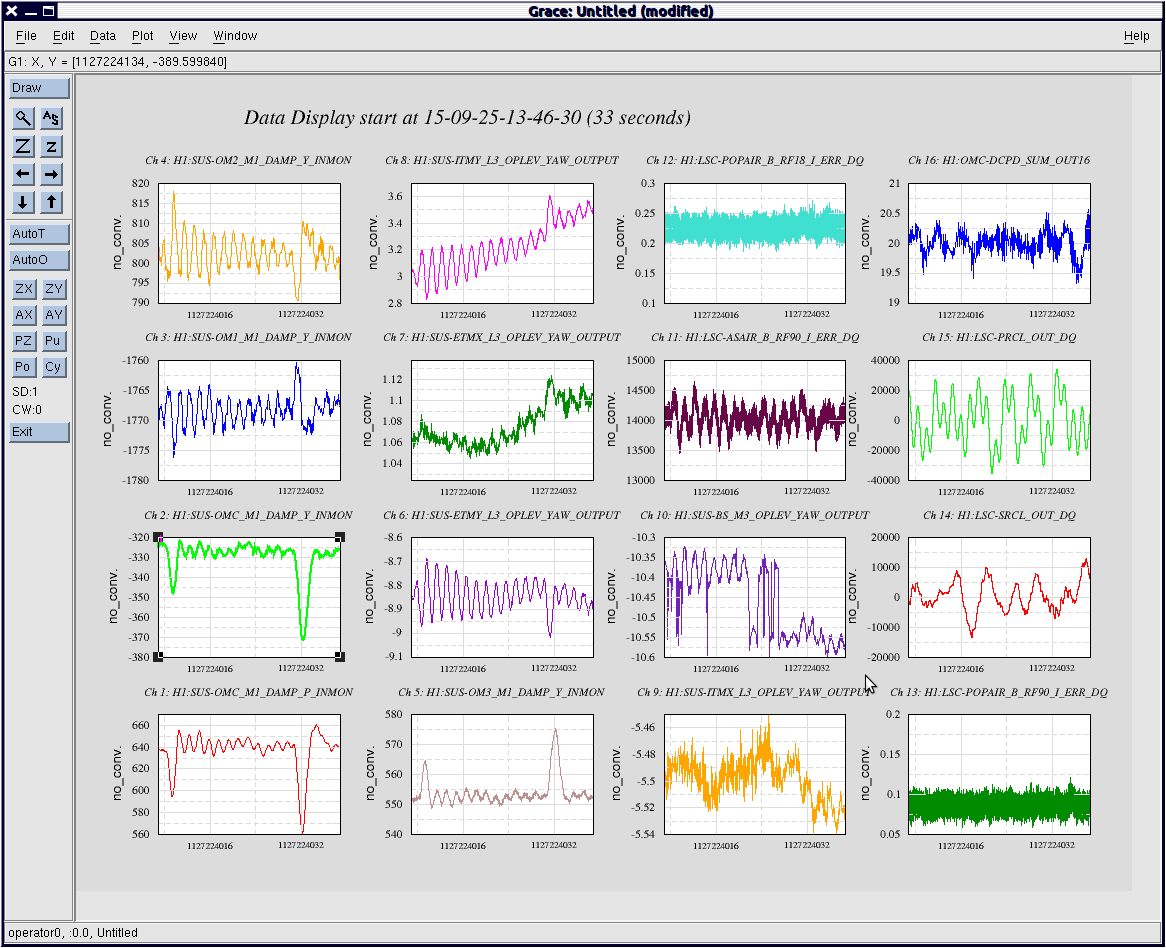
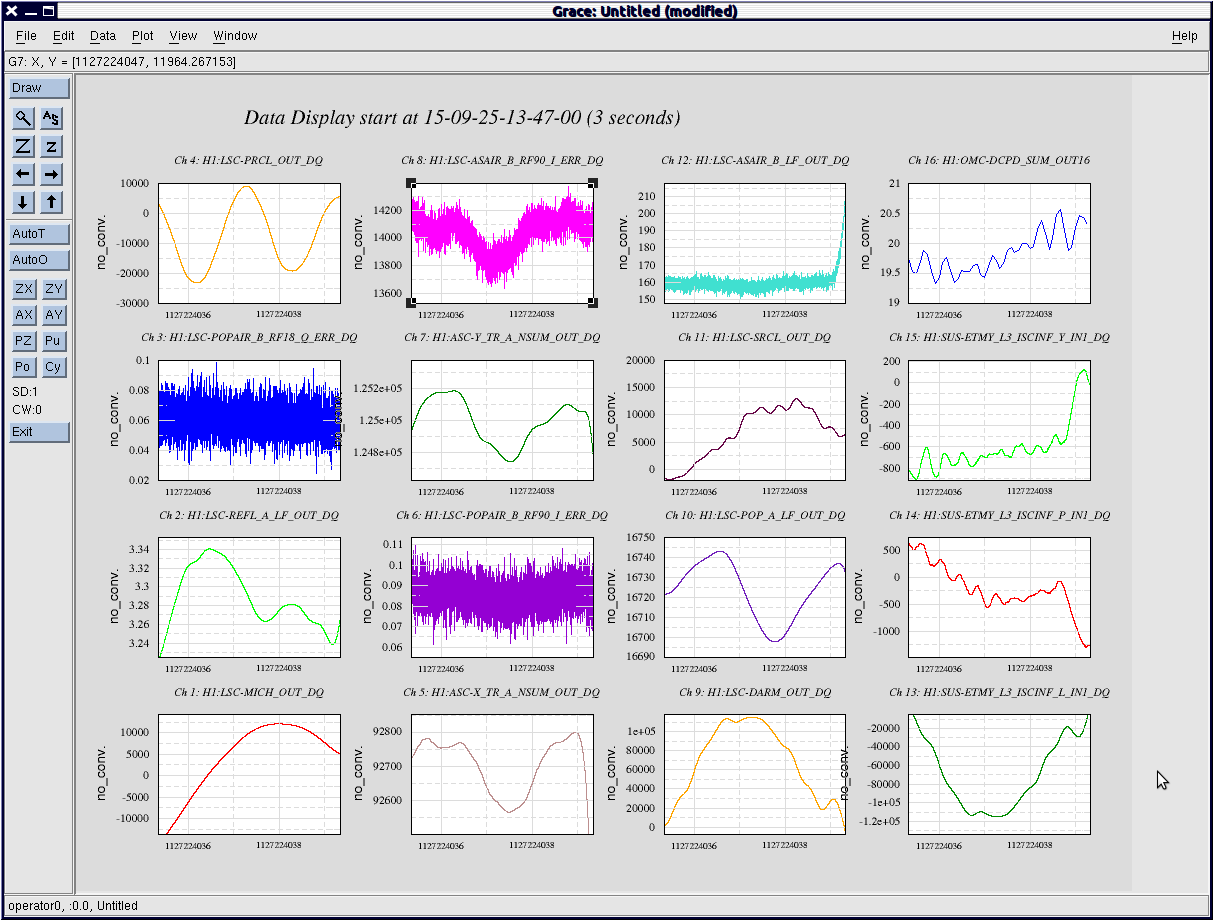
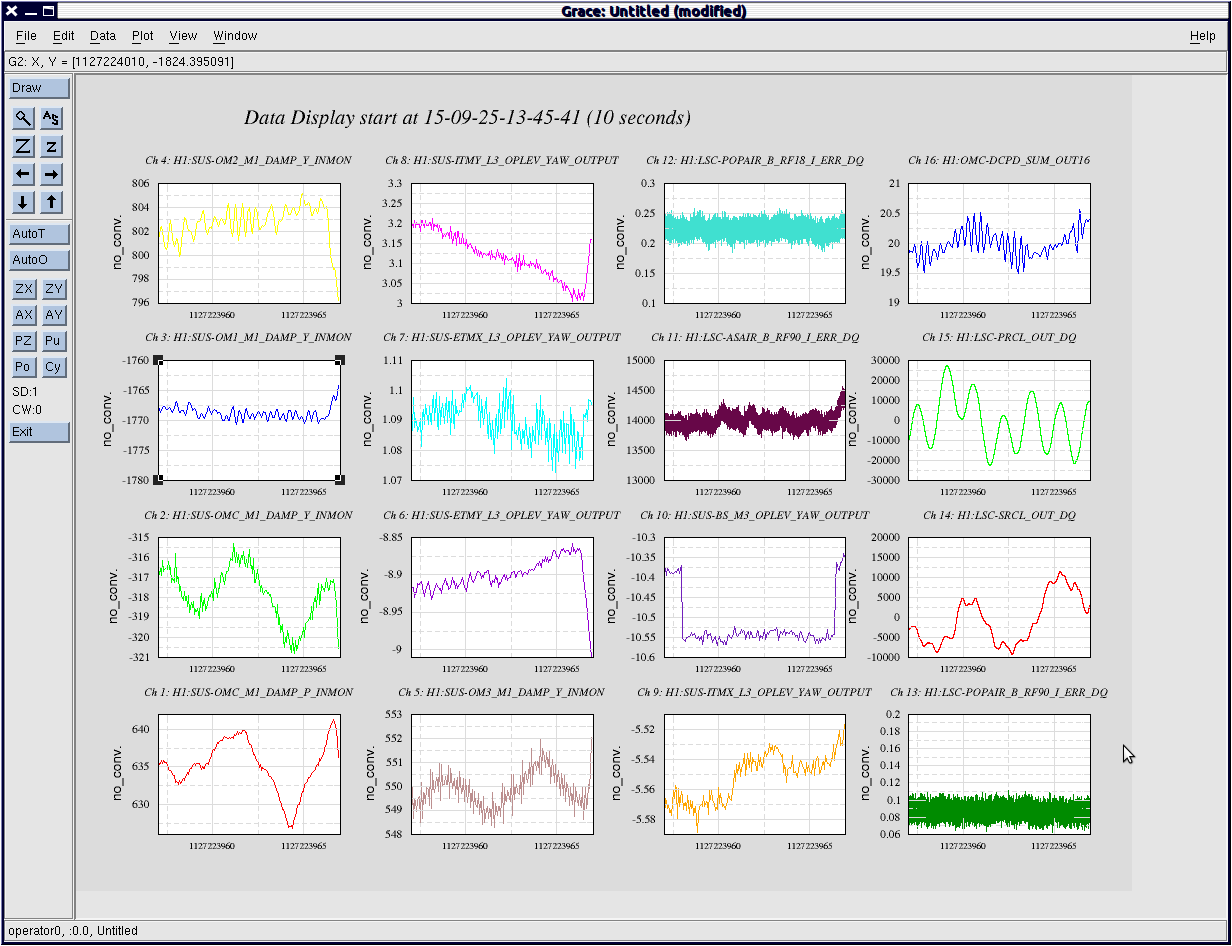
As I did these injections I had the SUS-ETMY_L3_ESDOUTF_LL_OUT channel open in dataviewer. I did not see any injection go above the 90000 counts. The highest was posterior0*.out which was near 80000 counts.