RickS, SudarshanK, CraigC, JeffreyK, DarkhanT
To calculate DARM time-varying parameters we use EPICS records precalculated from DARM OLG TF model, as described in T1500377-v7.
Earlier we reported that EP1 calculated from the canonical DARM model for ER8/O1 had an unexplained phase discrepancy (see LHO alog 21386) that came from measured TF taken between x_tst excitation point to DARM_ERR at cal. line frequency being off by -136.7 degrees compared to TF calculated accoring to Eq. 5 in T1500377 from DARM model. In this alog we outline current status of our investigations of this discrepancy.
The negative sign of the DARM feedback loop that was shown on the simplifed DARM loop diagram in T1500377-v7 was not placed where it actually appears. This update affects only how xtst line to DARM_ERR (and DARM_CTRL) TF is calculated in the DARM model; Pcal and xctrl line to DARM_ERR (and DARM_CTRL) TF equations remain valid in T1500377-v7.
Figure below shows the correct location of the sign flip of the DARM loop (that's not included into C, D or A) accroding to our investigations; we'll update T1500377 with the correct diagram in the next version. (notice that this simplified diagram, as it was cited in T1500377, was borrowed from G1500837 where it might also need to be corrected)

In ER8/O1, since now we have xtst (ESD) calibration line that is injected from the suspension front-end model (inside of the block "A" on the diagram), additional to the knowledge that the sign flip is between the xctrl (DARM line) excitation point and ΔLext, we also need to know the location of it w.r.t. the xtst excitation point.
With the -1 sign flip placed in the new location Eq. 5 and Eq. 7 in T1500377 should not have a "-1" factor. Hence, Eq. 19 will also not have a "-1" factor, meaning that our calculation of EP1 was incorrect by 180 degrees.
Currently there's an unexplained +44.4 degrees of discrepancy (instead of earlier -136.7) between measurement x_tst / DARM_ERR vs. the model itself, that appears in EP1 (we looked into the measurement of x_tst / DARM_ERR on Sep. 10). We are investigating the source of this discrepancy.
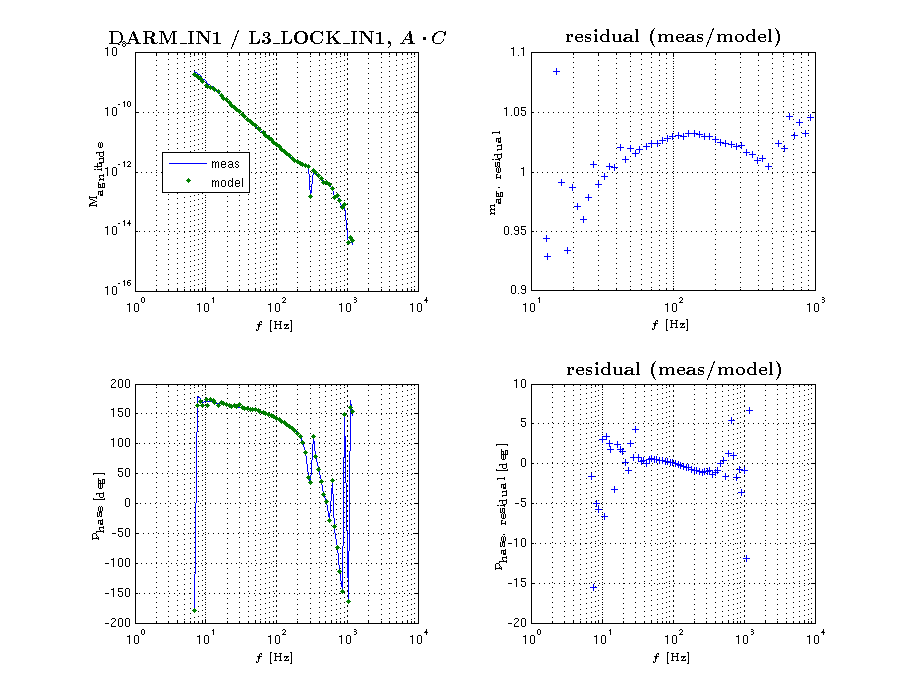
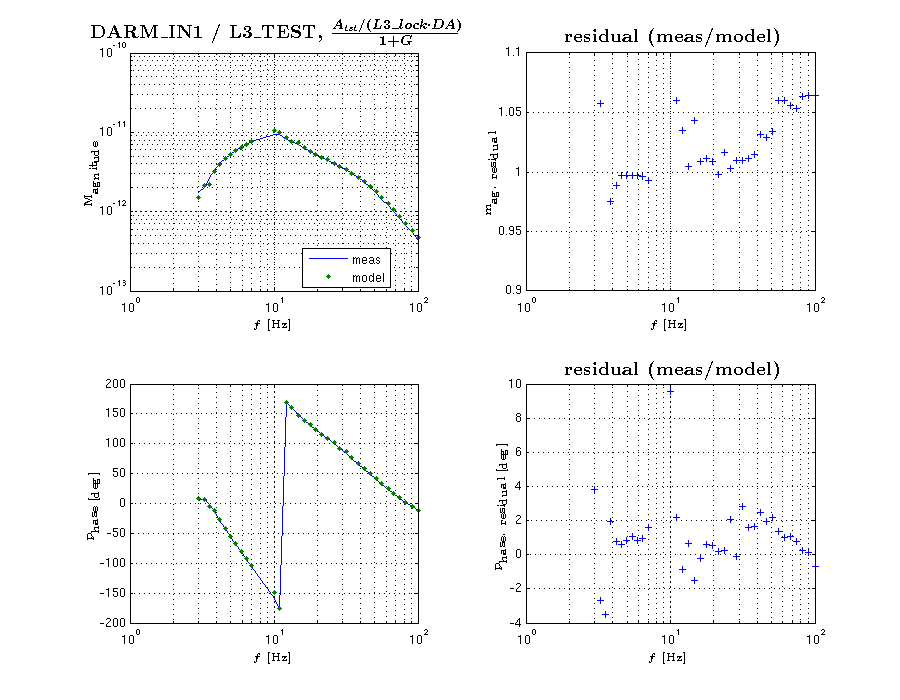
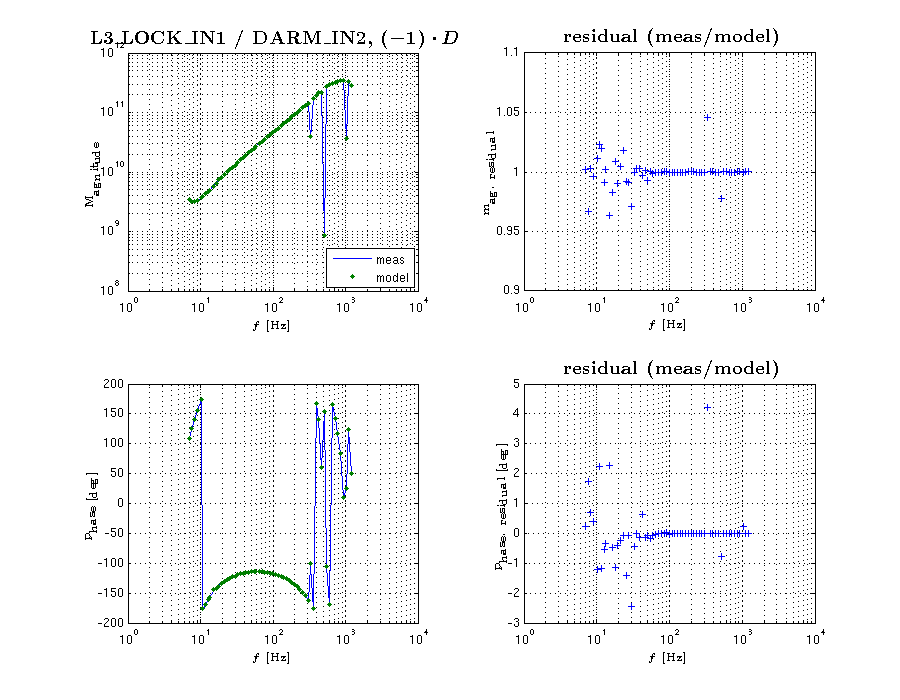
The location of the sign was confirmed by using measurements of
-
L3 stage (ESD) driver excitation to DARM_IN1 TF,
meas. file: CalSVN/Runs/ER8/H1/Measurements/FullIFOActuatorTFs/2015-08-29/2015-08-29_H1SUSETMY_L3toDARM_LVLN_LPON_FullLock.xml
-
input of "D" to input of "A" (exported from canonical DARM OLGTF measurement)
meas. file: CalSVN/Runs/ER8/H1/Measurements/DARMOLGTFs/2015-09-10_H1_DARM_OLGTF_7to1200Hz.xml
-
input of "A" to output of "C" (exported from canonical DARM OLGTF measurement)
meas. file: CalSVN/Runs/ER8/H1/Measurements/DARMOLGTFs/2015-09-10_H1_DARM_OLGTF_7to1200Hz.xml