We just loaded two minor guardian changes that should save us some time and locklosses during acquisition. They don't change anything about the configuration of the IFO in observing mode.
The first was the fix the issue that Jenne and Patrick wrote about 21508. When the SOFT loops had not converged before the gain was increased, it could cause us to loose lock (which could be because the SRC1 loop is strongly contaminated by these signals, and we see POP90 running away in the usual way.) I've simply added another if statement to the ENGAGE_ASC part 3 state, which will wait for all the SOFT loop control signals to become less than 500:
elif self.timer['ITMboost'] and self.counter==1:
if asc_convergence_checker(self.Soft_loops, self.Soft_P_thresh, self.Soft_Y_thresh):
# increase SOFT loop gain by 20dB
ezca.switch('ASC-DSOFT_P', 'FM1', 'OFF')
ezca.switch('ASC-DSOFT_Y', 'FM1', 'OFF')
ezca.switch('ASC-CSOFT_P', 'FM1', 'OFF')
ezca.switch('ASC-CSOFT_Y', 'FM1', 'OFF')
# turn on CHARD boosts
#ezca.switch('ASC-CHARD_P', 'FM3', 'ON') # No MsBoosts, JCD 12Aug2015
#ezca.switch('ASC-CHARD_Y', 'FM3', 'ON') # No MsBoosts, JCD 12Aug2015
#ezca.switch('ASC-CHARD_P', 'FM9', 'ON')
#ezca.switch('ASC-CHARD_Y', 'FM9', 'ON')
# turn off the PR3 PR3 wire heating compenstation
ezca.switch('SUS-PR3_M1_DRIVEALIGN_P2P', 'OFFSET', 'OFF')
#turn up SRC2 gains, turn on LPFs
ezca['ASC-SRC2_Y_GAIN']=40
ezca.switch('ASC-SRC2_P', 'FM10', 'ON')
ezca.switch('ASC-SRC2_Y', 'FM10', 'ON')
self.counter = 2
elif self.counter==2:
ezca.switch('ASC-DHARD_P', 'FM1', 'ON')
return True
elif self.timer['ITMboost'] and self.counter==1:
if asc_convergence_checker(self.Soft_loops, self.Soft_P_thresh, self.Soft_Y_thresh):
# increase SOFT loop gain by 20dB
ezca.switch('ASC-DSOFT_P', 'FM1', 'OFF')
ezca.switch('ASC-DSOFT_Y', 'FM1', 'OFF')
ezca.switch('ASC-CSOFT_P', 'FM1', 'OFF')
ezca.switch('ASC-CSOFT_Y', 'FM1', 'OFF')
If you are curious to see why you are waiting, you can open the log and it will tell you which loops it thinks have not converged.
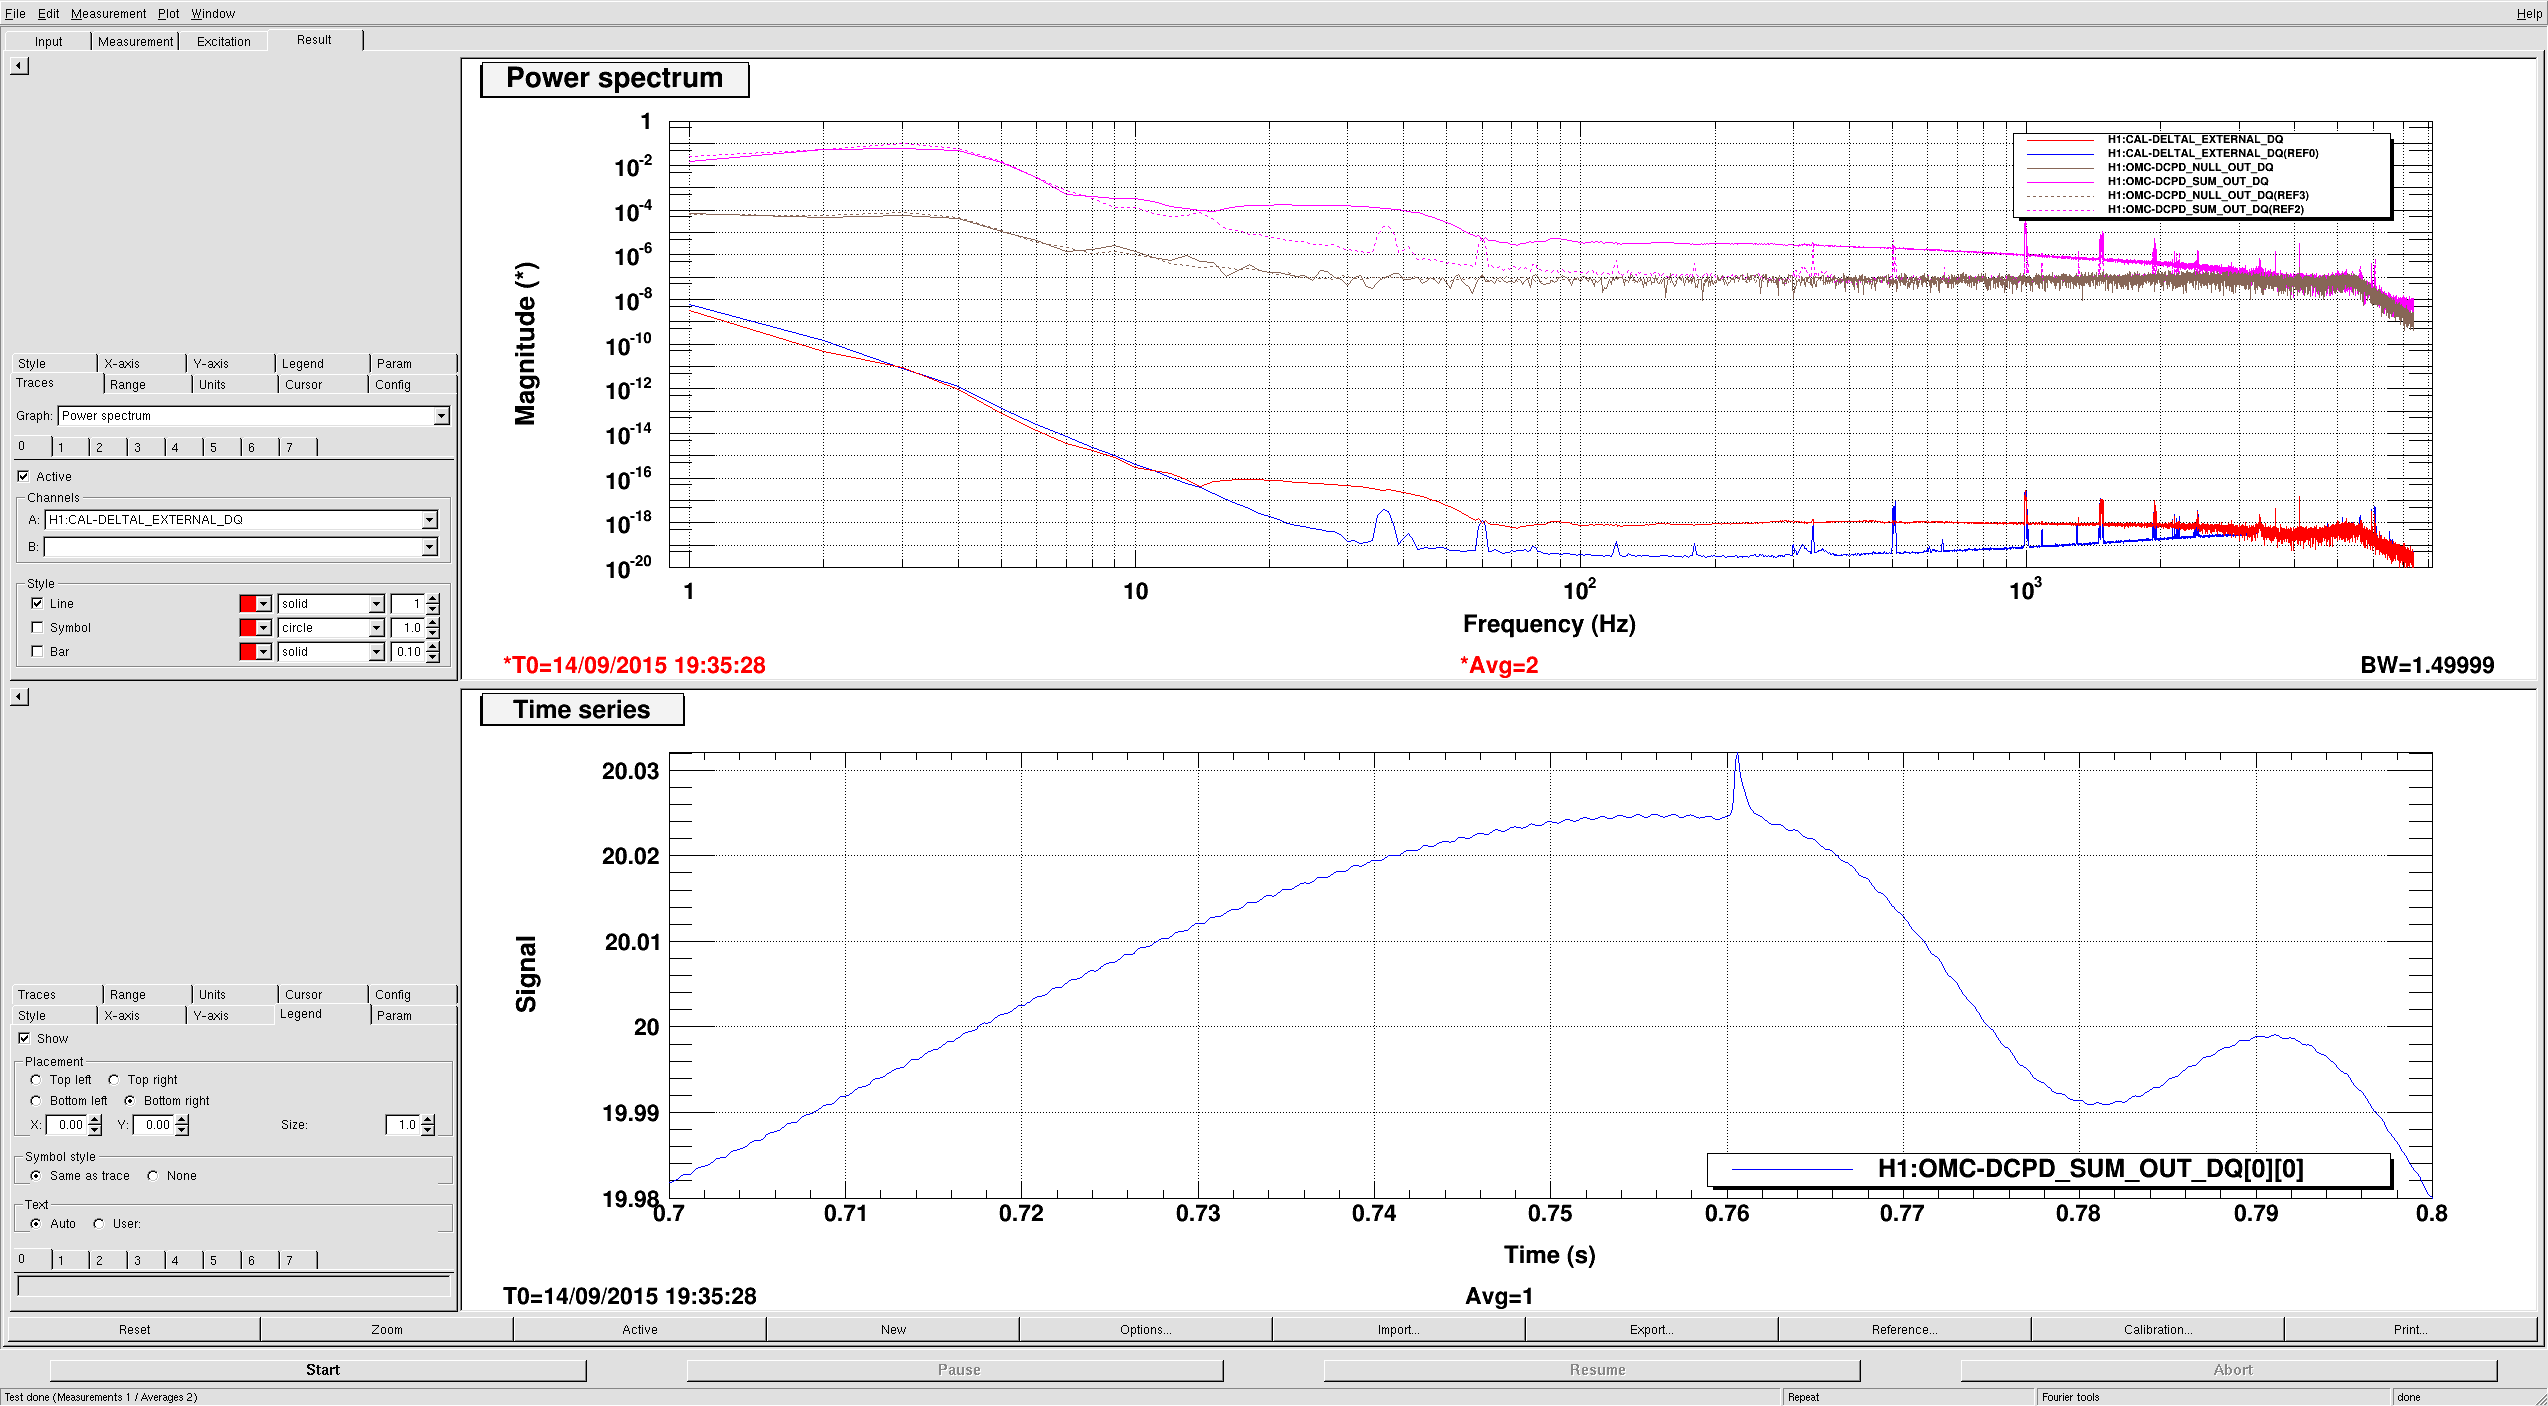
The second change was to the ALS ARM guardians. This morning Patrick noticed that the XARM was not well aligned in green after he offloaded the green WFS. The attached screnshot shows what happened. While The green WFS were aligning the arm (guardian state -18), there was a rather large change in the drive to the arm (the LSC-X_ARM channel is calibrated in um), which seems to be the dominant contribution to the GREEN WFS control signal for ETM pitch (ETMX_M0_LOCK_P). We offloaded this control signal, which was mostly compensating for pitch induced by the slow length signal to the alignment sliders. After arm drops lock and the slow length signal goes away, the arm is misalined. We would have then gone on to use this bad arm alignment as a reference for inital alingment. This may be one of the reasons that our inital alingment doesn't always result in a good alingment.
One good solution to this problem would have been to work on the length to pitch decoupling for the ETMs, but we don't want to spend time on that now. Instead, are changing the inital alingment procedure to no longer use slow feedback to the ETMs while we are running green WFS. We tried this with ground motion around 0.1 um/sec in the 0.03-0.1 Hz band, and it was OK. In high ground motion, operators may have trouble keeping the arm locked because the end station VCO could run out of range. However, I think this is better than having something that appears to work but results in a poor alingment.
This uses existing gaurdian states, I've simply renamed the state that used to be LOCK_NO_SLOW to INITAL_ALIGNMENT, so that it is clear which state we are using, made it requestable, and connected it to OFFLOAD_GREEN_WFS in the graph.
We haven't had a chance to test either of these, but they are relatively simple code changes and they should save us time in relocking. I've commited ISC_LOCK(11665), ISC_DRMI (rev 11666), and the ALS guardians (11667).
The message for operators is: Use INITIAL_ALIGNMENT instead of locked_W_SLOW_FEEDBACK for the green arms durring inital alingment. If ENGAGE_ASC_PART3 takes a long time, don't worry about it. If its taking excessively long and we need to adjust the thresholds let me know. If you have any problems give me a call.