edmond.merilh@LIGO.ORG - posted 14:41, Monday 07 September 2015 (21269)
Lockloss
21:33UTC
21:33UTC
18:02UTC Intent Bit set
ER8 days 20,21. No restarts reported.
After the Earth settled down, I ran through an initial alignment (including dither alignment of TMSy) since the green alignment wasn't very good. Lots of locklosses on the way up at various places.
11:48 Dan leaves for Italy
12:00 Begin initial alignment
12:08 I notice that ALS_-Y_WFS_DOF_3_P_GAIN and ALS_-Y_WFS_DOF_3_Y_GAIN are flagged in SDF. I assume this is a result of the dither alignment of TMSy. I revert them.
13:12 lockloss @ SWITCH_TO_QPDS
13:25 lockloss @ RF_DARM
13:36 lockloss @ DRMI_ON_POP, possibly due to PRM saturation
13:43 lockloss @ SWITCH_TO_QPDS
13:46 lockloss @ FIND_IR
13:54 lockloss @ SWITCH_TO_QPDS
14:13 ISC_LOCK is stalled at DC_READOUT_TRANSITION. Looking at the code and OMC_LOCK log, I try re-requesting READY_FOR_HANDOFF in OMC_LOCK. It works, and ISC_LOCK carries on.
14:16 lockloss at ENGAGE_ISS_2ND_LOOP, conicident ETMy saturation
14:18 Seismos start showing more activity. USGS site reports another 6.2 EQ in New Zealand. The thunder from down under does us in again.
14:47 Observatory mode set to Earthquake
15:00 Good luck Ed!
Dan, Travis
During the earthquake tonight we finally closed the loop on the HAM6 power budget measurements. This is something Koji had asked for many, many months ago. orz
With IMC-PWR_IN at 2.2388 +/- 0.0004 watts (not sure about the calibration for this channel) and a single bounce off ITMY, we collected the following data (30 seconds of slow channels, uncertainties are stdevs) with the OMC locked & unlocked:
| OMC Unlocked | OMC Locked | |
| AS_A_DC_SUM_OUT [cnts] | 436.3 +/- 0.6 | 436.3 +/- 0.7 |
| AS_B_DC_SUM_OUT [cnts] | 427.3 +/- 0.07 | 427.5 +/- 0.7 |
| AS_C_SUM_OUT [cnts] | 289.8 +/- 0.2 | 289.8 +/- 0.3 |
| OMCR_A_SUM_OUT [cnts] | 142.1 +/- 0.2 | 23.3 +/- 0.1 |
| OMCR_B_SUM_OUT [cnts] | 150.7 +/- 0.1 | 22.9 +/- 0.1 |
| DCPD_A_OUT [mA] | -- | 1.775 +/- 0.0023 |
| DCPD_B_OUT [mA] | -- | 1.761 +/- 0.0023 |
| DCPD_SUM_OUT [mA] | 3.537 +/- 0.0046 |
AS_C has 36dB of whitening gain. The OMCRs and DCPDs have no DC whitening. I'm not sure about AS_A and AS_B (I think they have zero whitening, but I haven't looked at the electronics chain for the WFS DC signals so I'm not sure of the transimpedance, etc). Since AS_C gets 400ppm of the light entering HAM6, the total light into the chamber is:
289 counts / (1638.4 counts/V * 0.8 A/W * 1000 V/A * 2 * 36dB * 400ppm) = 4.38 mW
(PD responsivity = 0.8, QPD transimpedance = 1000 ohms, differential output = 2x, whitening gain = 36dB)
The alignment into the OMC is probably not perfect in this state, but the mode-matching for the carrier should be better than 90% -- same as here, since we apply central heating to ITMX. The modulation depths are also the same; the power in the carrier should be 94.3% of the total.
Dan, Travis
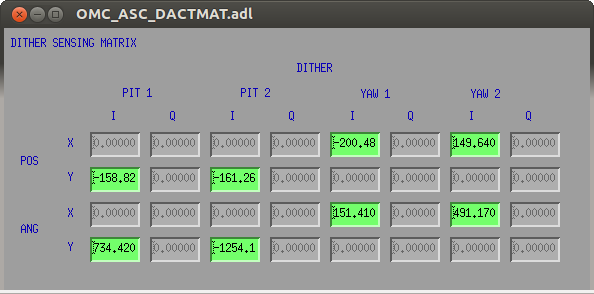
Following up on the measurement of the tip-tilt response at high frequencies, I've moved the OMC alignment dither lines up above 2kHz. The new frequencies are [2125.1, 2150.1, 2175.1, 2200.1] Hz. The amplitudes were slightly increased to maintain the same line height after the reduction in the tip-tilt response at high frequency. In the filter banks following the demodulation, I changed the frequencies of the elliptic filters that are used to notch the line frequencies post-demodulation.
To update the control scheme, I adjusted the phase rotation of the demodulated signals such that offsets in the alignment loops only showed up in the I phase signals. Striptools are the best way to do this. Then, I reran the ditherDCsense script to calculate a new sensing matrix, and closed the loops. Things looked pretty stable, so let's stick with this new arrangement. I attach a screenshot of the new sensing matrix.
If for some reason people get spooked and want to revert, do the following:
- set the frequencies back to what they were before: [P1, P2, Y1, Y2] --> [1675.1, 1700.1, 1725.1, 1750.1]
- set the oscillator CLK_GAINs to 100. The current CLK_GAINs are [150, 120, 100, 130].
- in the dither demodulation, for filter banks {P,Y}{1,2}_X_{SIN,COS}, switch from FM7,9 to FM8,10. These are pairs of ELPs that notch the dither line in the demodulated signal. They're used to squash high-frequency stuff from the control signal. It's probably excessive.
- set the R demod phases to 90. They are currently 135, 150, 150, and zero.
- use conlog to revert the sensing matrix. Look for changes to channels of the form "H1:OMC-ASC_DACTMAT*".
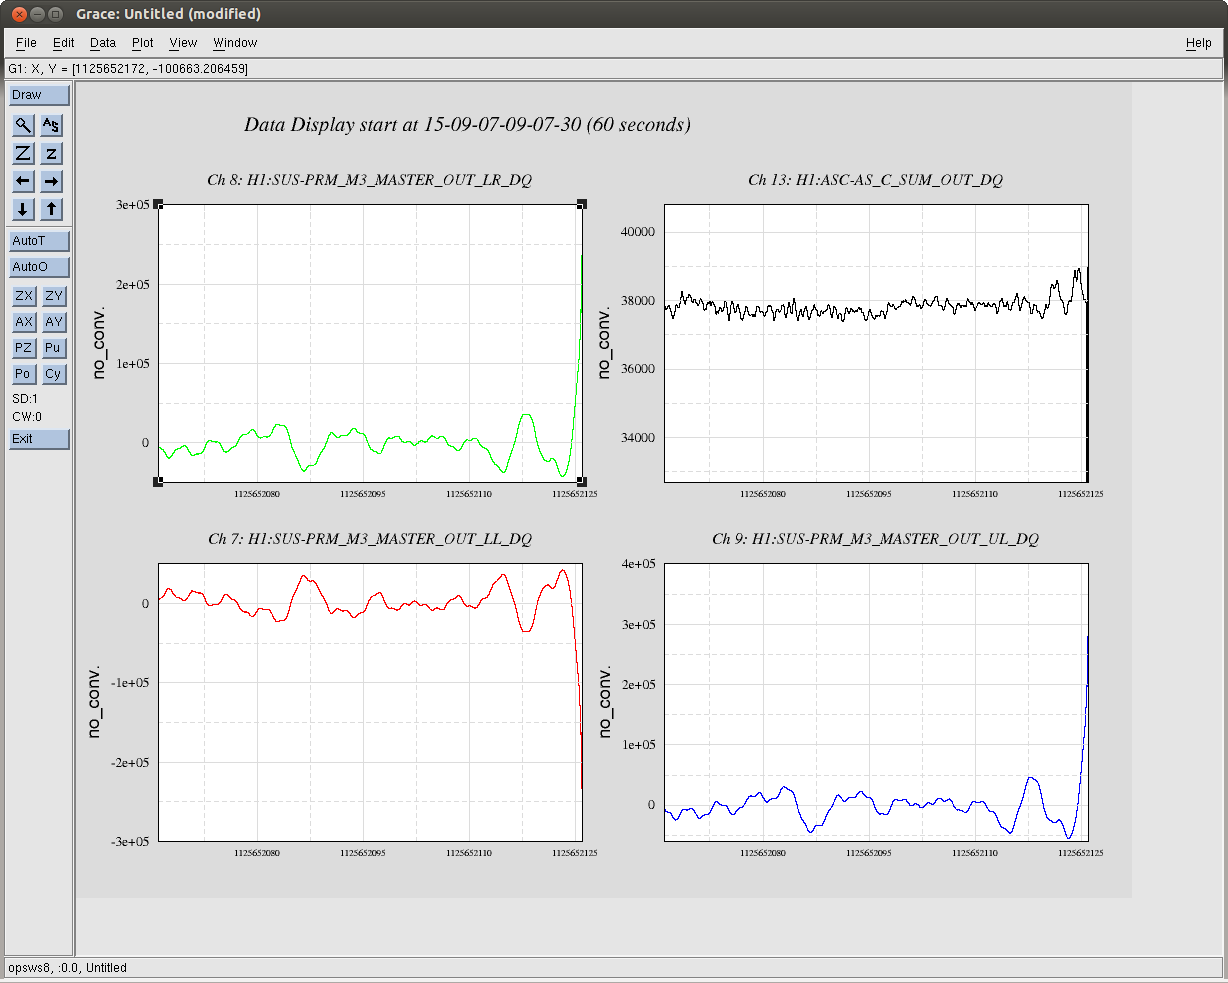
The SDF table has been updated with these new settings. We were all set to go back to science mode when the IFO lost lock, after 28 hours of good data. The lockloss was due to PRM M3 hitting the rails (see second plot), maybe because of a 6.4 earthquake, although the lockloss was about twenty minutes before the arrival time of the P-waves according to terramon.
What are the amplitudes of the dithers? Both in terms of mirror angle, and in BOSEM coil current (and then for both, the amplitudes relative to the beam divergence angle and to the max coil current).
The CW group is appreciative!
J. Kissel

To answer Peter's question, for an original amplitude of
       Freq    Amp
      [Hz]    [ct]
OM1   2125.1   150
      2150.1   120
OM3   2175.1   100
      2200.1   130
defined by the oscillator's clock gain in the OMC model, we propogatw it to the SUS model to the DRIVEALIGN matrix (which has ~10% off-diagonal elements), then through EULER2OSEM matrix, the DAC gain and the HAM-A coil driver + BOSEM coil transconductance, the current across the coil (assuming a 20/2^16 [V/ct], 16 bit DAC, and a HAM-A coil driver + BOSEM transconductance of 0.988 [mA/V] from T1200264):
Coil       UL          LL         UR          LR
          [mA]        [mA]       [mA]        [mA]
OM1      0.306       0.604      0.604       0.306
OM3      0.096       0.778      0.778       0.096
i.e. a coil current of at most ~0.8 [mA] at these frequencies,

And the displacement this causes on the HTTS (using 0.021 [N/A] from G1100968, a 0.048225 lever arm from D1001428, and the HTTS dynamical model at each frequency from using the httsopt_damp parameter set for the ssmake1MBf production single-stage suspension model):
                   P            Y
                 [rad]        [rad]
OM1   2125.1    3.37e-10    2.74e-10
      2150.1    3.21e-10    2.62e-10

OM3   2175.1    2.52e-10    2.01e-10
      2200.1    2.41e-10    1.92e-10
i.e. a displacement of roughly 3e-10 [rad] in both pitch and yaw at these frequencies.
Nutsinee handed over an IFO that had been locked for over 28 hours. Unfortunately, an EQ in New Zealand took us down. It appears that PRM had saturated, taking down DRMI a few minutes before the EQ arrived, but the EQ has prevented us from relocking for over an hour now as the Earth calms back down.
7:30 LLO dropped lock, went to commissioning mode for a few minutes so Nutsinee and Dan could look at a few things
9:08 Lockloss (Guardian reports that the OMC SW watchdog has tripped and that DRMI has unlocked)
9:40 I begin initial alignment after seeing that ALS isn't well aligned post lockloss
9:44 After noticing that the alignment is wavering, Dan notices that TerraMon is reporting an EQ in New Zealand. Site seismos start reporting the same things soon after. Initial alignment is paused to wait for calmer conditions.
9:44 I notice a timing error on the CDS overview for ETMx. ETMy already has one which a note from Ed says should be reset after lockloss.
10:53 ETMy timing error reset (as per Ed's note). ETMx timing error is NOT reset (not sure if I should, emailed DaveB for advice).
(All time in UTC)
23:00 Take over from Ed. IFO has been locking and observing. Dick's inside optics lab.
01:21 Dick out of the lab.
05:00 Dan's on site. Will be here for the rest of the night.
07:00 The ifo has been locking over 26 hours now! Handing off to Travis.
- Quiet shift. Wind still below 20 mph. No seismic activity. Saturation alarm hasn't been complaining about anything else other than ETMY, which has been the only source of big glitches on the DMT Omega.
- Camera 3 control was very slow. At one point I thought it was busted. Seems to be working fine again.
The interferometer is still locking and going strong. Wind below 20 mph. Quiet seismic activity. No one on site but me. I'm hoping for another record breaking lock stretch!
LLO has been locking and observing over the past two hours.
The ifo has been locked 24 hours now!
Summary:
Shift was quiet. Wind starting picking up just a little but not more than 20mph. IFO locked the entire shift with only about 5 glitches noted in my activity log. Spoke to Tom Evans for a while to ask about their Observation Intent Bit issue. Their solution can be found in their aLog. Spoke to Dave Barker about “to clear or not to clear” the timing error that occurred in ETMY GDS TP. He will bring that up at the CDS meeting on Tues. Handing off to Nutsinee.
ACTIVITY LOG:
16:55 William from LLO hailed me to ask abut a problem he’s having with the Observation Intent Bit changing states by itself after a period of 30-40 minutes. I suggested he look to Jamie or Joe B. for his answer.
17:03 ETMY saturation
17:57 ETMY saturation
19:31 ETMY saturation
19:45 ETMY saturation
20:01 Noticed a timing error in H1SUSETMY. As I understand, this is due to the speed of the new computer and is of no consequence? I will leave it be until I hear otherwise. I’ve e-mailed Dave to ask wether I should come out of Observing to reset this error or just leave it as is.
20:59 ETMY saturation
the wind picked up a few minutes ago to about just under 20mph
21:38 Gustafson on site and going into the optics lab.
22:55 Nutsinee here
Arrival:
16:26UTC - Interestingly, the range has trended back up to 71.5Mpc despite no noticeable downward trend in the microseism.
~13:00 - 13:09 UTC Stepped out of control room.
14:49 UTC dust monitor invalid alarm at end X

Remainder of shift quiet. Range seems to be slightly dropping with slow increase in microseism.

Handing off the Ed.
|
Injection |
Time of first injection, UTC |
Injection spacing |
Total number of injections |
Good channels for environmental signal |
|
|
Sept. 5 |
|
|
|
|
crowd (10 people) walking randomly for 2 or 3s periods in control room |
1:39:00 |
5s |
12 |
HAM2 seismometer, vertex seismometer H1:PEM-CS_ACC_LVEAFLOOR_HAM1_Z
|
|
crowd (10 people) walking randomly in hall just outside control room |
1:41:00 |
5s |
12 |
same |
|
External door near control room shutting by itself |
1:44:00 |
5s |
12 |
same |
|
chair rolling in control room (most common chair) |
1:46:00 |
5s |
12 |
same |
|
Single large steps in control room |
1:50:00 |
5s |
12 |
same |
|
Airlock door (door to lab area near control room) shut by hand |
1:52:00 |
5s |
12 |
same |
|
slamming office door (Sheila, Kiwamu, Me) |
1:54:00 |
5s |
12 |
same |
|
hammer dropped from waist height in vacuum lab |
1:59:00 |
5s |
12 |
same |
|
setting car battery down in OSB shipping area |
2:02:00 |
5s |
12 |
same |
|
continuous bouncing for 5s on exercise/seating ball |
2:07:00 |
10s |
6 |
same |
I've attached the result. Quick observation from the spectrograms tell me that dropping hammer from waist height in vacuum lab (aka Kyle's lab) and setting car battery down in OSB shipping area coupled into DARM.
Instead of plotting the spectogram starting at the time of injection, this time I did +/- 10 seconds instead so it's more clear when the injection started and when it's ended.
Since I have never really explained what I did in finding noises in the sensors and in DARM, I'm taking some time to explain it in this alog. First I looked for injections in appropreiate sensors (accelerometer, microphone, seismometer). I zoomed in the spectrograms until I get the signal to show up >3 pixels or so in both frequency and time domain (as Robert suggested). Once I was certain that the injections were there, I went to look for them in DARM. I started with the same frequency range that the injections showed up in the sensors I used, if I couldn't find anything then I move up/down in frequency domain to look for any possible up/down conversions with increments depending on how wide the injections were in terms of frequency. Until I reached the lowest/highest frequency that the injections could possibly showed up, if I still didn't see anything only then I would conclude that the injections didn't show up in DARM.
More investigations on how some of these injections coupled into DARM will take days, weeks, I don't know. The point of these injections was to determine what activities can and cannot be performed during Observing run. This is why I posted spectrograms first and not wait until I'm done with the analyses. I simply let DARM spectrogram speaks for itself.
I have also attached better spectrograms of the super ball injection, produced using Dan's script.
Stefan, Evan
This is an analysis that Daniel suggested a while ago.
When we increase the interferometer power from 3 W to 24 W, we increase the common-mode radiation force on the test masses. Since the suspensions are compliant, this produces an extra displacement in the test masses along the beamline relative to their suspension points. The CARM loop senses this common-mode displacement and compensates by applying a slow control voltage to the IMC VCO. This control voltage is offloaded to the UIMs of the end station suspensions, and then subsequently to the endstation HEPIs, thereby moving the suspension points of the ETMs forward so as to cancel the radiation-induced displacement. Therefore, an appropriately calibrated HEPI tidal signal can be used to estimate the amount of power circulating in the arms.
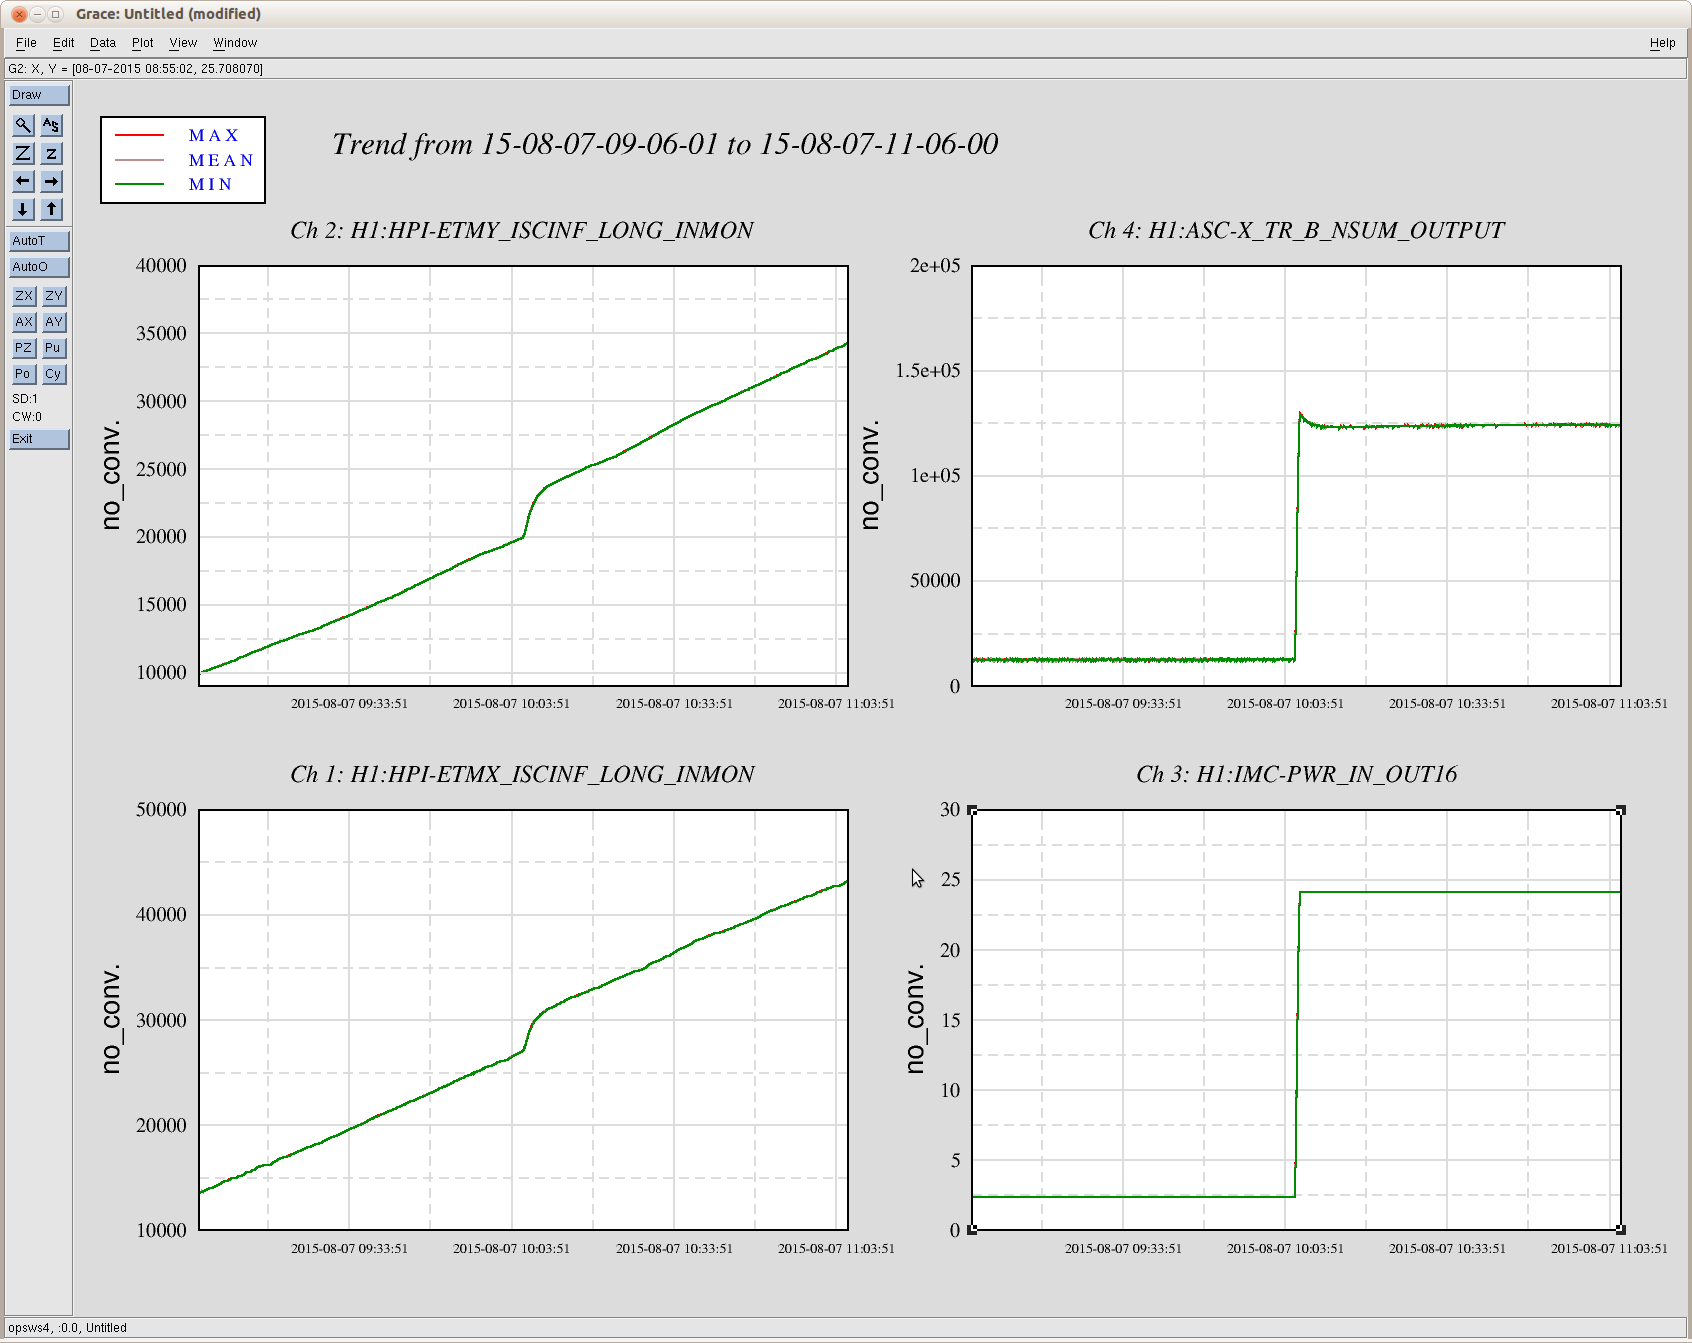
We looked at a data stretch from 2015-08-07, when we had been sitting at 3 W for a while and then powered up cleanly to 24 W, and found the following:
On the other hand, when we make a similar estimate from the end-station QPDs, we have something like 24 W × 0.88 × 1/2 × 40 W/W × 283 W/W = 120 kW. [The factor of 0.88 is the modecleaner transmission.]
The calibration of the HEPI tidal signals into nanometers is sort of loose [to within 10%?], according to Hugh. Similarly, there is some spread in the power inferred from the endstation QPDs, which gives an uncertainty that is also on the order of 10%. With a more precise HEPI calibration, perhaps we could use this method to better constrain the optical calibration.
Hugh, Richard, and I had a discussion about the precision of the HEPI calibration, and in the end Richard suggested to just measure the calibration in some locked interferometer configuration (whereby we could read out some calibrated control signal).
I had a go at this by locking ALS DIFF (with IMC F offloading off) and driving HEPI at 200 mHz, with the goal of calibrating HEPI against the PLL. I got an OK measurement by driving 100 nm pk for 8 minutes or so, but then Jim and Hugh pointed out that the ISI was already suppressing some of the HEPI drive, so the measurement probably had significant systematic error. Additionally, Daniel was skeptical that one could cleanly separate length and angle changes on the test mass (both of which can contribute to the sensed CARM displacement).
Jim, Dan, and I thought a bit about this, and (to make a long story short) we forwent HEPI calibration entirely. Instead, we decided to lock the interferometer at 2.2 W, turn off the offloading of the UIMs to the HEPIs, and then power up. The dc portion of the CARM control signal should then accumulate on the UIMs. Since the calibration group already produces estimates of the dc UIM calibration for EY (the ER7 estimate was 5.1×10⁻¹¹ m/ct), we therefore already have a calibrated readout of the displacement induced by the circulating power (again neglecting angle effects). I don't think the calibration group produces similar estimates for the EX UIM.
This power-up happened around 2015-09-03 09:56:30, from 2.2 W to 22.4 W. I did a linear fit of the UIM drive before and after the power up (see attached). The initial/final slopes are 5.32 nm/s and 5.06 nm/s, so there is some error here in determining the amount of radiation-induced drive (about 10 %). Using the ER7 EY UIM calibration, the amount of radiation-induced UIM displacement is 2.95(30) µm. Using the formulas described above, this translates to a circulating power in the Y arm of 95(10) kW.

