nutsinee.kijbunchoo@LIGO.ORG - posted 21:48, Saturday 05 September 2015 (21247)
Back to Observing
04:47 UTC at 71 Mpc.
04:47 UTC at 71 Mpc.
ER8 Day 19, no restarts reported
After I got the IMC back up (it had trouble locking itself so I touched MC2 pitch a little), the wind picked up speed. It has just reached 40 mph and the forecast says it should come down in 3 hours or so. I'm waiting for the wind to calm down before moving on. Hopefully I don't have to wait 3 hours...
Kiwamu, Sheila, Evan
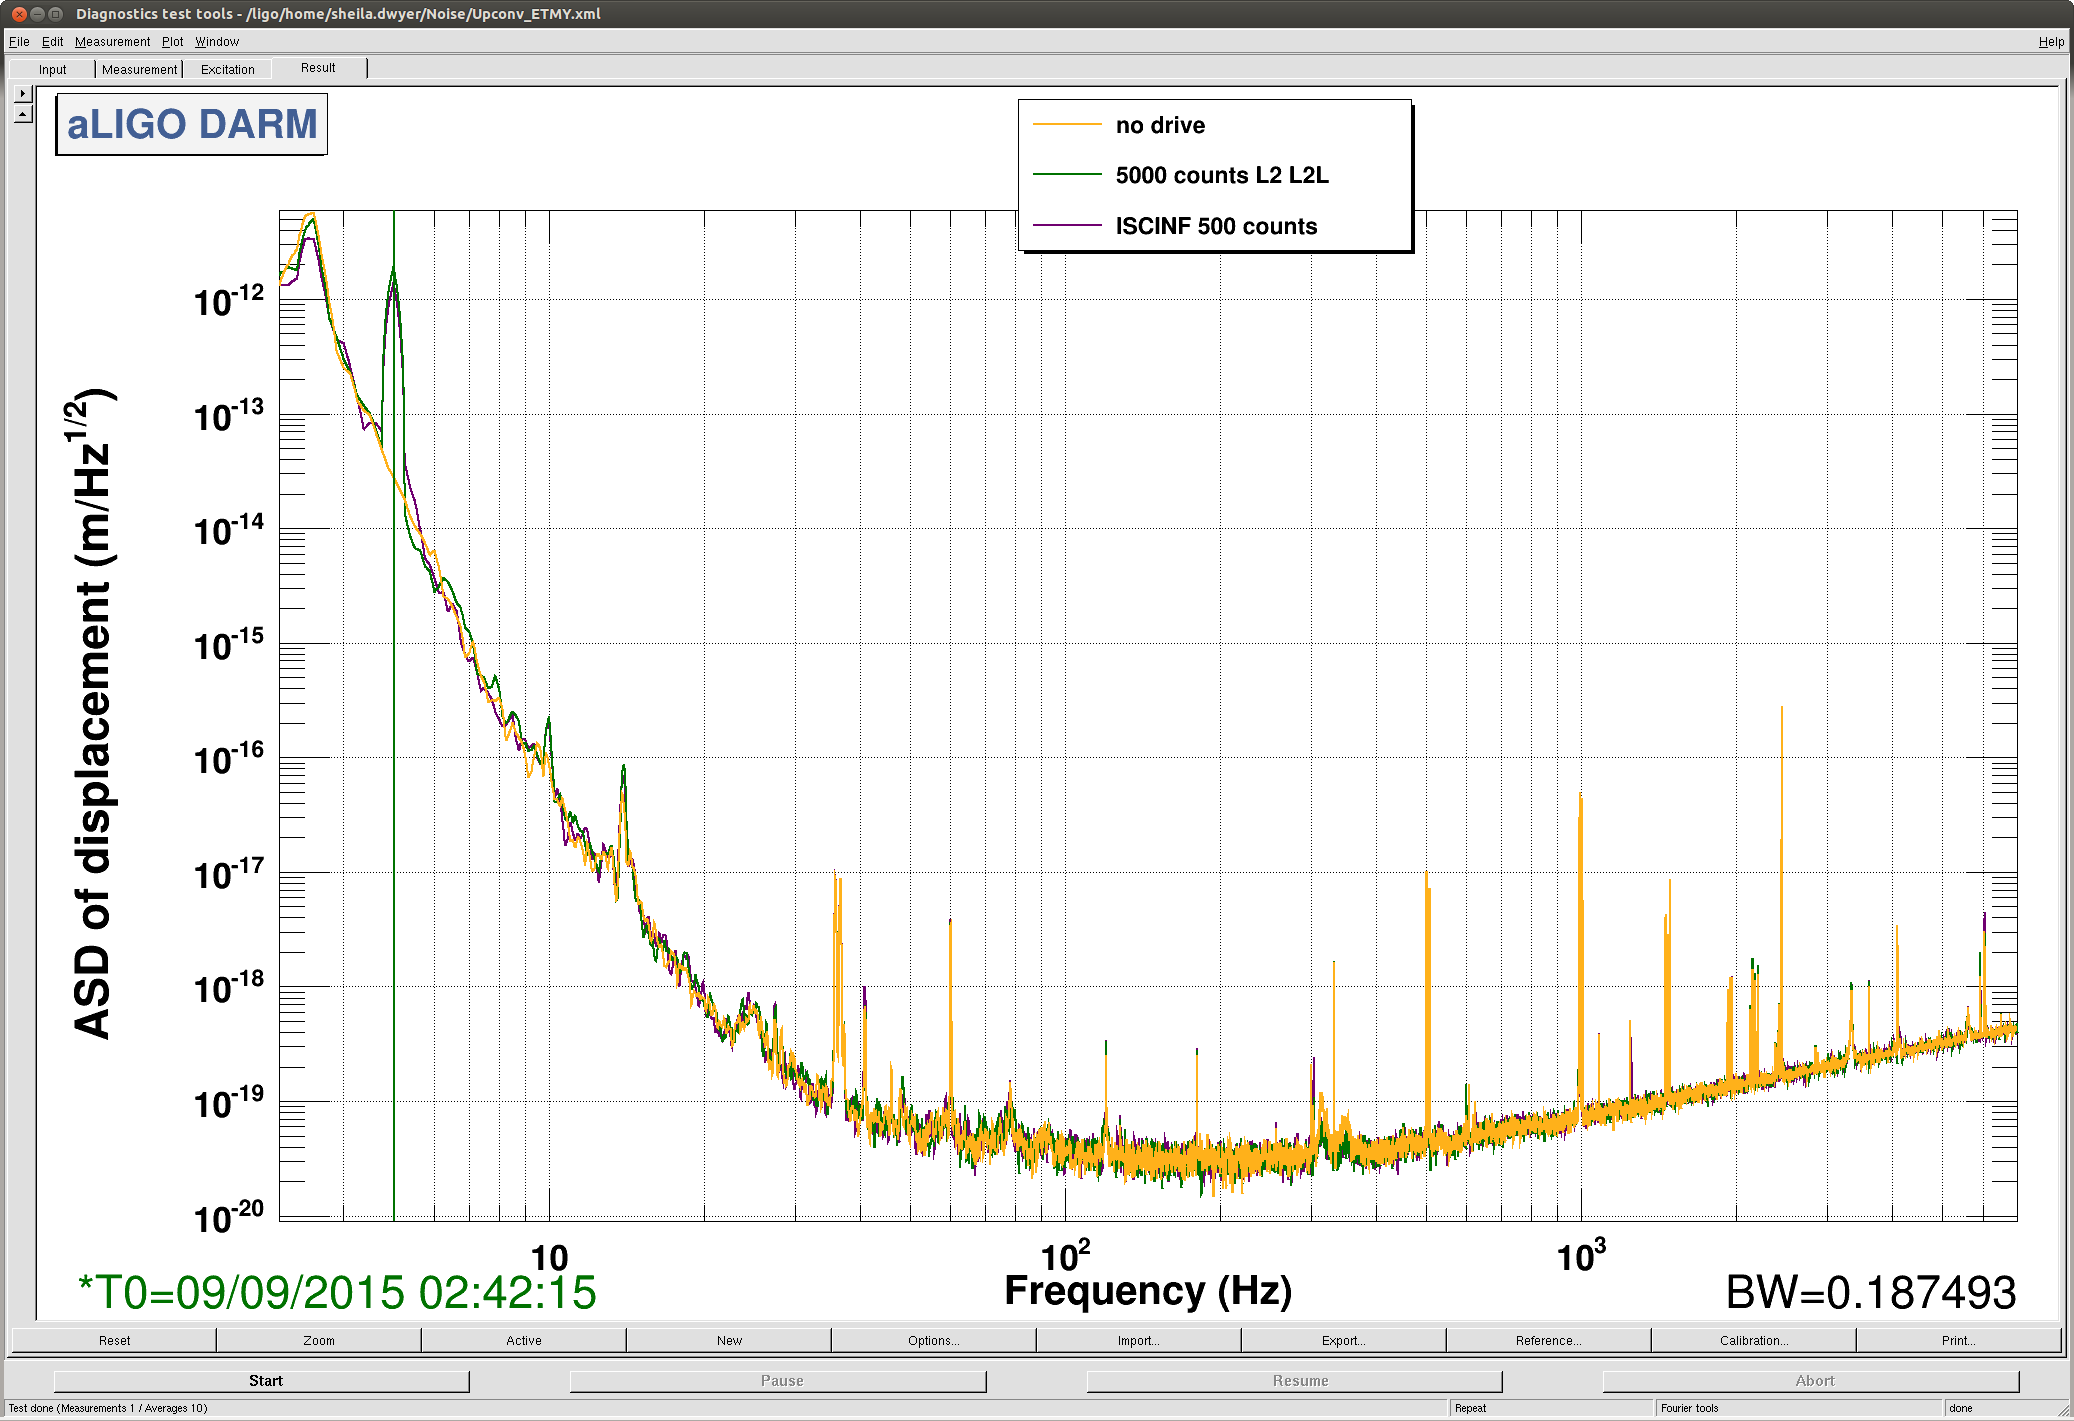
Durring the calibration activities last week Kiwamu noticed that there was upconversion of the drive from ETMY. Specifically when he drove in the L3 LOCK filter, he saw a second harmonic. When he drove each stage individually, through the test filter bank with a similar amplitide he saw no evidence for upconversion. This suggests that the upconversion might come about by driving mutliple stages, or through the length 2 angle paths.
We went back through the data and looked at the relative heights of the peaks. We also calculated a ratio of the amplitude of the second harmonic to the square of the amplitude at the fundamental :
ASD(2f) = alpha * (ASD(1f))^2
| drive Frequency (Hz_ | amplitude at drive frequency (m/rt Hz) | amplitude at second harmonic (m/rt Hz) | alpha (1/m) |
| 4.98 | 5.8e-14 | 2e-15 | 5.9e11 |
| 5.9 | 5.6e-14 | 9.8e-16 | 3.1e11 |
| 6.4 | 3e-14 | 2.8e-16 | 3.1e11 |
| 10 | 3.6e-15 | 2.8e-18 | 2.2e11 |
If we ignore other frequencies which could mix and only consider the second harmonics of DARM control, we would expect this upconversion to be something like a factor of 10 below our measured noise at 20 Hz, and near the measured noise at 10 Hz.
The next step is probably to identify which stages contribute to this upconversion, for example it seems probable that this is only noticeable for frequencies where L2 get a significant fraction of the DARM control signal.
We made some injections into ETMY to check when exactly this upconversion shows up. It is much smaller today than it was durring Kiwmau's measurement.
An injectionat 5 Hz (500 counts in ISCINF) that increased the DARM noise there by a factor of 67 produced a peak at 10 Hz that is a factor of 2.6 above the noise floor. We also injected in L2 L2L (which will bypass the L2P and L2Y filters) to produce a simlar peak, and got a similarly low level of noise at 10 Hz.
It may be that part of the problem durring Kiwamu's measurement was that some ASC loops were accidentaly off.
Summary:
Shift was mostly quiet. Some glitching. Wind starting picking up ~ 3 hours ago gusting to around 35mph. Recovery after Lockloss is proving to be a bit of a chore. Mode Cleaner is unlocked and trying to relock but the curious thing is while the REFL shows it trying to lock in flashes the TRANS isn’t showing sympathetic flashing. hmm. Handing off to Nutsinee.
ACTIVITY LOG:
16:21 a glitch occurred between 50Hz and 300Hz
16:25 Robert on site. He suggests that high frequency noise in an oscillator is causing the lack of normal range.
16:58 ETMY glitch
17:30 EX Pump differential pressure alarm going off.(yellow)
17:41 ETMY saturating for ~ 1 minute repeatedly.
17:42 OMC DCPD saturated a couple of times. WE SURVIVED THE GLITCHES.
17:43 Noticed the landscapers are here for tumbleweed/weed control. (as scheduled)
18:00 Landscapers moved their truck from the LSB to the OSB
18:03 LLO in Observing mode
18:15 Kiwamu on site
22:03 Lockloss
22:13 Locking ALS giving a bit of trouble in the X dept.
23:00 Still trying to get arms locked and setlled. Handing off to Nutsinee
LOCK LOG:
22:03 Lock Loss - PRM saturating
Strange thing is, Guardian tried to go straight to LOCK_DRMI_1F?? It then proceeded to LOCKLOSS and then DOWN. It then proceeded normally.
The guardian checks for locklosses of the mode cleaner and DRMI, and it is just a roll of the dice which it will noticed first. In the early stages of lock acquisition it makes sense to proceed to LOCK_DRMI if only DRMI has lost lock, that saves us from unecesarily relocking ALS. In full lock I agree tihs doesn't really make sense, but if the guardian goes to LOCK_DRMI after a lockloss it will imediately proceed to lockloss as you saw.
22:03UTC LockLoss after PRM saturation. Wind has increased gusting to ~30 at times. Not sure what caused the break. Trying to re-align ALS.
ALL TIMES IN UTC
Arrival:
Mid-Shift Summary:
IFO locked. Range is ~60Mpc probably due to HF noise in DARM. According to Kiwamu, this could also be a difference in calibration that we experience from lock to lock. I spoke with WIlliam Parker and Tom Evans at Livingston and they reported their trouble locking https://alog.ligo-la.caltech.edu/aLOG/index.php?callRep=20285. LLO back up at ~17:50UTC. Robert Schofield has been on site since 16:25UTC. Also, at ~17:43UTC I noticed the landscapers clearing tumbleweed and debris in the gravel in front of the LSB. LLO set their Intent Bit at 18:03UTC. Seismic activity has settled back to reasonably nominal levels and the wind speeds remain unobtrusive.
11:28 UTC Dan left. All alone.
13:08 UTC Checked IP 9. Both A and B Pumps high voltage near 7 kV.
13:44 UTC Lost lock, earthquake 4.5 154km S of Atka, Alaska 2015-09-05 13:04:34 UTC39.0 km deep
14:16 UTC Restarted alarm script on video5: line 139 in lock_end science = seconds_to_hms(sum(science_segs)) NameError: global name 'seconds_to_hms' is not defined
14:40 UTC Back to observing mode, range is down around 60 Mpc. Is this left over from earlier problem Dan ran into?

In observing mode around 60 Mpc. Handing off to Ed.
Dan, Evan
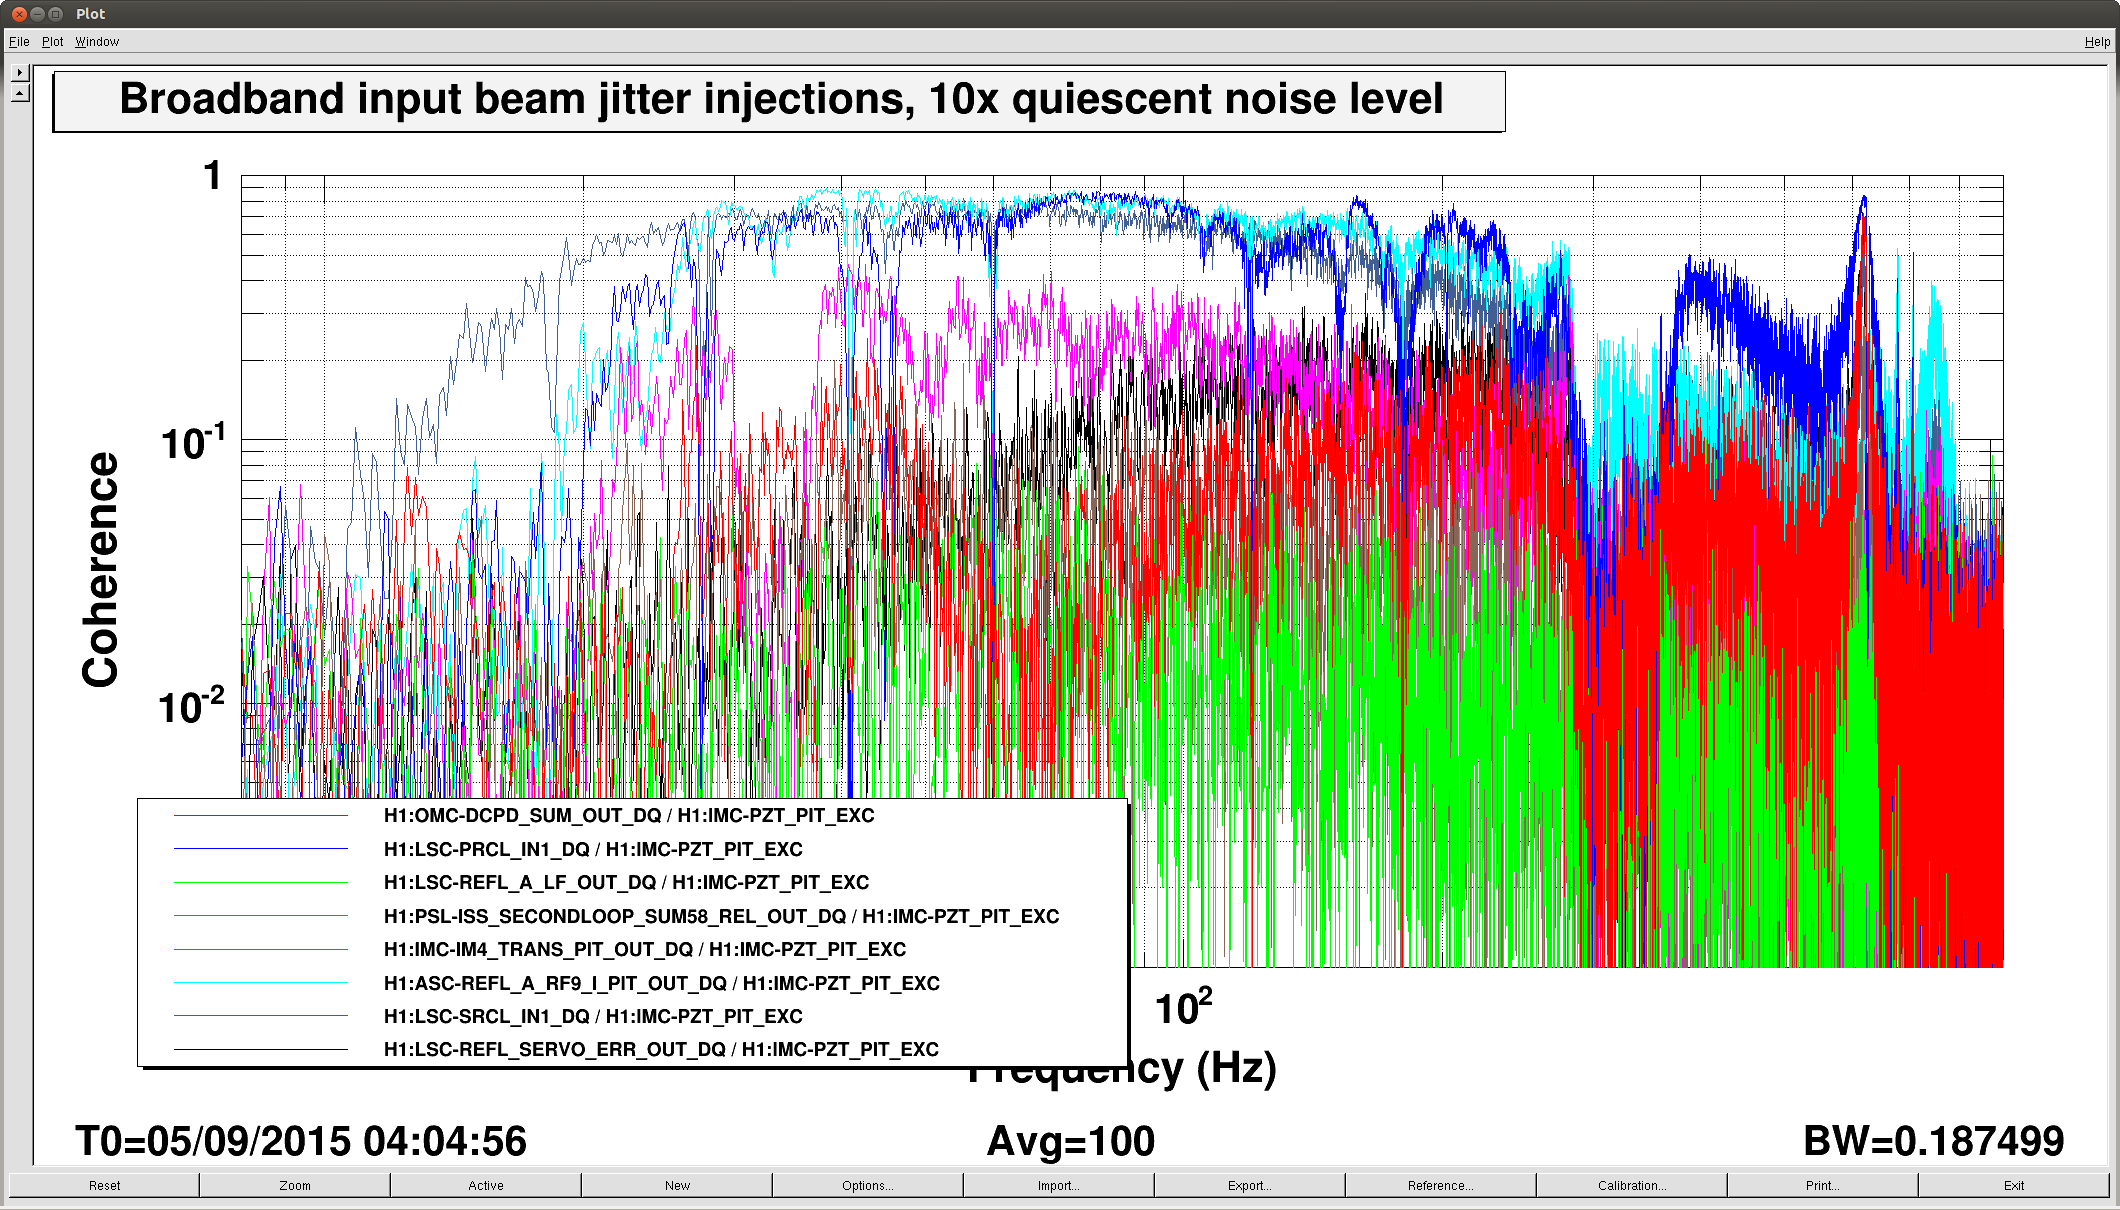
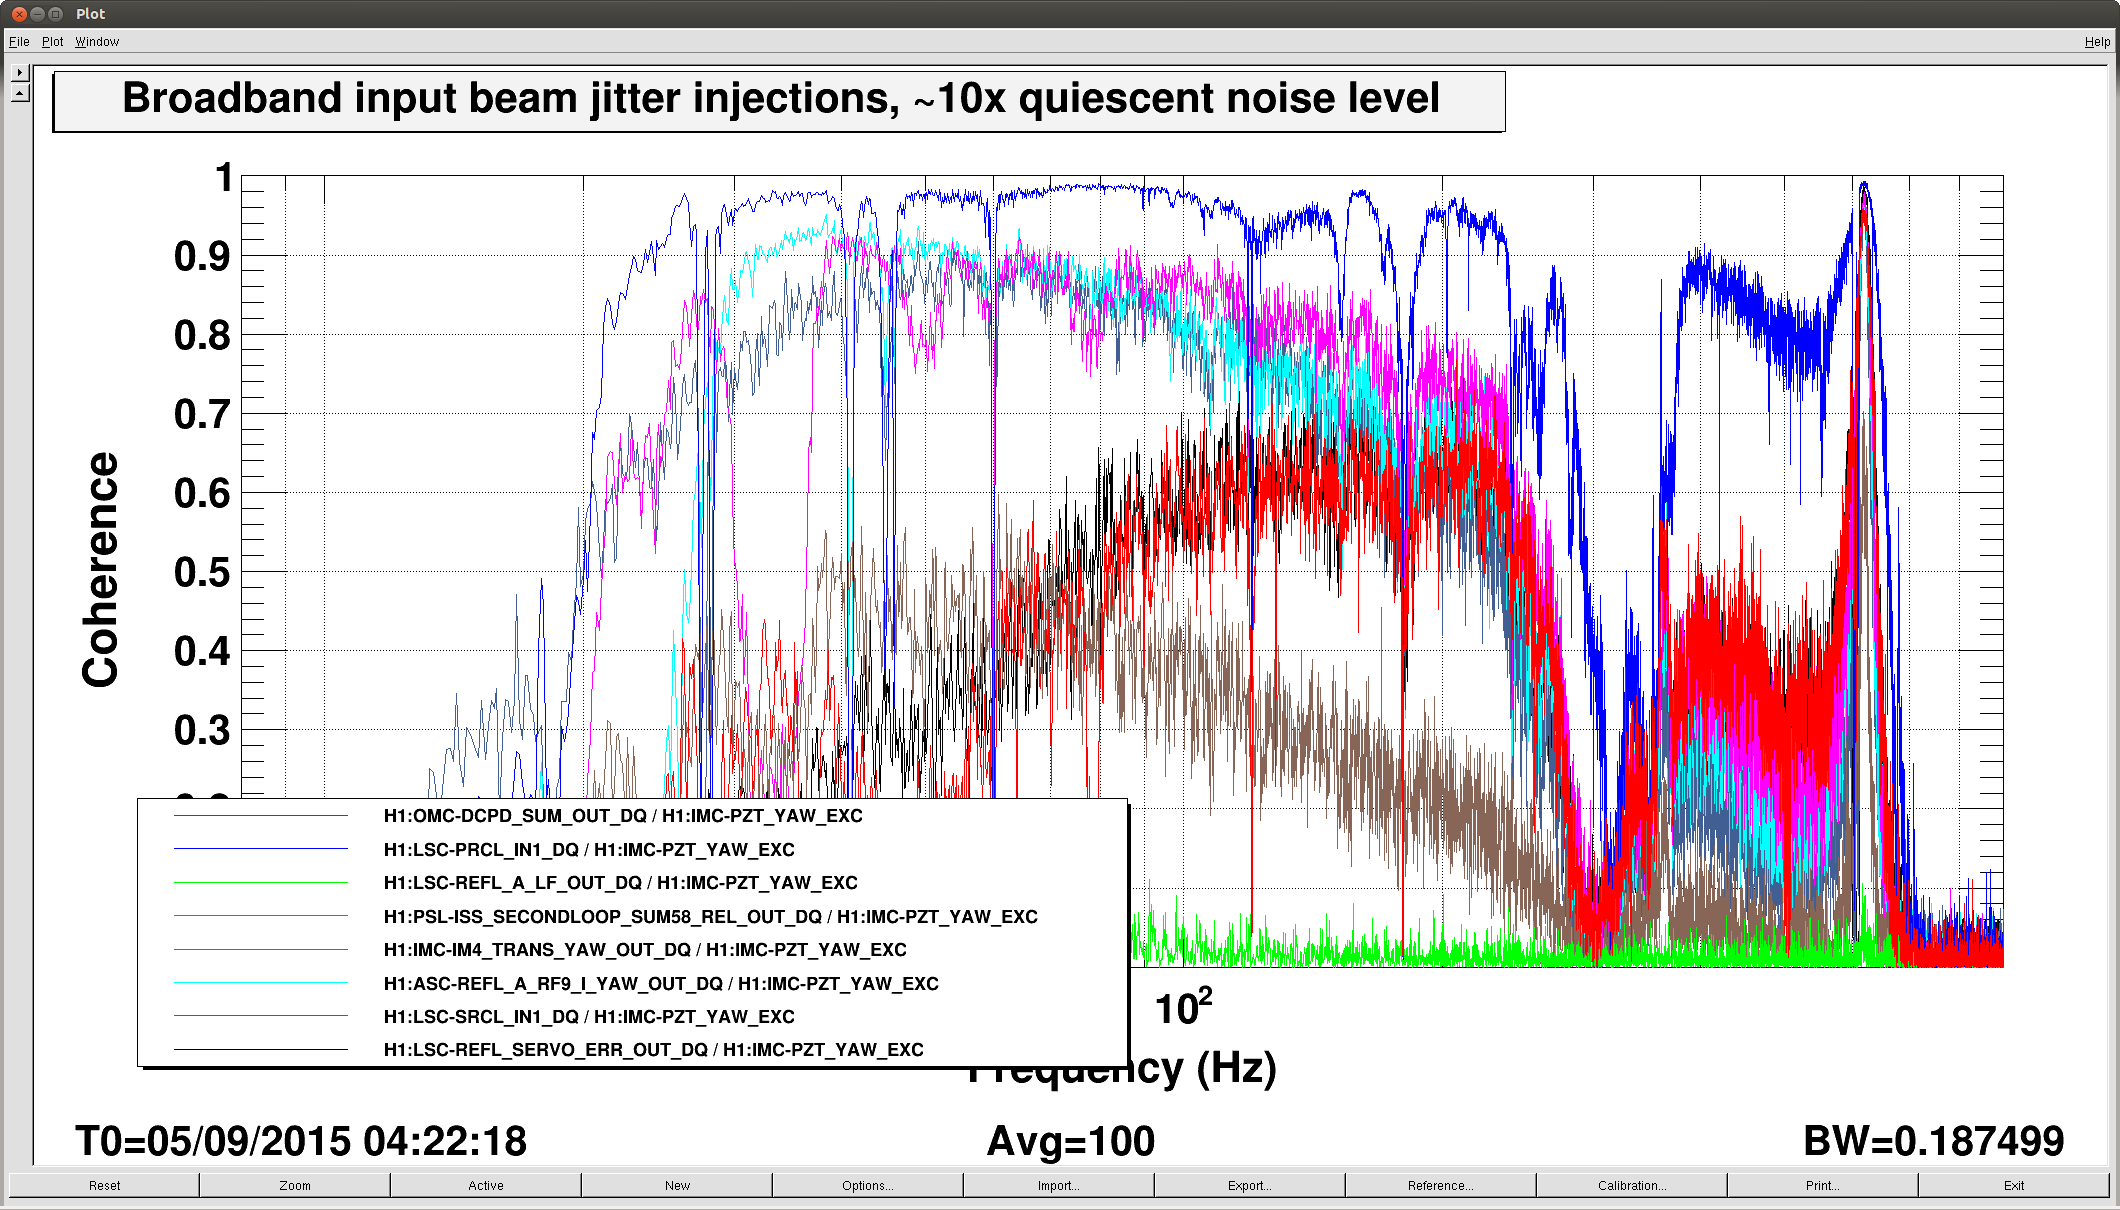
This evening we made a qualitative study of the coupling of beam jitter before the IMC into DARM. This is going to need more attention, but it looks like the quiescent noise level may be as high as 10% of the DARM noise floor around 200Hz. While we don't yet understand the coupling mechanism, this might explain some of the excess noise between 100-200Hz in the latest noise budget.
We drove IMC-PZT with white noise in pitch, and then yaw. The amplitude was chosen to raise the broadband noise measured by IMC-WFS_A_I_{PIT,YAW} to approximately 10x the quiescent noise floor. This isn't a pure out-of-loop sensor, and since we were driving the control point of the DOF3 and DOF5 loops of the IMC alignment channels we will need to work out the loop suppression to get an idea of how much input beam motion was being generated. Unfortunately we don't have a true out-of-loop sensor of alignment before the IMC. We may try this test again with the loops off, or the gain reduced, or calibrate the motion using the IMC WFS dc channels with the IMC unlocked. Recall that Keita has commissioned the DOF5 YAW loop to suppress the intensity noise around 300Hz.
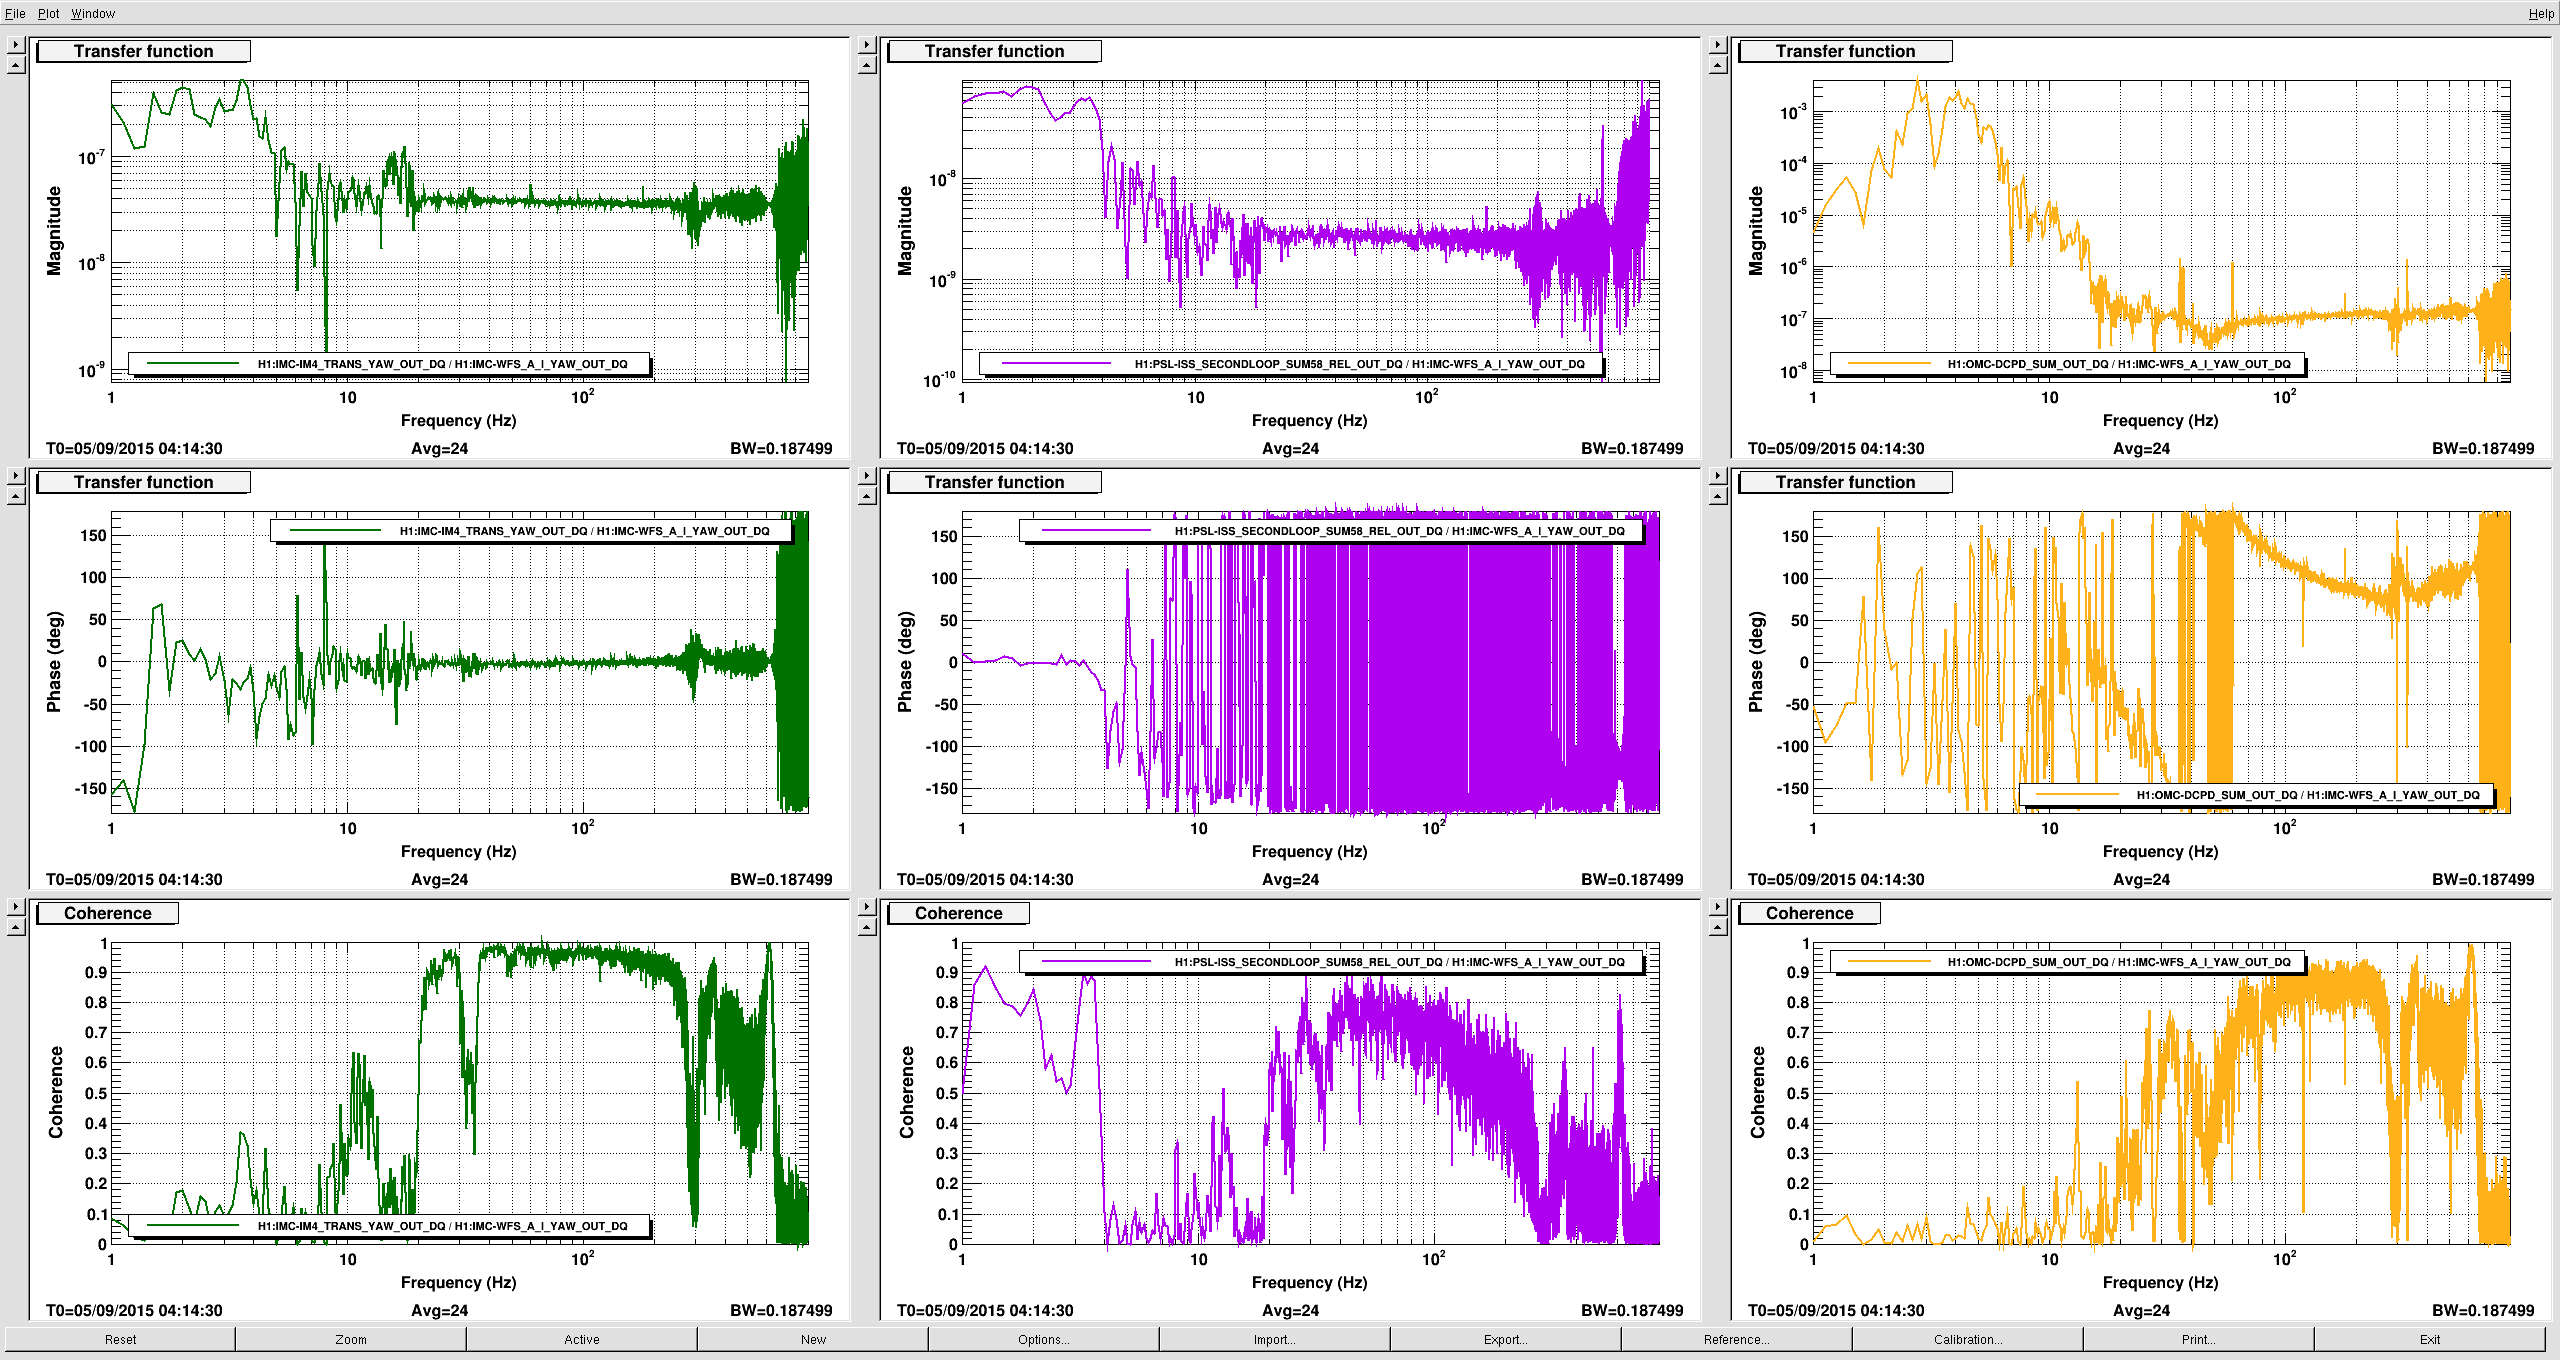
The two attached plots show the coherence between the excitation channel (PIT or YAW) and various interferometer channels. The coupling from YAW is much worse: at 200Hz, an excitation 10x larger than normal noise (we think) generates coherence around 0.6, so the quiescent level could generate a few percent of the DARM noise. Looking at these plots has us pretty stumped. How does input beam jitter couple into DARM? If it's jitter --> intensity noise, why isn't it coherent with something like REFL_A_LF or POP_A_LF (not shown, but zero)?
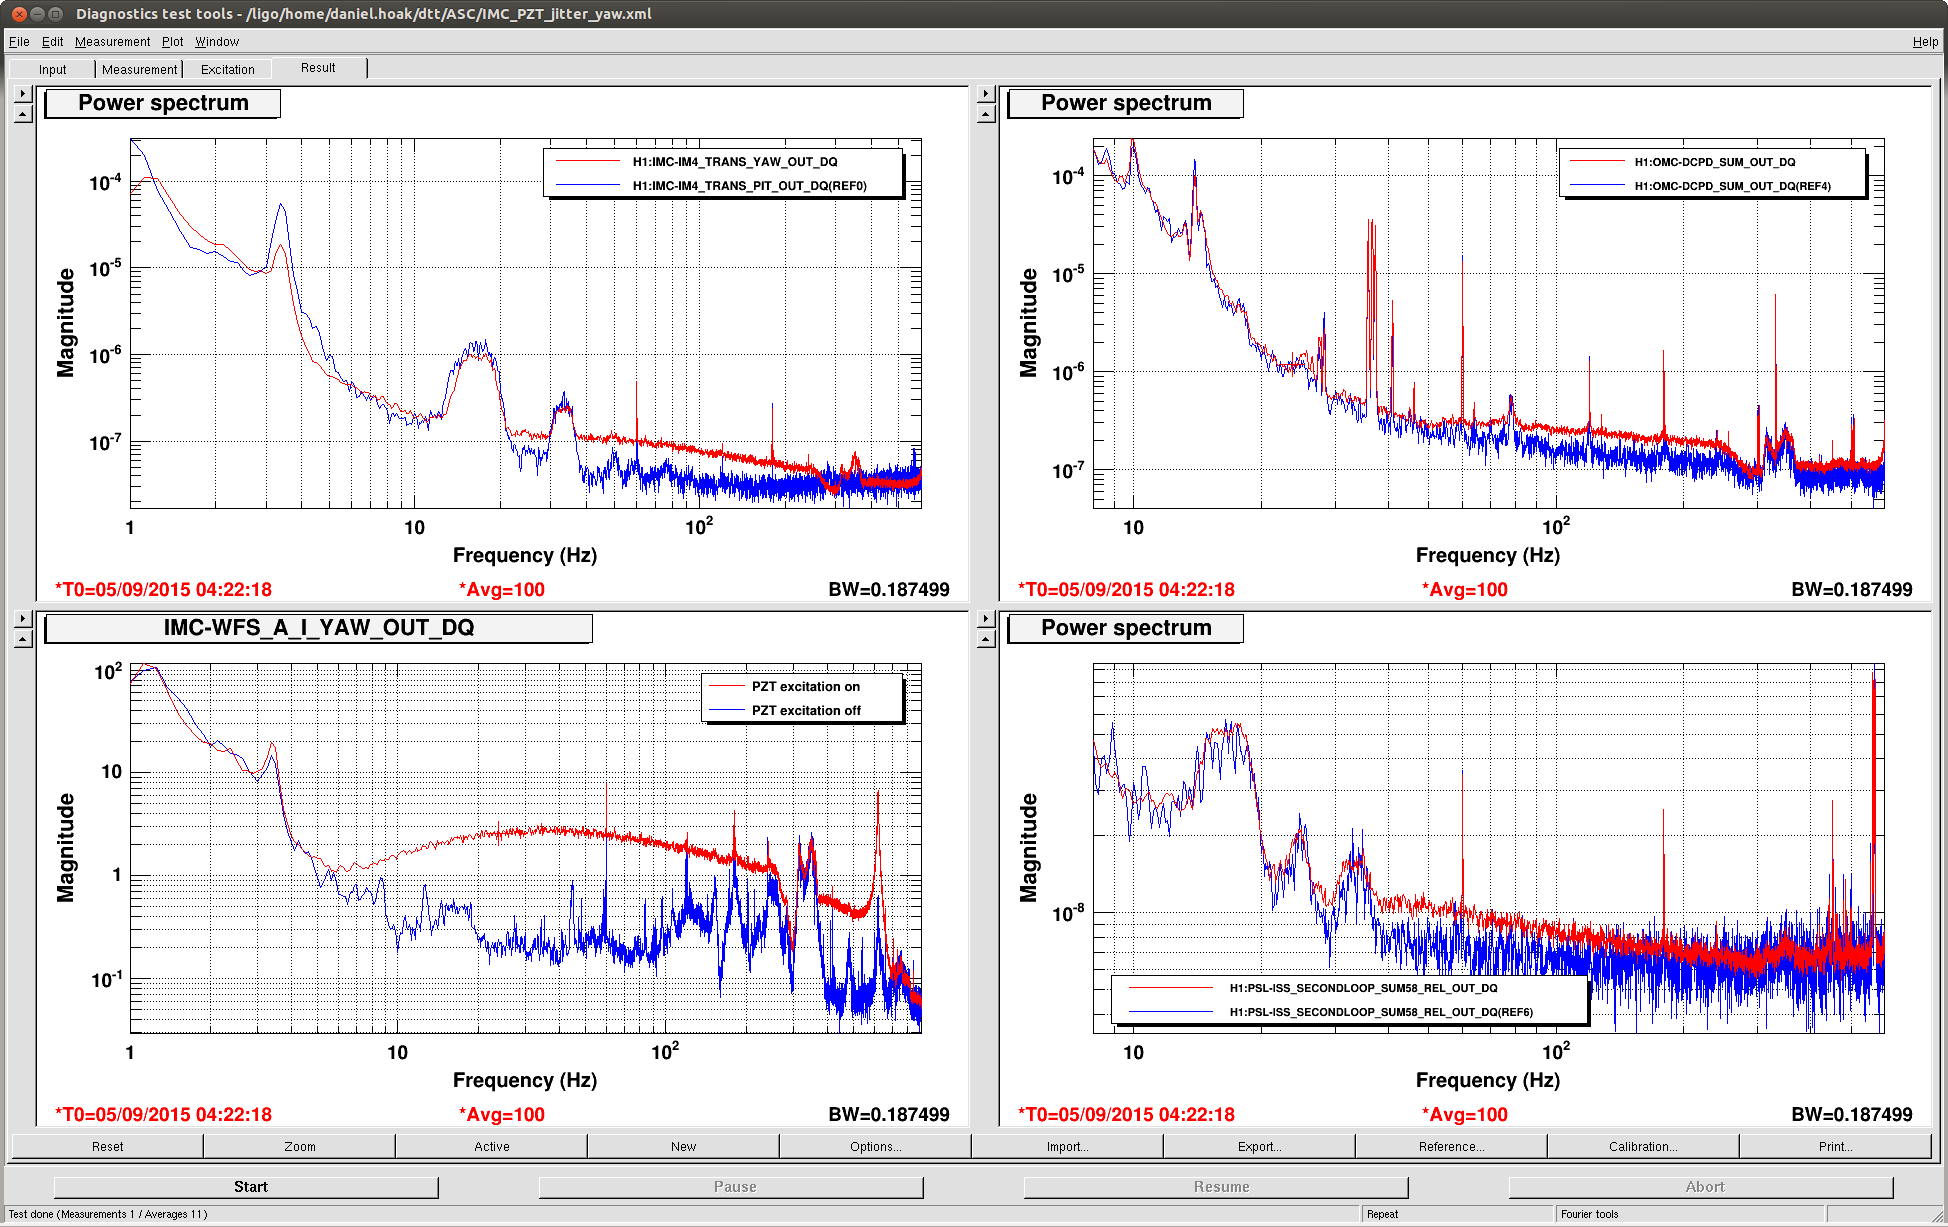
The third plot is a comparison of various channels with the excitation on (red) and off (blue). Note the DCPD sum in the upper right corner. Will have to think more about this after getting some slpee.
Transfer function please.
TFs of the yaw measurement attached.
If the WFS A error signal accurately represents the quiescent yaw jitter into the IMC, the orange TF suggests that this jitter contributes the DCPD sum at a level of 3×10⁻⁸ mA/Hz1/2 at 100 Hz, which is about a factor of 6 below the total noise.
Using this measured WFS A yaw → DCPD sum TF, I projected the noise from WFS A onto the DARM spectrum (using data from 2015-08-27). Since the coupling TF was taken during a completely different lock stretch than the noises, this should be taken with a grain of salt. However, it gives us an idea of how significant the jitter is above 100 Hz. (Pitch has not yet been included.)
PIT coupling per beam rotation angle is a factor of 7.5 smaller than YAW:
https://alog.ligo-wa.caltech.edu/aLOG/index.php?callRep=21212
Re: "How does beam jitter couple to DARM?" : jitter can couple to DARM via misalignments of core optics (see https://www.osapublishing.org/ao/abstract.cfm?uri=ao-37-28-6734).
If this is the dominant coupling mechanism, you should see some coherence between a DARM BLRMS channel where this jitter noise is the dominant noise (you may need to drive jitter with white noise for this) and some of the main IFO WFS channels.
The BLRMS in the input beam jitter region (300-400 Hz) is remarkably stable over each lock (see my entry here), so there seems to be no clear correlation with residual motion of any IFO angular control.
Thanks for the link to that post, I hadn't seen it. It may still be possible though that there's some alignment offset in the main IFO that couples the jitter to DARM (i.e. a DC offset that is large compared to residual motion – perhaps caused by mode mismatch + miscentering on a WFS). This could be checked by putting offsets on WFS channels and seeing how the coupling changes.
Took over from Nutsinee. Dan, Kiwamu and Darkhan also here.

07:15 UTC Lock loss. SUS OMC SW WD tripped. Possible earthquake.
07:21 UTC Touched up SUS ETMX pitch for locking on green. X arm green power remaining around .8
07:26 UTC Requested INIT, DOWN then NOMINAL_LOW_NOISE. Did not help.
07:39 UTC Dan suggested adjusting TMS alignment. This brought the X arm green power over 1. Guardian moved on.
07:44 UTC Reloaded TJ's script on video5 per his earlier request.
DRMI alignment looks bad, misaligned SRM to lock on PRMI, did not help
07:50 UTC Started initial alignment per Dan's suggestion
08:35 UTC Darkhan left. Kiwamu and Dan still here.
08:38 UTC Got to and stopped at DC_READOUT_TRANSITION. Dan modifying guardian to run measurement on OMC.
08:48 UTC Kiwamu left. Just Dan and I here.
08:57 UTC Checked that the PSL cameras are not frozen. Lights are off in the PSL enclosure. Checked mid and end station cameras. All dark, but end X does not move. mid Y still has flickering green lines. Lights are on in the LVEA.
09:03 UTC Dan starting measurement.
09:58 UTC Dan stopping measurement. Investigating possible issues with calibration left over from measurement.
10:52 UTC Observing mode.

More ETMY saturations.
When we got back to low noise at 0958 UTC, we noticed the DARM gain was too low by about 30%. This was probably because we performed the gaurdian steps out of sequence: we increased power on RF DARM to allow for OMC modescans, with the DARM boost on, and then handed of to DC readout. Performing the RF-->DC handoff with the DARM boost enabled can spoil the coherence of the gain-matching calculation and lead to a value for the OMC-READOUT_ERR_GAIN that is off by tens of percent. Really we should be doing this calculation with a driven excitation, rather than relying on unsuppressed length fluctuations to provide coherence between AS45_Q and DCPD_SUM. But we haven't taken the time to code up a tdssine measurement (or tdsresp? something in cdsutils?) in the OMC guardian.
Anyways after some head-scratching we adjusted OMC-READOUT_ERR_GAIN so the height of the 331.9Hz calibration line was the same as it was twelve hours ago.
23:00 IFO has been locking. The operation mode is OBSERVING. We're hoping for a record breaking today (I was told that the longest lock we had was 20 hours during ER7).
Craig, Kiwamu, Darkhan, Sudarshan doing calibration work, Robert doing PEM injections.
23:59 Robert picking things up in LVEA, then go to EY to do more injections.
Intent bit switched to Commissioning.
01:30 Robert back.
03:00 Robert done for tonight. Dan and Evan working on PZT. Intent bit remains Commissioning.
04:36 Go back to Observing.
05:01 Wind picking up speed. A wind gust just reached 40 mph but seems to be coming down quickly.
05:44 THE INTERFEROMETER HAS STAYED LOCKED FOR 24 HOURS and is continuing to do so!
07:00 Hand over to Patrick.
The ifo dropped lock at 7:13 UTC due to a 5.6M earthquake in Alaska. A new lock stretch record is set at 25 hours 30 minutes =D
As discussed at today's run meeting on Teamspeak on the JRPC channel:
The LDAS (DCS) stream of 4 s hoft generation using gstlal_compute_strain started writing to LDAS disks at 1125451520 == Sep 05 2015 01:25:03 UTC.
There already exist two redundant DMT streams of 4 s hoft writing to LDAS and DMT (GDS) disks. These are now vetted for diffs in the STRAIN and ODC channels.
Aggregation of hoft into 4096 s frame files for offline analysis is now configured (via the diskcache) to use the DMT hoft if the STRAIN and ODC channels agree in the two DMT streams; otherwise it will use the LDAS stream. (This can be easily switched back to using only the two DMT streams as it has been using prior to the time given in this alog, if problems arise).
|
Injection |
Time of first injection, UTC |
Injection spacing |
Total number of injections |
Good channels for environmental signal |
|
|
Sept. 5 |
|
|
|
|
crowd (10 people) walking randomly for 2 or 3s periods in control room |
1:39:00 |
5s |
12 |
HAM2 seismometer, vertex seismometer H1:PEM-CS_ACC_LVEAFLOOR_HAM1_Z
|
|
crowd (10 people) walking randomly in hall just outside control room |
1:41:00 |
5s |
12 |
same |
|
External door near control room shutting by itself |
1:44:00 |
5s |
12 |
same |
|
chair rolling in control room (most common chair) |
1:46:00 |
5s |
12 |
same |
|
Single large steps in control room |
1:50:00 |
5s |
12 |
same |
|
Airlock door (door to lab area near control room) shut by hand |
1:52:00 |
5s |
12 |
same |
|
slamming office door (Sheila, Kiwamu, Me) |
1:54:00 |
5s |
12 |
same |
|
hammer dropped from waist height in vacuum lab |
1:59:00 |
5s |
12 |
same |
|
setting car battery down in OSB shipping area |
2:02:00 |
5s |
12 |
same |
|
continuous bouncing for 5s on exercise/seating ball |
2:07:00 |
10s |
6 |
same |
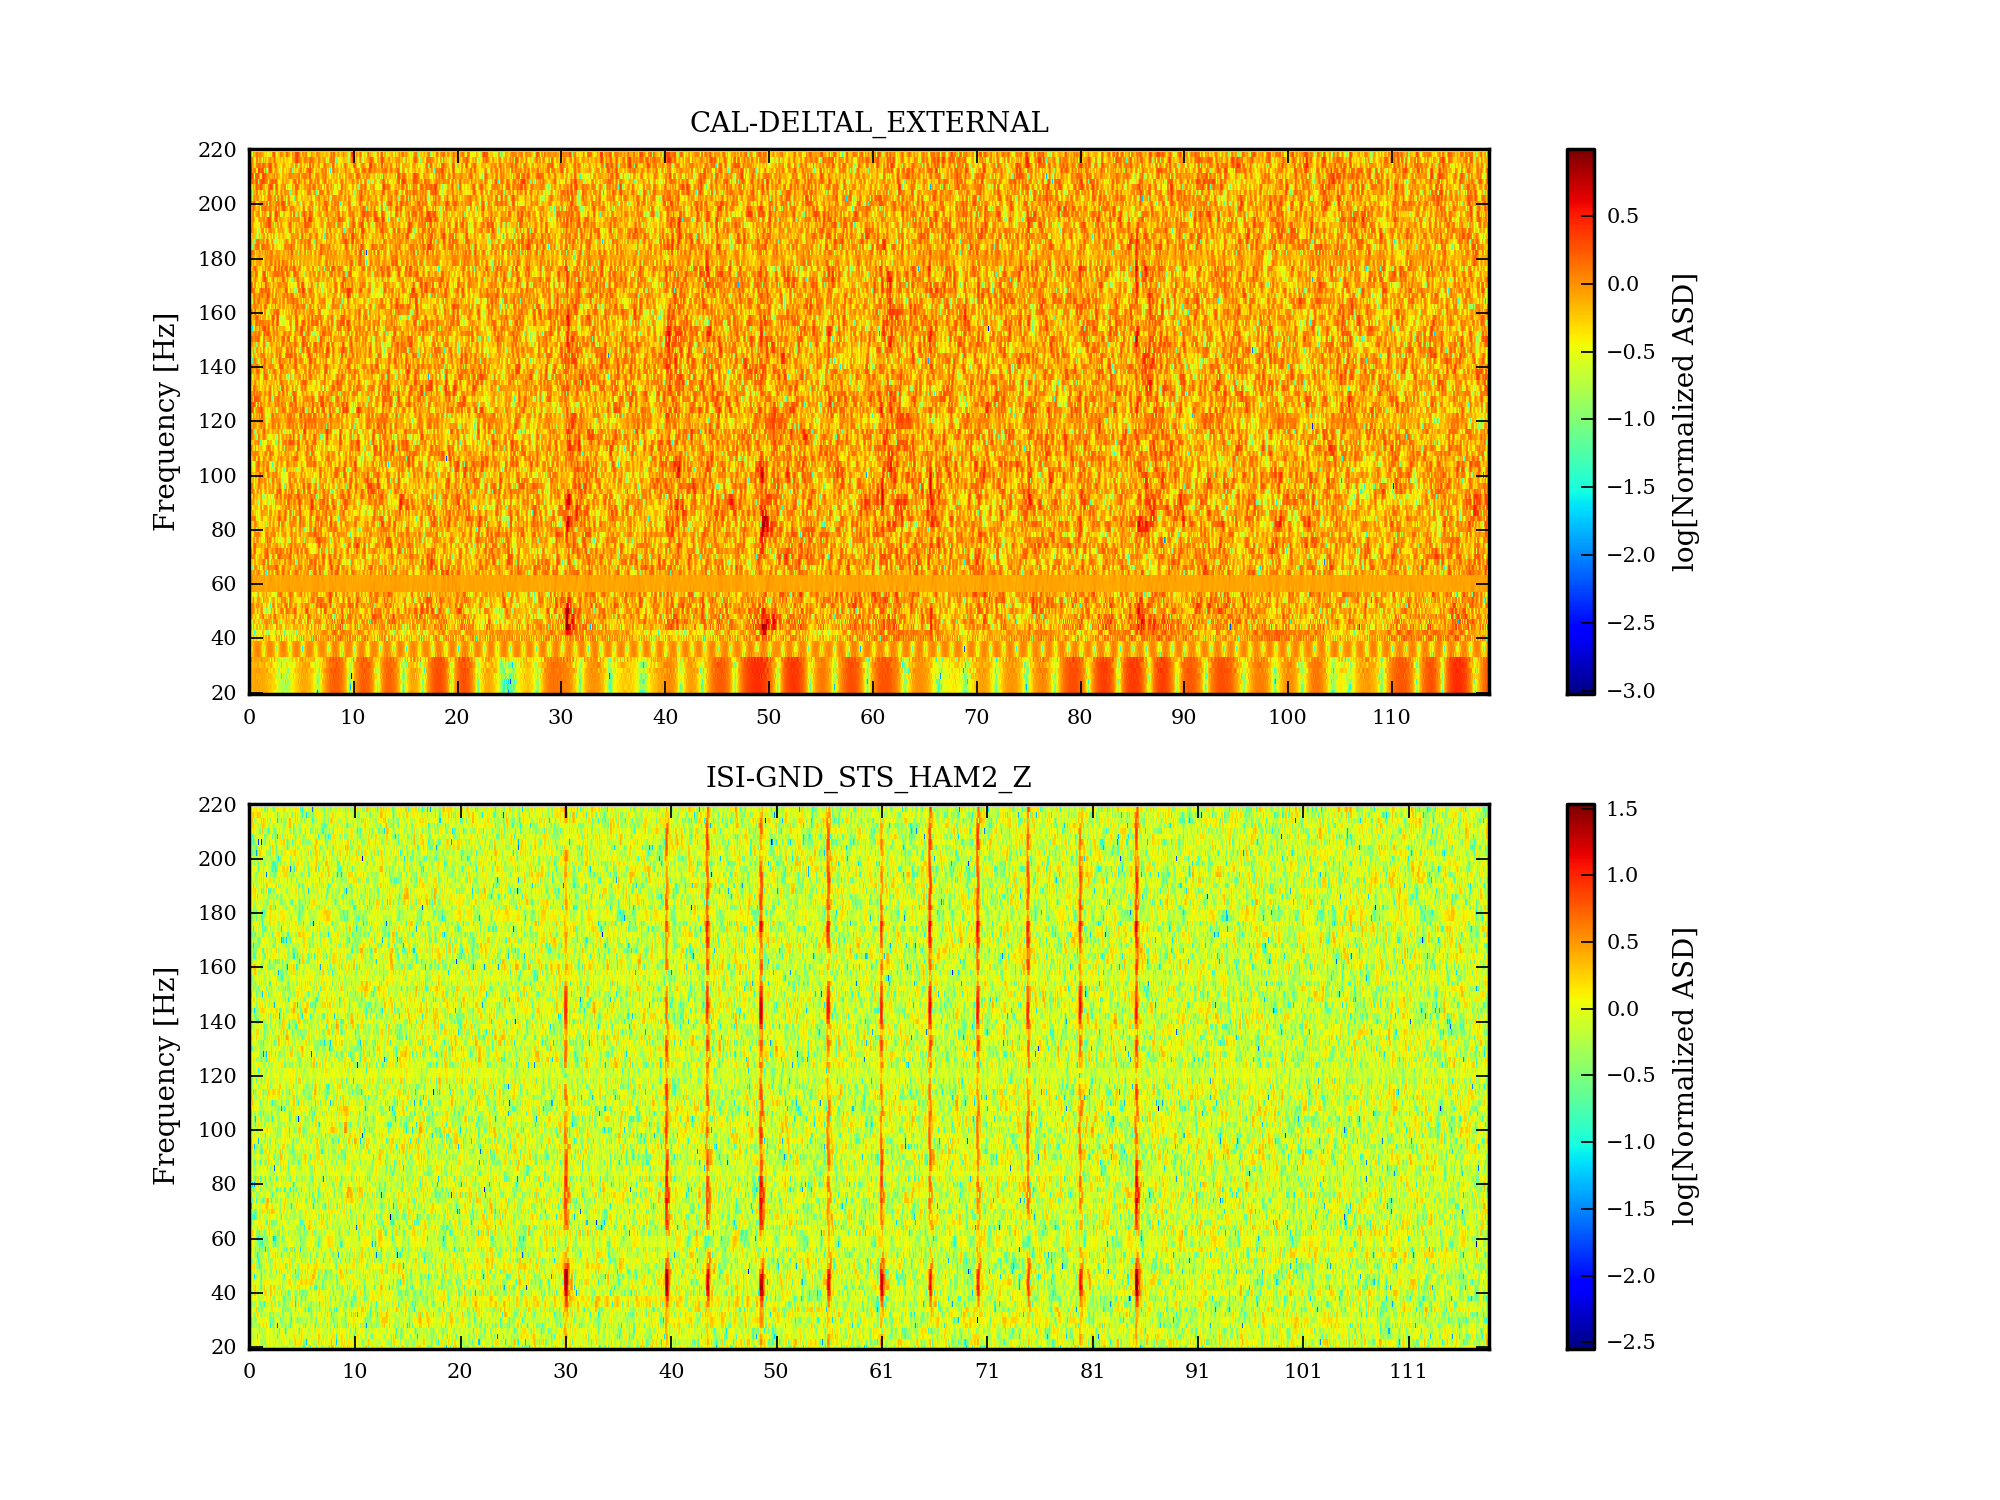
I've attached the result. Quick observation from the spectrograms tell me that dropping hammer from waist height in vacuum lab (aka Kyle's lab) and setting car battery down in OSB shipping area coupled into DARM.
Instead of plotting the spectogram starting at the time of injection, this time I did +/- 10 seconds instead so it's more clear when the injection started and when it's ended.
Since I have never really explained what I did in finding noises in the sensors and in DARM, I'm taking some time to explain it in this alog. First I looked for injections in appropreiate sensors (accelerometer, microphone, seismometer). I zoomed in the spectrograms until I get the signal to show up >3 pixels or so in both frequency and time domain (as Robert suggested). Once I was certain that the injections were there, I went to look for them in DARM. I started with the same frequency range that the injections showed up in the sensors I used, if I couldn't find anything then I move up/down in frequency domain to look for any possible up/down conversions with increments depending on how wide the injections were in terms of frequency. Until I reached the lowest/highest frequency that the injections could possibly showed up, if I still didn't see anything only then I would conclude that the injections didn't show up in DARM.
More investigations on how some of these injections coupled into DARM will take days, weeks, I don't know. The point of these injections was to determine what activities can and cannot be performed during Observing run. This is why I posted spectrograms first and not wait until I'm done with the analyses. I simply let DARM spectrogram speaks for itself.
I have also attached better spectrograms of the super ball injection, produced using Dan's script.
C. Cahillane

I have been busy trying to calculate kappa_tst, kappa_pu, kappa_C,and f_c from ER8 data so I might begin finding the uncertainty associated with these numbers.  The uncertainty in all of these calibration coefficients depend heavily on our calibration line measurements (See T1500377 for the calculation of these coefficients from model params and calibration lines).  I was curious to see if uncertainty in our calibration line measurements will be a significant source of uncertainty in the total budget, or if I can ignore it for now.

I took 100 GPS times starting at 1125316818, each ten seconds apart, and computed the 10 second FFT of DARM_ERR, X_TST, X_CTRL, and X_PCAL.  Then, I found their values at the calibration line frequencies at H1:
f_tst  = 35.9 Hz
f_pcal = 36.7 Hz
f_ctrl = 37.3 Hz
f_pcal2= 331.9 Hz

and took the following ratios:
   X_TST(f_tst) / DARM_ERR(f_tst)
 X_PCAL(f_pcal) / DARM_ERR(f_pcal)
 X_CTRL(f_ctrl) / DARM_ERR(f_ctrl)
X_PCAL(f_pcal2) / DARM_ERR(f_pcal2)

and plotted their amplitudes below.

Percent uncertainties:
   X_TST(f_tst) / DARM_ERR(f_tst)   = 0.98%
 X_PCAL(f_pcal) / DARM_ERR(f_pcal)  = 0.95%
 X_CTRL(f_ctrl) / DARM_ERR(f_ctrl)  = 0.84%
X_PCAL(f_pcal2) / DARM_ERR(f_pcal2) = 1.05%

Since I am just starting to compute the uncertainty expressions for the calibration coefficients in Mathematica, this study informed me that there is ~1% uncertainty in all of our calibration line amplitudes, which is significant enough to be included in all uncertainty calculations.

Two notes:
(1) I am assuming for now there is no quantization noise in our digital signals DARM_ERR, DARM_CTRL, X_TST, X_CTRL, and X_PCAL.  This is almost certainty a secondary consideration in the total budget for now.
(2) The method I used for dewhitening X_PCAL is known to be incorrect, so their absolute values should not be taken too seriously.  But since all I cared about here is the statistical uncertainty, any systematic errors are a simple gain that is common to all data points, so this result is still valid.
C. Cahillane, E. Hall

I have made some updates because of Evan.
He suggested that I switch the measurements to be Response / Excitation as is the norm with transfer functions, so now my plots are of DARM_ERR / X_{TST, CTRL, PCAL}.
In addition he suggested that I take more data and make histograms of the DARM_ERR / X_{TST, CTRL, PCAL} plots to better see the distribution, to see if it looks like a Gaussian or Rayleigh distribution.  (Plot 2 is the Histogram, Plot 1 is the standard scatterplot)
Plot 3 is the line amplitude.  In the case of PCAL, we can make readouts, leading to the statistical uncertainty we see only in X_PCAL on this plot.  The others, X_CTRL and X_TST, we cannot make readouts and must trust that our excitation is constant over all time.

Plot 2 looks like a nice Gaussian distribution for all the observed calibration lines.  We will still need to consider these statistical uncertainties in the total uncertainty budget.
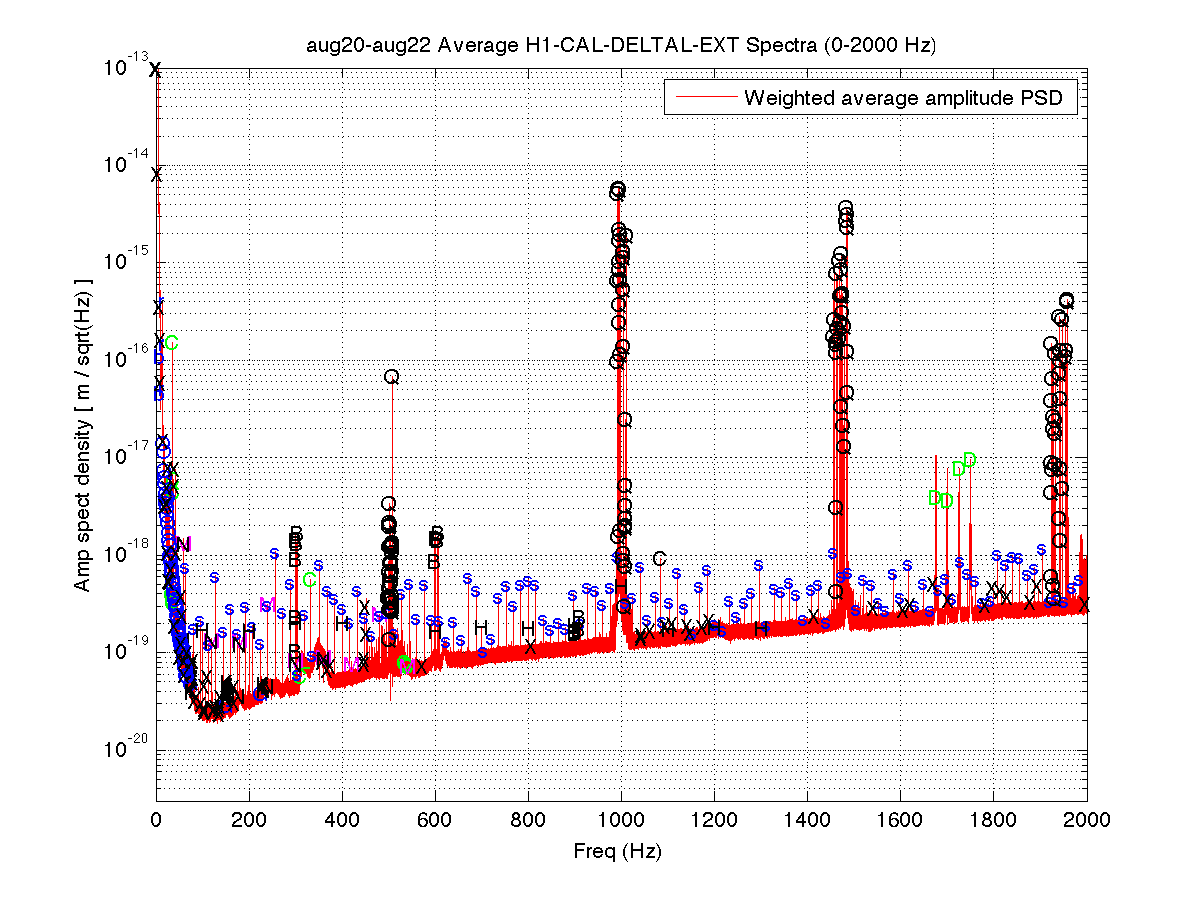
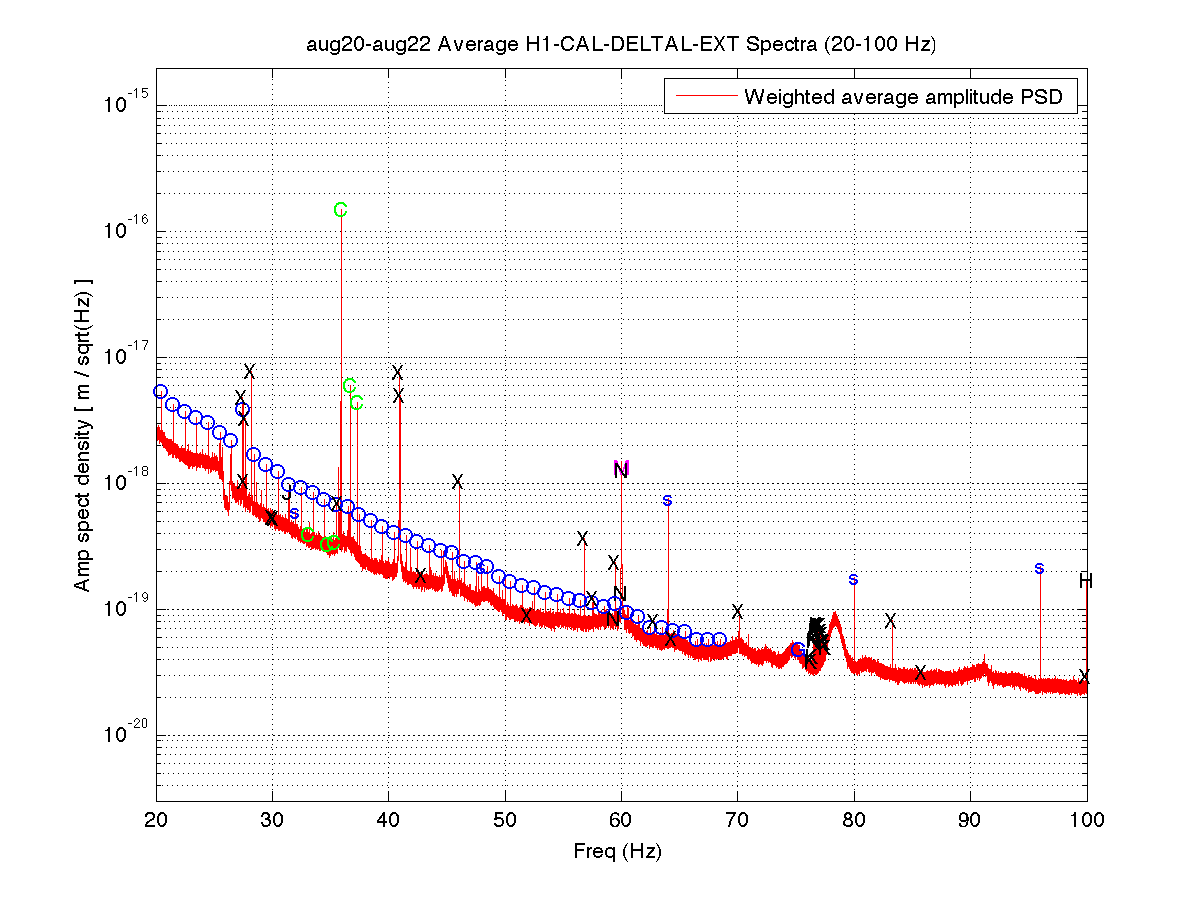
I took a look at the integrated DARM 0-2000 Hz spectrum from 50 hours of 30-minute FScans SFTs taken
over the last few days. A couple of sample plots are shown below, and a more extensive set of plots is
attached in a zip file. The alphabetic labels on narrow lines conform to those defined in this earlier pre-ER7 report.

Highlights and lowlights:
* The 0.1698-Hz comb seen before is gone.
* The 3.9994-Hz comb seen before is gone.
* The 36.9725-Hz comb seen before is gone.
* The 16-Hz comb seen in ER7 is still prevalent throughout the spectrum. The 64-Hz harmonics are no longer marked separately, since they don't seem as special as they once did.
* There is a new 1-Hz comb with a 0.5-Hz offset, that becomes visible at about 16.5 Hz and peters out around 69.5 Hz (for this integration time). This comb seems likely connected to there being strong digital lines at 0.5 Hz and 1 Hz.

There are some new single lines marked here and there (with 'x'), plus some new calibration lines. I have not removed singles marked previously, in case they reappear with deeper integrations to be done after more ER8 data is available.

Figure 1 - 0-2000 Hz
Figure 2 - 20-100 Hz (note the new 1-Hz comb marked with 'O' for 'One'
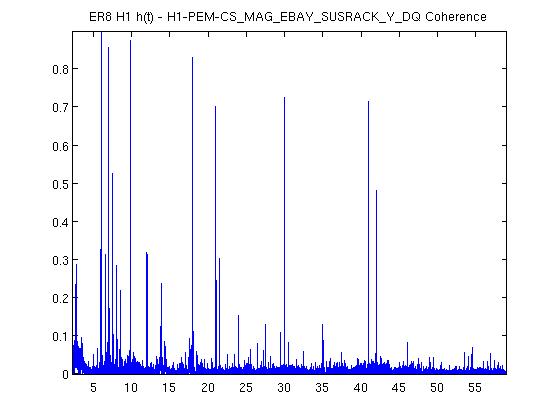
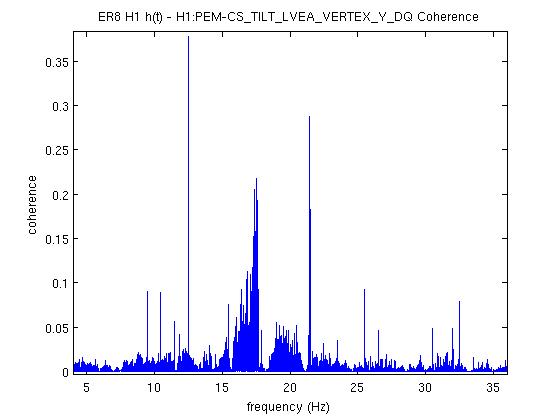
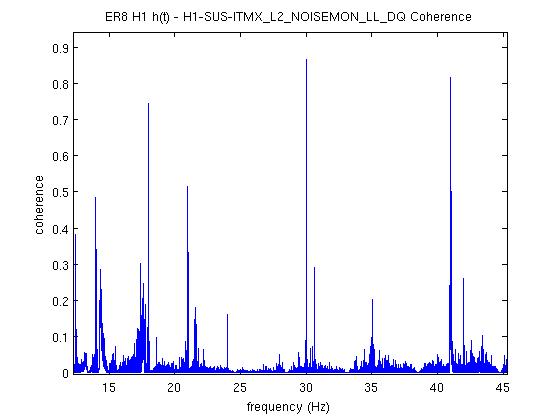
We ran the coherence tool on the first week of ER8 data at Hanford, and calculated the coherence between h(t) and numerous auxiliary channel. For the 1 mHz resolution, the results are here:
https://ldas-jobs.ligo-wa.caltech.edu/~eric.coughlin/ER7/LineSearch/H1_COH_1123891217_1124582417_SHORT_1_webpage/

We are looking into some of the lines that Keith Riles observed and summarized here
https://alog.ligo-wa.caltech.edu/aLOG/index.php?callRep=20790

Specifically, we concentrated on "There is a new 1-Hz comb with a 0.5-Hz offset, that becomes visible at about 16.5 Hz and peters out around 69.5 Hz (for this integration time). This comb seems likely connected to there being strong digital lines at 0.5 Hz and 1 Hz."

Here are the channels where we see this structure in the coherence, and a few observations as well for some of the channels

 H1:SUS-ITMY_L2_NOISEMON_UR_DQ_data
  There is a 16.5 Hz line here, and others off by 0.5 Hz at low frequencies.
 H1:SUS-ITMY_L2_NOISEMON_UL_DQ
 H1:SUS-ITMY_L2_NOISEMON_LR_DQ
 H1:SUS-ITMY_L2_MASTER_OUT_UR_DQ
 H1:SUS-ITMY_L2_MASTER_OUT_UL_DQ
 H1:SUS-ITMY_L2_MASTER_OUT_LR_DQ
 H1:SUS-ITMY_L2_MASTER_OUT_LL_DQ
 H1:SUS-ITMX_L2_NOISEMON_UR_DQ
 H1:SUS-ITMX_L2_NOISEMON_UL_DQ
 H1:SUS-ITMX_L2_NOISEMON_LL_DQ
  Coherence at 10.0, 12.0, 12.5, 14.0, 15.5, 18.0 (big), 21.0, 24.0 30.0 Hz etc
 H1:SUS-ITMX_L2_MASTER_OUT_UR_DQ
 H1:SUS-ITMX_L2_MASTER_OUT_UL_DQ
 H1:SUS-ITMX_L2_MASTER_OUT_LR_DQ
 H1:SUS-ITMX_L2_MASTER_OUT_LL_DQ
 H1:SUS-ETMY_L3_MASTER_OUT_UR_DQ
 H1:SUS-ETMY_L3_MASTER_OUT_UL_DQ
 H1:SUS-ETMY_L3_MASTER_OUT_LR_DQ
 H1:SUS-ETMY_L3_MASTER_OUT_LL_DQ
 H1:SUS-ETMY_L2_NOISEMON_UR_DQ
 H1:SUS-ETMY_L2_NOISEMON_UL_DQ
 H1:SUS-ETMY_L2_MASTER_OUT_UR_DQ
 H1:SUS-ETMY_L2_MASTER_OUT_UL_DQ
 H1:SUS-ETMY_L2_MASTER_OUT_LR_DQ
 H1:SUS-ETMY_L2_MASTER_OUT_LL_DQ
 H1:SUS-ETMX_L3_MASTER_OUT_UR_DQ
 H1:SUS-ETMX_L3_MASTER_OUT_UL_DQ
 H1:SUS-ETMX_L3_MASTER_OUT_LR_DQ
 H1:SUS-ETMX_L3_MASTER_OUT_LL_DQ
 H1:SUS-ETMX_L2_NOISEMON_UR_DQ
 H1:SUS-ETMX_L2_NOISEMON_UL_DQ5
 H1:SUS-ETMX_L2_NOISEMON_LR_DQ
 H1:SUS-ETMX_L2_NOISEMON_LL_DQ
 H1:SUS-ETMX_L2_MASTER_OUT_UR_DQ
 H1:SUS-ETMX_L2_MASTER_OUT_UL_DQ
 H1:SUS-ETMX_L2_MASTER_OUT_LR_DQ
 H1:SUS-ETMX_L2_MASTER_OUT_LL_DQ
 H1:PEM-EY_MAG_EBAY_SUSRACK_Z_DQ
  16.5 Hz is here. And more 0.5 Hz harmonics after. Not super strong, but they are there.
 H1:PEM-CS_TILT_LVEA_VERTEX_Y_DQ
  Not clear for this channel. A real mess of lines at low frequencies. 25.5 Hz is distinct. Also 12.5, 26.5, 30.5, 32.5 Hz too.
 H1:PEM-CS_TILT_LVEA_VERTEX_X_DQ
  Also a mess at 16.5 Hz, but the line is there. There are lines at 12.5, 14.5, 32.0, 40.0 Hz
 H1:PEM-CS_MAG_LVEA_OUTPUTOPTICS_X_DQ
  Starts at 14.5 Hz, and the lines then appear consistently every 0.5Hz.
 H1:PEM-CS_MAG_LVEA_OUTPUTOPTICS_QUAD_SUM_DQ
 H1:PEM-CS_MAG_EBAY_SUSRACK_Z_DQ
  Seems to start at 14.5 Hz, and then this 0.5 Hz harmonic continues to appear noticeably and consistently.
 H1:PEM-CS_MAG_EBAY_SUSRACK_Y_DQ
6.0, 7.0, 7.5, 8.0, 8.5, 12.0 Hz, then some small but observable coherences continue at 15.0, 15.5, 16.0, 16.5 Hz. 18.0 Hz and 21.0, 21.5, 22.5, 23.5, 24.0, 30.0, 35.0  Hz are big again.
 H1:PEM-CS_MAG_EBAY_SUSRACK_X_DQ

Some example coherence plots are given.

Nelson, Michael Coughlin, Eric Coughlin, Pat Meyers


Difficulty with DRMI
2:11 UTC After almost an hour not able to lock DRMI and PRMI, I decided to do the initial alignment (this was before I saw Patrick alog that he already did one last night). After the initial alignment the PRMI still wasn't able to lock itself. I had to touch BS, PRM, and PR2.
4:20 PRMI is good but I still can't get the DRMI to lock. I've been adjusting SRM pitch and yaw but no luck. Not sure what on earth is going on. POP18 and POP90 was flashing high so I know the PRMI was good.
ISC_DRMI CONNECTION ERROR
I called Jenne and was able to cleared the error easily. I just noticed that SR3_CAGE_SERVO wasn't engaged. Turned it on and DRMI is locked again.