Matt, Lisa, Sheila
Today we had the mixed blessing of our refl trans/resonance/analog CARM locklosses reappearing. We noticed two things, first that the pitch motion we see in the oplevs seems to be a result of an instability in the DHARD loop (by adjusting the gain we could reduce it), and second that when we turn on the DHARD boosts in the state resonance this is somewhat rough and we think this sometimes causes locklosses.
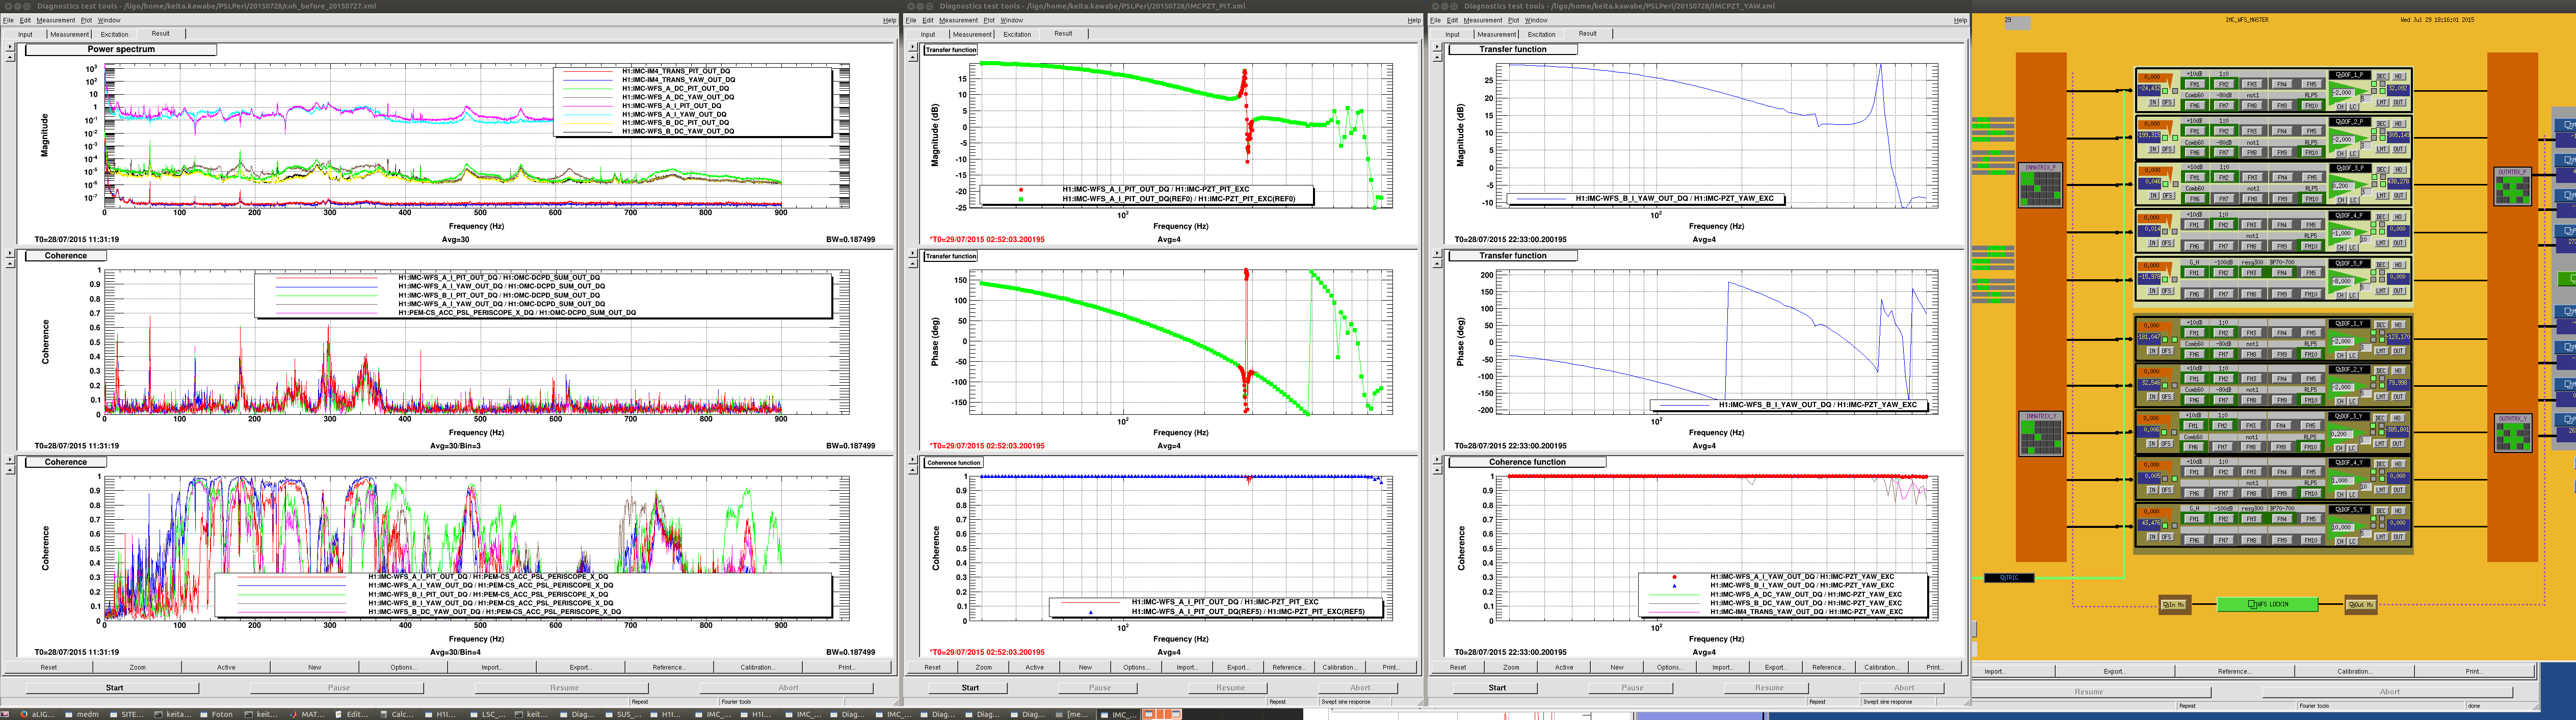
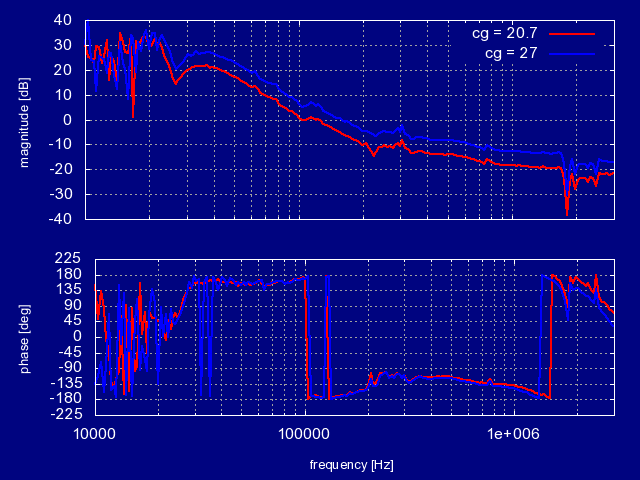
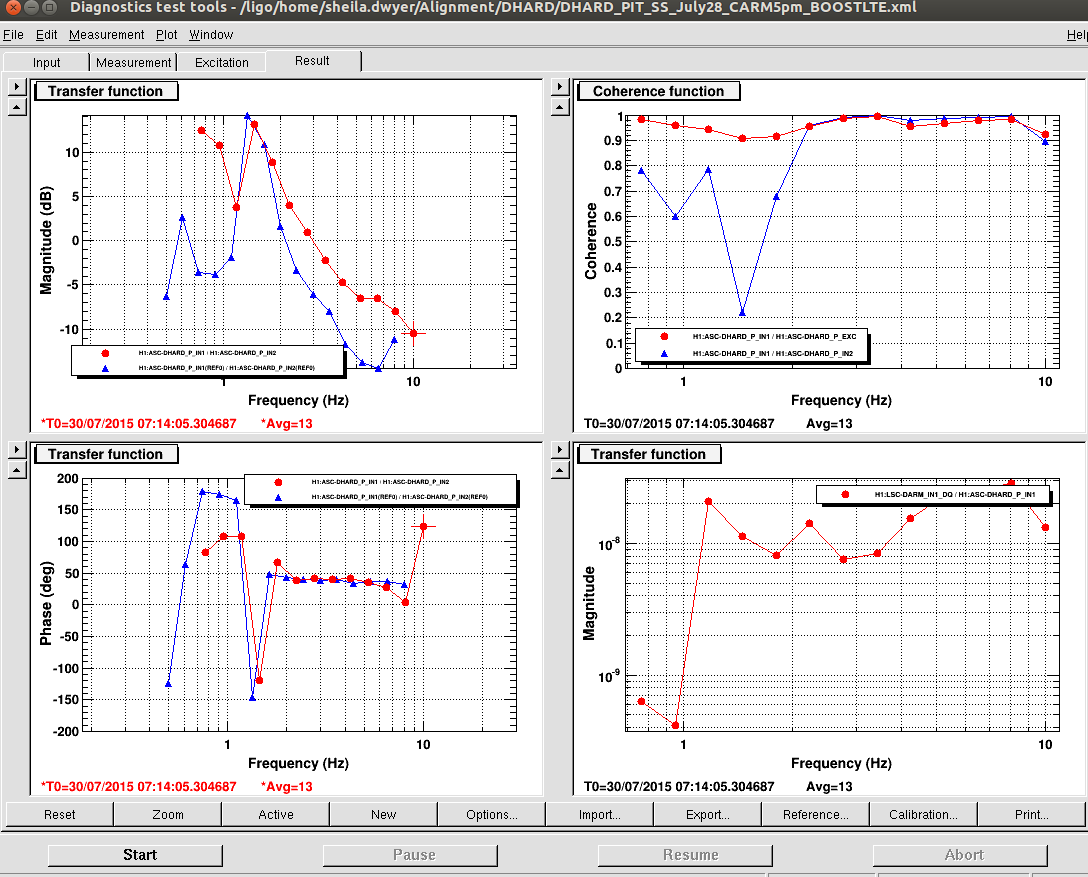
Although we could probably solve this problem by changing the alignment, we wanted to spend some time trying to fix it to avoid this in the future. We measured the DHARD PIT loop at various places in the CARM offset reduction, and have found gains to keep the ugf around 4 Hz throughout the whole process. This allowed us to turn on a boost at the CARM_5PM step, which seemed to make things much more stable in refl trans and resonance. Matt redesigned the boost to make the turn on transient softer, we can no longer tell from the AS camera when the boosts come on. In the attached screenshot the red trace shows transfer functions measured at CARM_5PM, blue is before engaging Matt's new boost, red is with the first of the boosts on (boostLTE, which gives us about 6dB of gain below 1Hz ).
We have been running with oplev damping on the ITMs and not the ETMs, but since we have moved to the HARD/SOFT basis we would like to turn off the ITM oplev damping. We tried the whole sequence (with DHARD changes done by hand) with oplev damping off, and everything worked until we increased the power. It seems like this was due to an instability in DHARD YAW at 23 Watts, which can be solved by turning the gain down slightly. (from 7 to 5)
We were tesing this automation, and had a small earthquake. We decided to revert the changes in the DHARD gain throughout the CARM offset reduction (but kept the new boosts and are still engaging them before REFL_TRANS), because we wanted to see that the IFO could lock before we left. Also, we are now leaving the oplevs off for the CARM offset reduction. We were able to lock on low noise for a few minutes, but an instability in DHARD PIT knocked us out after a few minutes.
Other things:
- Stefan added an offset to PR3 durring the CARM offset reduction, in M1 DRIVEALIGN P2P, value 0.5 with a 60 second ramp. This is intended to counteract the wire heating that happens when the PRC ASC is not on durring the CARM offset reduction.
- We rearranged the gaurdian a bit so that now the OMC locks while the ASC is engaging, to save ourselves a little time.
- We have had two locklosses when trying to transition to the ETMY ESD. We haven't taken the time to investigate these.
- We found that the DARM gain was too low in the RF_DARM state (large gain peaking in DARM at 5 Hz), we have increased it just for this state and the DARM_WFS state to make them more stable.
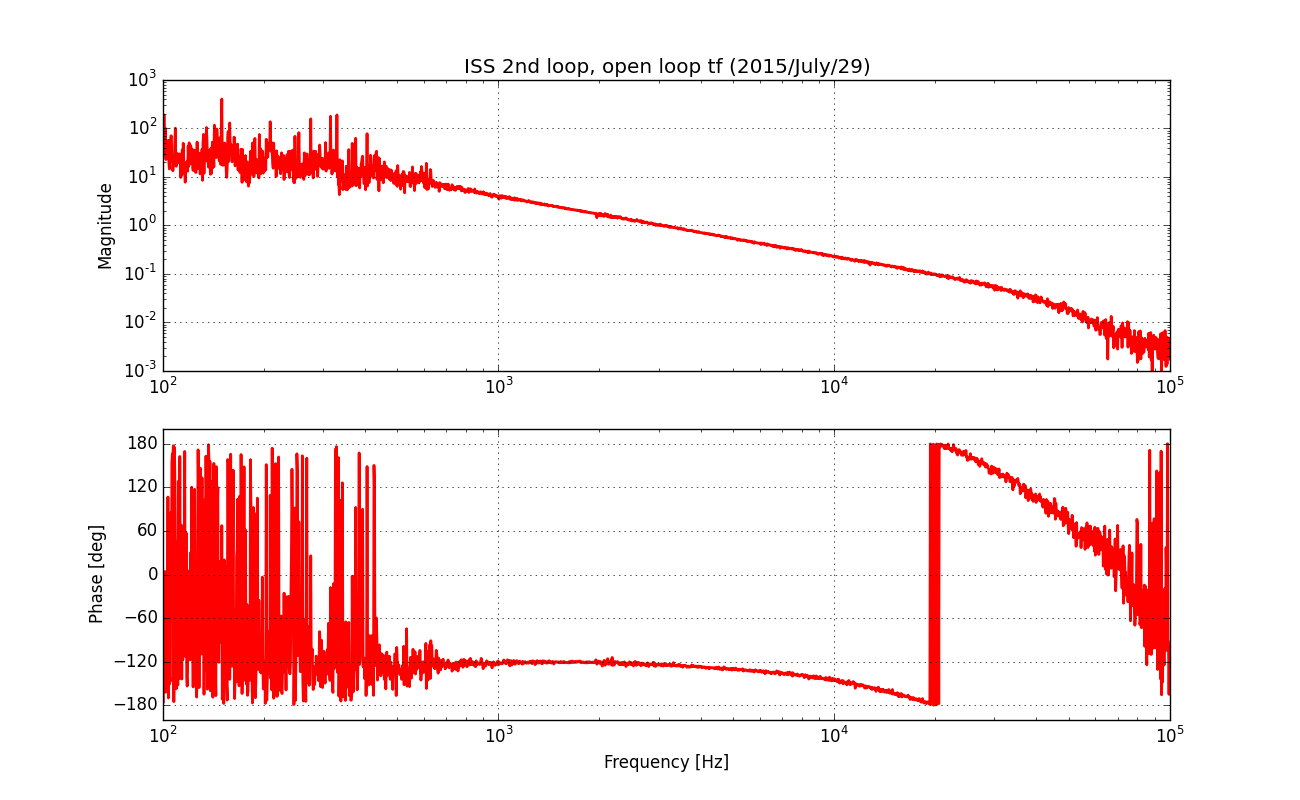
While at 24W, we also tested the new ISS second loop: no problems. We didn't get a chance to do any loop characterization measurements, but after a little tweak to the IMC_LOCK guardian the ISS came on. The new ISS guardian tunes the pre-loop closure offset to produce a servo output of 0.5V (rather than zero), which prevents a turn-on transient (the "shark fin" seen in the diffracted power).