J. Kissel, B. Weaver, C. Vorvick, C. Gray, D. Barker, J. Batch

While we (Jim, Betsy, and Myself) had attempted to upgrade the RCG, compile, install, and restart all front-end code/models in a piecemail fashion starting at 8:00a PDT this morning, as we began to recover, we began to see problems. We had intended to do the models in an order that would be most-facilitative to IFO recovery, namely PSL, SUS and SEI first. Also, in order to speed up the process, we (Jim, Betsy, and Myself) began compiling, and installing those models independently, and in parallel.

(1) We had "found" (this is common CDS knowledge) that our simultaneous installs of PSL, SEI and SUS front-end code all need to touch the
/opt/rtcds/lho/h1/target/gds/param/testpoint.par
file, and *may* have resulted in collisions. After the AWG processes on the SUS models would not start, Betsy flagged down Jim, and found that, since we were all installing at the same time, there were SOME of the SUS that didn't make it into the testpoint.par file, so when AWG_STREAM was started by the front-end start script, it didn't find its list of test points, so it just never started.
This "bug" had never been exposed because the all, sitewide front-end code had never had this many "experts" trying to run through the compilation / install process in parallel like this.

That's what we get for trying to be efficient.

Dave arrived halfway through the restarts (we had finished all corner SEI, SUS, PSL, and ISC, upgrades by this point), and informed us that, last night, after he had removed and regenerated the
/opt/rtcds/lho/h1/chans/ipc/H1.ipc
file by compiling everything, he had moved it out of the way temporarily, in case there were any model restarts over night. If there were model restarts, and the new IPC file was still in place, then that model could potentially be pointed to the wrong connection, and wreak havoc on the whole system. However, we (Jim, Betsy, and I) didn't know that dave had done this, and so when we began compiling this morning, we were compiling on top of the old IPC file.
Dave suggested that, as long as there were no IPC related model changes between last night and when we got started, the IPC file should be fine, so we proceeded onward.

(2) However, as we got further along the recovery process, we also found that some of the SUS (specifically those on the HAM2a and HAM34) were not able to drive out past their IOP model DAC outputs. We had seen this problem before on a few previous maintenance days, so we tried the fix that had worked before -- restart the all front-end models again. When that *didn't* work, we began poking around the Independent Software IOP Watchdog screens, and found that several of these watchdogs were suffering from constant, large, IPC error rates.

Suspecting that the
/opt/rtcds/lho/h1/chans/ipc/H1.ipc
file also had been corrupted because of the parallel code installations, Dave suggested that we abandon ship.

As such (starting at ~11:00a PDT) we're
- Deleting the currently referenced IPC file
- Compiling the entire world, sequentially (a ~40 minute process)
- Installing the entire world, sequentially, (a ~30 minute process)
- Killing the entire world
- Restarting the entire world.

As of this entry, we're just now killing the entire world.

Stay tuned!


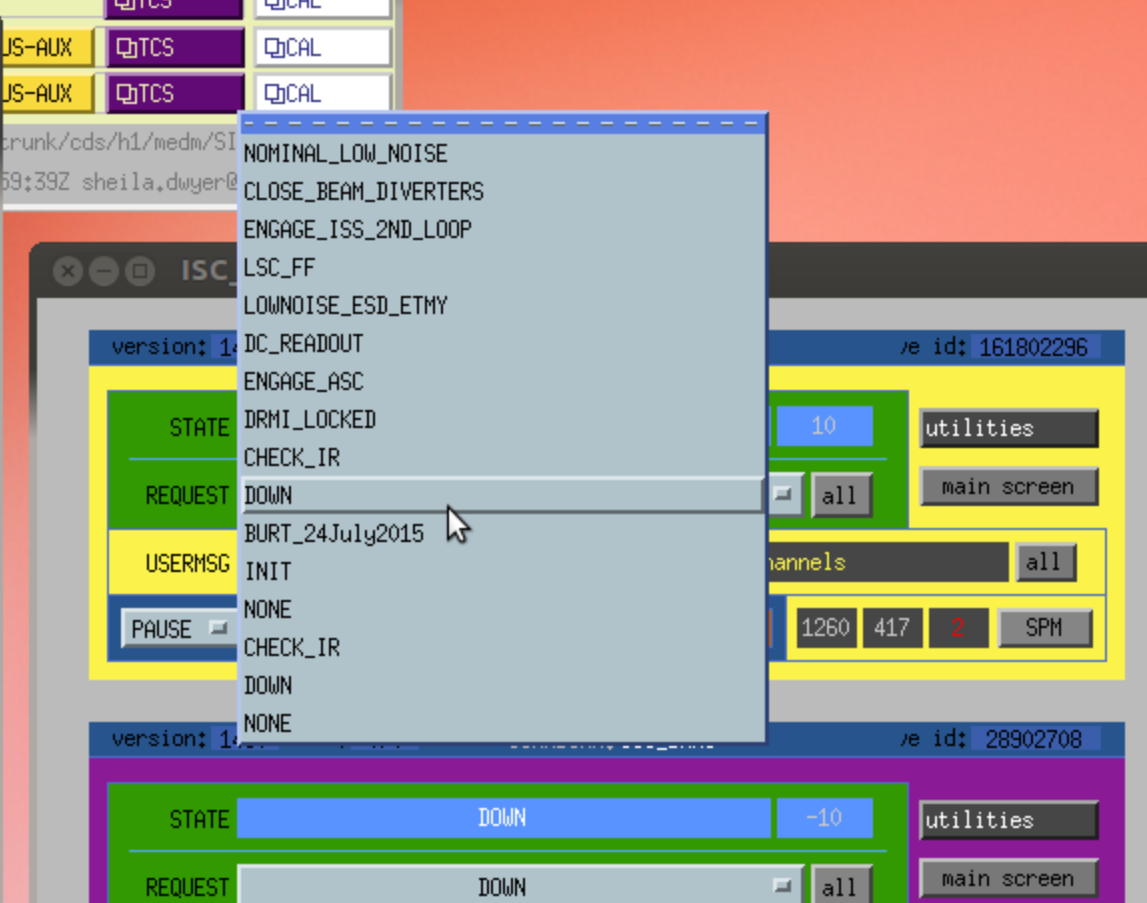
The reason that requesting ISC_LOCK to down doesn't work anyore is because I made down not a goto state. This means that there is no path from NOMINAL LOW NOISE to DOWN. (We were having problems with unintentially going to DOWN.) So when you request DOWN, the guardian doesn't actually go there. To force it to do that, you can go to manual mode and select DOWN.
I understand more now, and was not aware that you had changed that on purpose.
No suggestion for a change, just reporting what I was asked to try and the results I got.