Summary
Last weekend I used the offset-lock methof to measure the cavity length noise of the OMC. I tried this with a single-bounce beam last fall, but the intensity noise from the IMC was too large and it contaminated the signal. Here, with the carrier light from the full IFO, the intensity noise is low enough that a good measure of the displacement noise can be made, at least below 100Hz. Here I describe how to offset-lock the OMC and how the cavity length noise is measured; also I make a projection of the OMC cavity noise contribution to DARM. Noise due to OMC length fluctuations should be >10x below the DARM noise floor, except around the ISI resonances at ~1kHz.
This result is complementary to the cavity length noise measurement that Koji & I made by PDH locking the OMC with a single-bounce beam. In comparison, this half-fringe (or "offset-locking") method is limited by intensity noise, but it's less invasive and can be performed entirely from the control room. It might be useful for, e.g., estimating the OMC cavity noise during PEM injections or remeasuring the displacement noise after we install dampeners on the HAM6 ISI (still speculative).
[Yet another method is estimating the displacement noise from the dither-locking error signal; Koji has done this in April and it agrees with the PDH result below 10Hz, but above 10Hz the dither error signal is limited by sensing noise.]
Offset locking the OMC
Here are the steps to lock the OMC on the half-fringe, while the full IFO is locked (and the DARM offset engaged). This is essentially the same technique as I used last fall (and is halfway coded in the OMC guardian), which was itself a copy of what Zach did at LLO.
-
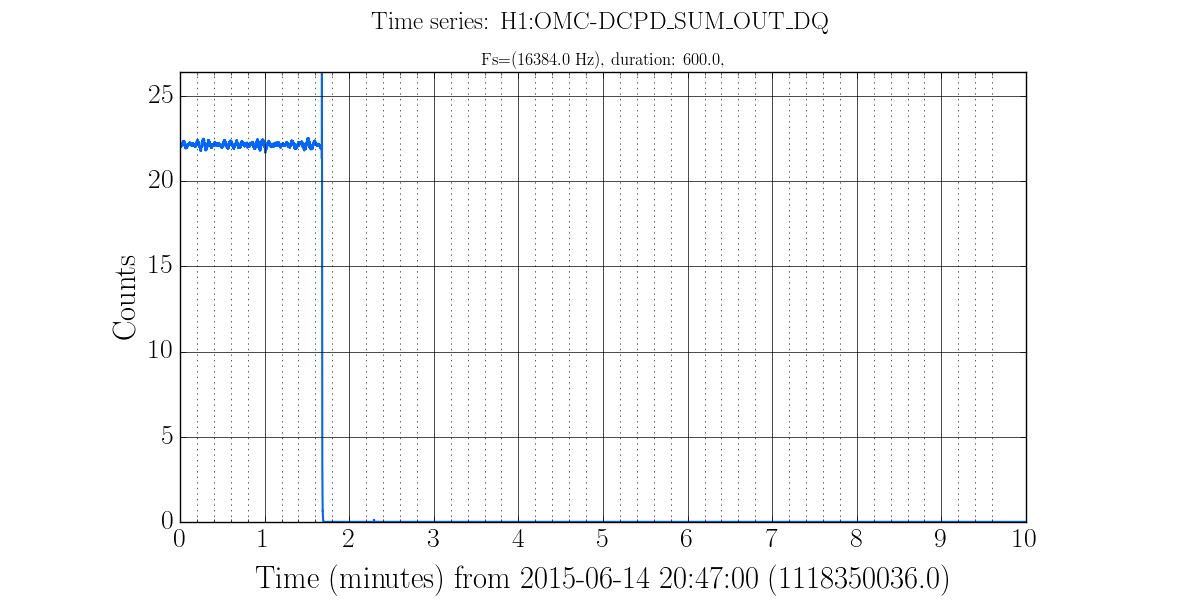
First, sweep the OMC to find the carrier TEM00 mode. Lock the OMC on the carrier with the OMC-LSC dither and record the average power. For the measurements detailed below, the power into the IFO was 2.3W, the DARM offset was 3.7e-5 counts (~42pm), and the DCPD Sum was 20.43mA. Engage the DARM boost (FM7) to reduce intensity noise. The OMC should be aligned with the QPD loops for the entirety of the measurement.
-
Unlock the OMC, turn off the input to the length servo, turn off the boost and integrator, and turn off the dither to PZT1. Zero the OMC-LSC_SERVO gain.
The next steps adjust the OMC-LSC error signal path to set the offset locking at the half fringe point:
-
Turn off the input to DCPD_NORM_FILT, and set DCPD_NORM_FILT_OFFSET to be equal to the DCPD_SUM when the OMC is locked on the resonance (in my case, 20.43mA). Now when the OMC is locked on the half-fringe the input to the dither demodulation should be 0.5.
-
Turn off the highpass (FM1) and bandpass (FM5) fitlers on the input to the demodulation (this is the OMC-LSC_PD_IN filter module).
-
Set the dither frequency to 0 Hz (normally it's 4100 Hz), and set the demod phase to 90deg (normally 0deg). This will demdulate the DCPD_NORM signal at DC and pass the cosine term to the length servo.
-
Set the OMC-LSC_SERVO_OFFSET to be 1/2 the gain of the cosine demodulation, that is, OMC-LSC_SERVO_OFFSET = 0.5 * OMC-LSC_OSC_COSGAIN.
-
Turn on the length servo, turn on the integrator, and turn on the gain. I wound up using a very small gain, 0.01 gave a UGF of ~8Hz. You may have to try this a couple of times, since there is a sign ambiguity that depends on which side of the fringe you're on.
-
Once you're locked, check that DCPD_SUM is 1/2 of what you measured on the full-fringe lock. I had to adjust the length offset (step 4) to get true half-fringe locking. Not sure why.
-
Measure the intensity noise on the OMC transmitted light (you can use DCPD-NORM_OUT_DQ), take an OLTF so you can correct for the loop suppression, and you're done. Use the SDF table to undo all your filter changes.
Measurement of OMC Cavity Length Noise
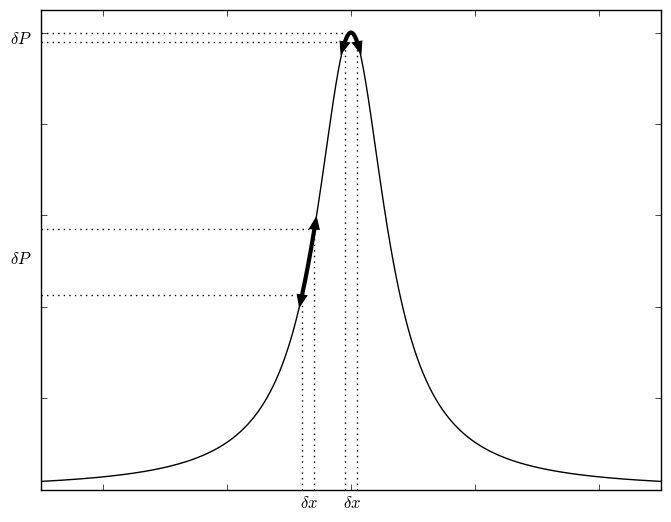
Figure 1 illustrates how the offset locking technique uses the RIN on transmission to measure the cavity length noise (delta-x). There's a theorist on my thesis committee, this is for them.
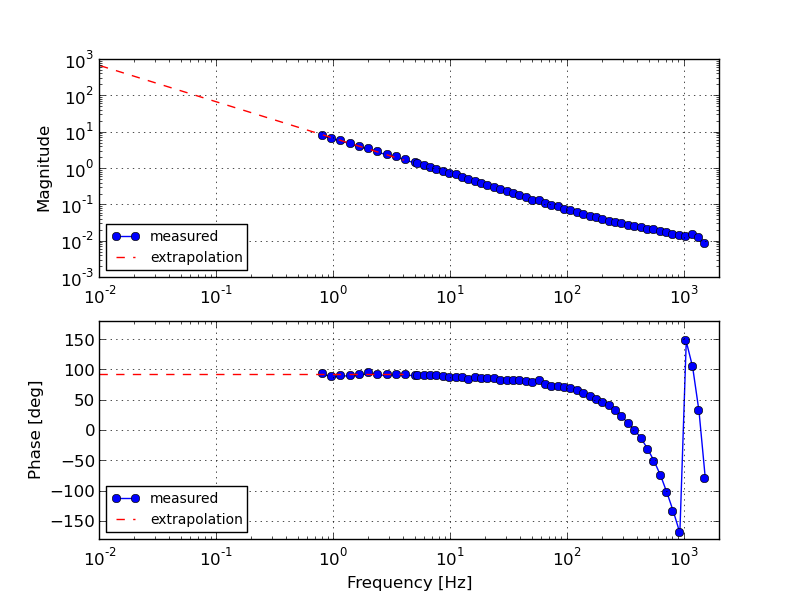
Figure 2 is the transfer function of the length servo, while locked on the half-fringe. This was used to correct for the loop suppression.
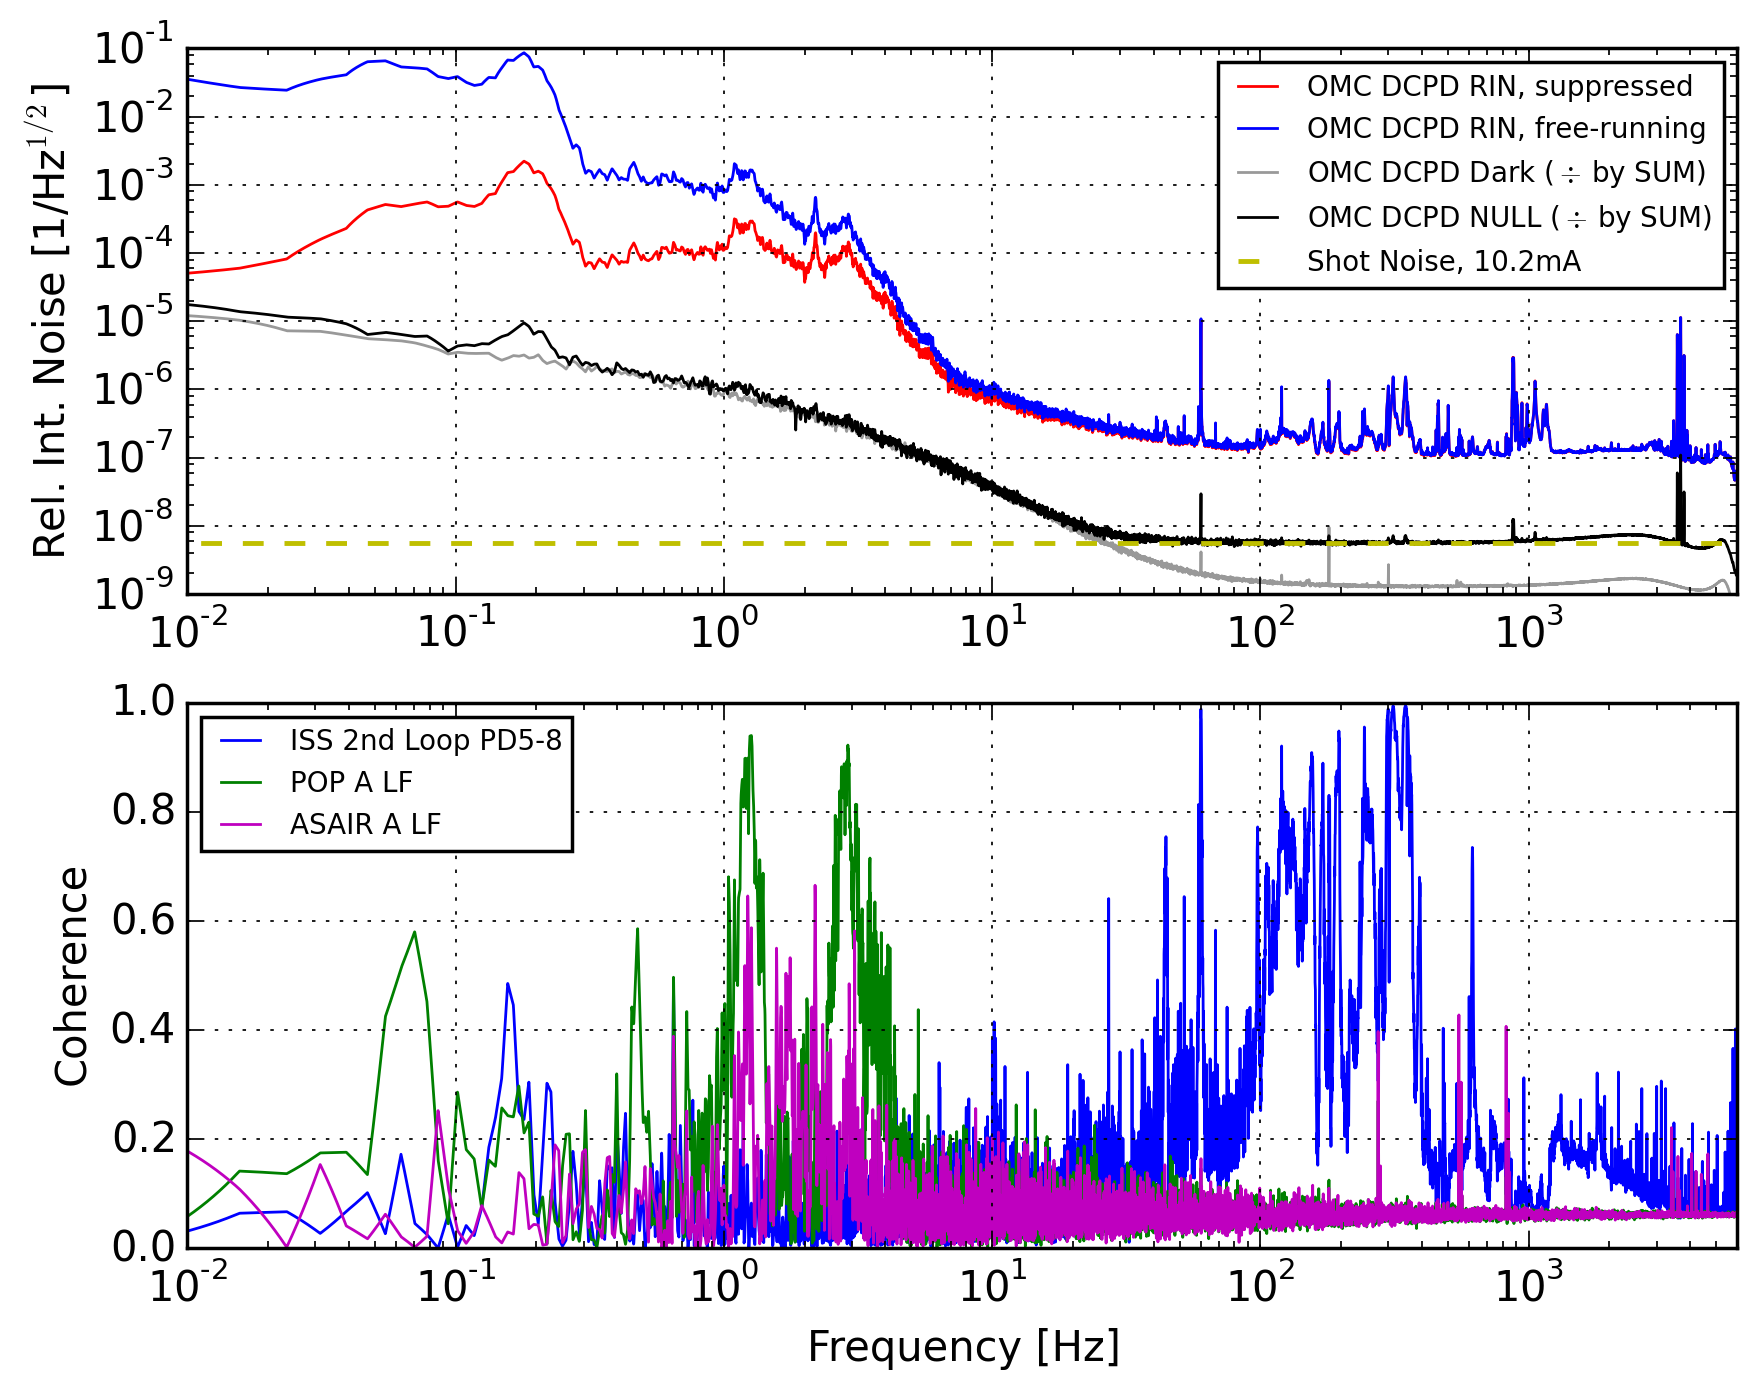
Figure 3: the top panel is a plot of the measured RIN during the half-fringe lock (red), and the same data corrected for the loop suppression (blue). The RIN has a noise floor of ~1e-7 / rt[Hz] above 100Hz. This noise is coherent between the DCPDs and is well above the shot noise + dark noise level. (To demonstrate this I plot the NULL stream, along with the DCPD dark noise; both of these were convereted to RIN-equivalent noise by dividing by the DCPD_SUM during the offset lock, 10.2mA. The shot-noise RIN for 10.2mA is in good agreement with the NULL channel.)
I think the noise floor is due to intensity noise coming from the IFO, and above 100Hz we are not measuring RIN due to cavity length fluctuations (except around 1kHz, more on this later). This 1e-7/rt[Hz] noise floor matches the noise floor of the ISS 2nd loop PDs (not plotted), but the coherence is not =1 everywhere. Why isn't it filtered by the IFO?
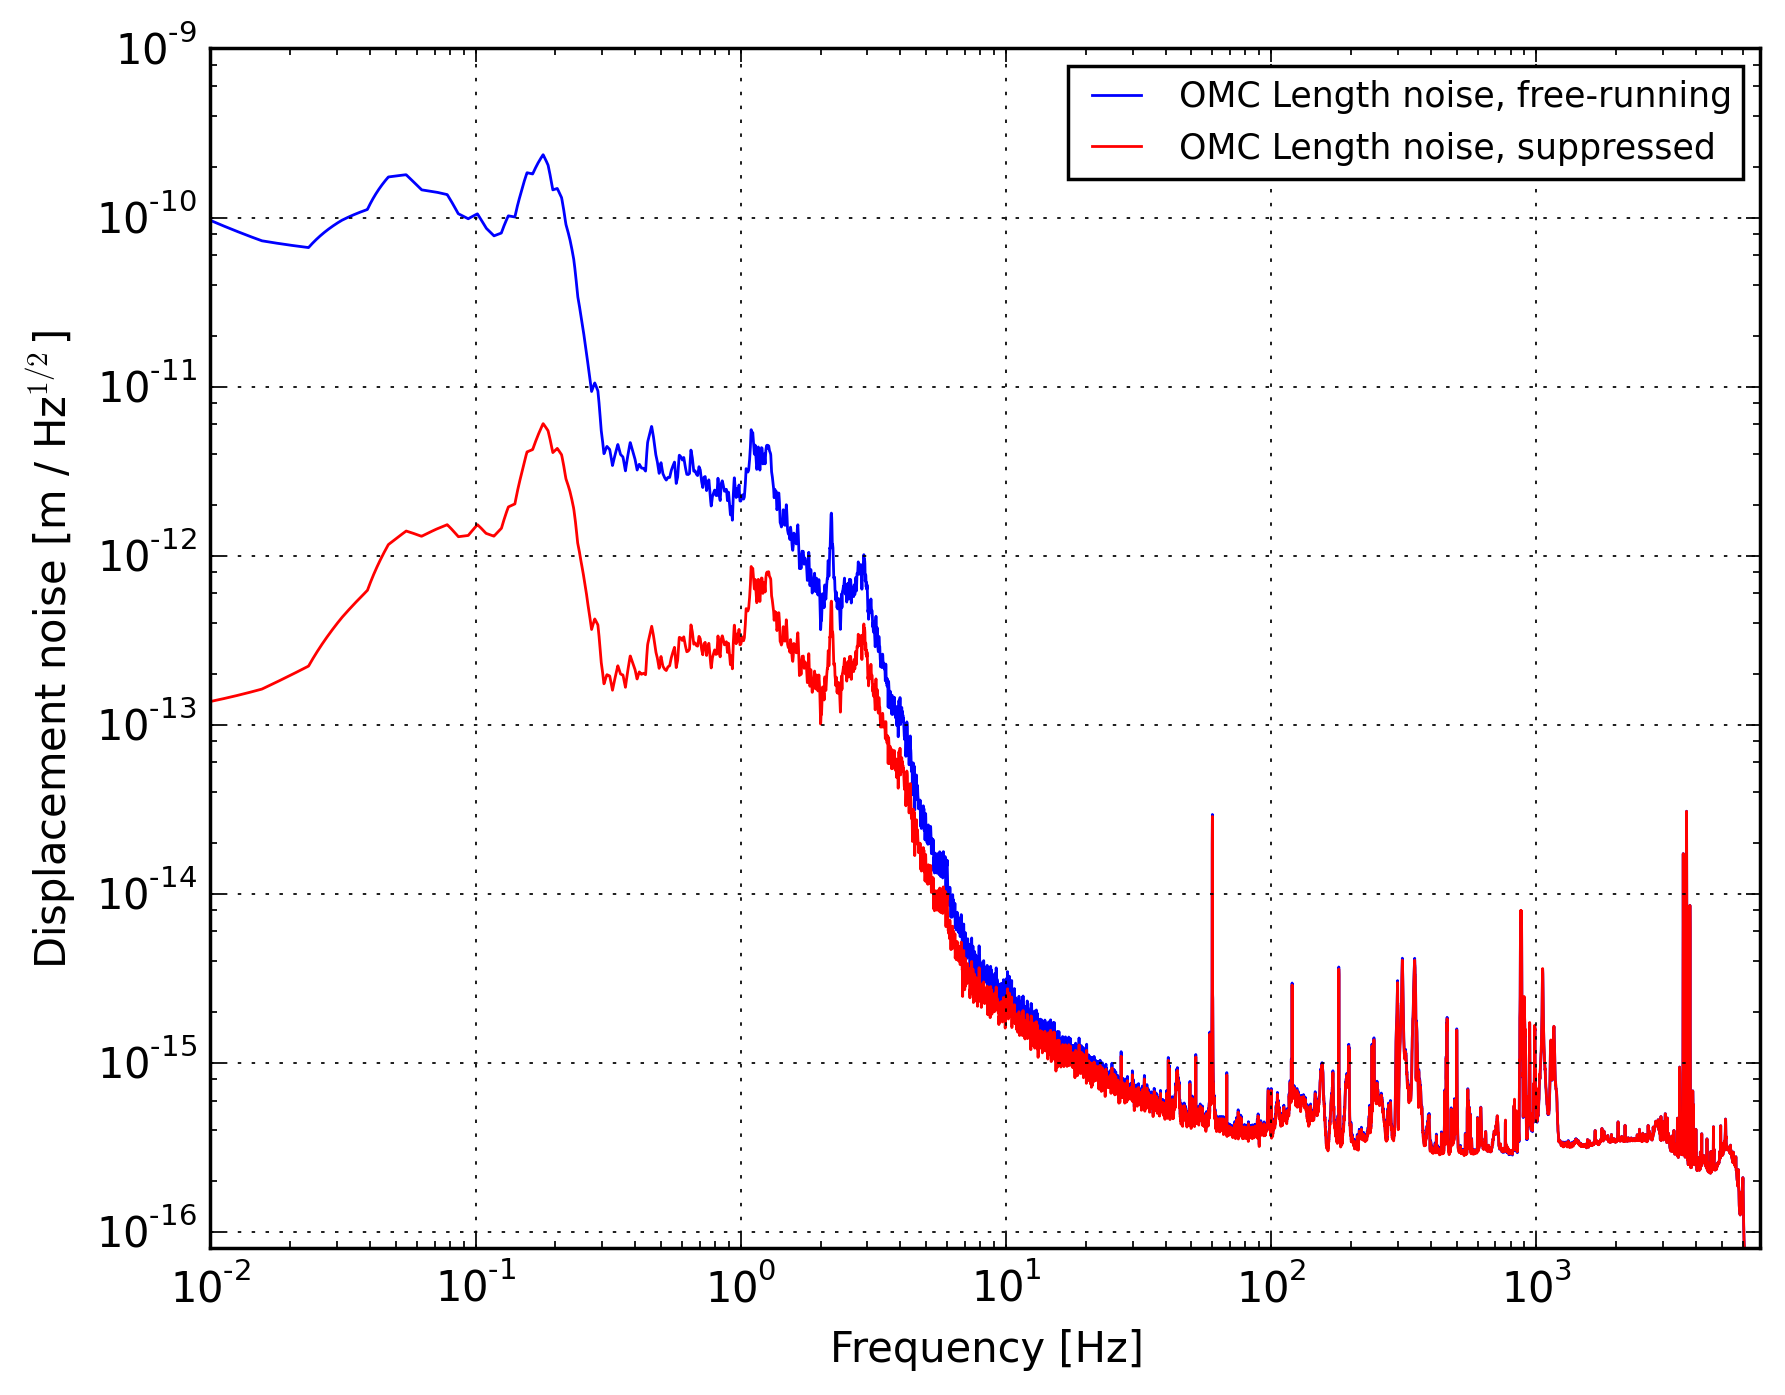
Figure 4 is the cavity length noise derived from the RIN measurement, red is the in-loop data, blue is the 'free-running' length noise (corrected for loop suppression). The displacement noise is calculated from the RIN using the RIN/dx relationship, derived from the cavity transmission formula. For the OMC, locked halfway up the fringe, the conversion is 2.72e-9 meters/RIN - to get this number you need to know the transmissivity of the OMC input and output mirrors, it is 8000ppm.
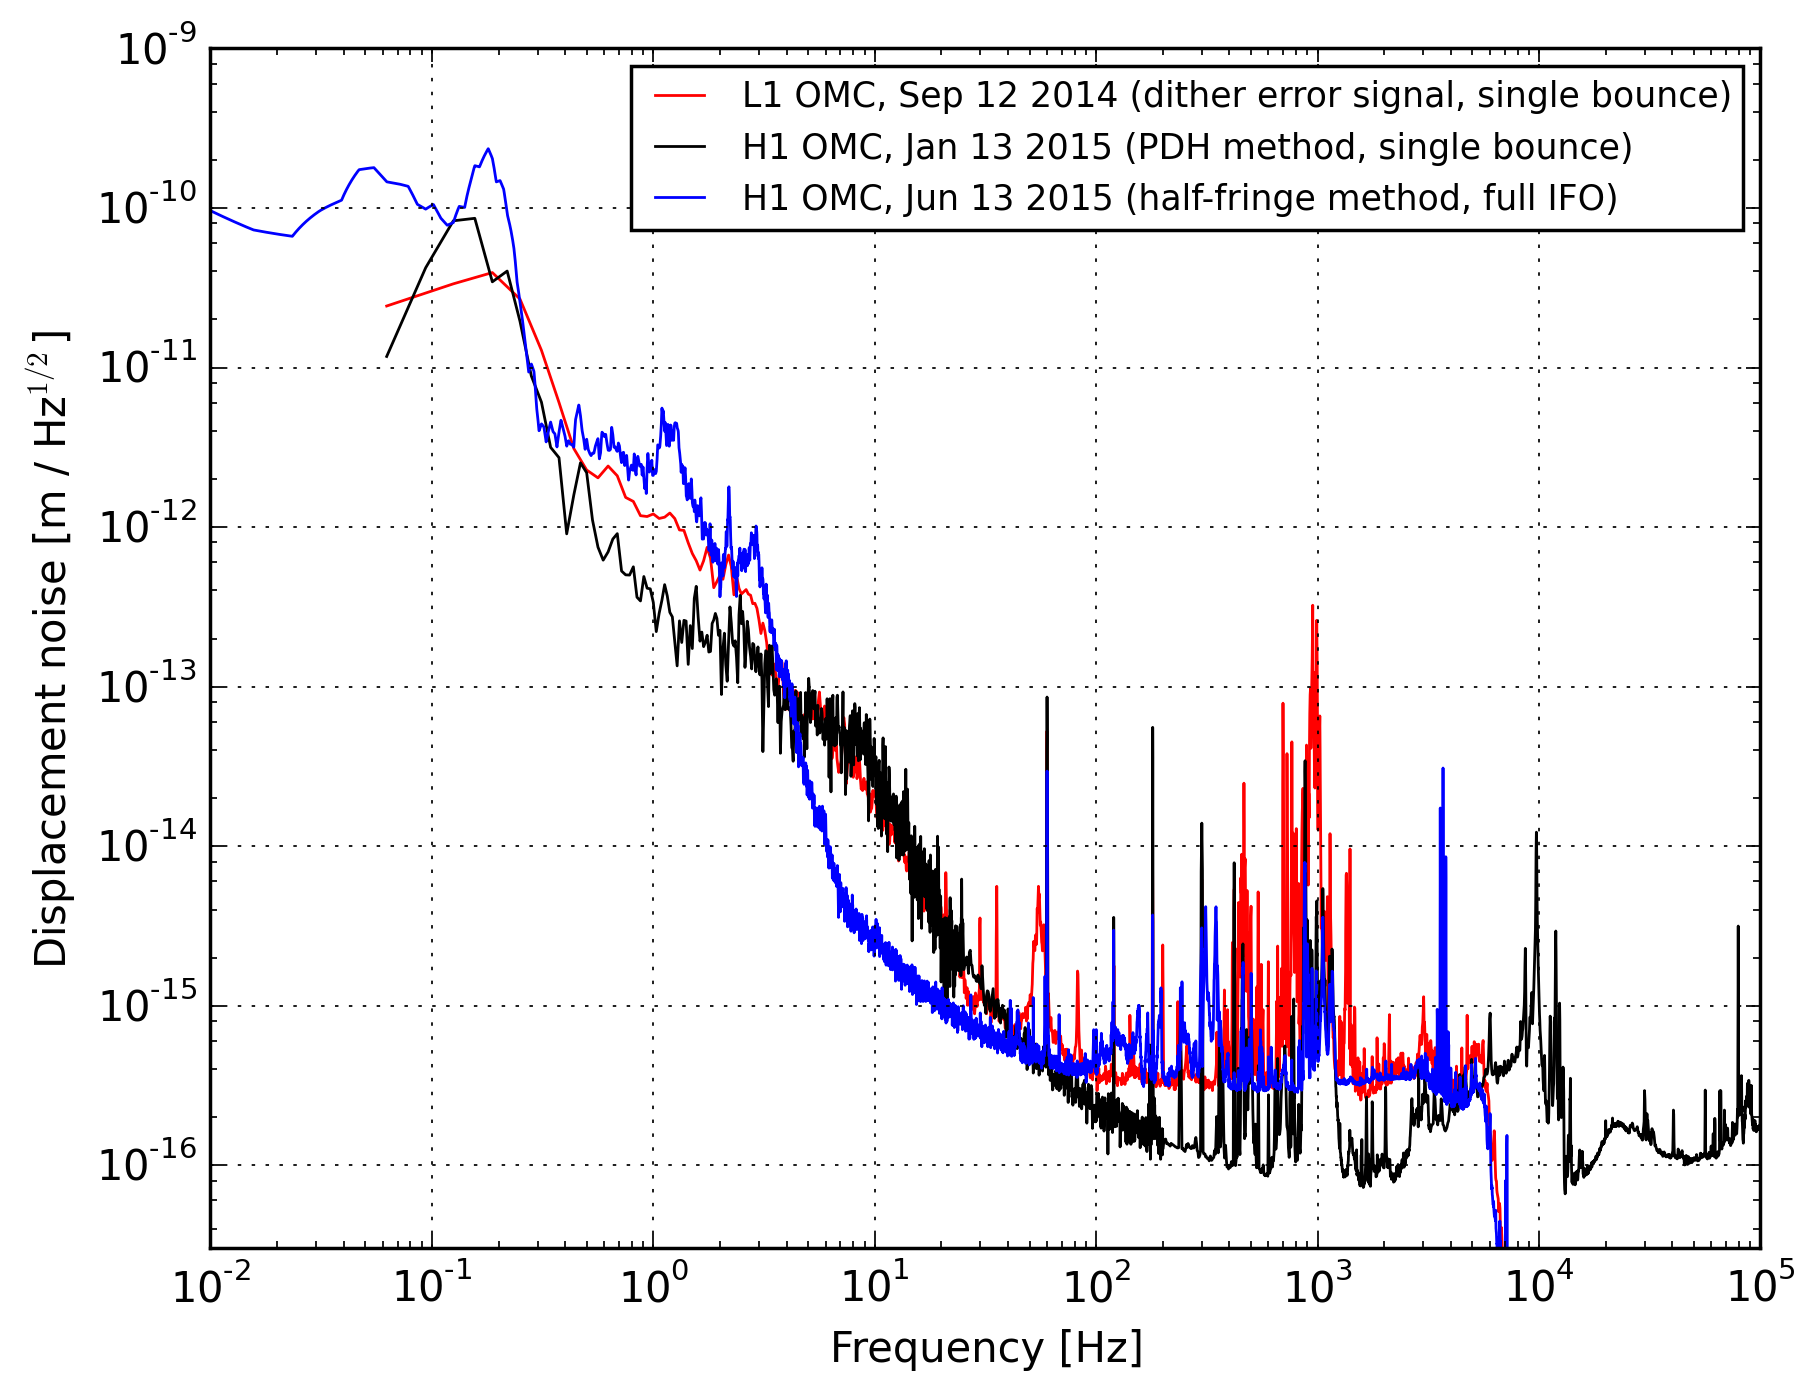
Figure 5 is a comparison between our measurements of the OMC displacement noise: Zach's measurement from L1 (red); Koji's result from the PDH lock of the OMC (black); and this measurement (blue). This plot is an update of LHO:16174. In general the measurements are in agreement. The PDH result has a lower noise floor above 100Hz; probably the other measurements are limited by intensity noise. The half-fringe result is lower than the others around 10Hz; Koji measured the noise from the PZT drivers in January, this may be the limiting noise source for the current measurement. (Zach says that the L1 measurement is possibly limited by laser frequency noise in the 3-40Hz band.) The peaky excess in the half-fringe result around 1Hz and 3Hz are coherent with intensity noise and are not real cavity motion, see Fig. 3.
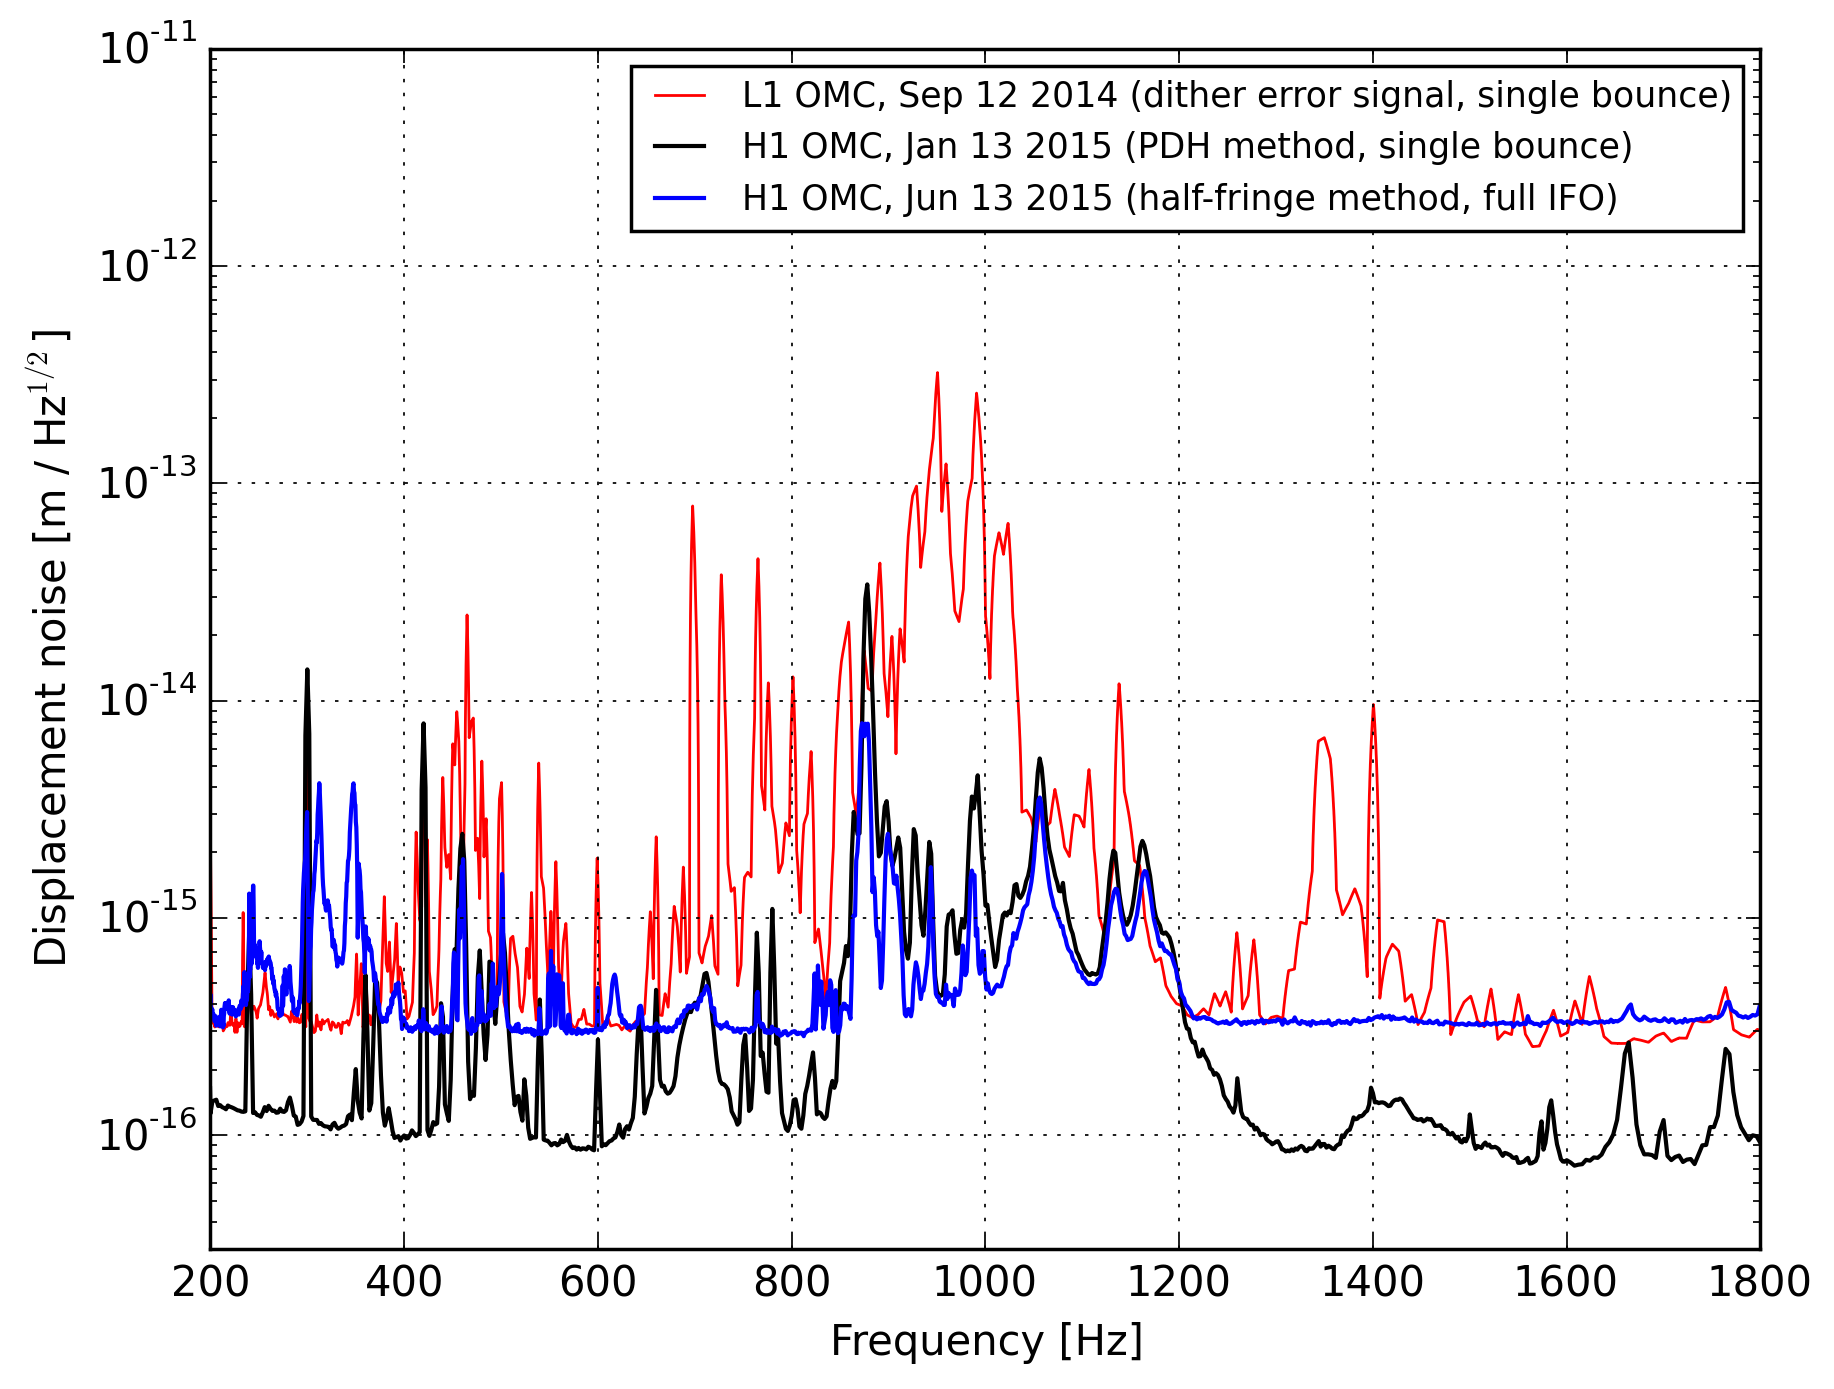
Figure 6 is a zoom of the region around 1kHz.
Projection to DARM_ERR
Here I estimate the contribution of OMC cavity length noise to the DARM noise. Valera, Ryan, and Sam discussed this in G1100903, and I think my methods are essentially the same as what they describe.
First, the noise in the light transmitted through the OMC due to the (suppressed) cavity length noise can be calculated two ways:
-
by modeling the quadratic coupling of length noise --> DCPD_SUM when locked on the full resonance
-
by modeling a bilinear coupling between the RMS cavity offset and the length noise.
For the quadratic case, we calculate the noise in the power measured by the DCPDs due to the cavity length noise as:
dP[f] = (4*F/lambda)^2 * ASD[x(t)**2]
...where F is the cavity finesse (=391), lambda is 1064nm, and the final term is the ASD of the square of the cavity length noise, x(t). This is a quadratic approximation to the peak of the Fabry-Perot transmission curve, for the OMC it is accurate for motion less than ~3e-11 meters, which is true for our data across all frequencies. [Important: you have to take the ASD of the square of the time-series, not the square of the ASD -- the Fourier transform is a linear operator but squaring is not. Thanks Sheila!]
Alternatively, the bilinear coupling is estimated as:
dP[f] = (4*F/lambda)^2 * 2 * x_rms * ASD[x(t)]
I've used x_rms = 3e-13 meters, although this could be an overestimate (see comment below).
Next, to convert dP[f] into an estimate for the DARM noise budget, I turn the crank on the DCPD_SUM --> OMC-READOUT_ERR calculation that is described here:
OMC-READOUT_ERR = DCPD_SUM * (Pref / P0) * xf**2 / (2*x0) * G
...where Pref = 1.56 (power normalization), P0 = 24.1 (input power, Watts), xf = 14 (fringe offset, picometers), x0 = 15.8 (DARM offset, picometers), and G = 8.56e-7 (overall gain factor). These are the values during the lock on Jun 7 at 00:00 UTC that Evan used for his latest noise budget. This calculation converts DCPD_SUM in mA into counts at the DARM_IN1 error point.
Finally, to convert counts of DARM_IN1 into meters of CAL-DELTAL displacement noise, I use a factor of 5e-7, a zero at 389Hz and a pole at 7kHz. The factor of 5e-7 was estimated by matching DARM_IN1 to CAL-DELTAL_EXTERNAL_DQ in DTT. This is about 3x larger than what I expected, based on the calibration of the DARM offset in counts to picometers: 1e-5 counts / 14 picometers. Not sure why there is this discrepancy.
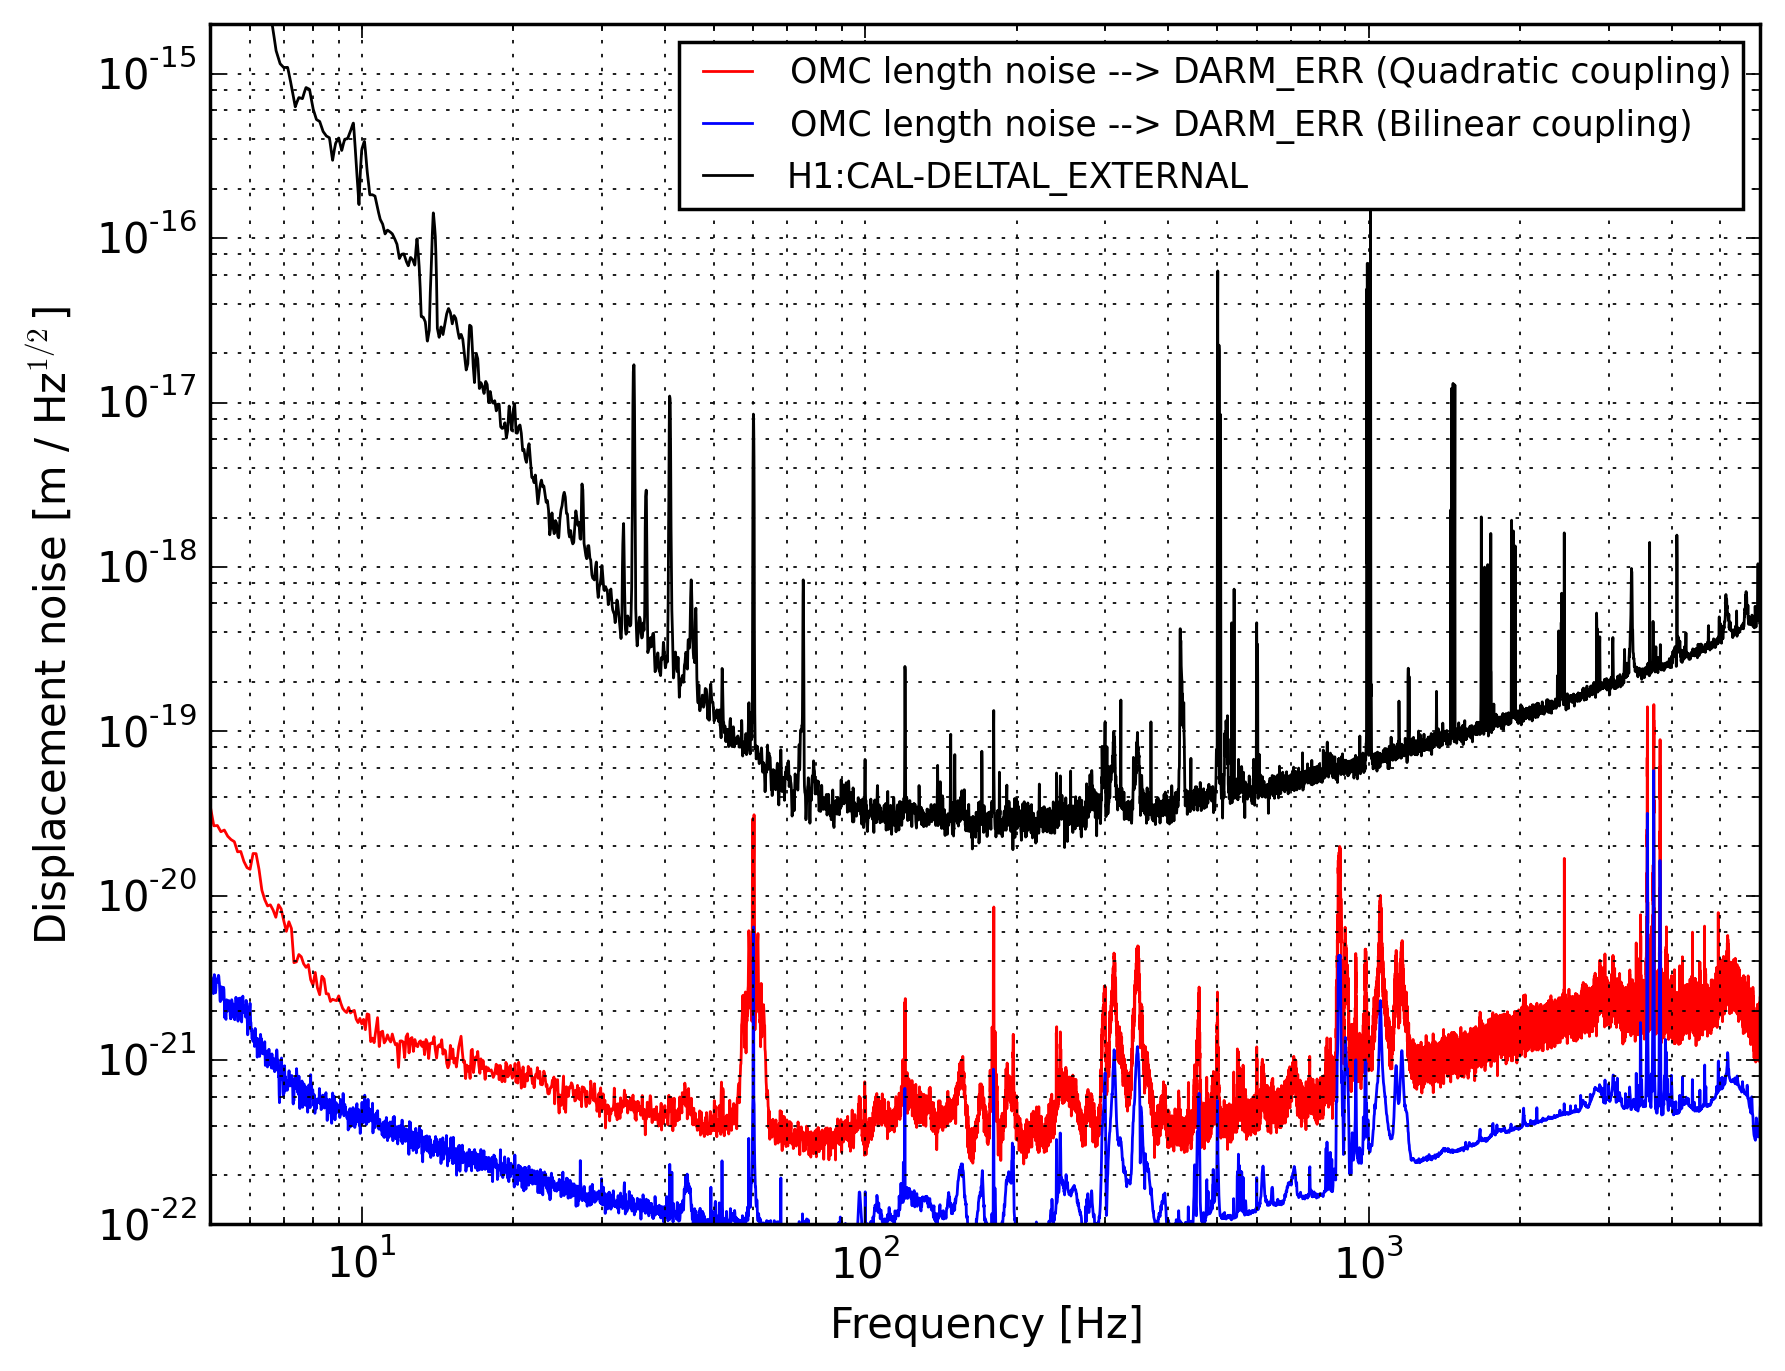
In Figure 7 I plot the CAL-DELTAL spectrum from June 7 with estimates of the contribution from the OMC, using the quadratic and bilinear coupling results. As mentioned before, the OMC length noise projection above 10Hz is probably limited by intensity noise and is bogus, except for the peaks around 1kHz, which are about a factor of two below the noise floor. If this result is correct, it's an ongoing mystery as to why we don't see this 1kHz noise in the DARM spectrum. Robert has investigated the acoustic coupling in this band and also projects that some noise at ~900Hz should be peaking above the noise floor. Why don't we see it?
For interested NoiseBudgeters, the attached text files have the data for the red (quadratic) and blue (bilinear) traces in Fig. 7. (You shouldn't think this noise source has gone unattended in the noise budget until now: Evan says he had measured the OMC-->DARM noise coupling some time ago, using excitations into the OMC-LSC loop, and had convinced himself the OMC wasn't a source of broadband noise. No reason to think any different from this study.)


Depreciated is ok.
IRIG-B revision 85 is reported as 133 due to a decimal-to-hex conversion error. Not enough reason to update.
The error reporting will take this into account, when the updated EtherCAT code is loaded.