kyle.ryan@LIGO.ORG - posted 09:08, Tuesday 16 June 2015 (19165)
~0840 hrs. local -> Started VBOB pumps in OSB Bake Oven lab
Kyle, Gerardo

Vented X-end (DP < -45 C)-> Vented Y-end (DP < -35 C) -> Installed NEG assembly on BSC6 -> Installed TMDS reducing nipple+valve+elbow on BSC10


Kyle, Gerardo, Bubba

Removed BSC9 West door at X-end -> Removed BSC10 North door at Y-end


Bubba

Connected TMDS 100 psi line to purge-air skid
(Keita, Kiwamu, Corey)
After the Vacuum crew removed the door, and Jim Warner locked up the ISI (& removed the Contamination Control plates), we started TMS work. Summaries of the TMS activities are below:
1) Green Clipping
The ETMx Bias were:
In order to center the beam on the ISCT-EX REFL_PD, the ETMx was steered to the following biases:
After this Keita entered the chamber and looked for clipping. He started with the first steering mirror on the TMS, the one that showed very bright scattering back in Feb., and no clipping was observed this time though the beam was somewhat low, and there was some ghost beam hitting the top right edge.
Keita checked downstream optics and no clipping was observed either. No changes were made to the TMS optics alignment.
2) Strain Relief of QPDs
Ran into a problem with attaching the Strain Relief Parts (D1101911 & D1002110) to the QPDs. The problem was attaching the Strain Relief Clamp (D1101911) to the main QPD Housing. Unfortunately, the 1/4-20 hole in the housing had bad threads for two of the four QPDs. It's a thru-hole and screw could only go in a thread or two. My guess is the machinist tapped the holes from the backside with a tapered tap & didn't tap all the way through. So some of the threads at the entrance of the hole aren't cut completely.
Keita & Kiwamu went ahead and installed the Strain Relief Assy on the two QPDs which were fine.
As for the remaining two, we might use thinner 10-32 or 10-24 screws, long enough to go through the QPD base and the strain relief combined, and use a nut and two washers if such things are found. Otherwise we'll leave them without strain relief, as there's more than 1/4" of space between the cable collar and the metal part of the QPD support structure.
3) Krytox Beam Diverter
Corey went into the chamber, loosened the screw that attaches the shaft collar to the axle, slid the axle and the jewel bearing out on one side, applied Krytox, did the same to the other side, rebalanced the diverter by attaching 5 1/4" and one #8 vented washers as a counter mass, and assembled everything together.
This was done all in situ. Tested opening/closing via MEDM several times and it worked fine.
I modified ASC_MASTER today to give us the option of using AS 45 Q Yaw signals to damp roll, because yesterday we saw that this was needed for ETMX. The model is committed, and I added an medm screen that is linked from the ASC overview and the small bounce roll monitor screen for the matrix. The ASC model changes were done today because Adam at LLO will also work on this library part tomorow durring maintence.
I also added log scale monitors to the oaf model, but made two typos in doing this. I've fixed the mistakes and recompiled the model, we will wait to do a make install until the normal maintence time tomorow.
Modified installed Matlab 2010a system libraries to point to Ubuntu12 system libraries to allow awgstream to run. This is an unusual request, as the control room is set up to run Matlab 2012b by default, but one user had a script which runs with Matlab2010a (but not 2012b).
All times in UTC
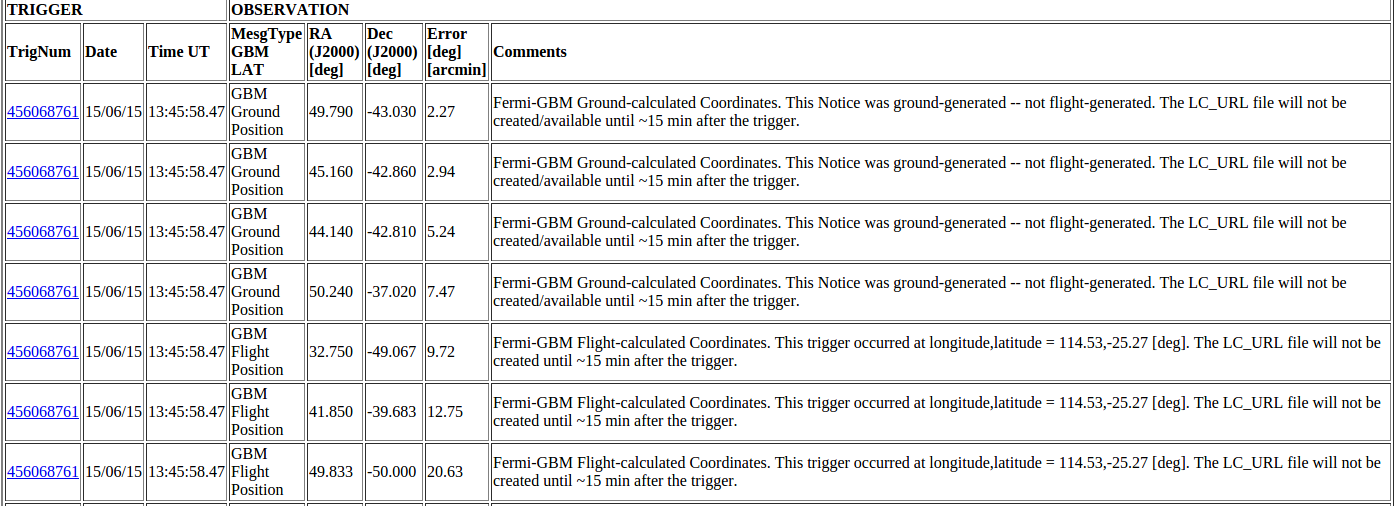
15:00 It Seems the NPRO trippedhttps://alog.ligo-wa.caltech.edu/aLOG/index.php?callRep=19141. GRB alert/alarm is sounding so I'm getting my first look at where thing are regarding this. LASER is back up and Peter i working on getting it back into nominal operating condition. End Station LASER status is BUILDING SAFE for vent work. This means all viewports are secured, ISC tables are locked and safety signs have been transitioned.
15:31 Cleaning crew done second cleaning at EX and goin to EY
15:44 Peter to Transistion the LVEA to LASER SAFE
15:46 Turned of both CO2 LASERS.
15:57 Gary ad Danny to EX
16:00 LVEA transitioned to LASER SAFE.
16:02 Picomotors disabled at EX, EY and HAM6
16:09 Bartlett to cleaning area.
16:25 Bartlett came out and went back in to prepare HAM6 area for Vent
16:26 Cleaning crew done with second cleaning at EX.
16:33 ISS is stable now and the REFSIGNAL is set to -2.12 for 6.5% AOM diff power
16:36 GV20 (EX) closed. (not sure what time). Gary and Danny to EY to meet Kyle. GV18 Not closed yet.
16:57 Closed Green Beam ISC table shutters
17:15 Arnaud testing a script to test MC1 suspensinon actuators
17:22 Danny and Travis at EX
18:00 Betsy, Travis, Danny and Gary to EY
18:06 Bartlett to EY
18:10 Karen and Christina into LVEA for cleaning
18:14 J Worden and co. dropping a ditch digger of at the turnaround next to VPW.
18:21 Jeff leaving EY
18:24 Ditch machine dropped off and Truck is moving to MX to pick up a scissor lift
18:28 Gary and Danny back from EY
18:46 Betsy and Travis back from EY
18:48 Hugh back from EX
18:57 GV18(EY) closed
19:12 Corey into LVEA
19:15 Betsy into the LVEA w Bay
19:30 Betsy out nd going to EX
19:38 Sheila informed me of a not so distant DAQ restart.
20:00 Danny and Travis to EY
20:16 Jim is at EX and garbing. He will lock the ISI in about 20-30 min.
20:44 Keita, Kiwamu and Corey to EX to start TMS investigation.
21:03 DAQ restart
21:15 Kate and Calum on site. They will be here for a couple of weeks.
22:18 Hugh into the LVEA to install 2 STS2 seismometers in the BG
22:32 Hugh out of the LVEA
22:42 Betsy out to HAM6 to have a look
Generated Xilinx iMPACT configuration archives (.iaf) for most recent timing firmware and uploaded them to the DCC pages corresponding to their respective device firmware:

1PPS Locking Firmware:
https://dcc.ligo.org/LIGO-E1200033

Comparator Firmware:
https://dcc.ligo.org/LIGO-E1200034

IRIG-B Firmware:
https://dcc.ligo.org/LIGO-E1200035

DuoTone Firmware:
https://dcc.ligo.org/LIGO-E1200036

The links for these .iaf files on the FPGA code page of the Timing Wiki (https://awiki.ligo-wa.caltech.edu/aLIGO/TimingFpgaCode) are now functioning.
To correct problems with the Simulink web view of models (accessible from https://lhocds.ligo-wa.caltech.edu/simulink/) several models have been changed to be saved at the top level of the model.  If this isn't done, the top level of the model is not generated for the web view.  The models which were changed are:

h1iscex
h1iscey
h1isietmx
h1pemcs
h1pemex
h1pemey
h1pemmx
h1pemmy
h1susauxb123
h1susauxh34
h1susetmx
h1susim

There are still a few models that need to be changed.
This appears to be correctable without modifying model files by adding parameters to the slwebview() call in the matlab script. I'll make the change in time for the 18:00 hour model web view to see if it works.
Attached is a noise budget for the DARM spectrum from 2015-06-07 00:00:00Z–02:00:00Z. Notes:
Conclusions:
Attached are the MICH and SRCL coupling TFs into OMC-DCPD_SUM.
Restarted the data concentrator because of changes to the h1asc and h1oaf models.
model restarts logged for Sun 14/Jun/2015
2015_06_14 00:04 h1fw1*
2015_06_14 15:31 h1fw1*
* = unintentional restart. Last day of ER7.
Have locked HEPI at X End.
The rotational DOFs are within ~100nrads of the closed loop running position. The Translational DOFs were let go as the Rots were dialed in: X -5um, Y +67um, Z +108um. These are the deltas from the nominally servo'd position.
The PSL is back up. PMC is locked @ 23.2W w/2.4W in refl. This is slightly over the 10% that is consideredthe high range of optimal.
The ISS is stabilized at 7.2%diffracted power.
The FSS TPD is showing 1.34V
Frontened watchdog not reset (RED) output power @ HPO is 28.9W
HPO (not used) watchdog is RED.
I'm told this was intentional. I wasn't informed.
This was actually completely accidental. Peter and I went out to see if we could pull a log off of the NPRO UPS as part of our investigation into this morning's NPRO trip. Turns out that when you plug in a DB9 cable to the back of the UPS, the UPS shuts off. We did not know this. Now we do. Note to self...
In other news we were not able to establish communication between the laptop and the UPS, not sure why. Will continue to investigate.
That make me feel much better about not having gone out there alone to try it!
ISS is stable now and the REFSIGNAL is set to -2.12 for 6.5% AOM diff power
It seems that the pitch control signal sent to SR2 (from the AS_C sensor) is correcting mostly for motion of SR3, especially in the first hour after powering up. We should think about changing this feedback from SR2 to SR3 after the engineering run.
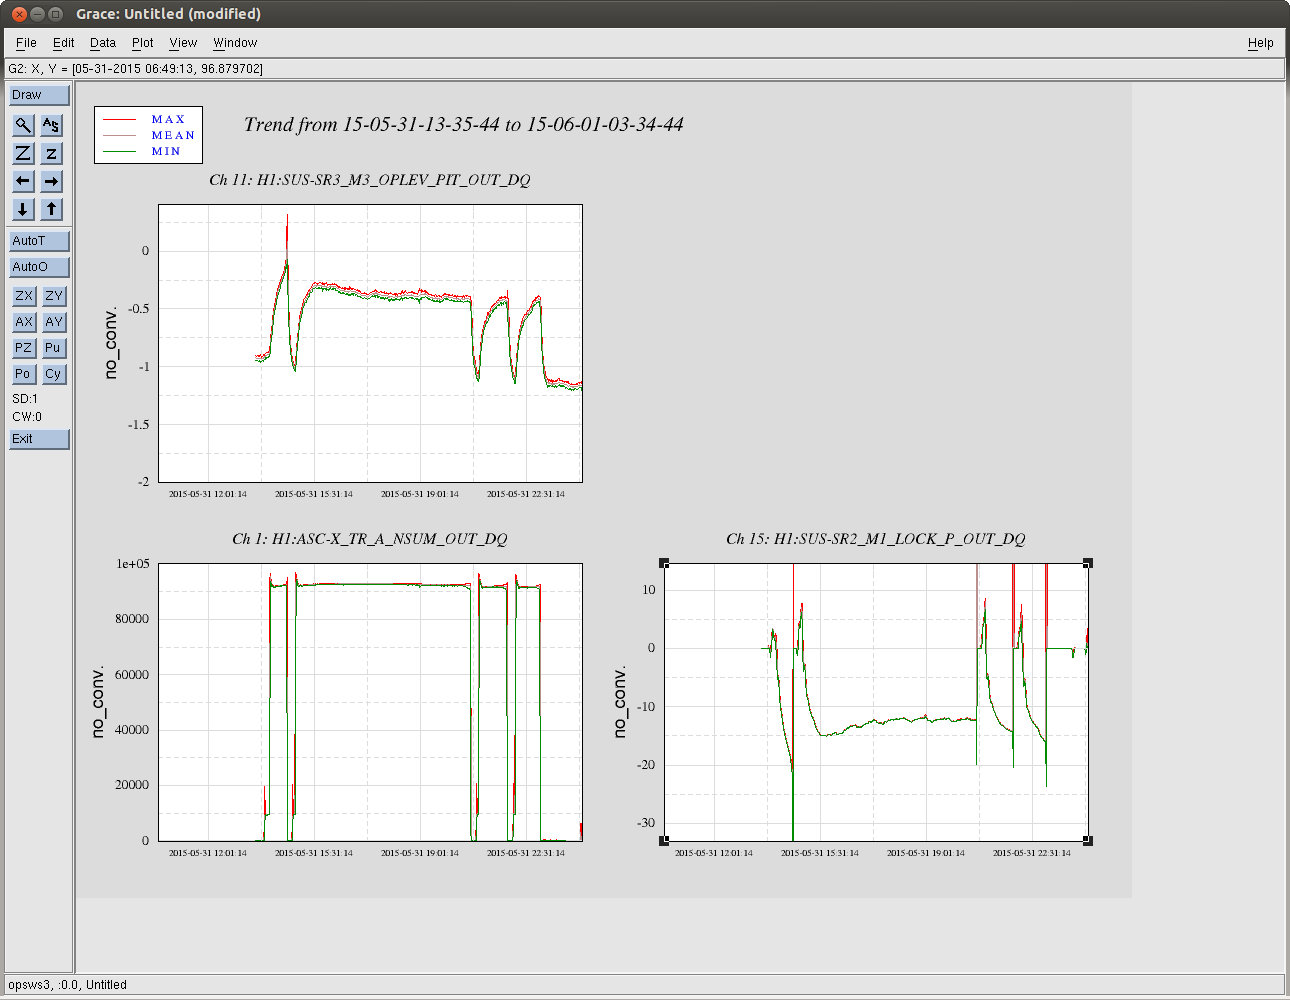
Some more information:
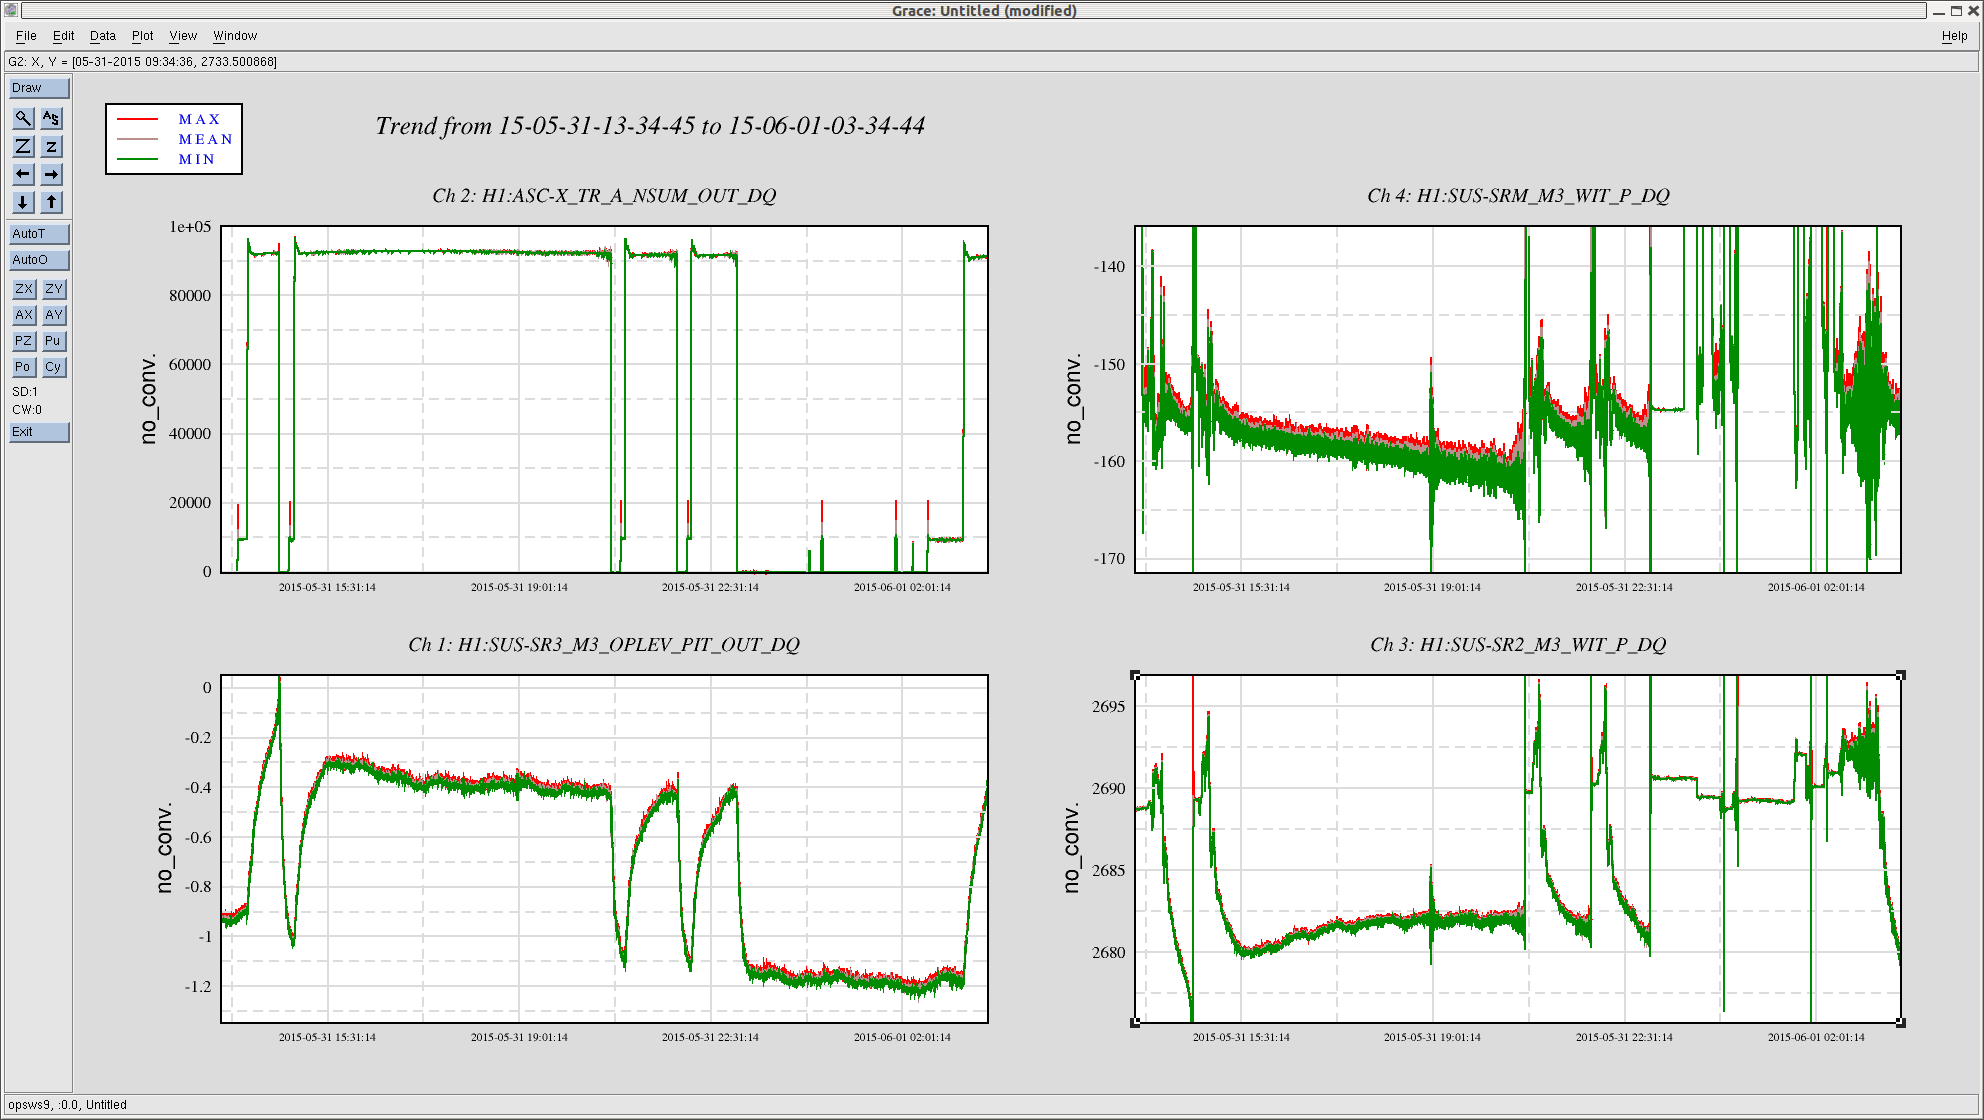
As the interferometer gets warmed up, SR3 pitches by 0.7 urad upward while SR2 pitches down by 10 urad via the SRC alignment loop. On the other hand, it is hard to tell how SRM reacts to the heated interferomter. See the attached trend which has the same time period as that Sheila posted.


Jeff and Greg found the necessary screws, washers and nuts, so we'll do the rest of QPD strain reliefs the first thing in the morning, then rebalance TMS. We'll be done by noon-ish.
EX station is left in laser hazard.