00:00 Jim left the interferometer locked for me!
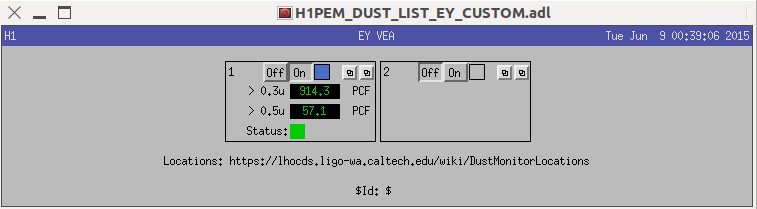
EY dust monitor went off. > 0.3 u has 914.3 counts/ft^3, >0.5 u has 57.1 counts/ft^3
2:42 Lock loss
3:00 AS 90 too low. Adjusted BS yaw did the job.
3:11 Lock loss at BOUNCE_VIOLIN_MODE_DAMPING. Redo the initial alignment.
3:20 LSC-TR_X Not flashing. Realigned SR2, SR3, and PR2 pitch and yaw.
04:30 Locking at LSC_FF. Intent bit switched to Undisturbed. Guardian worked fine at LOWNOISE_ESD_ETMY step (I was told that it might not work properly). I think it worked at BOUNCE_VIOLIN_MODE_DAMPING as well (after running the code by hand I accidentally let the Guardian run through this state. It didn't lose lock).
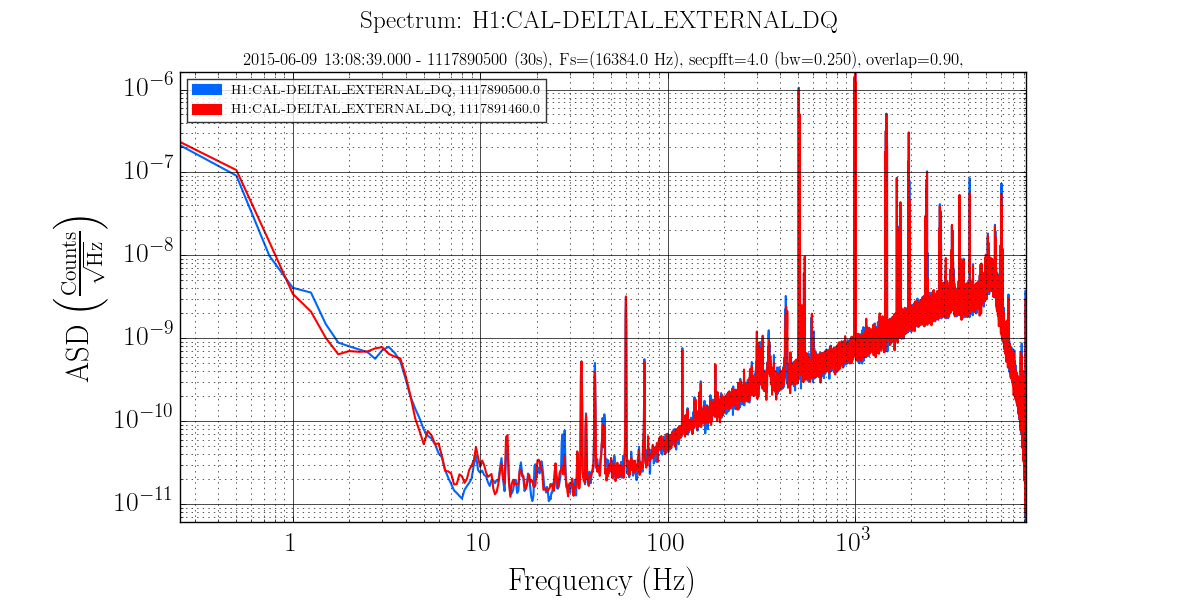
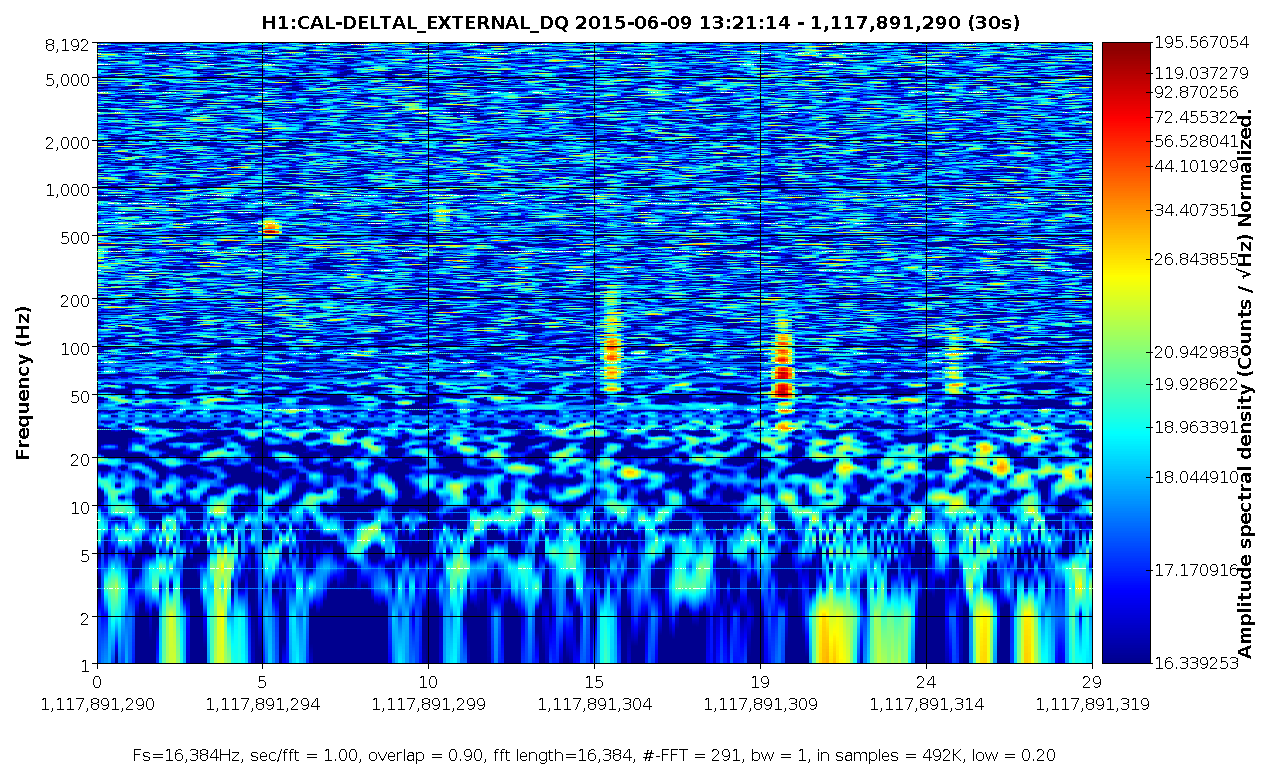
6:06 Intent bit switched to Commissioning. Get ready for the hardware injection (scheduled to start at 1117890580 GPS time)
6:09 Injection started
6:13 Injection finished. Intent bit switched to Undisturbed.
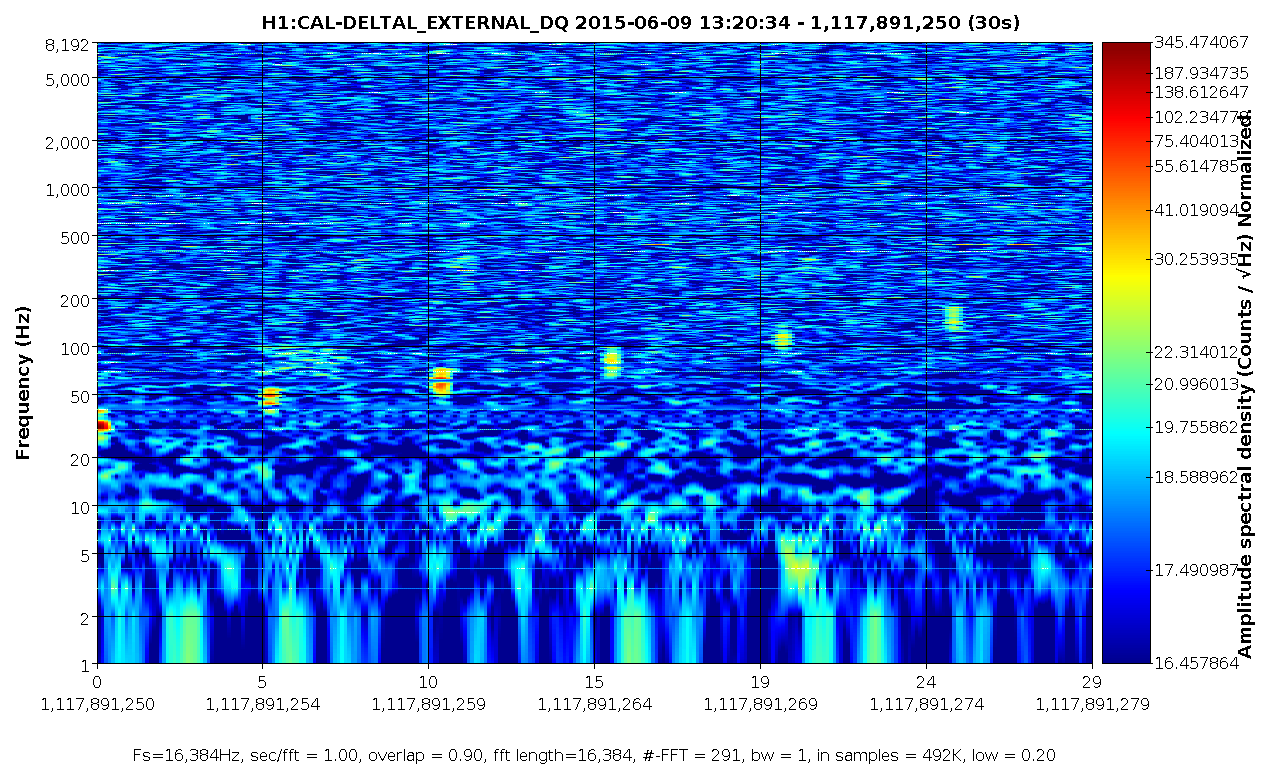
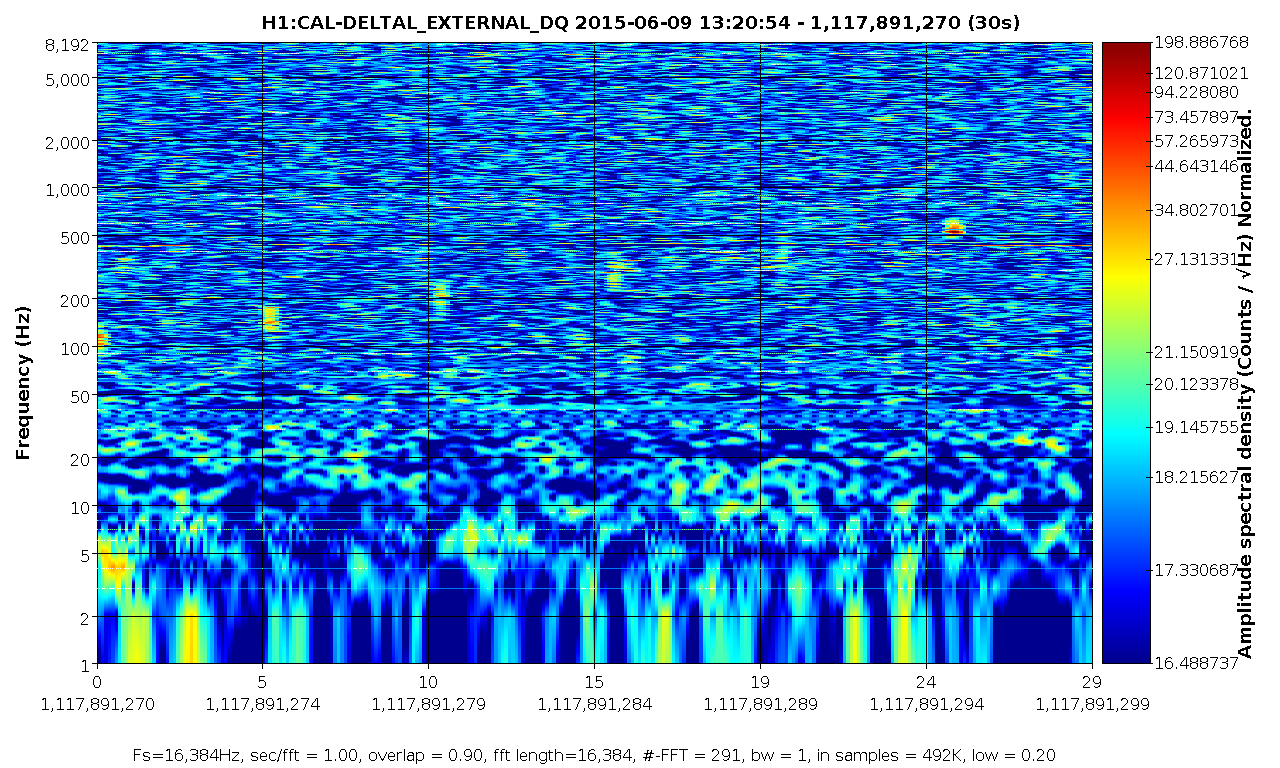
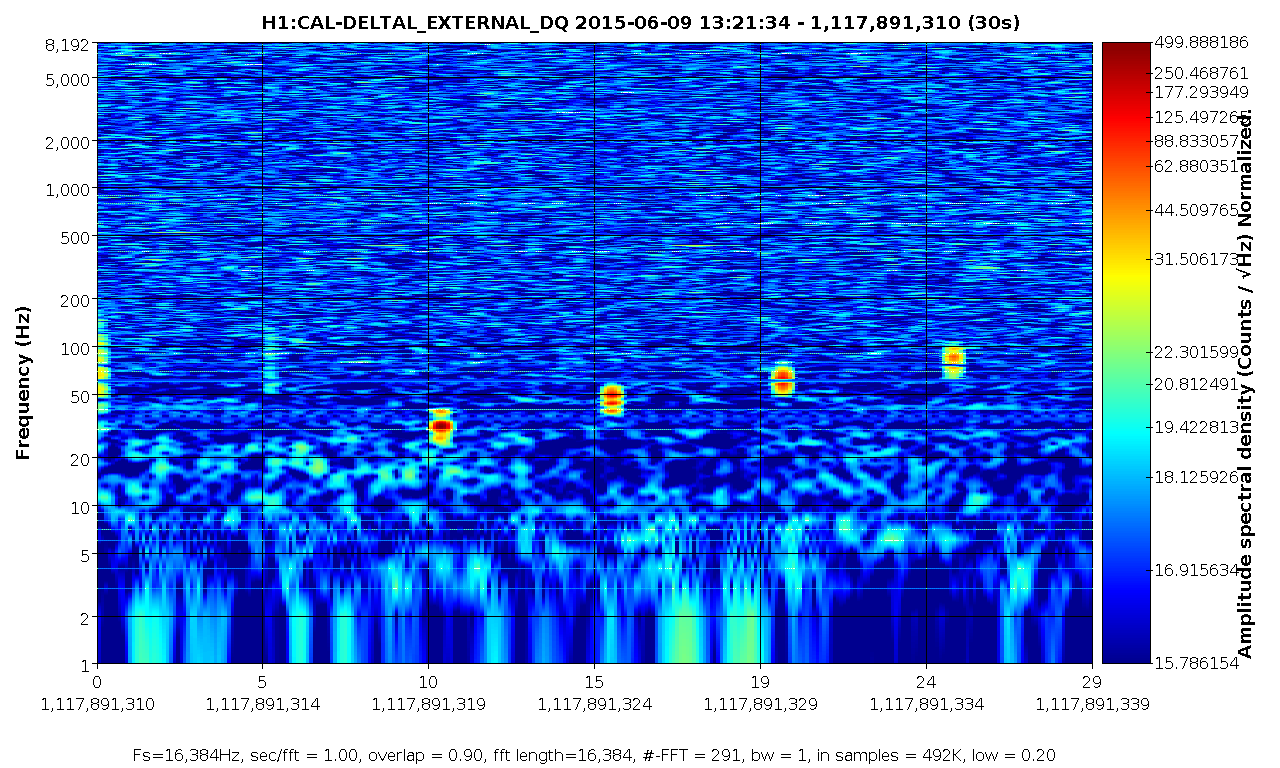
6:17 Intent bit switched to Commissioning. Another injection scheduled to start at 1117891250 GPS time. Same injection with gain increased.
6:24 Injection finished. Intent bit switched to Undisturbed.
8:00 Handling off the ifo to Jeff.