Jeff, Kiwamu,
This is a summary of the calibration of the ETMY suspension responses (in meters/counts) using the ALS diff VCO.
I have not evaluated systematic errors. The errors in this summary includes only statistical errors. The "models" I mean in this alog are the ones generated by the generate_QUAD_Model_Production matlab function in the suspension SVN. The model uses the "nominal" ESD force coefficient of 2e-10 [N/V^2]. The below is a summary of the results.
- - -
ETMY ESD is weaker than the model by 0.4242 +/- 0.0030
ETMY L2 is stronger than the model by 1.0344 +/- 0.0074
ETMY L1 is stronger than the model by 1.0269 +/- 0.0083
ETMX ESD is stronger than the model by 1.187 +/- 0.012
- - -
As for the ESDs, in terms of the force coefficient, they can be translated as
ETMY ESD force coeff. = 8.484 e-11 +/- 6.0e-13 [N/V^2]
ETMX ESD force coeff. = 2.374e-10 +/- 2.3e-12 [N/V^2]
[ETMY suspension responses]
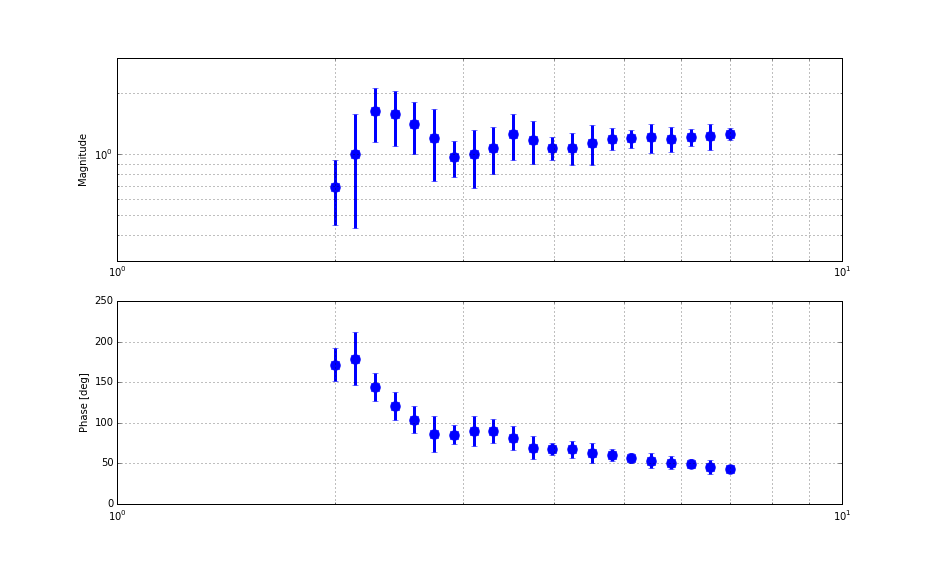
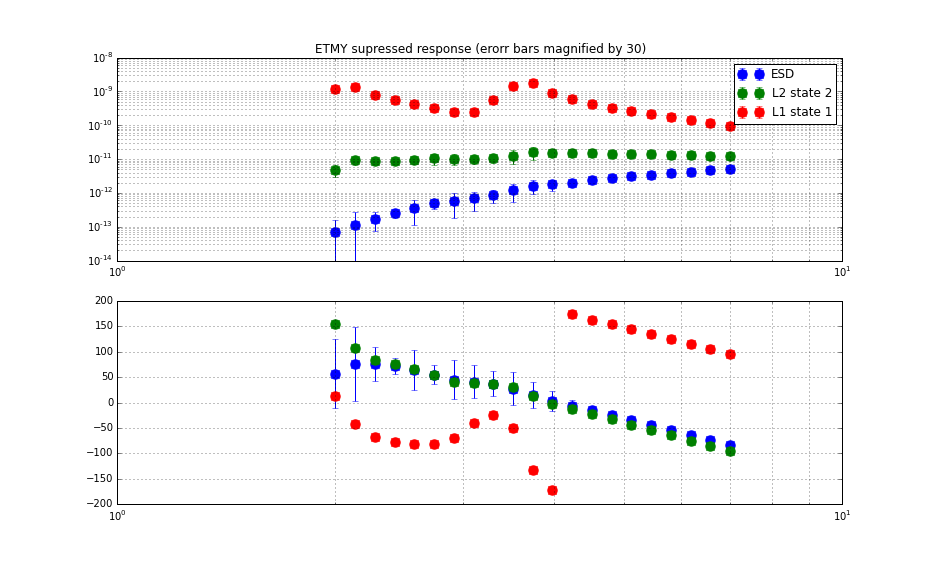
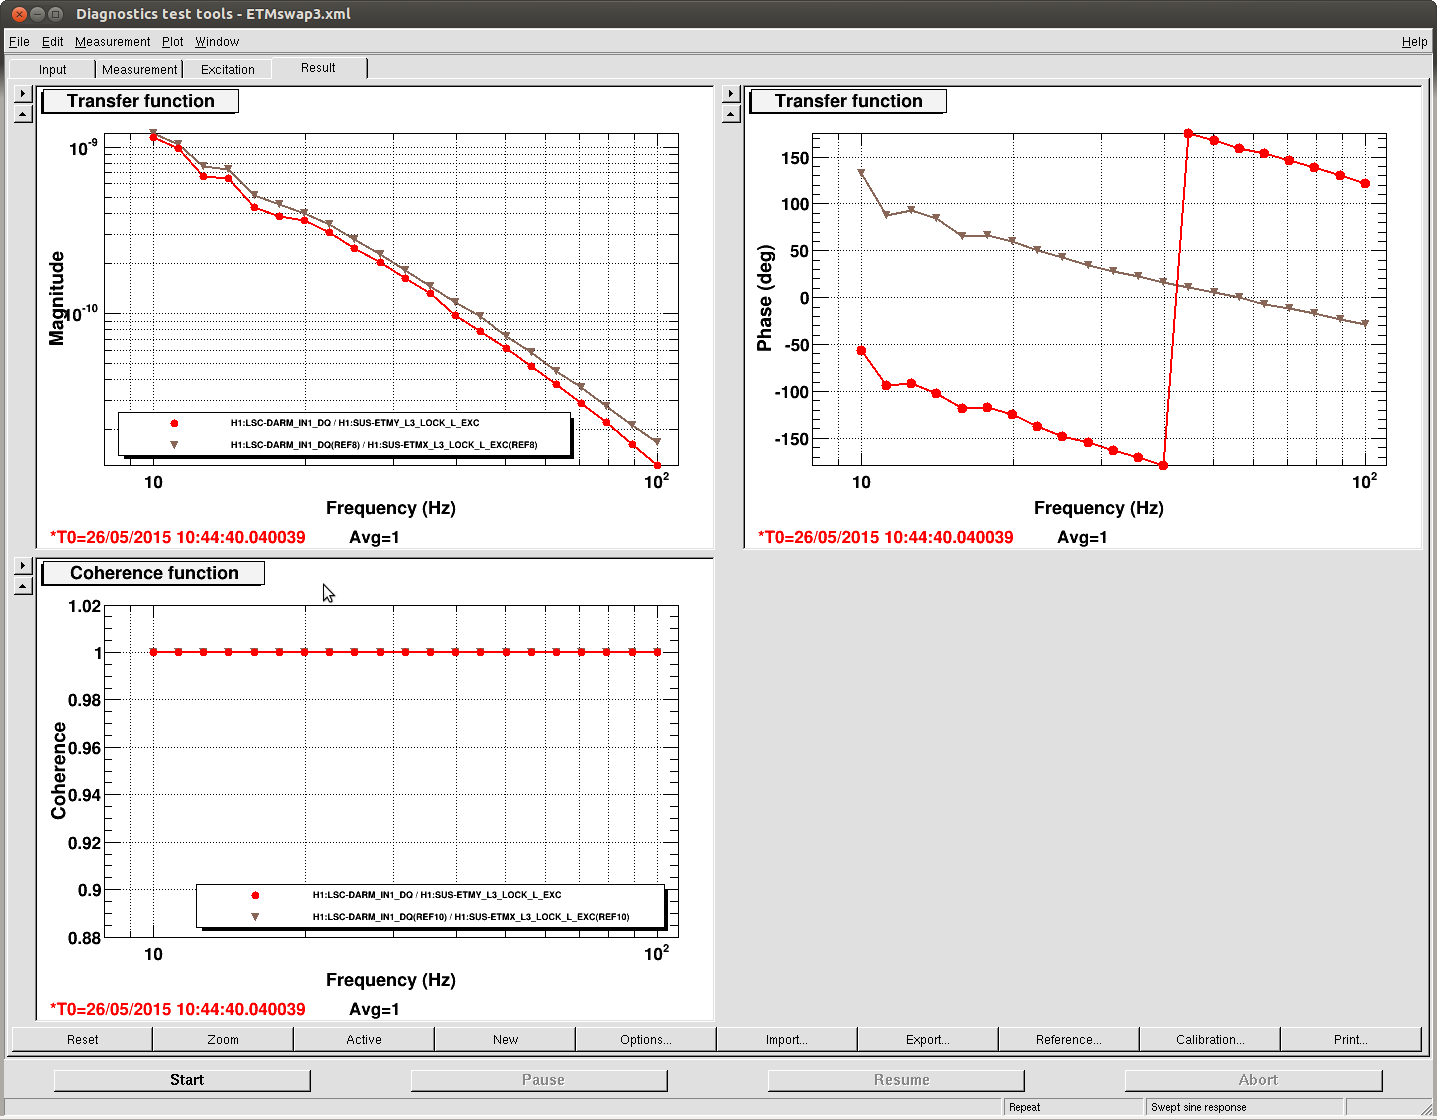
I start from the results. See the attached two plots shown right below:
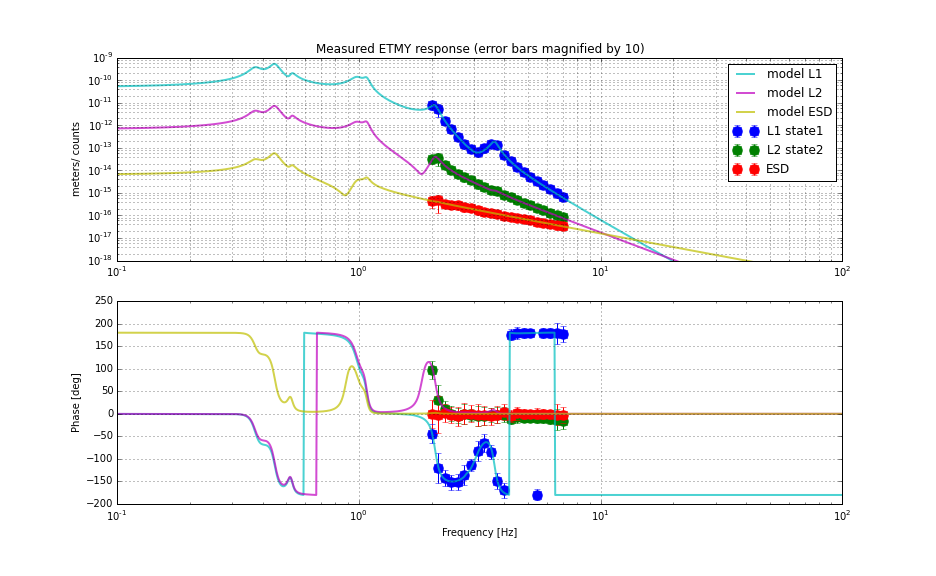
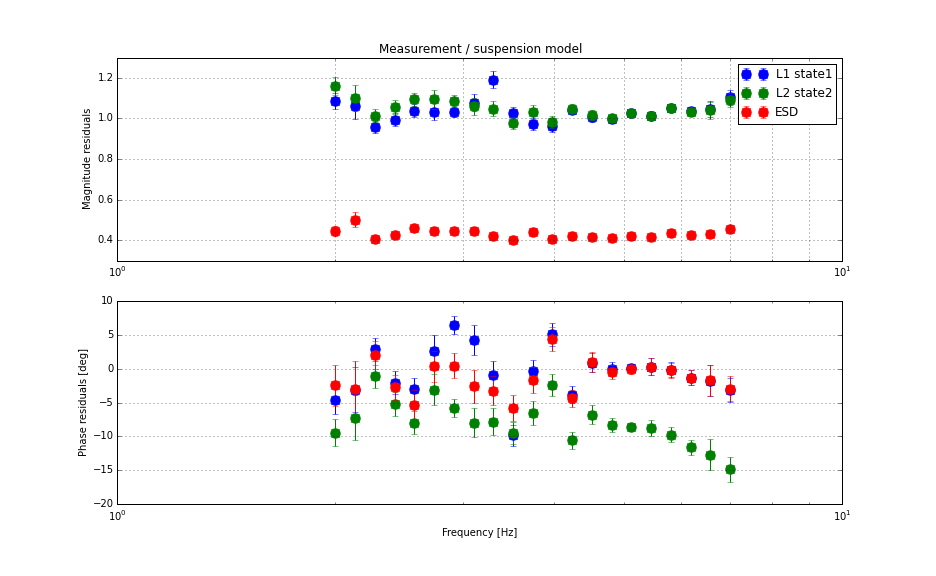
The first plot is a comparison of the measured response of all three stages with the models in units of [m/cnts]. Here "cnts" refers to the digital counts at the output of the ETMY_L1(2, 3)_LOCK_L filter bank. The second plot shows the ratio between the measured and modeled transfer functions. They are ratio of (measured) / (model). As you can see, the L1 and L2 stages agree with the model qualitatively. On the other hand, it is very clear that the ESD of ETMY is much weaker than what model predicts by a factor of 0.42. We don't know why this is so weak, but this is consistent with what the MICH free swing test says (see Jeff's alog for more details). Also, the L2 stage showed a phase lag of roughly 10 degrees. We don't know why at this point.
The steps for getting these results are something like the follows.
-
Calibrate ALS diff PLL loop in units of meters/Hz using a controllable frequency source (alog 18634 and some more details at the bottom of this entry)
-
Lock ALS diff and measure the ETMY L2 response
-
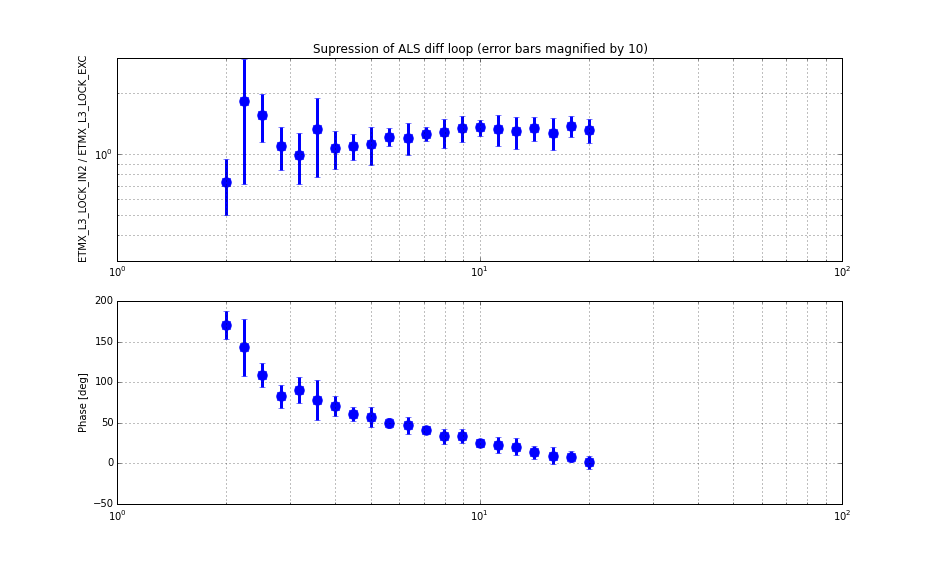
Take out the loop suppression from the measured L2 stage response by measuring the open loop of the ALS diff loop. This gives the absolute calibration of the L2 stage in m/cnts.
-
Fully lock the interferomter (at 3 W, DC readout on ETMX) and measure the response of all three stages to DARM_IN1.
-
Since we know the absolute response of L2, we can propagate it by having the ratio between L1 and L2, L3 and L2 stages that are measured in full lock.
-
done
If the ETMY ESD was stronger and as strong as that of ETMX, the steps in full lock are unncessary because we could measure it in the ALS diff configuration. However as we learned (see alog 18656), the low-voltage ETMY ESD needs a low-noise configuration. Note that the measured responses in full lock are also used in Jeff's analysis which had started from free-swing MICH fringes. Also, from the point of view of data points, we probably can go up to about 20 Hz at which the ALS diff signal is completely covered by some sensor noise. This time the frequency bins are chosen such that we can share them with the MICH calibration technique which was severely limited to frequency below 7 Hz due to high semsor noise in the simple MIchelson configuration.
As for the statistical error analysis, we used:
-
measurement error in each transfer function using the coherence
-
vco calibration error
-
if the errors are distributed as Gaussian, all the errors I quote here correspond to 1 sigma.
For comparing the measured responses with the models, we assume that the models and measurements have the same transfer function shapes and therefore the scaling factor is the only parameter we estimate. Though, this assumption may not be true because we see a large differenence in the phase of the L2 stage.
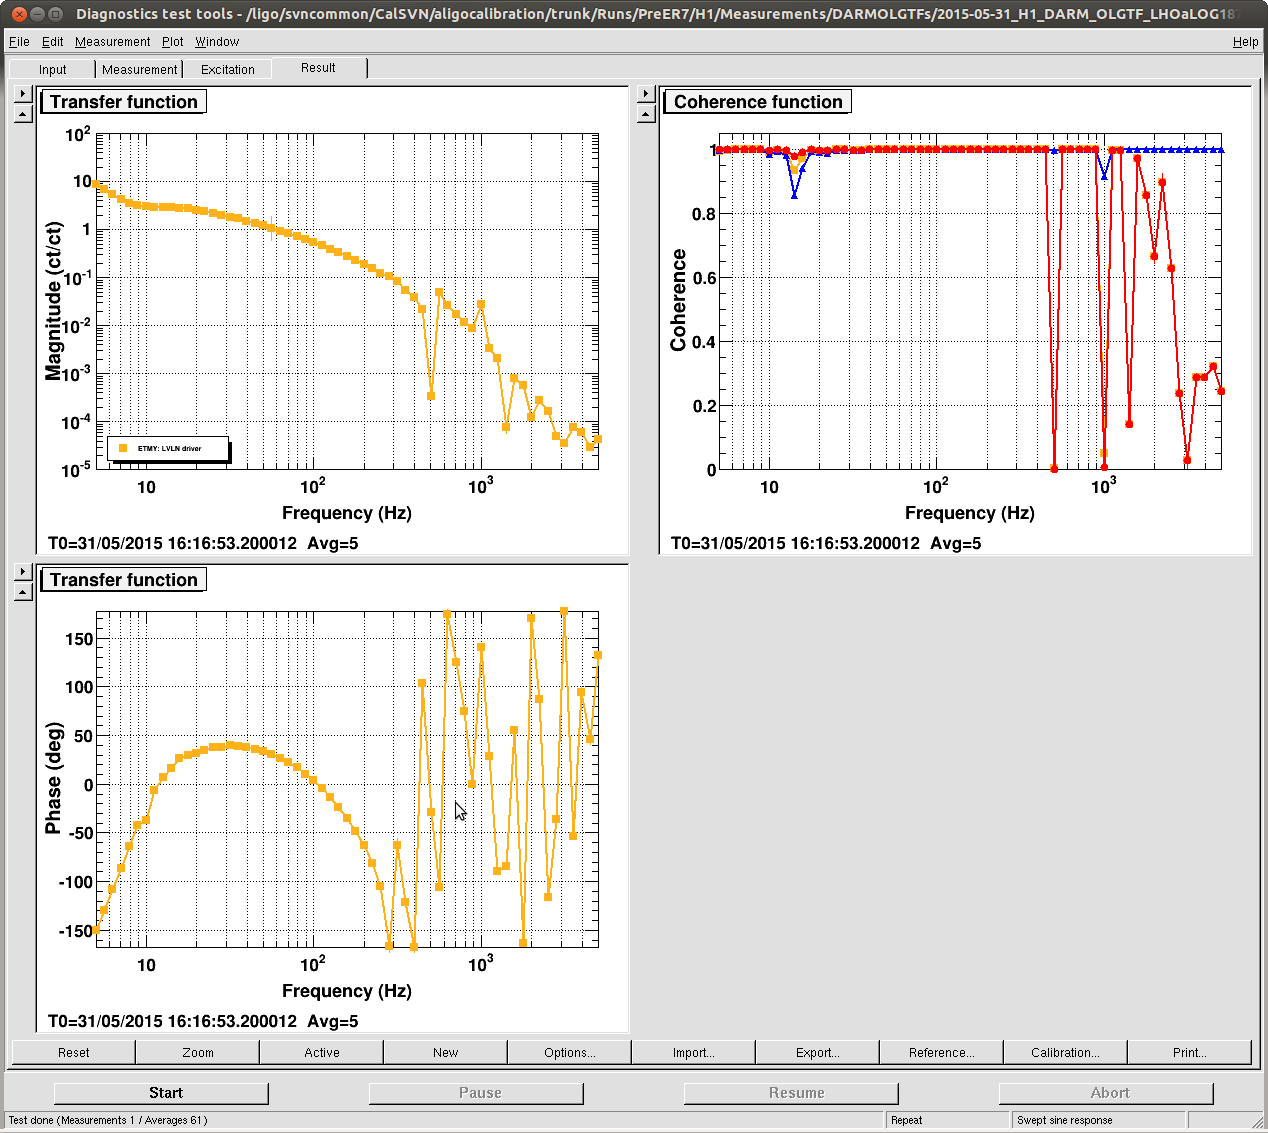
For completeness, I attach all the relavant measured responses:
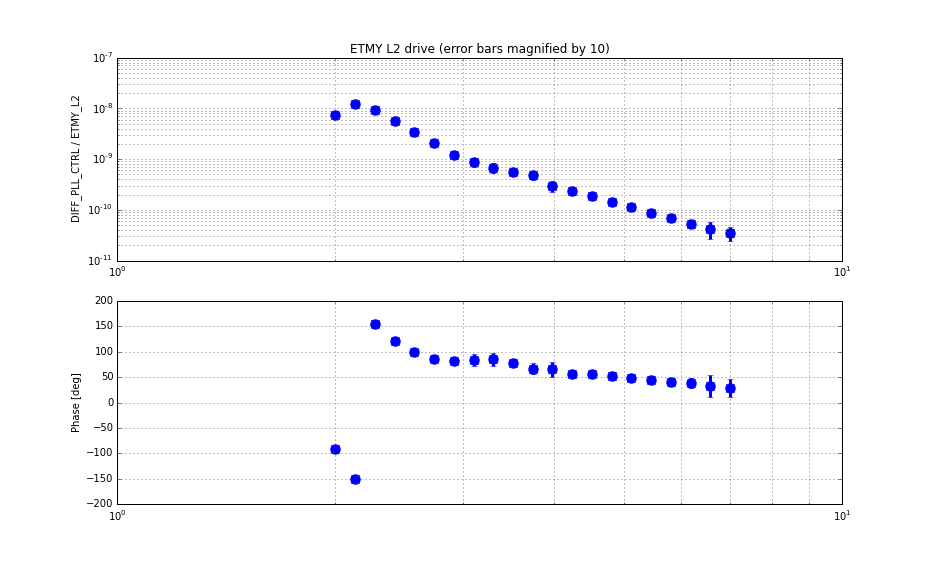
-
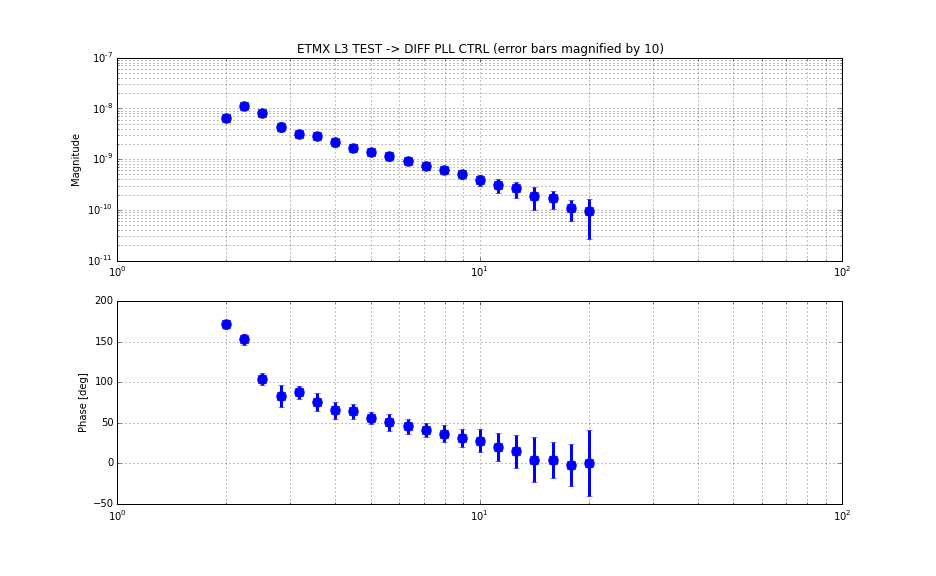
ETMY_L2 drive supressed by ALS diff, or ETMY_L2_LOCK_L_EXC -> DIFF_PLL_CTRL_OUT (3rd attachment)
-
ETMY supression or ETMY_L3_LOCK_EXC -> ETMX_L3_LOCK_IN2 (4th attachment)
-
ETMY supressed responses of all three stages or ETMY_LOCK_L(1,2,3)EXC -> DARM_IN1 (5th attachment)
The ETMY suspension states (for all the measurements):
-
L1 was in state 1 (LP1, LP2, LP3 all off)
-
L2 was in state 2 (Acq on, LP off)
-
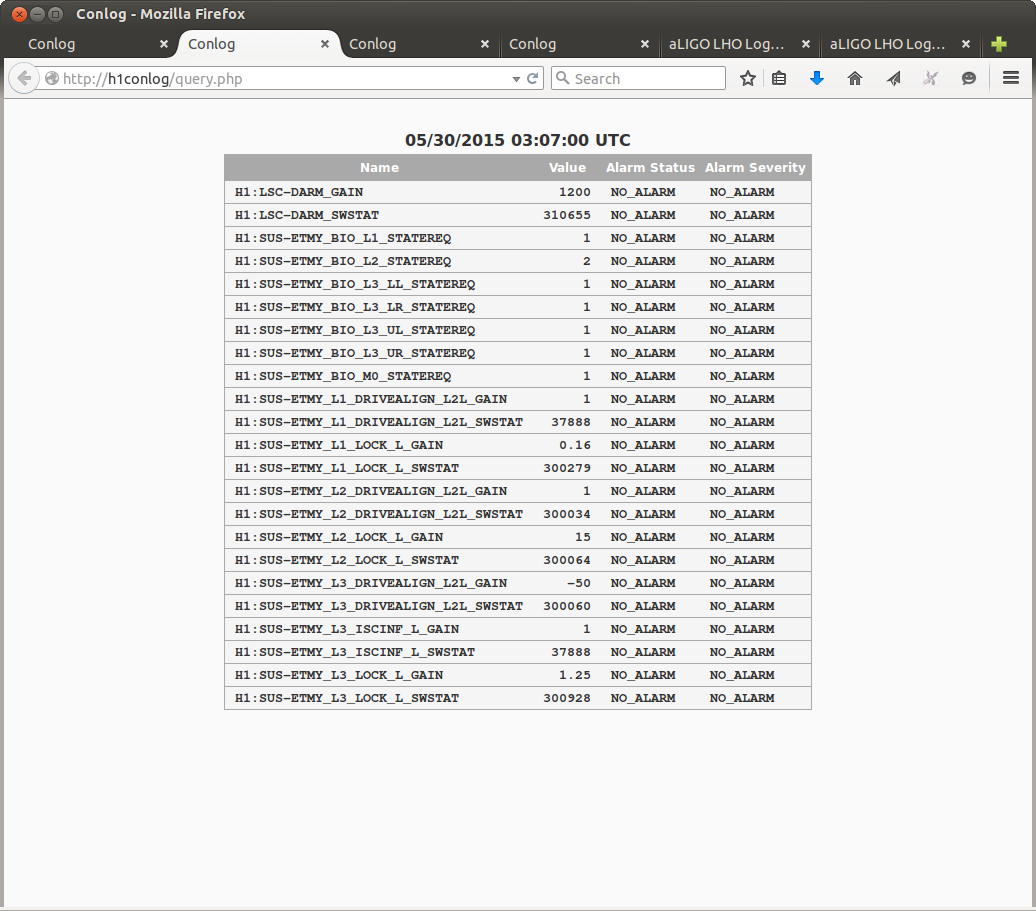
L3 or ESD was in state 2 (LP on) and in low-voltage for all four segments. The bias voltage was +9.5 V at the DAC output or 124518.4 counts before the DACs.
-
No ESD linearization
[ETMX ESD response]
At a different time, we measured the response of the ETMX ESD using a similar technique to the ETMY measurement. The steps went as follows.
-
Calibrate the ALS diff VCO (alog 18634 and more details in the next section)
-
Lock ALS diff and measure the ETMX ESD response
-
Take out the loop supression by measuring the open loop.
-
done
Since the ETMX ESD does not use a low-voltage driver, the measurement can be complete only with the ALS diff loop closed. This is a big difference from the ETMY measurement which required low-noise stage for accessing the ETMY ESD.
The two plots shown below are the main results.
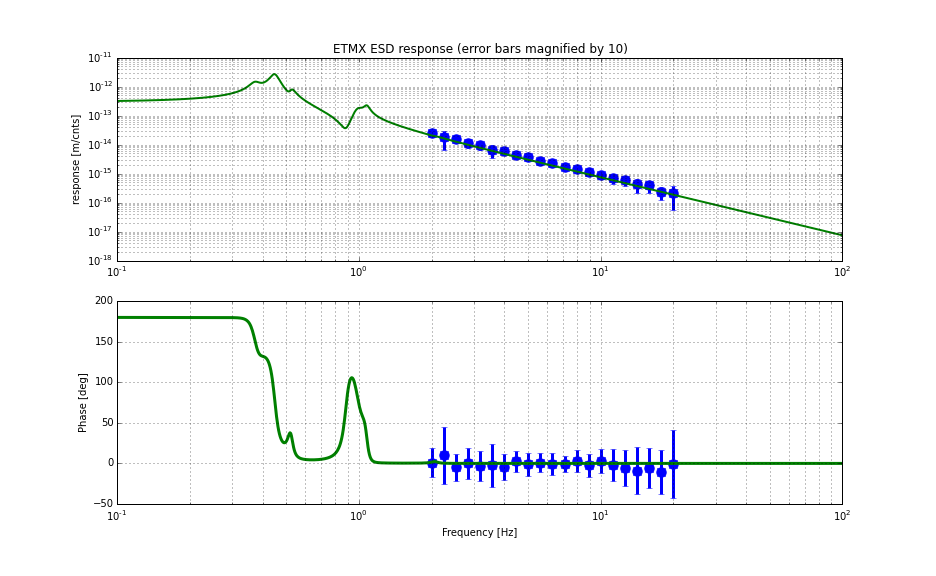
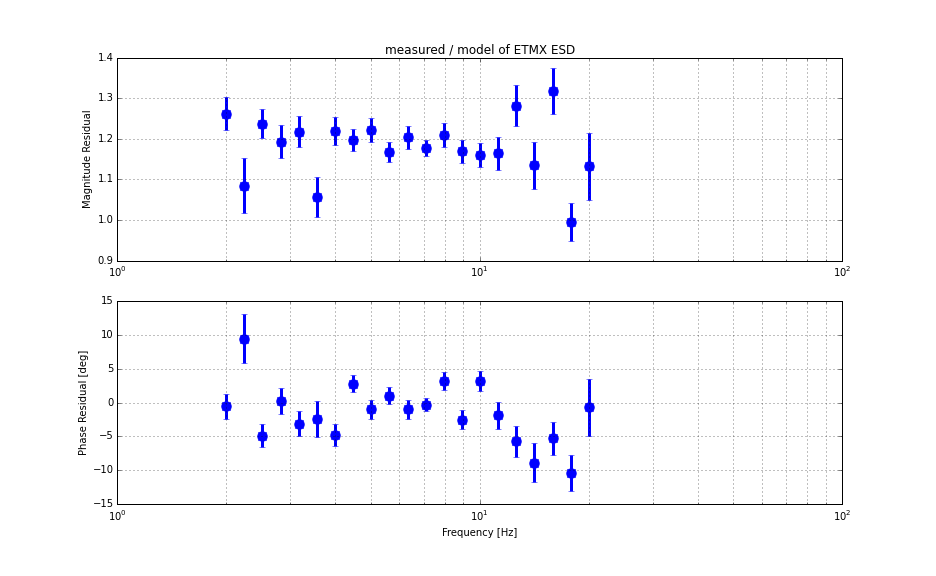
As shown in the first plot, overall, the measuement qualitatively agree with the model. The second plot shows the ratio of (measured) / (modeled). The absolute magnitude was larger than what the model predicted by a factor of 1.19. As mentioned earlier, the model uses a force coefficient of 2e-10 [N/V^2]. Unlike the ETMY ESD, the phase deviation (or perhaps I should say phase lag) is a bit larger than that of the ETMY for some unknown reason. The error propragation was done in the same fashion as that of the ETMY measurement (i.e. we included only coherence-based errors and VCO calibration error).
ETMX ESD configuration:
-
The bias was at +9.5 V at the DAC output or 124518.4 counts before the DAC.
-
Linearization was on with a linearization coefficient of -124518.4 which we have used since some time in this Feburary (for example alog 16798).
For completeness I post all the relevant transfer functions:
[ALS diff VCO calibration]
On this past Tuesday, Dick and I measured the VCO response. We hooked up an IFR 2023 A which was synchronized to a 10 MHz rf signal (which is synchronized to GPS) to the diff PLL input or the PFD rf input with an amplitude of 0 dBm in order to simulate the beat note signal. Even though we could read out the display of the IFO 2023A, we used an external frequency counter (H1:ALS-C_DIFF_VCO_FREQUENCY) which should be at least as accurate as 5 Hz (see for example alog 6972). We locked the PLL loop and manually swept the frequency of the IFR until the PLL unlocks. The speed of the sweep was roughtly 25 kHz/minutes. Then we recorded the output of the DIFF_PLL_CTRL filter bank. One thing we have to pay attention is that this filter already contaied calibration filters which were meant to calibrate the VCO into microns, but as we measured the calibration factor was wrong by roughly a factor of 3.
The setting for DIFF_PLL_CTRL
-
FM3, 4, 5 and 6 were engaged
-
digital gain = 1
In theory FM3 should cancel the pole and zero at 1.4 and 40 Hz respectively in the VCO circuit. The meaured data is shown in the plot right below:
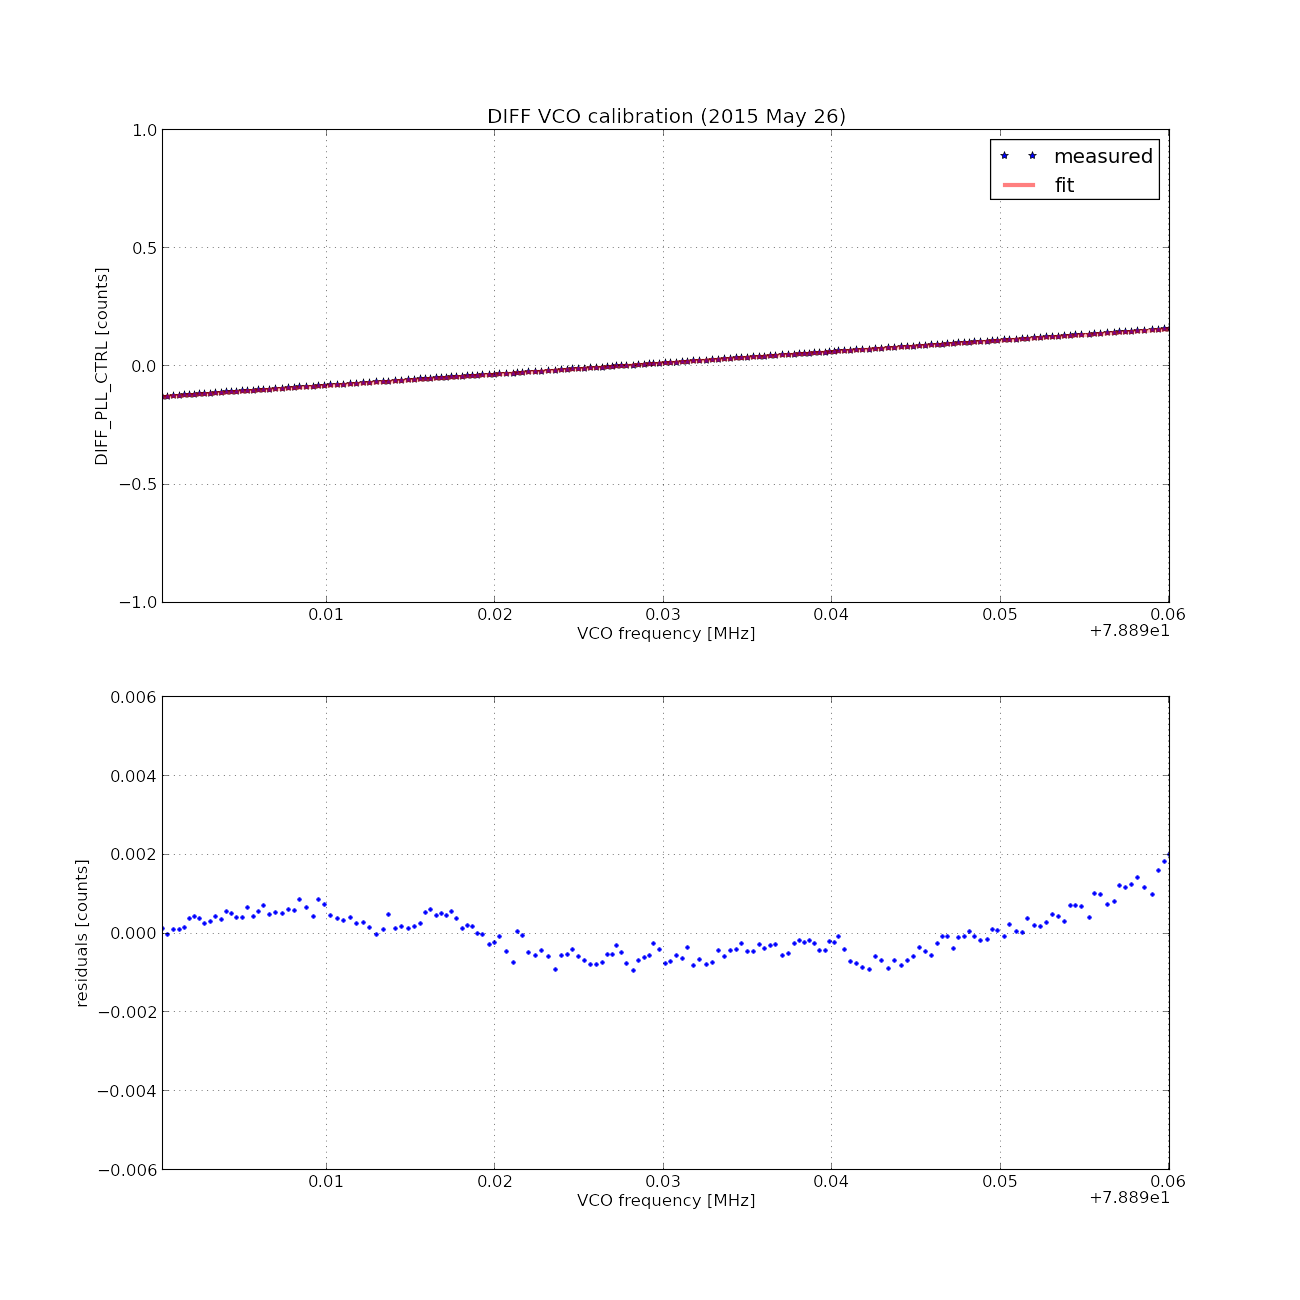
The data was then trancated such that the center frequency is located at 78.92 MHz with a range of +/- 30 kHz for a linear fitting purpose. Also, since we made a linear fitting at around 78.92 MHz, in any of the calibration measurement we tried to be as close as possible to this frequency by engaging the slow frequency couter servo to the ALS diff VCO, According to the fit the coefficient was of VCO -> PLL_CTRL was esimtimated to be 4.78268e-6 +-/ 0.002531e-6 [cnts/ Hz] using a least square fitting of gnuplot. These numbers were used for calibrating the ETM responses and estimating the errors.
Finally I attach a zip file which contains all the data (in ASCII not in xml), analysis codes and figures.


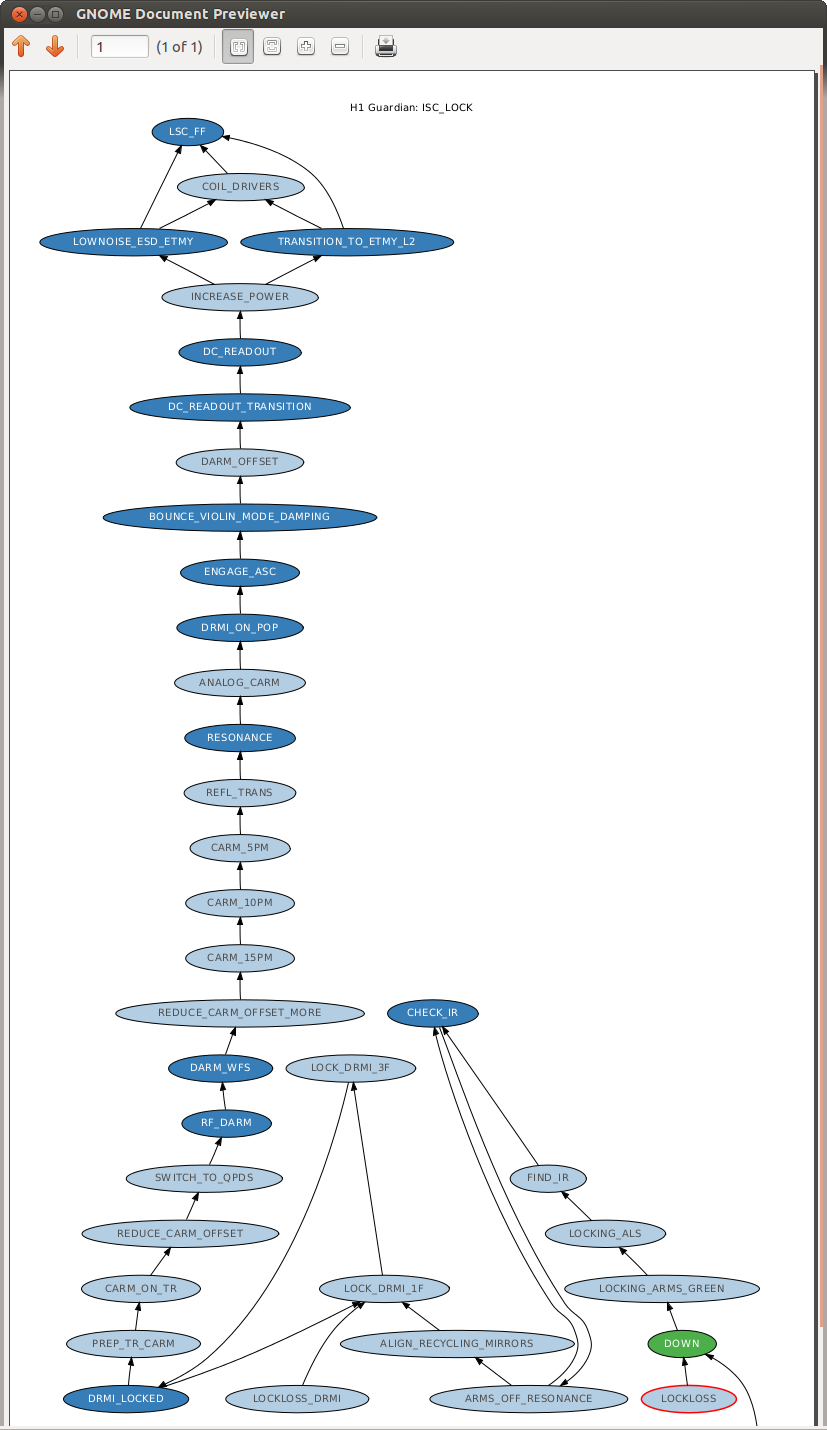


The fastest lock-acquisition sequence in the West!