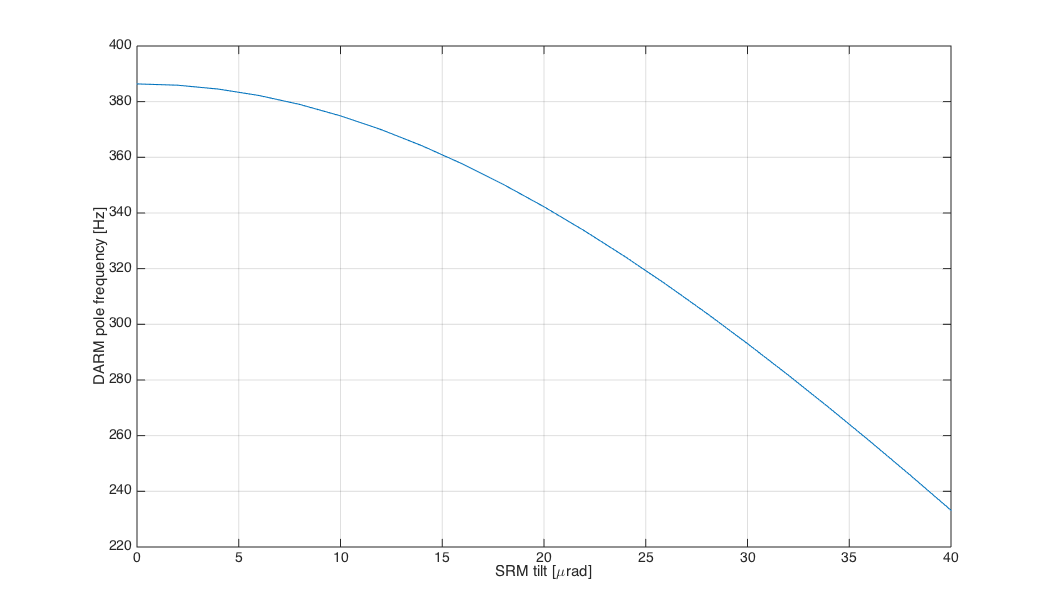
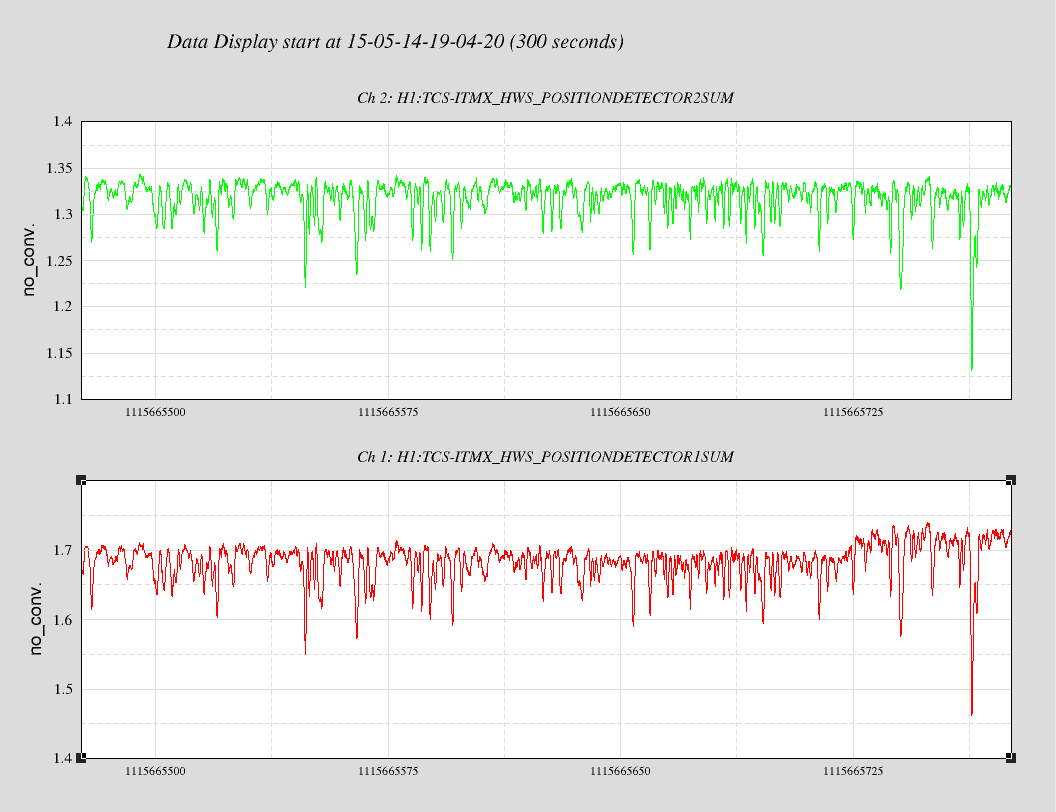
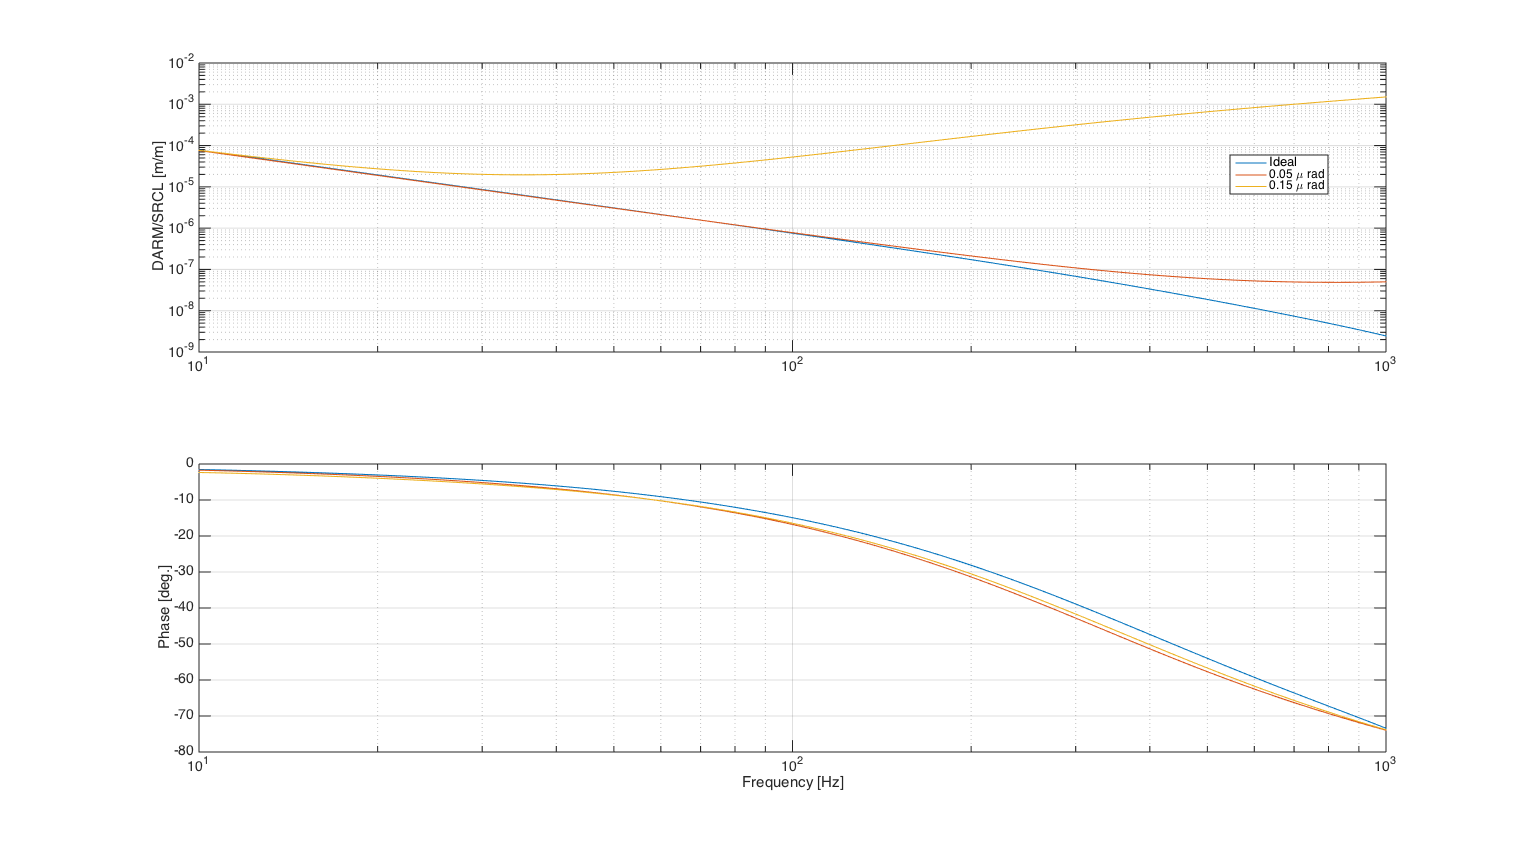
We had set up a DARM cavity pole tracker last night (alog 18401). The plot below shows a first result from the cavity pole tracker which showed very interesting results.
![]()
Punchlines
- The DARM cavity pole became stable after Evan and Stefan put the offset in ASC-SRC1_YAW.
- Before the offset was introduced, it showed slow dfift which decreased the pole frequency from 350 to 290-ish Hz on a time scale of 20 minutes.
[Tracker setup]
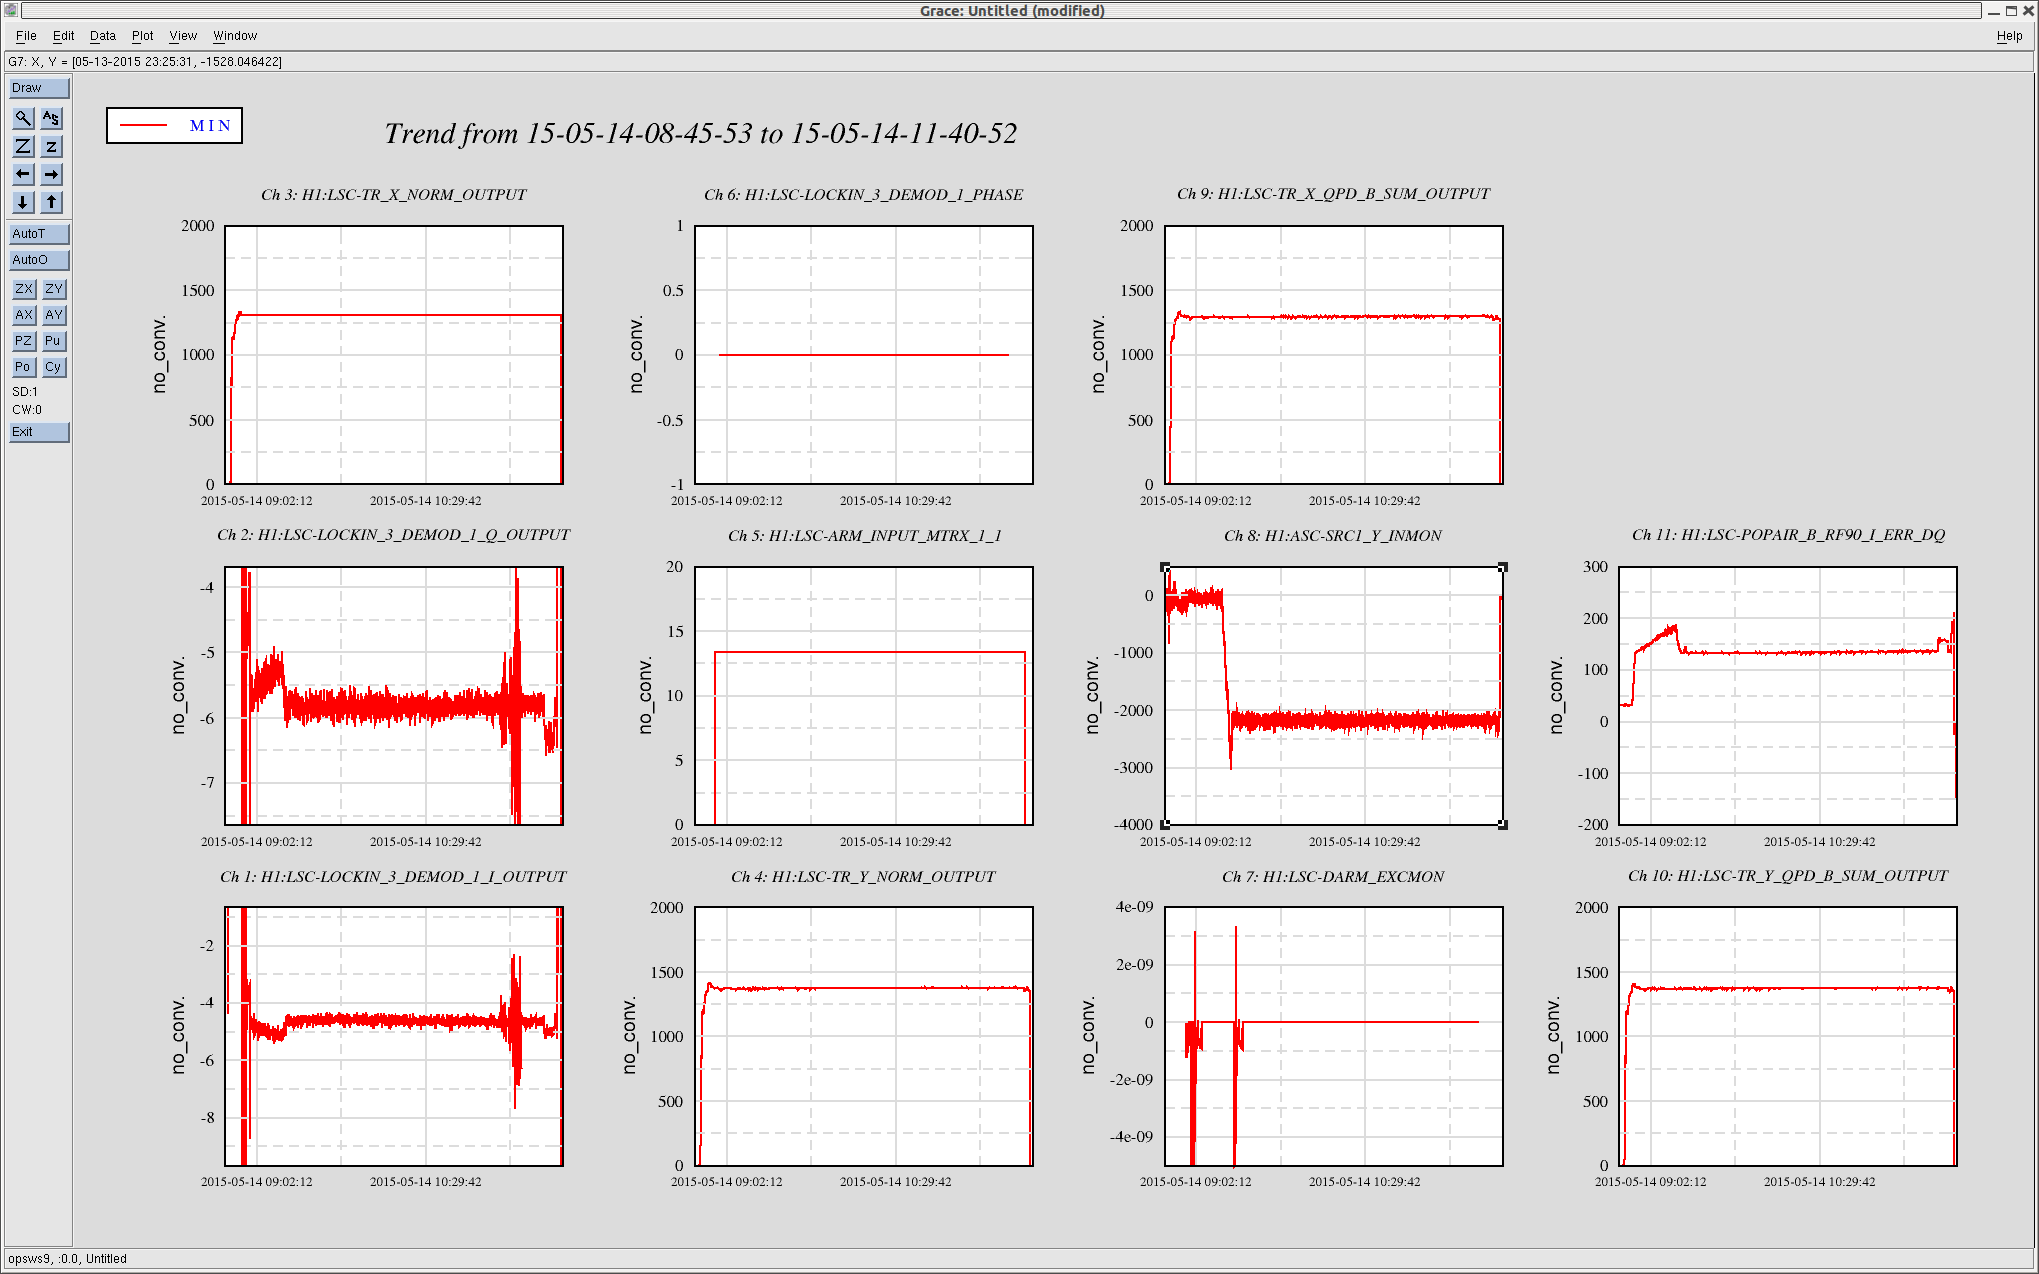
We set up a lockin oscillator in the LSC front end model at 322.1 Hz (alog 18401). The excitation amplitude was set to 2 counts at the LSC DARM output. Through the LSC output matrix it excites ETMX and ETMY with outmatrix elements of +1 and -1 respectively. Since we use one ETM at a time for controlling DARM, this setup excites just one ETM by 2 counts. The audio demod phase was initially set to 0 deg so that we can double-check the phase rotation later on. The demodulation cos and sin gains are set to 1. In the I and Q demodulators, I put a 260 dB gain such that the outputs are human-readable. The low-passes are 0.1 Hz 4th order butterworth currently. The notch has been on all the time (alog 18401) so that the excitation is insensitive to the control loop.
[Calibration of the audio demodulation phase]
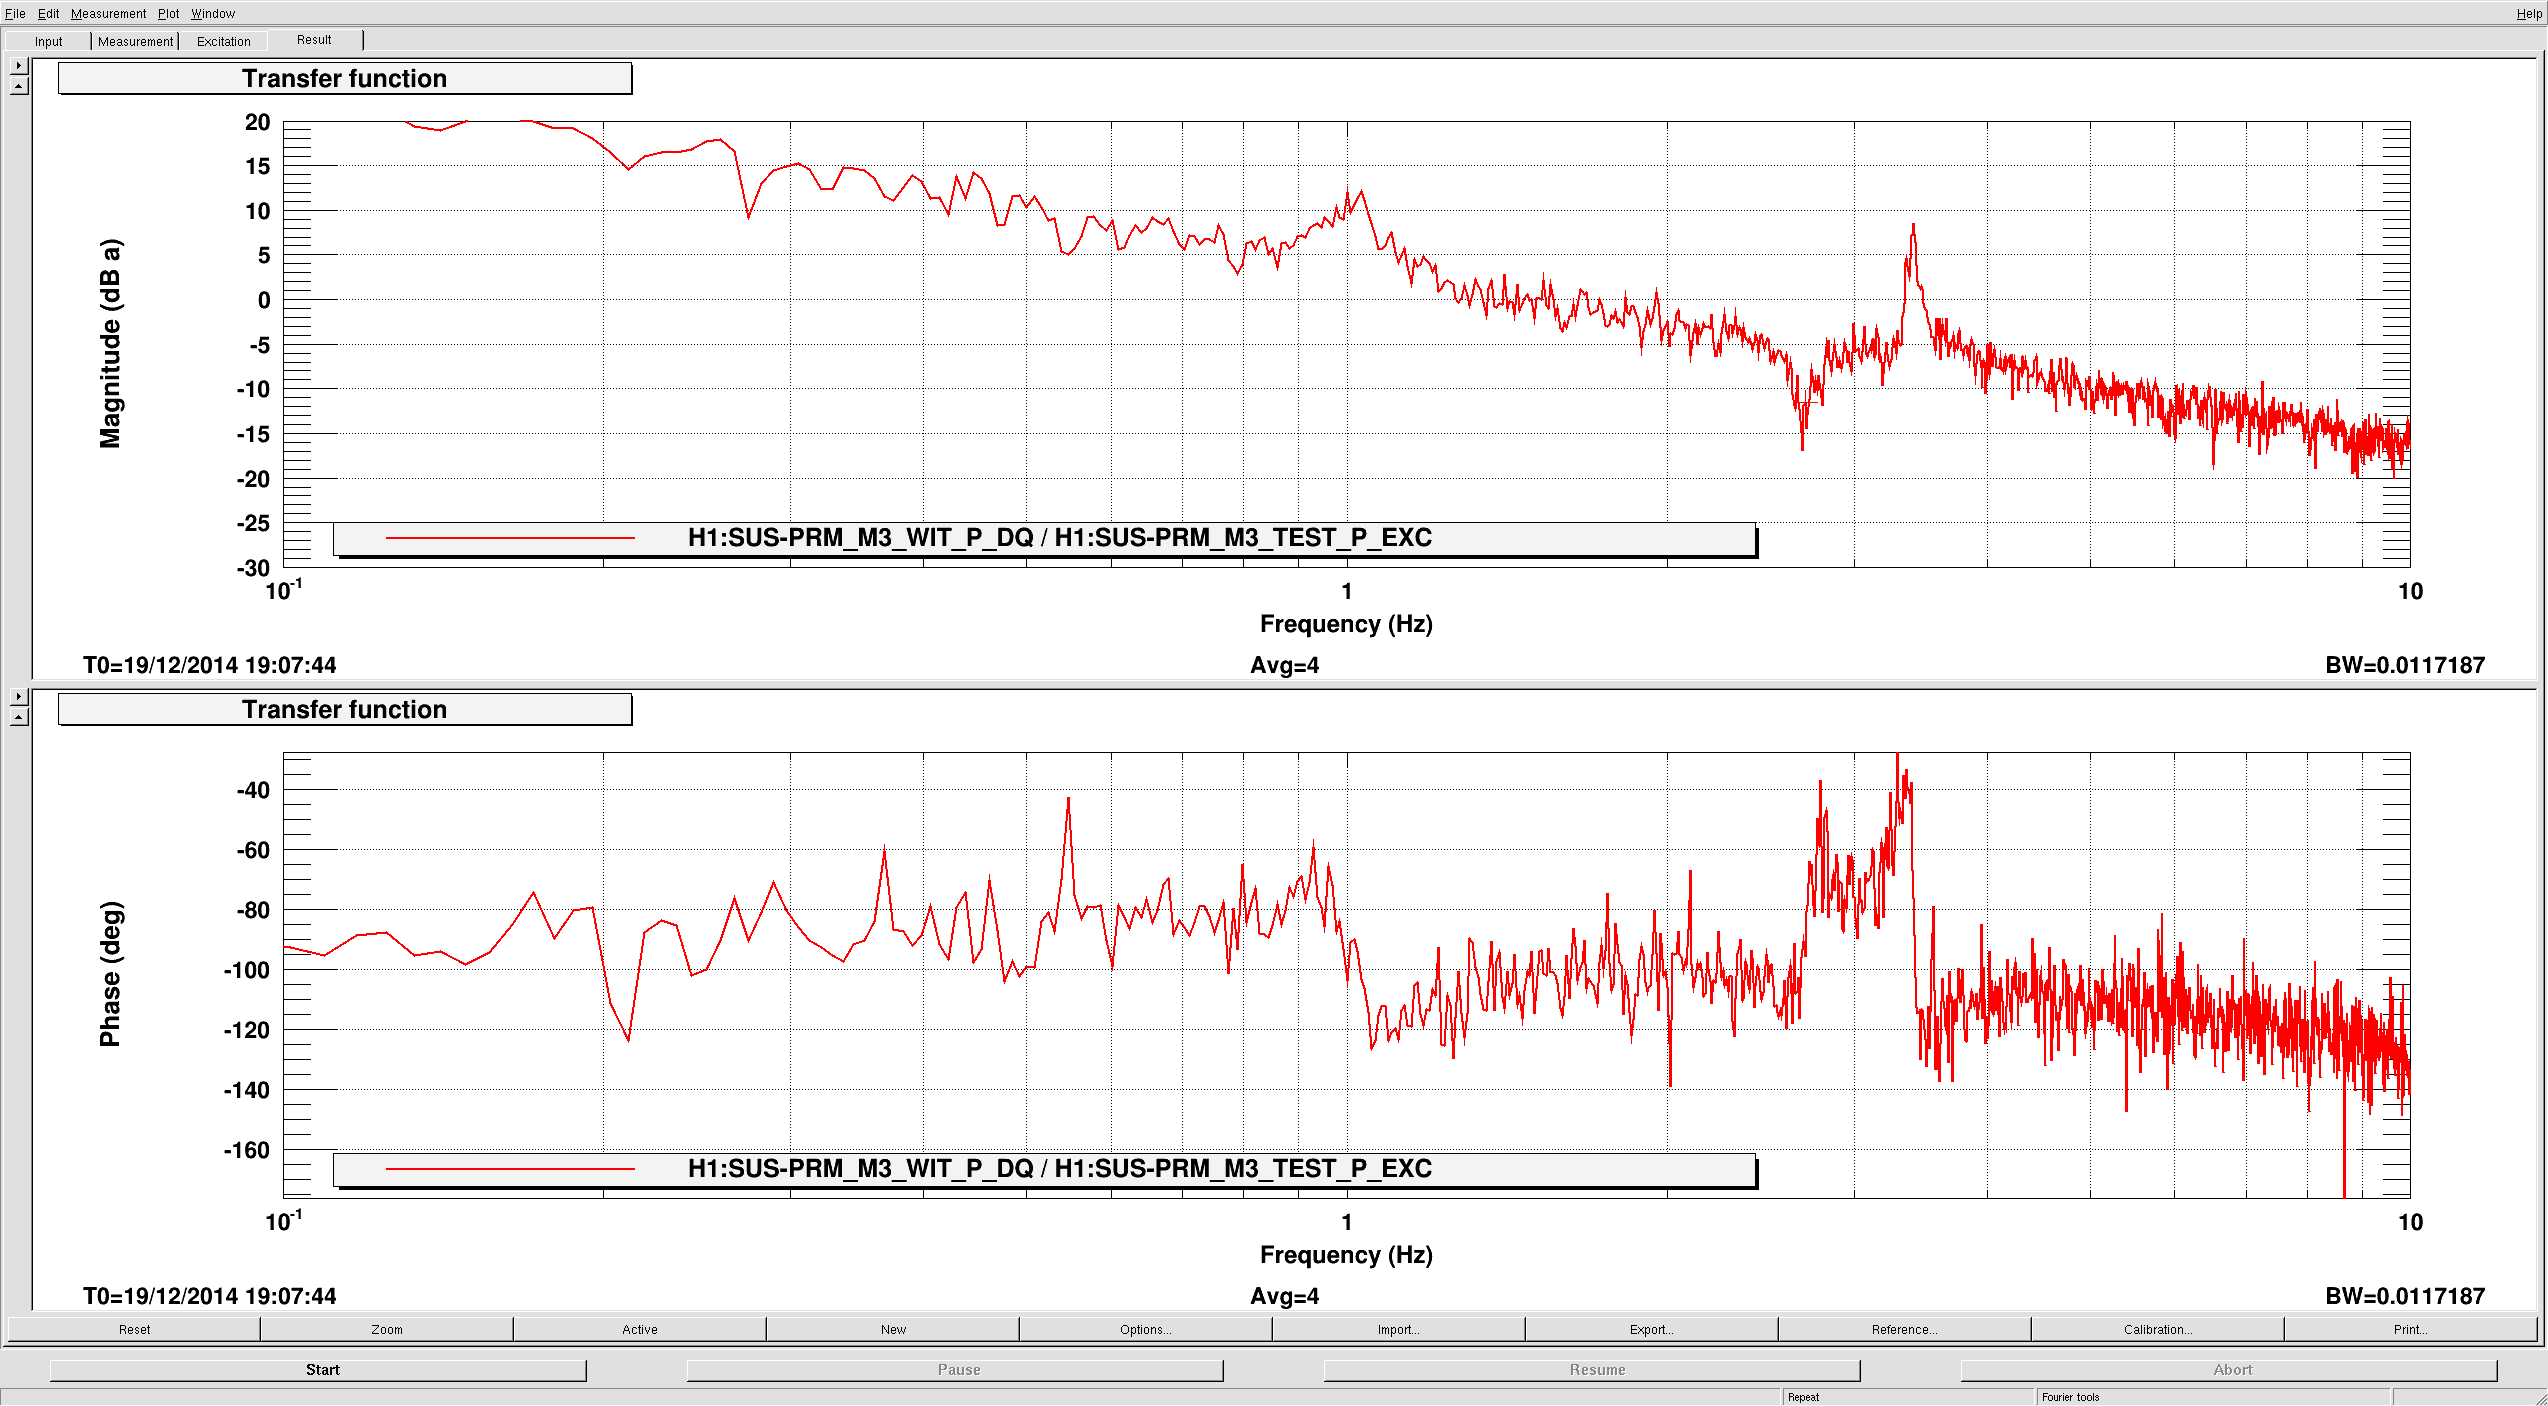
According to the DARM loop model, I was expecting a phase rotation of about +80 deg including the known time delay of 219 usec at the excitation frequency of 322.1 Hz. By the way, 219 usec is the total delay of the DARM open loop. However, for some reason, I measured the phase rotation to be -128.4 [deg]. The math I got this number is phi = atan(measured Q phase / measured I phase). So something is not right. Due to this unknown phase rotation error, I ended up calibrating the audio demod phase using the information that the cavity pole was at 355 Hz at a particular time (alog 18420).
In the post-process, I rotated the demod phase by multiplying a rotation matrix to the I and Q signals such that the demodulated signals has the effect only from the DARM optical plant, or in other words, I subtracted the phase rotation which is not from the DARM plant. I had to rotate them by -86.2 deg in order to get 355 Hz for the data points at around May-15-2015 9:21:34 UTC which is the time when Jeff estimated the cavity pole to be 355 Hz. The advantage of doing this rotation business is that is makes the math easier. In this condition, in-phase signal should be
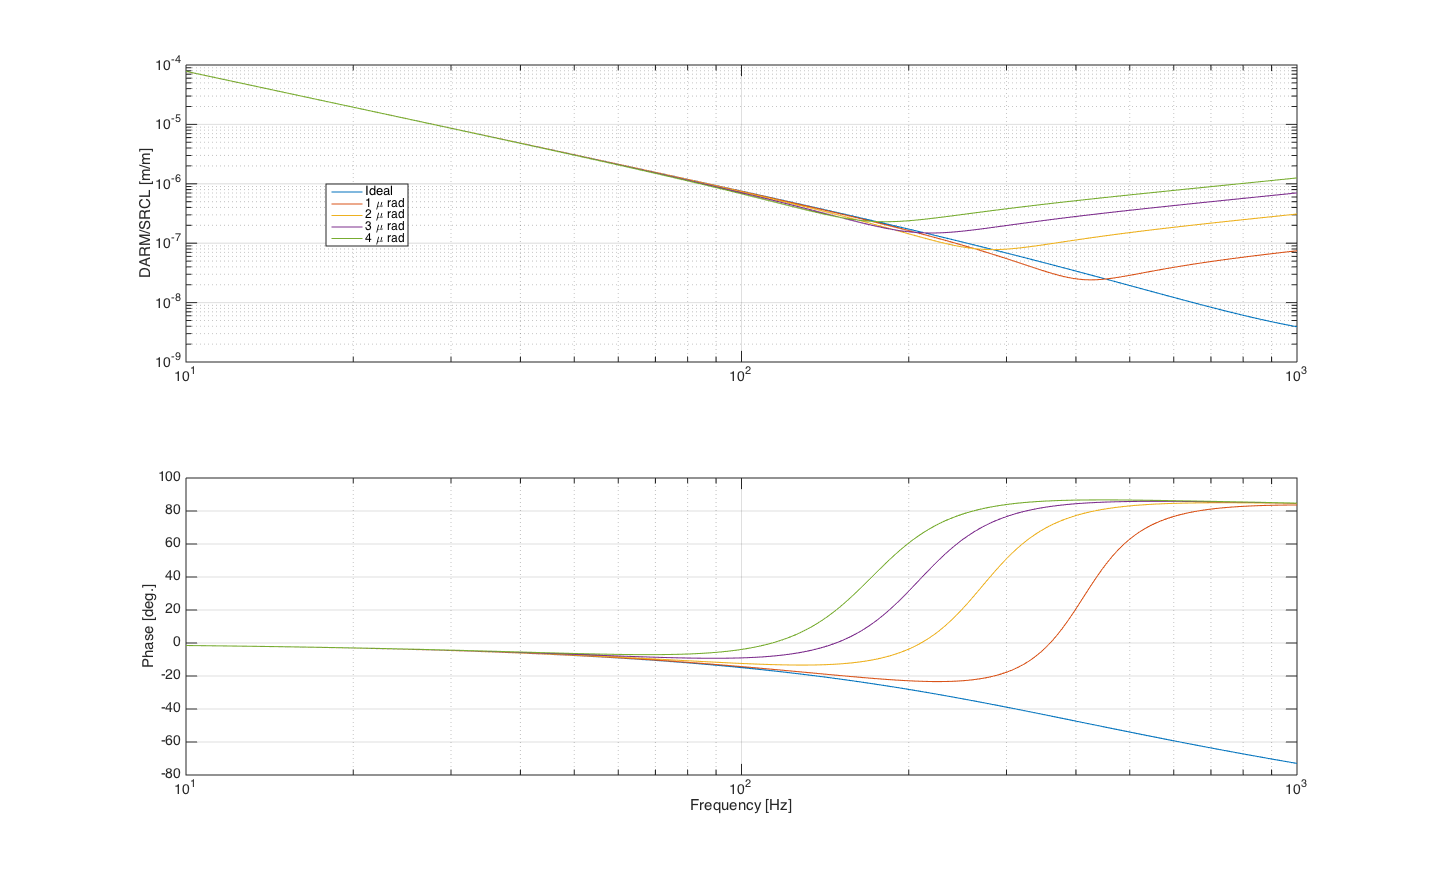
(in-phase) = G / (1 + (omega / omega_0)^2),
where G, omega and omega_0 are the optical gain, excitation frequency and cavity pole frequency, respectively. Similiarly, the Q phase is also easy;
(q-phase) = - (omega/omega_0) * G / (1 + (omega / omega_0)^2).
Taking the ratio of the two demodulated signal, one can obtain a clean quantity;
(in-phase / q-phase) = - omega_0 / omega.
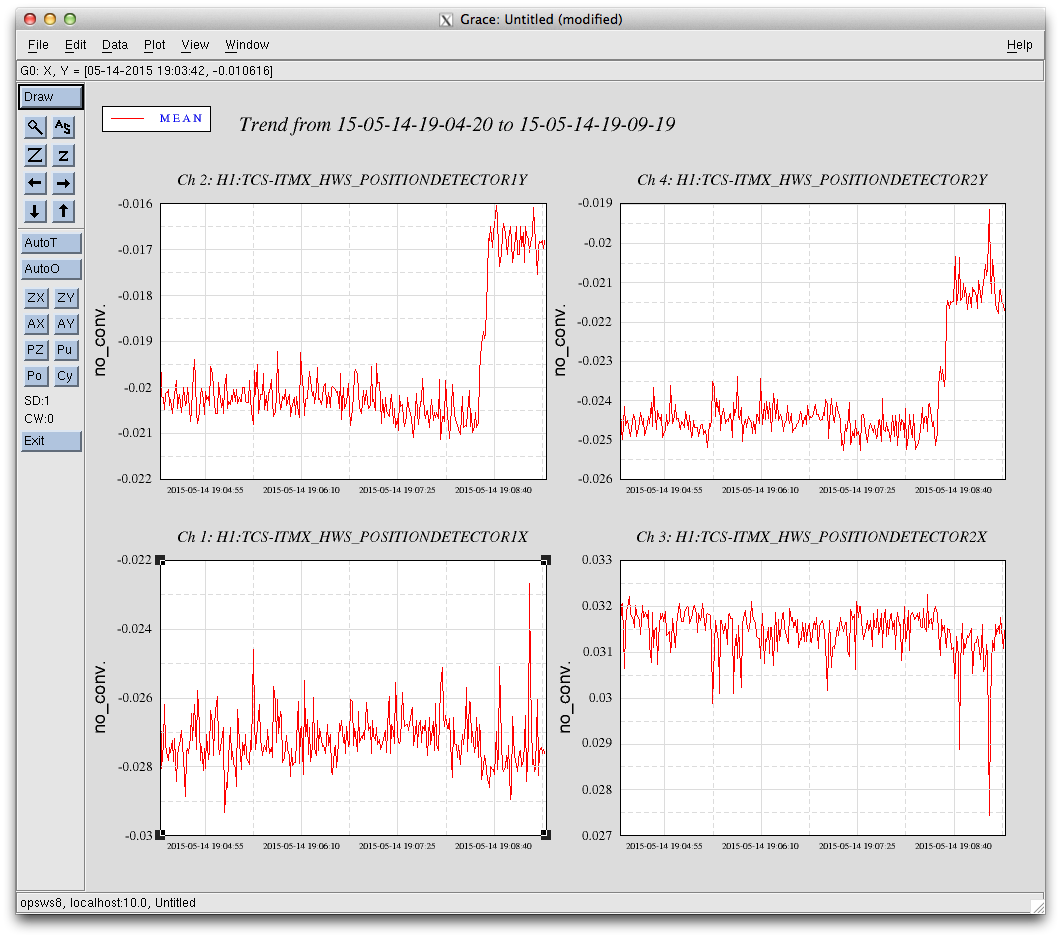
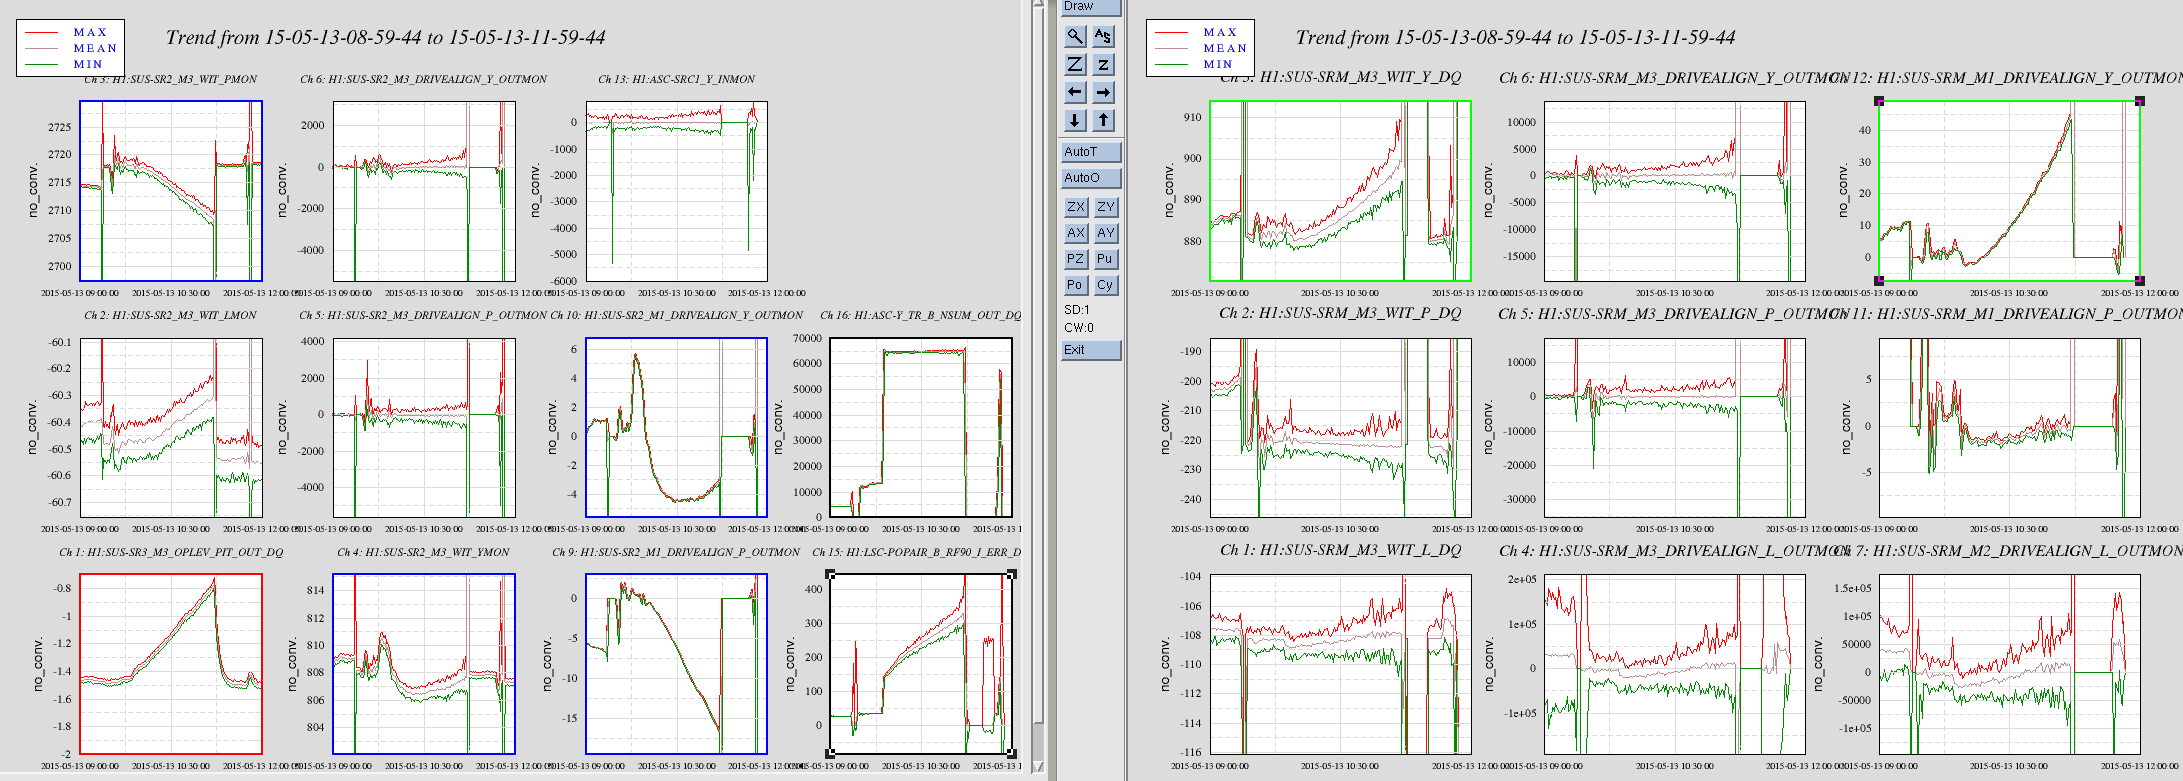
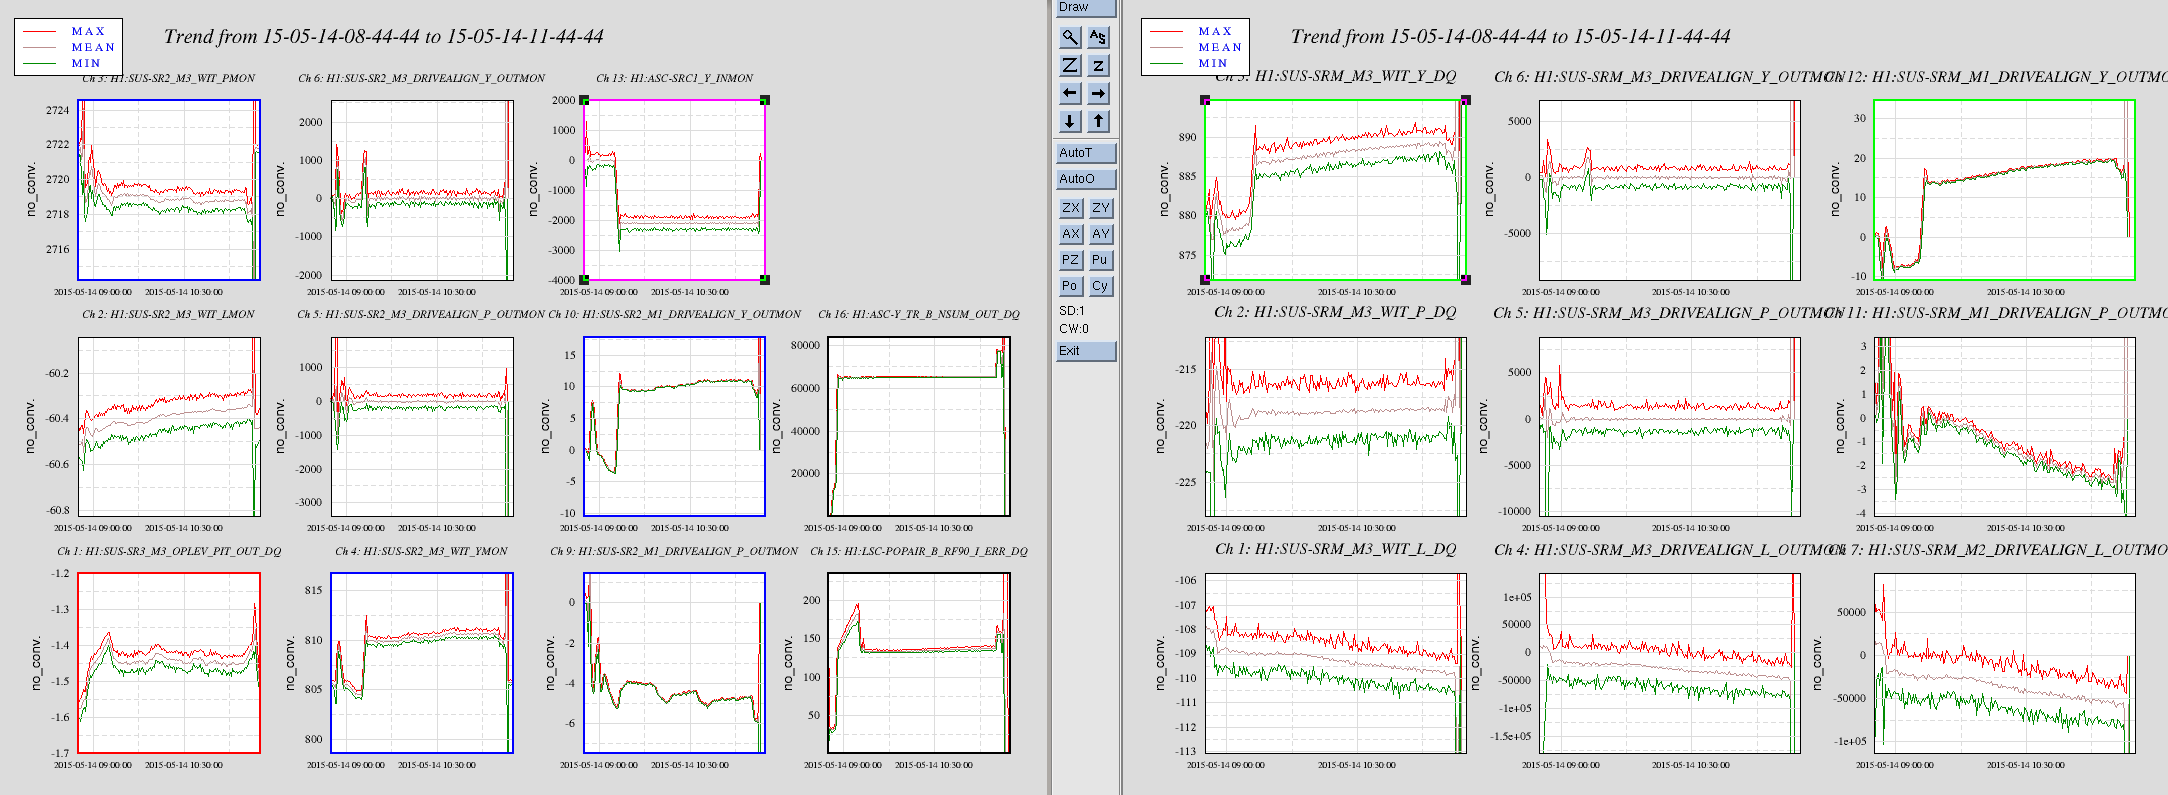
This essentially corresponds to doing some atan calculation to derive the phase angle. From this quantity, I computed the DARM cavity pole rfequency as a functin of time as shown in the above plot. I attach a second trend of some relevant channels in the same period.
Also, I changed the audio demod phase in the realtime system to -86.2 deg such that I don't have to do the same post data-massage.