jeffrey.kissel@LIGO.ORG - posted 11:38, Tuesday 05 May 2015 - last comment - 13:13, Tuesday 05 May 2015(18240)
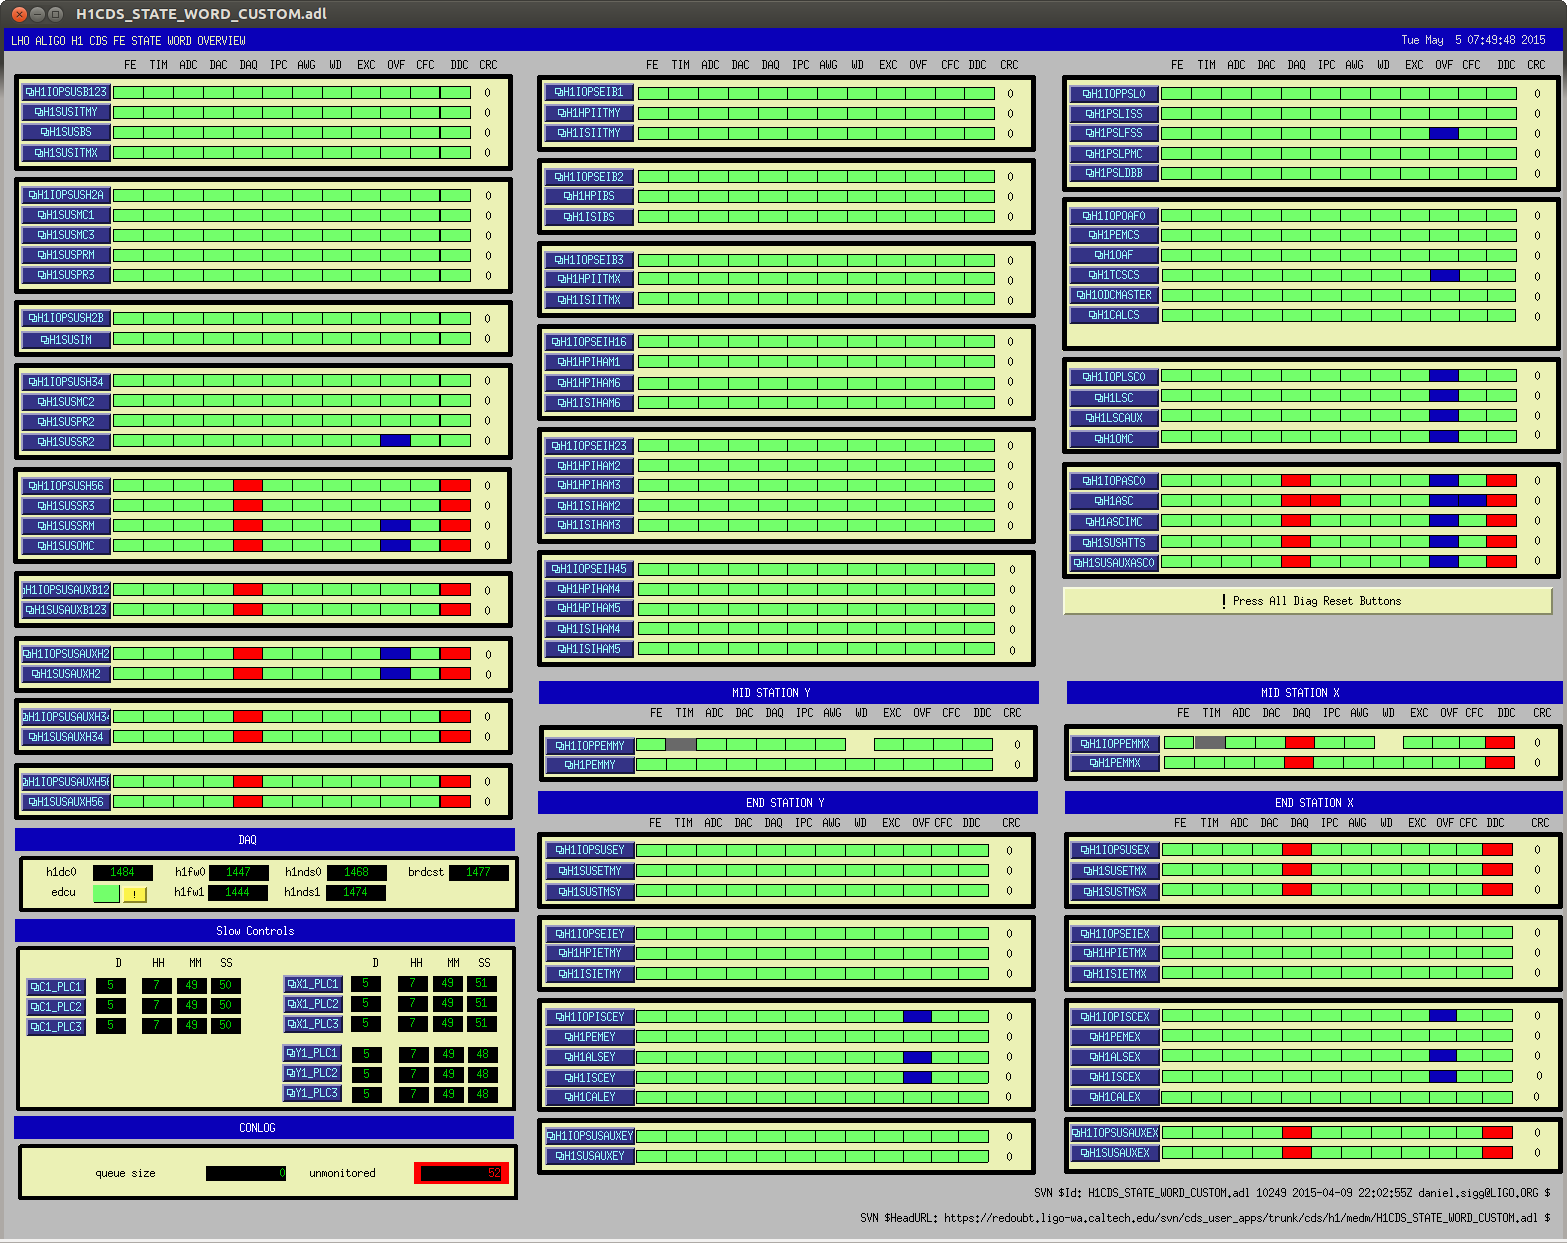
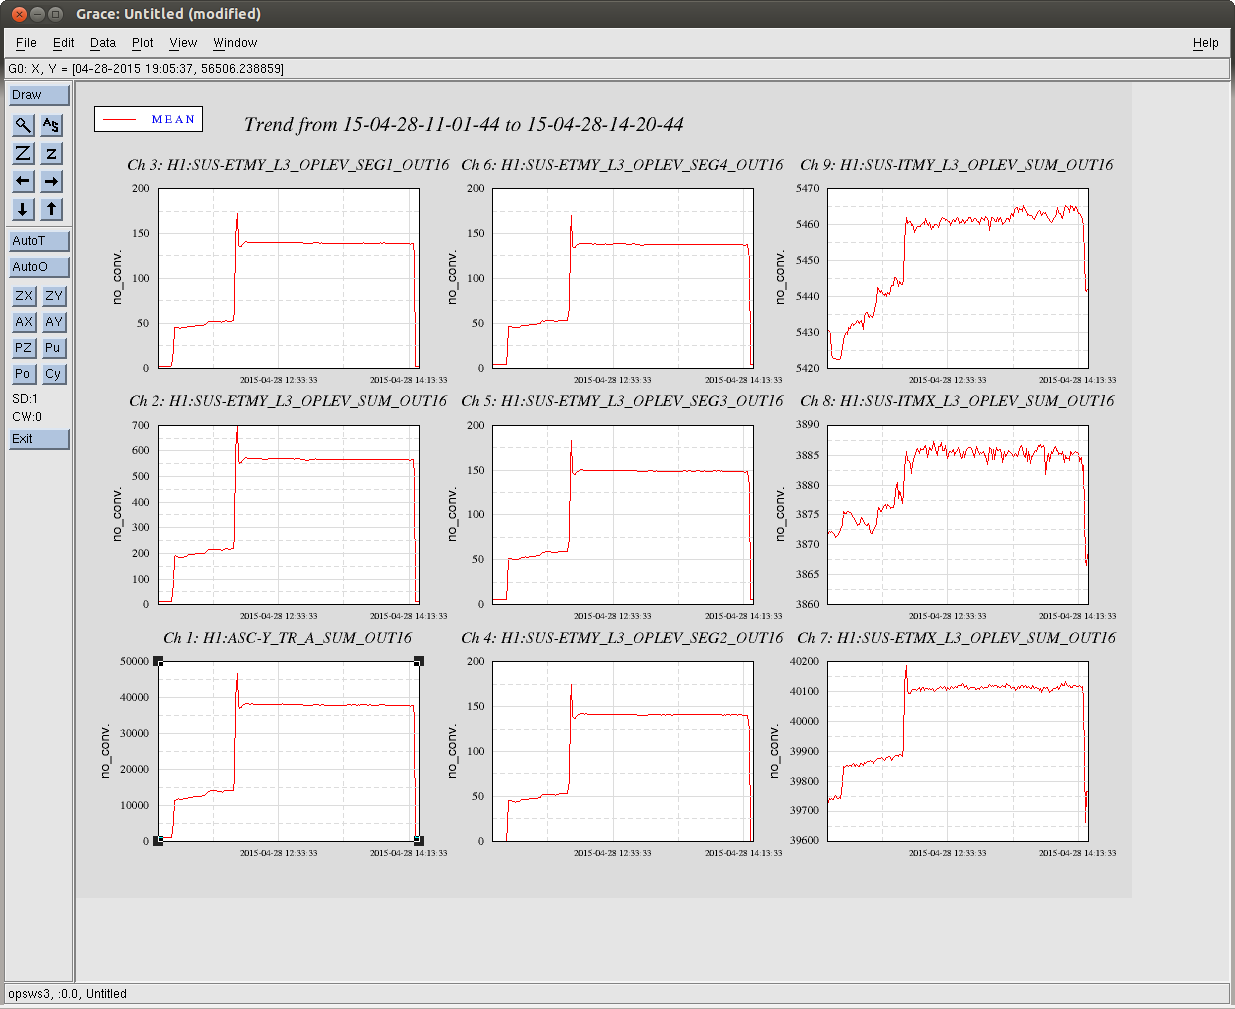
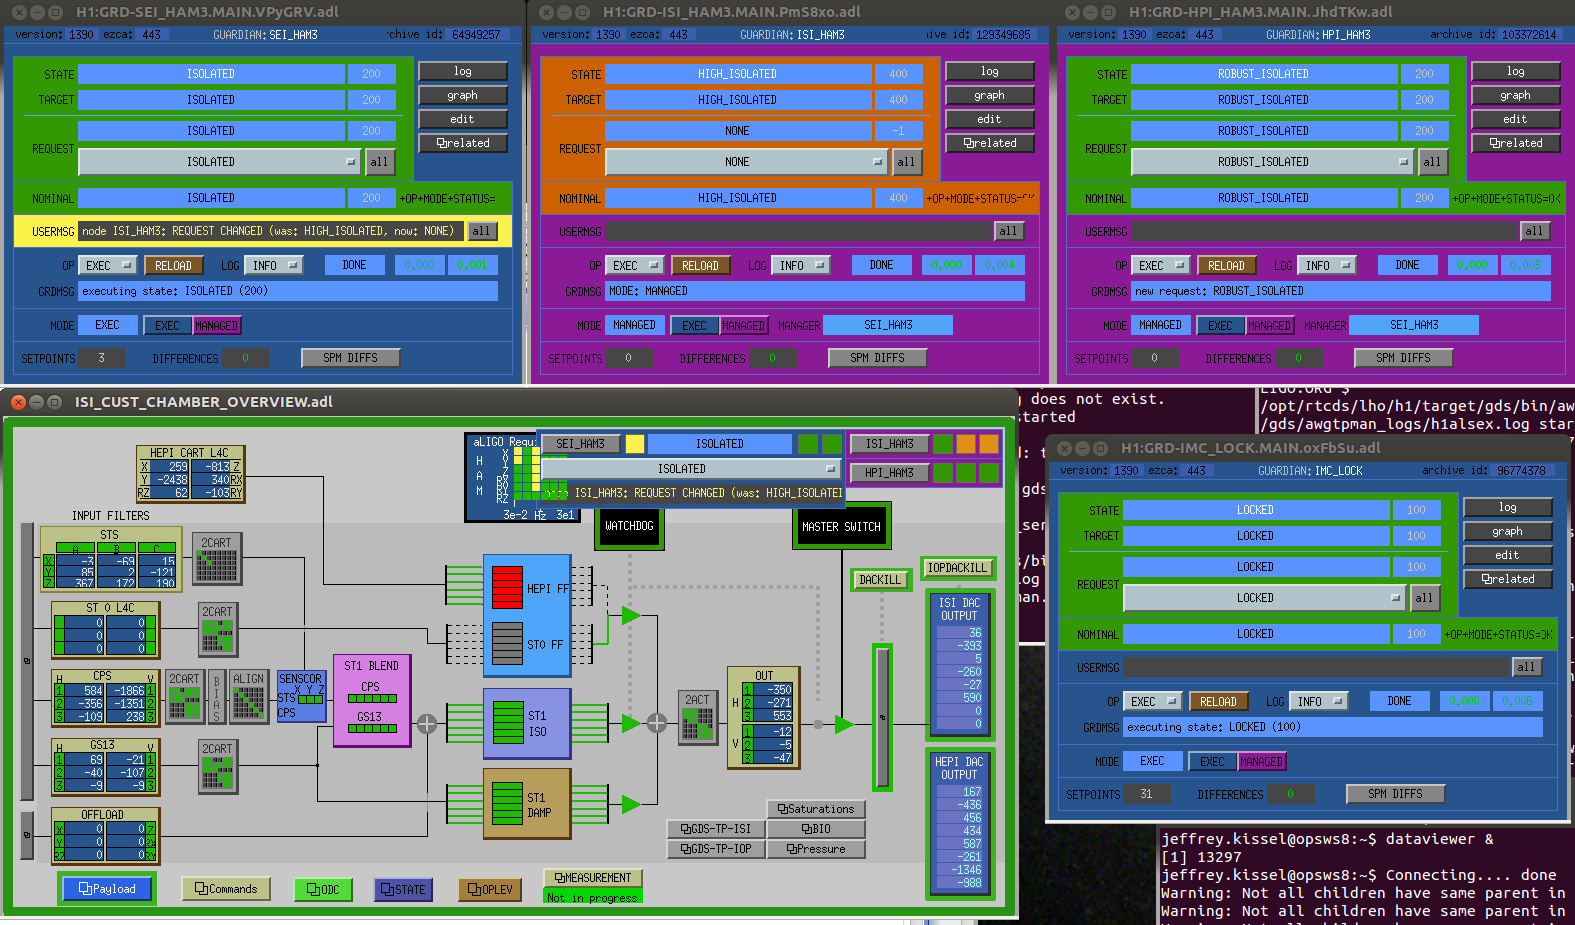
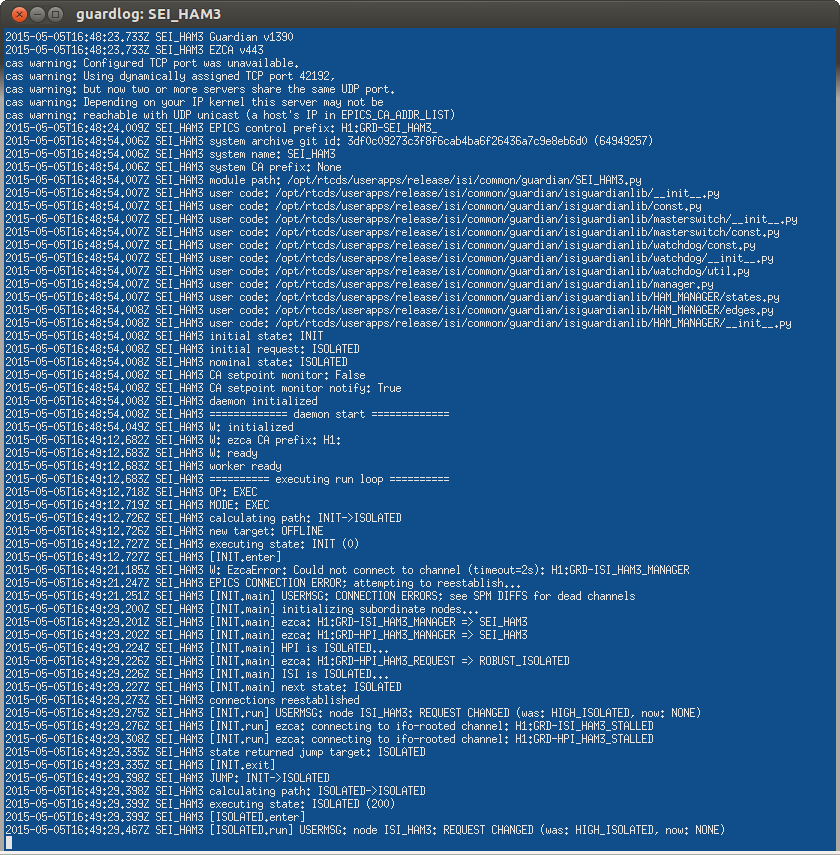
ISI HAM3 Guardian Fails to Advance Past
J. Kissel, D. Barker, B. Weaver

After the first reboot of the guardian machine this morning, all SEI chambers except HAM3 came up as expected: the SEI manager and ISI / HPI subordinates are coded to be smart enough to figure out what state the platforms are actually in and restore to that state upon initialization. HAM3's ISI subordinate did not. I was able to identify it because the HAM3 SEI manager was complaining that it's subordinate's request had changed. The solution was to simply by-hand change the request to HIGH_ISOLATED.

No big problem here, just want to start recording the outcomes of reboots so we can address any systematic issues. Note this did *not* happen on the second guardian machine reboot today.
Images attached to this report
Comments related to this report
This also happened for HEPI HAM1, at least after the second reboot. BUT this may be because he's unique in that it doesn't have a SEI chamber manager telling him where to go, not because of any errant code.

I've manually moved the requested state to ROBUST_ISOLATED, which is where the platform was already.
These are two totally different issues. The HPI_HAM1 issue is just because it doesn't have an initial request state defined. I think Hugh has now fixed that.