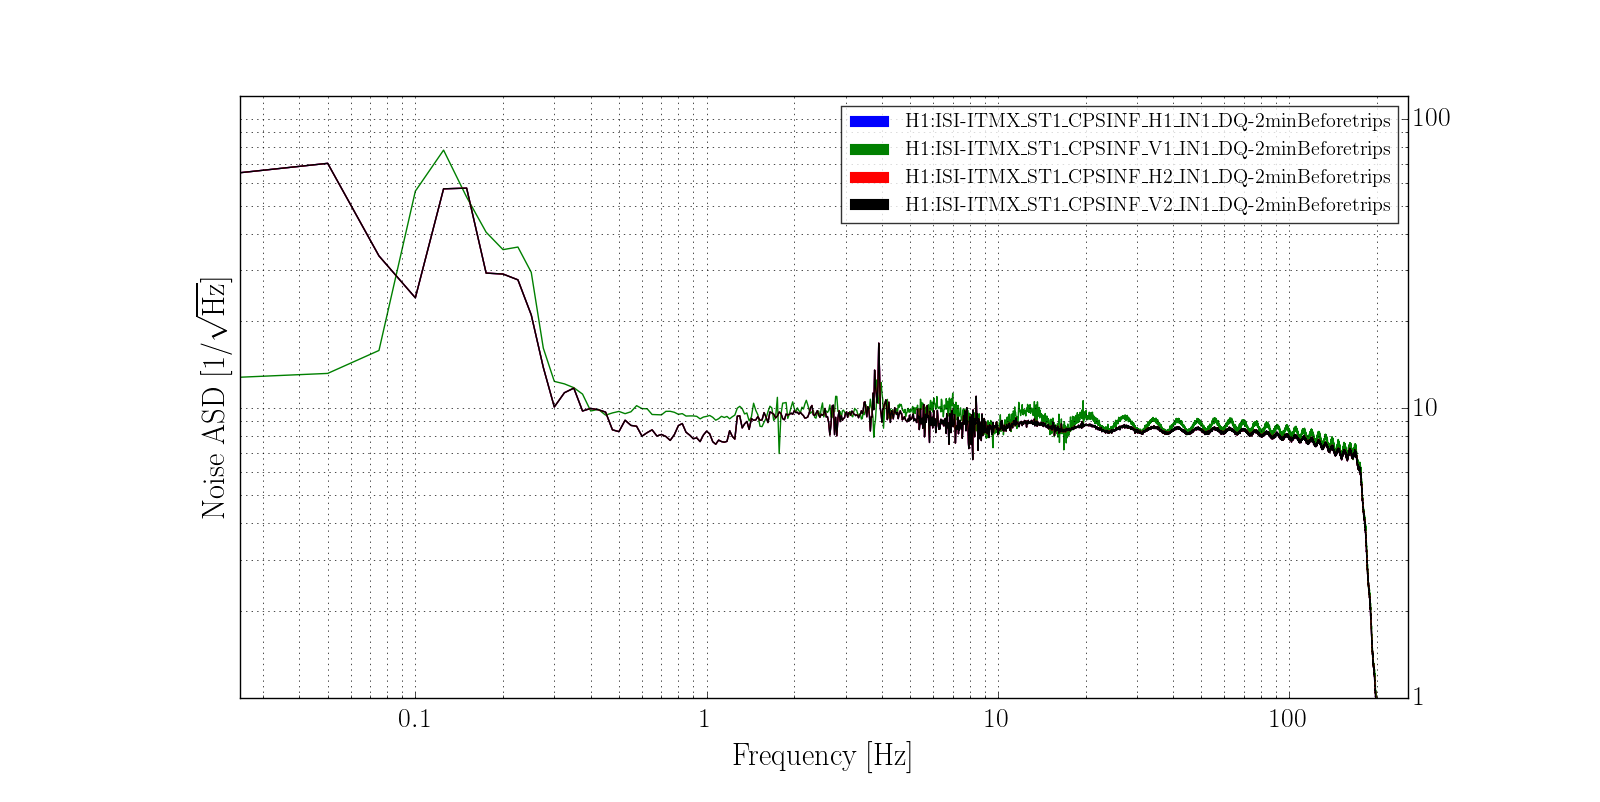
There has been some concern that there might be excess cps noise in some of the channels. So i looked at 20 minutes of data at 1am sunday night/monday morning.
Looking only above 30Hz where the sensors have hit the noise floor, all of the coarse channels are similar and between 3.5-4.5E-10m/rrtHz about what we expect.
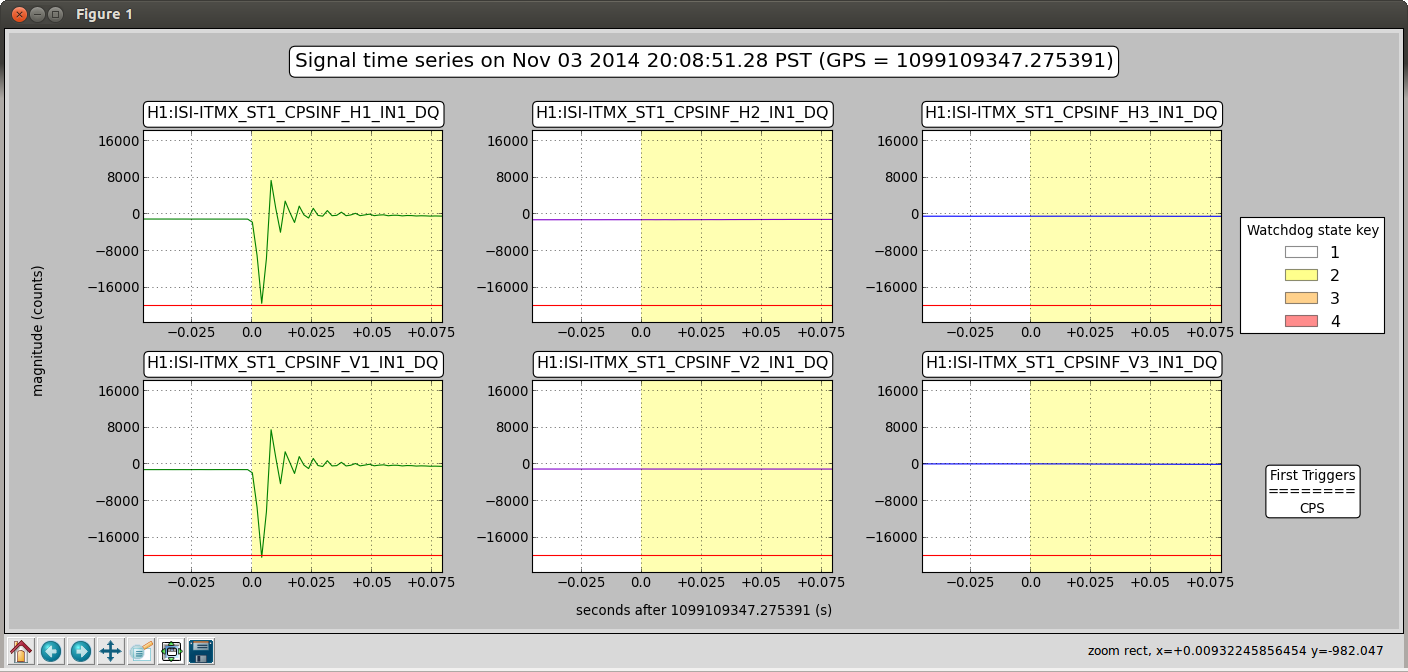
The stage 2 channels show two outliers, ITMX H2 and ITMX V1, maybe BS H2 also but that is close enough so that it could just be at a large offset (we expect the noise floor to go as the gap squared) I'll check that.
The first thing to do is for me to look at another time, and to check the cables and connections for those sensors
I looked at a second data set calling it "B" (24 hours later) ST2 ITMX H2 and ST2 ITMX V1 still show excess noise BS H2 is down to 4.5-5E-10m/rtHz which is a little bit noisy, but probably within what we are calling acceptable. I attached the data because Jeff asked to see the ADC noise on the plot
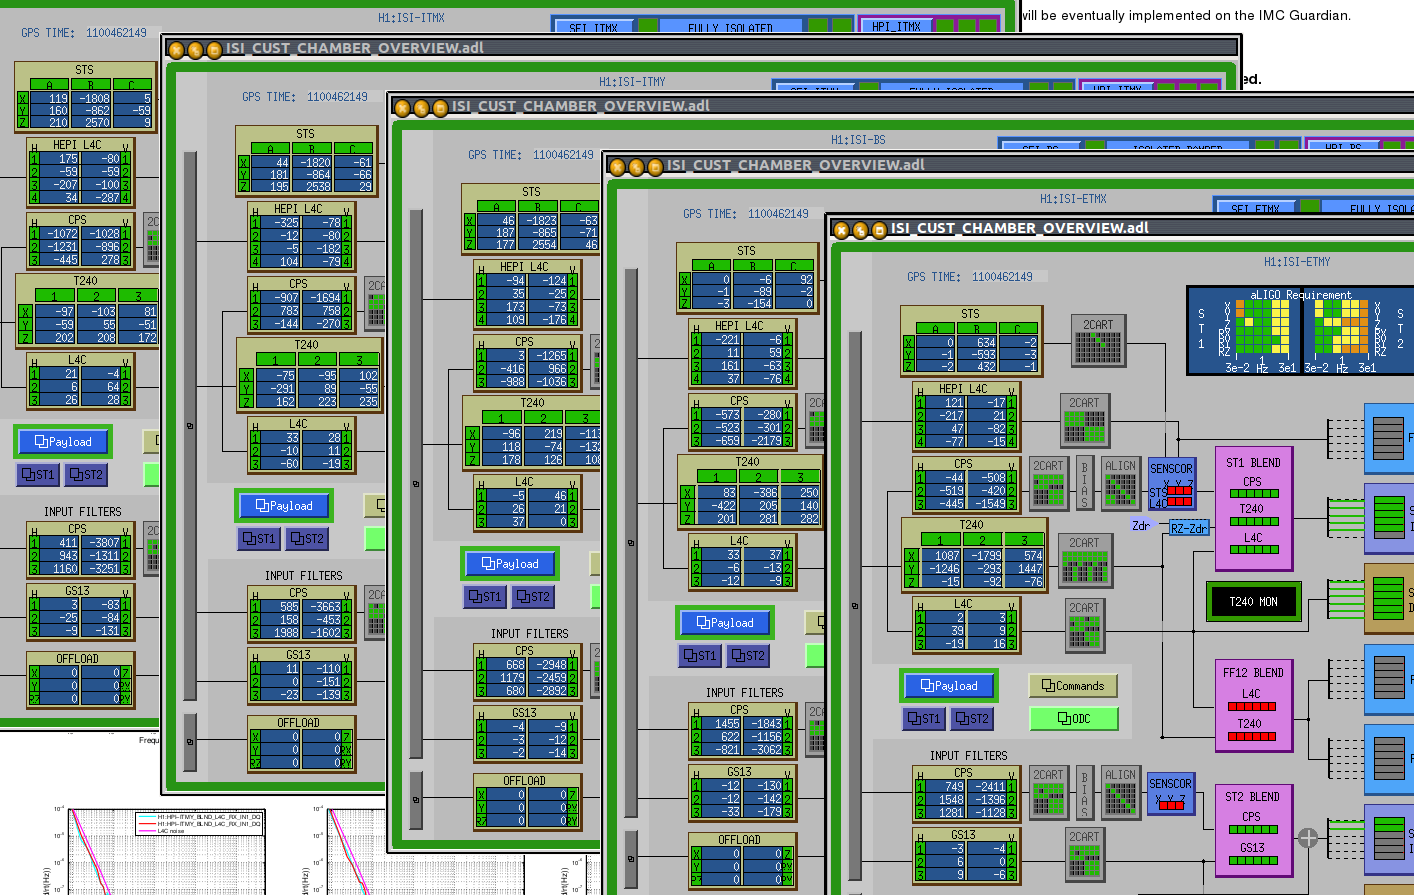
When I say large offset I mean > 10000 counts, so 1200 counts is centered for this discussion

ITMX Stage2 H2 & V1 CPS offsets are 900 & 3800 counts. While V1 is actually the largest offset of all the BSC CPSs, H2 is 21st of 30 (towards the bottom) of Stage2 CPS offsets. At 1200cts, BSC2 H2 ranks 17th of 30. So the offset maybe an issue for ITMX V1 but the others...? And, what about ITMY V1 at 3700 counts and ITMX V3 at 3200?
Attached are all the BSC medms showing the offsets.
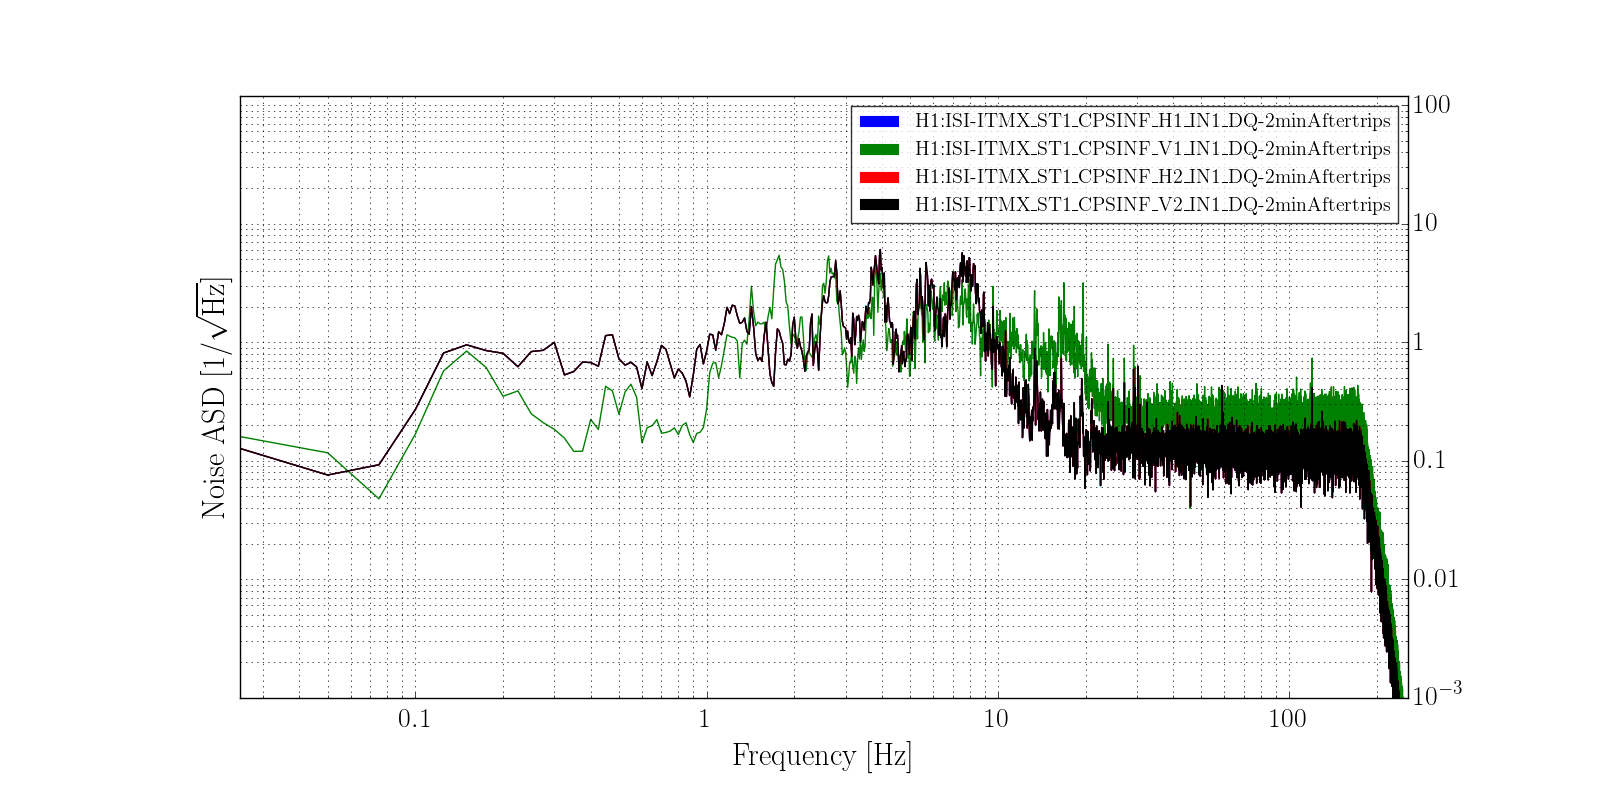
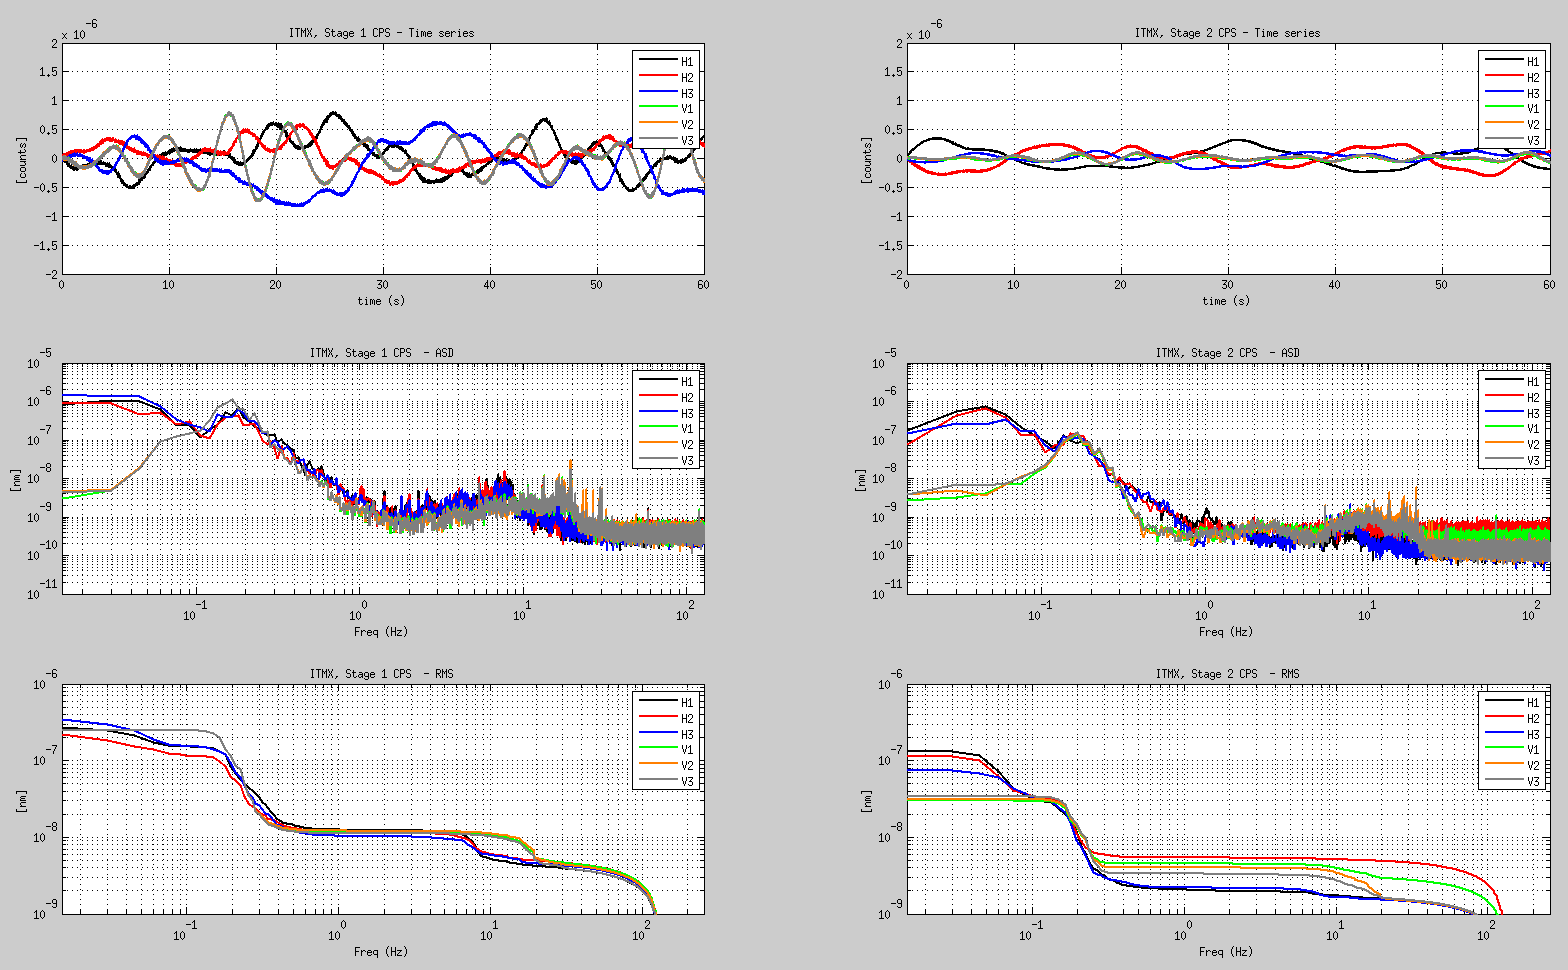
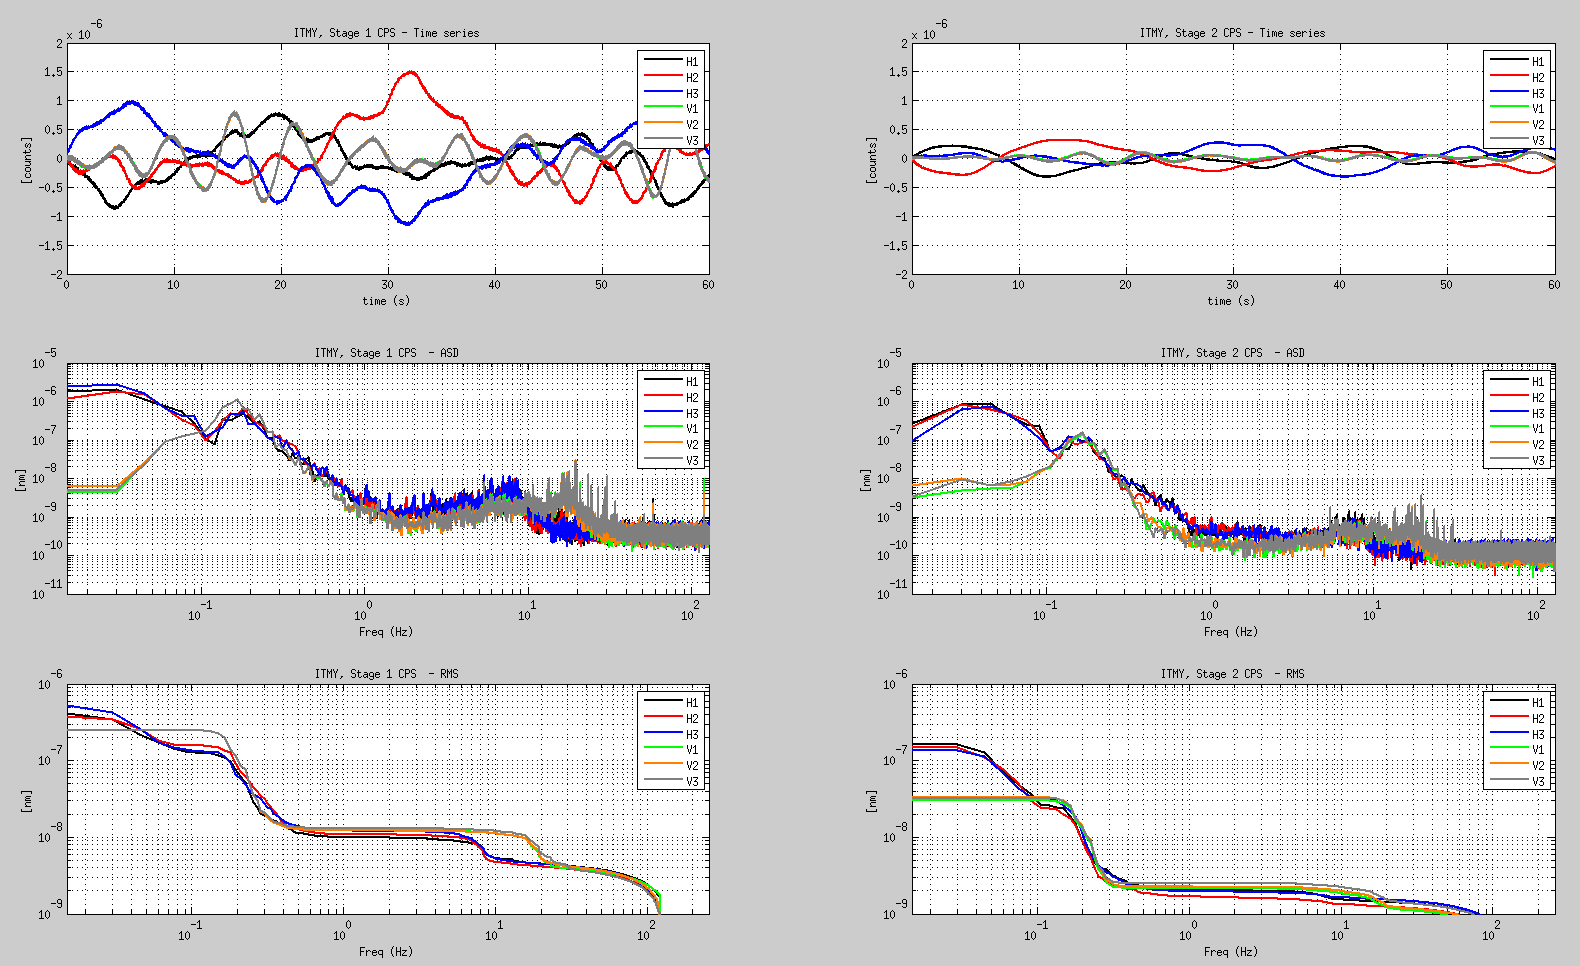
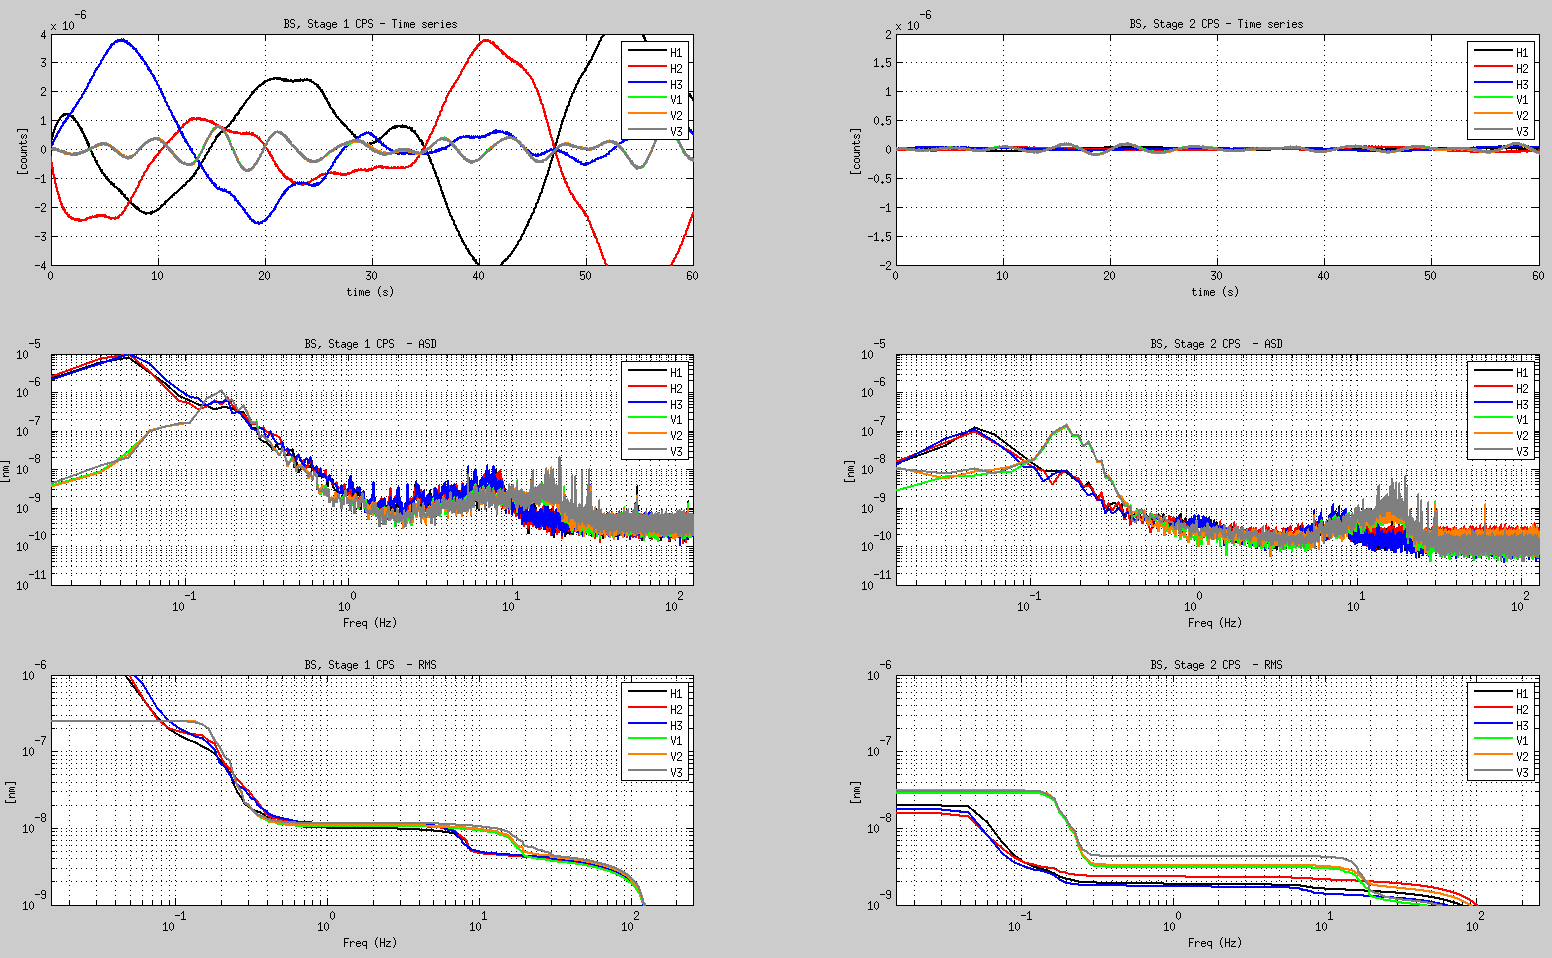
Some additional info regarding the CPS - On the figures are plotted time series, integrated RMS, and ASD down to low frequencies. Somme comments:
- At high frequencies, not much to add on sensor noise (ITMX and BS both have two CPS untis with elvevated sensor noise on Stage 2). I looked at data of the Nov 17th, 18th and 19th, and get similar results.
- All Stage 1 CPS units are within 1um p2p, except BS horizontal that is moving 4 times more. Something to look into.
- At the microseism, the three vertical sensors are moving in sync, on all stages of all platforms. Probably normal (the platform is inertially decoupled down to the micro-seism with th 90 mHz blends)
- The low frequency motion amplification is about 100 times larger in the vertical directions than it is in the horizontal directions.
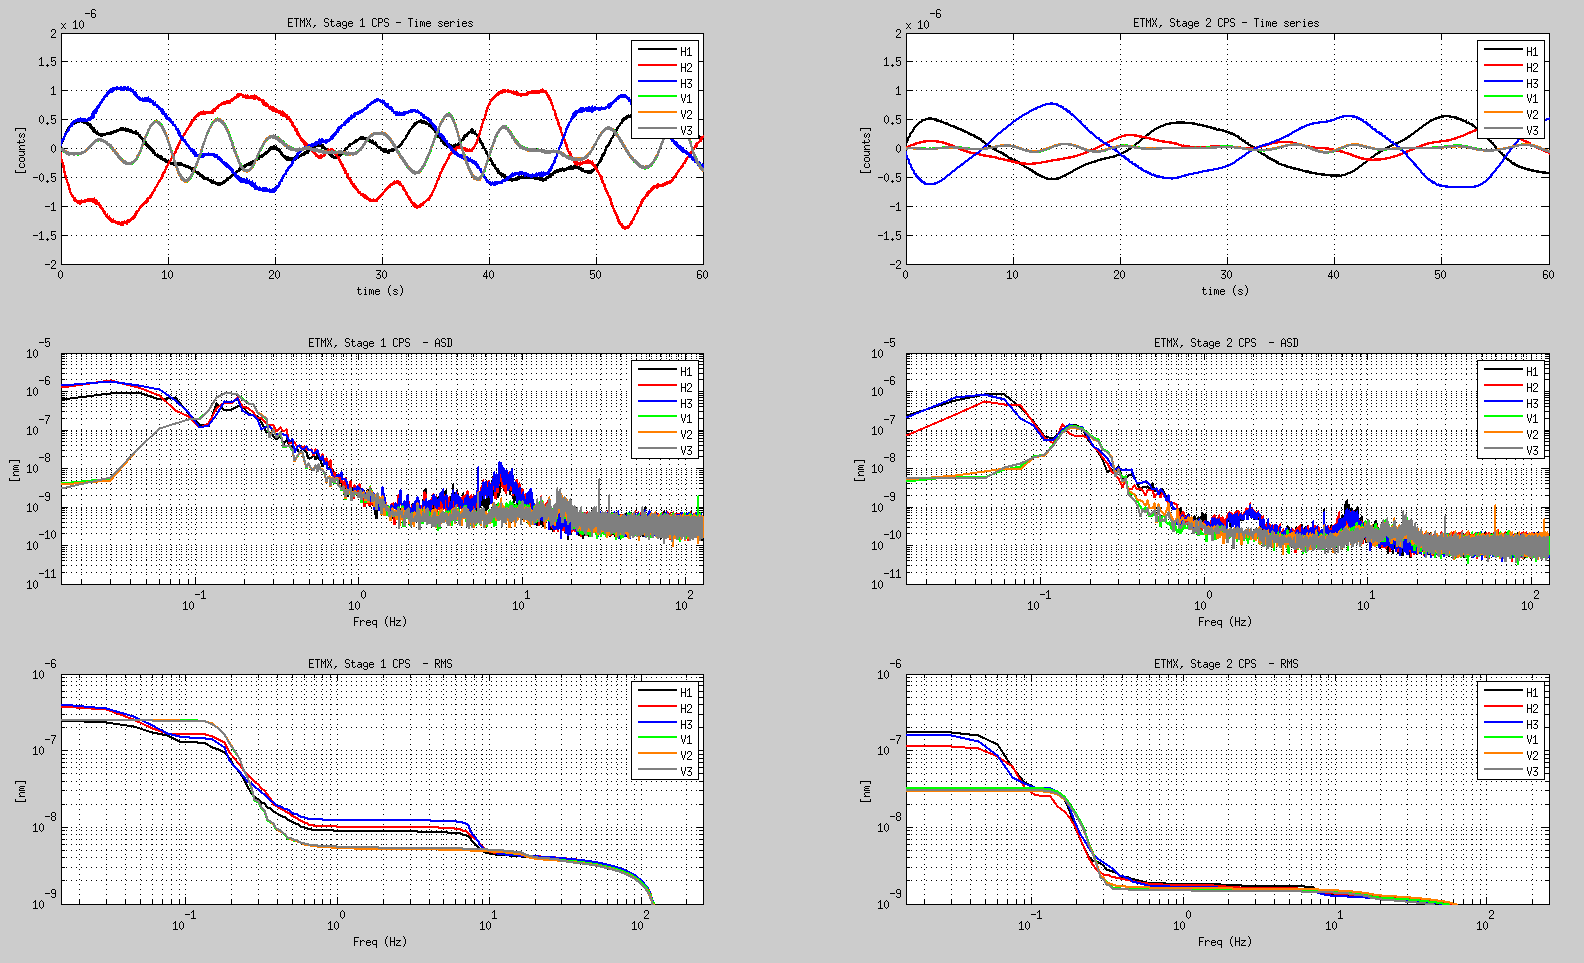
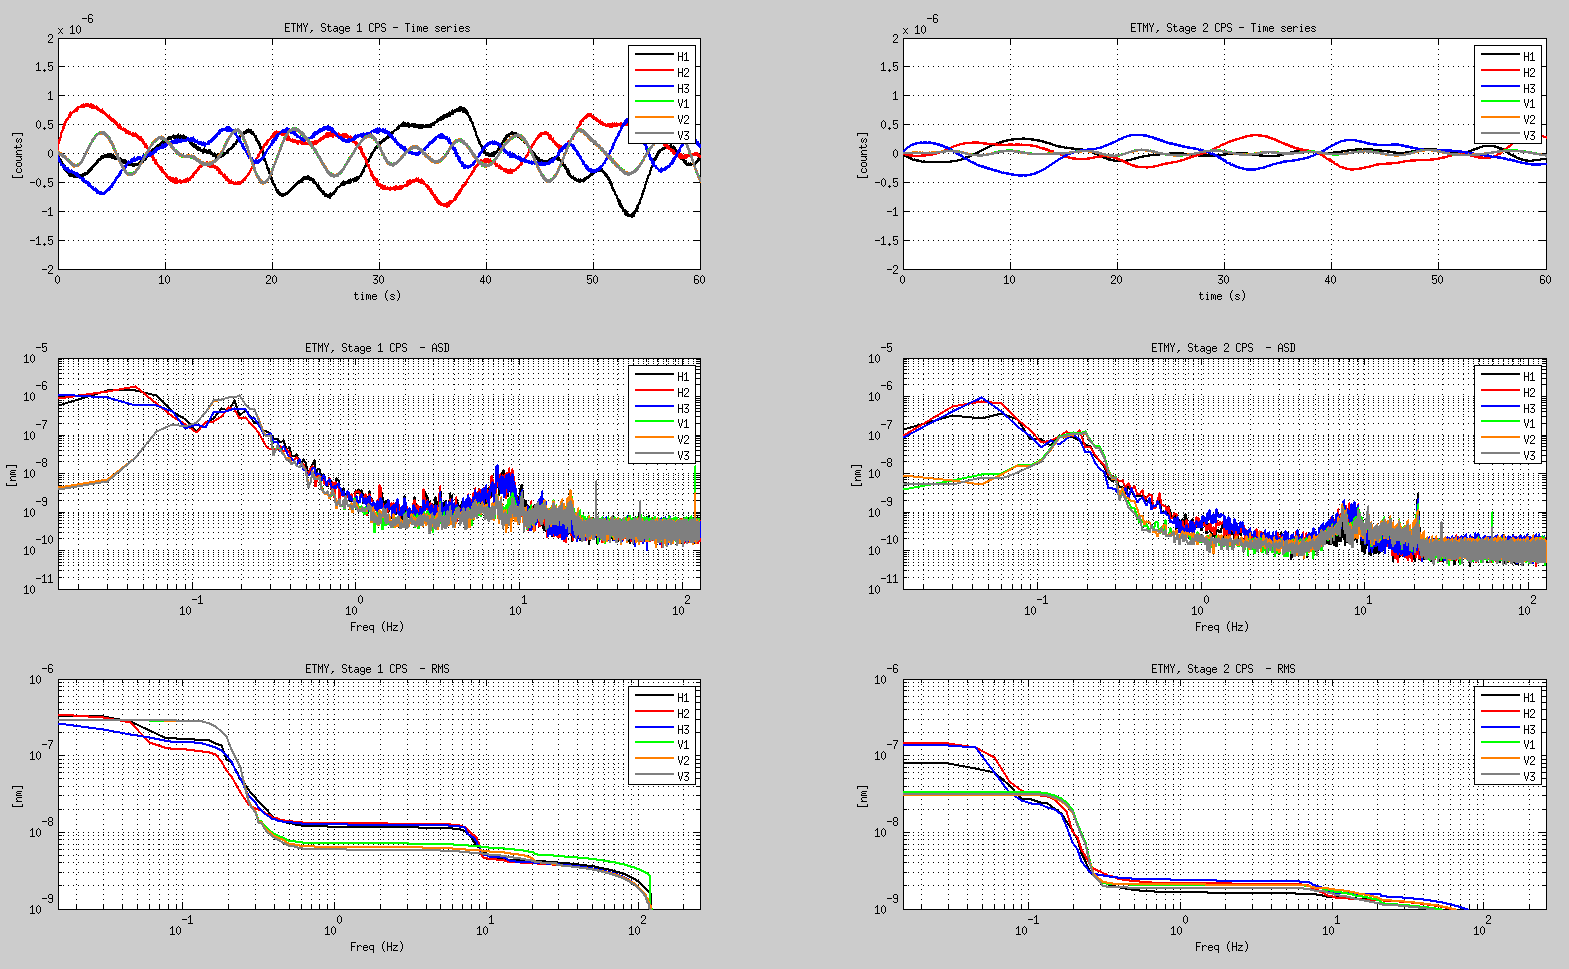
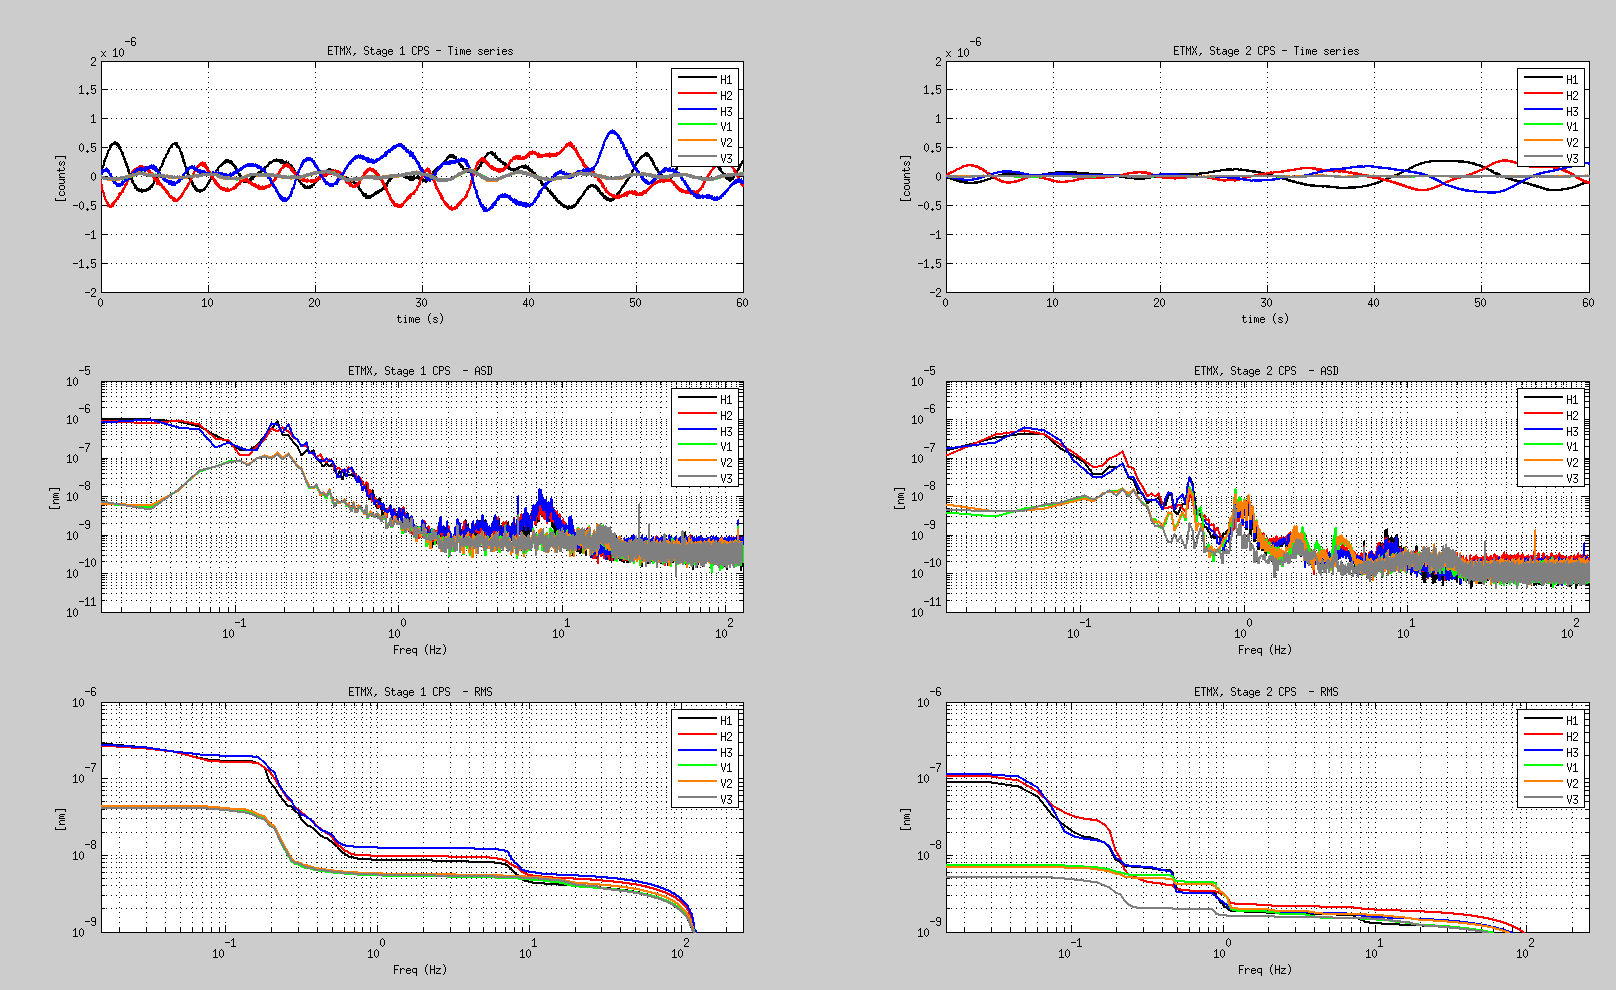
The 5 figures in the previous log are for data ten on the 17th at 3pm PT.
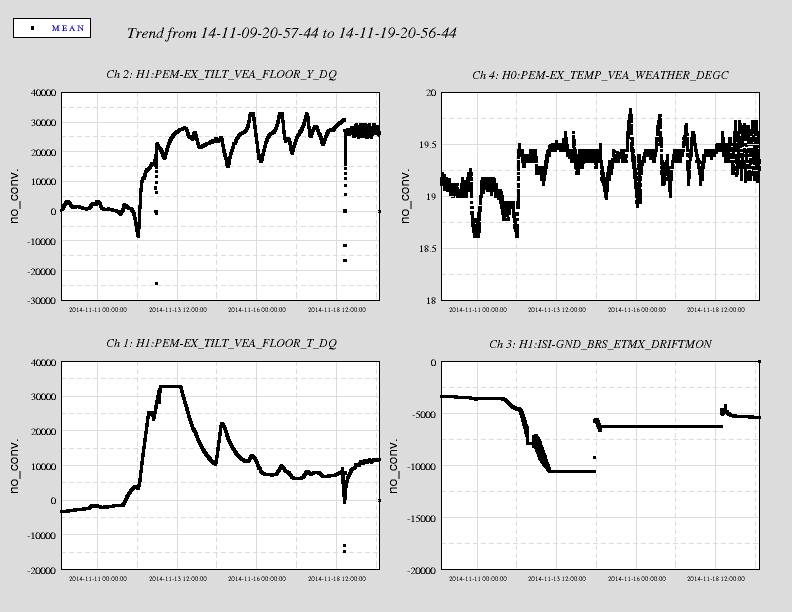
Results and comments are similar for the 18th and 19th, except for ETMX (attached plot) that shows different behavior at low frequencies, as expected with the sensor correction that was turned on Tuesday. It also shows features on Stage 2 at the SUS resonances, that might need to be doubled checks.
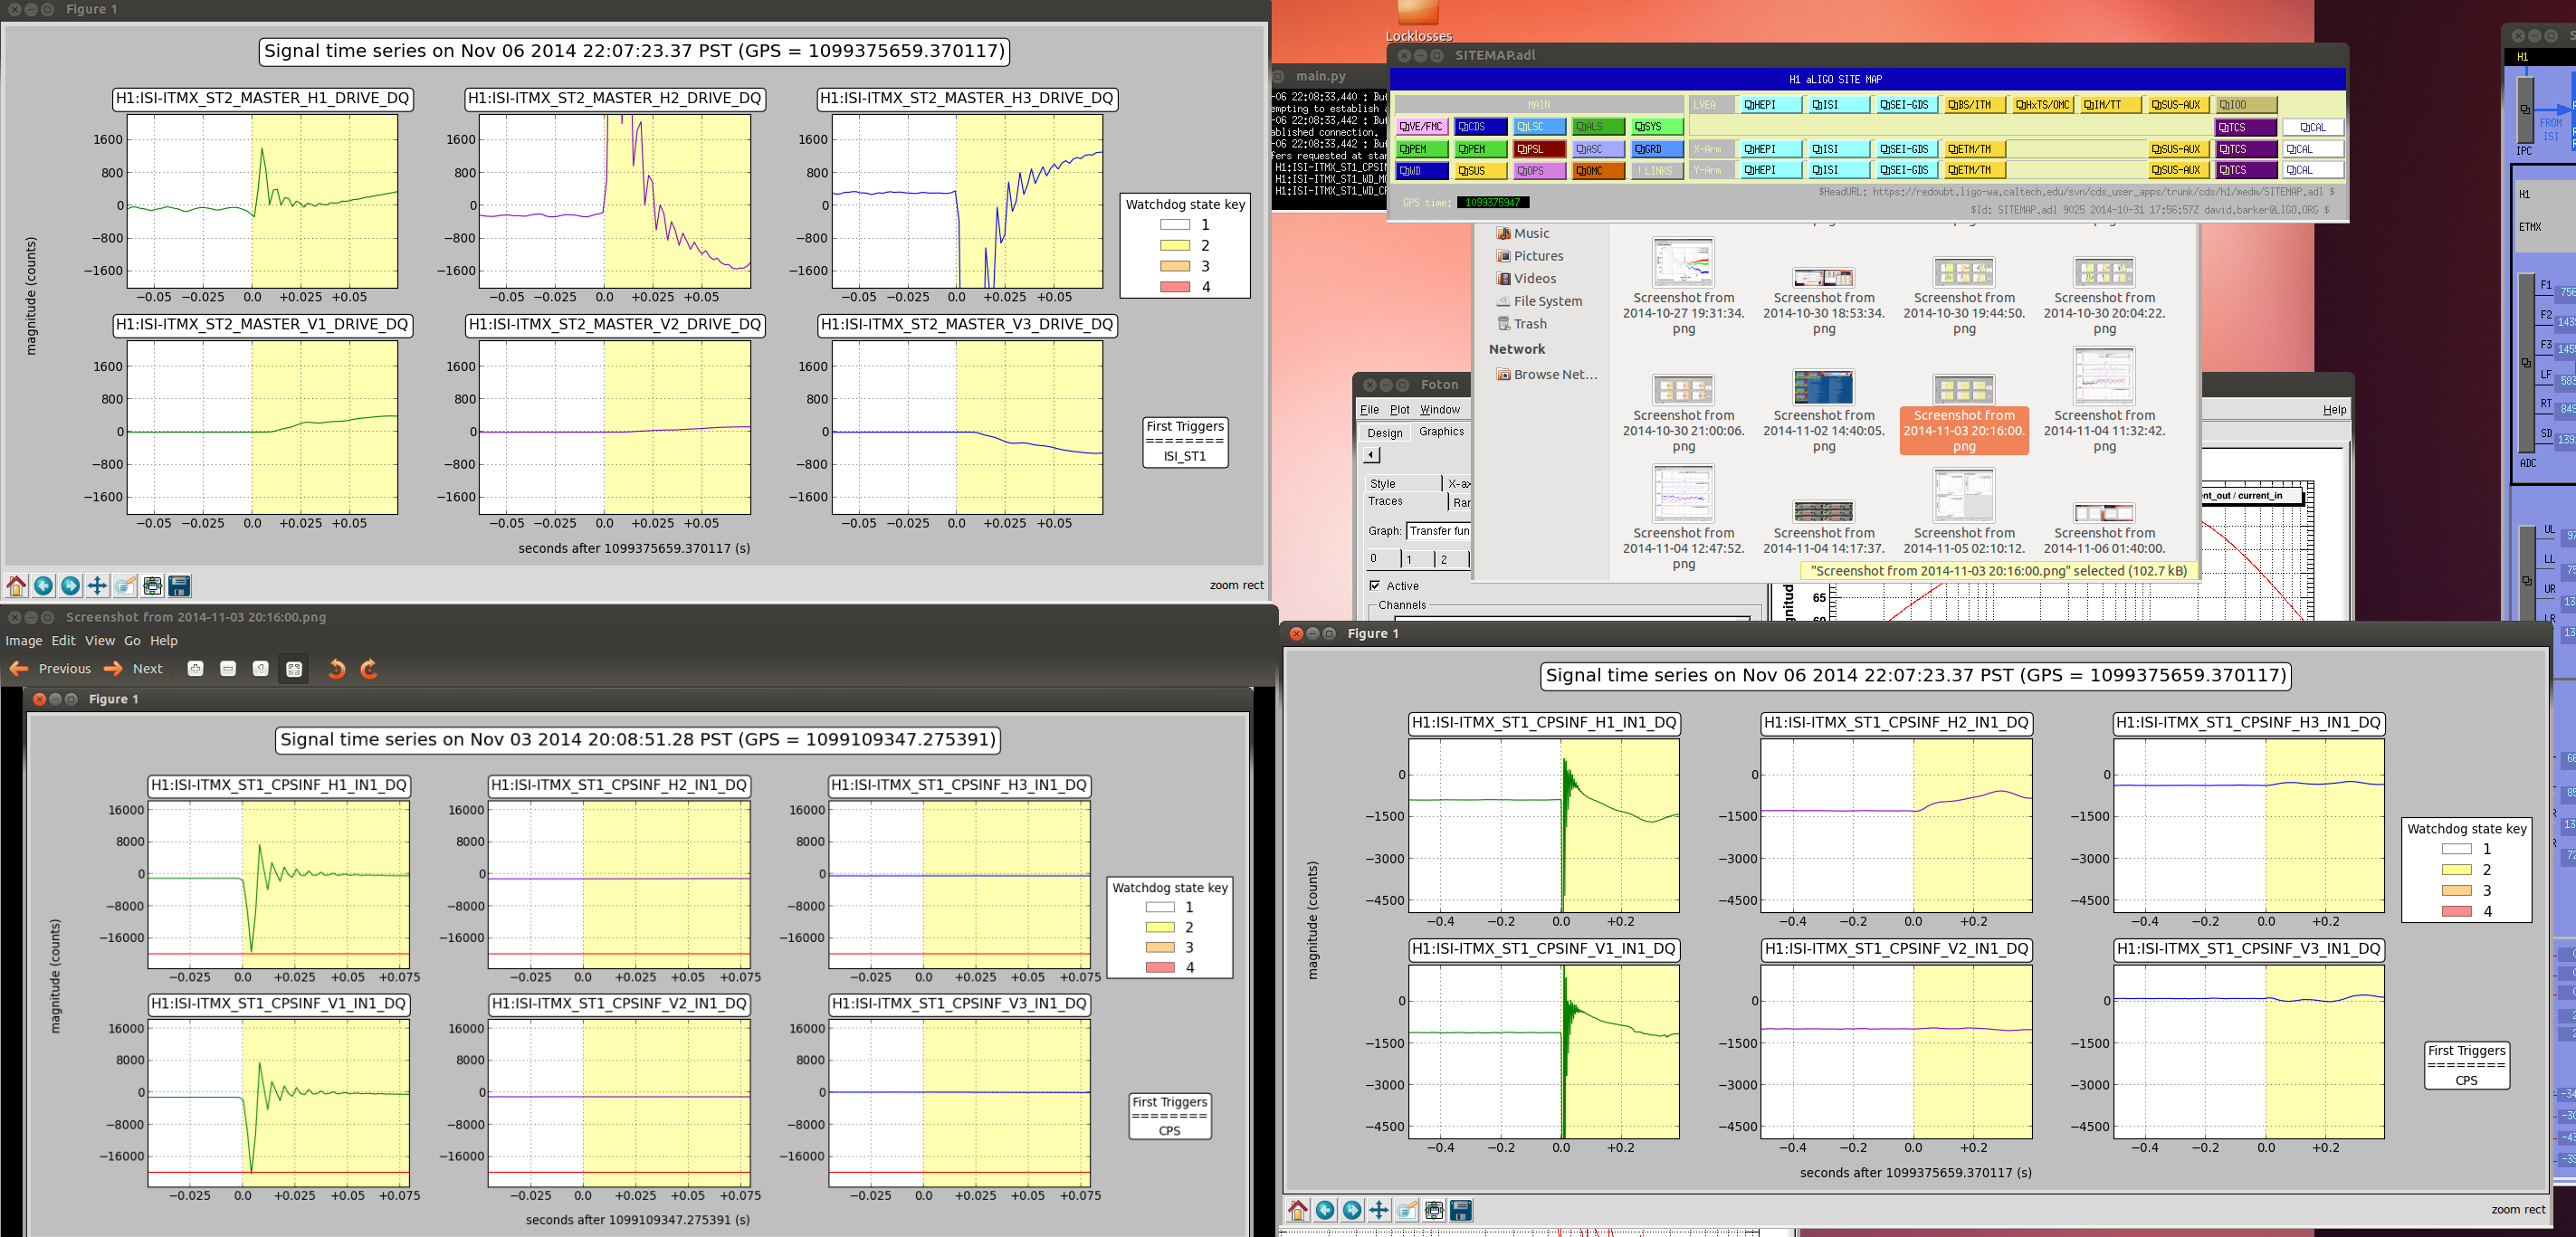
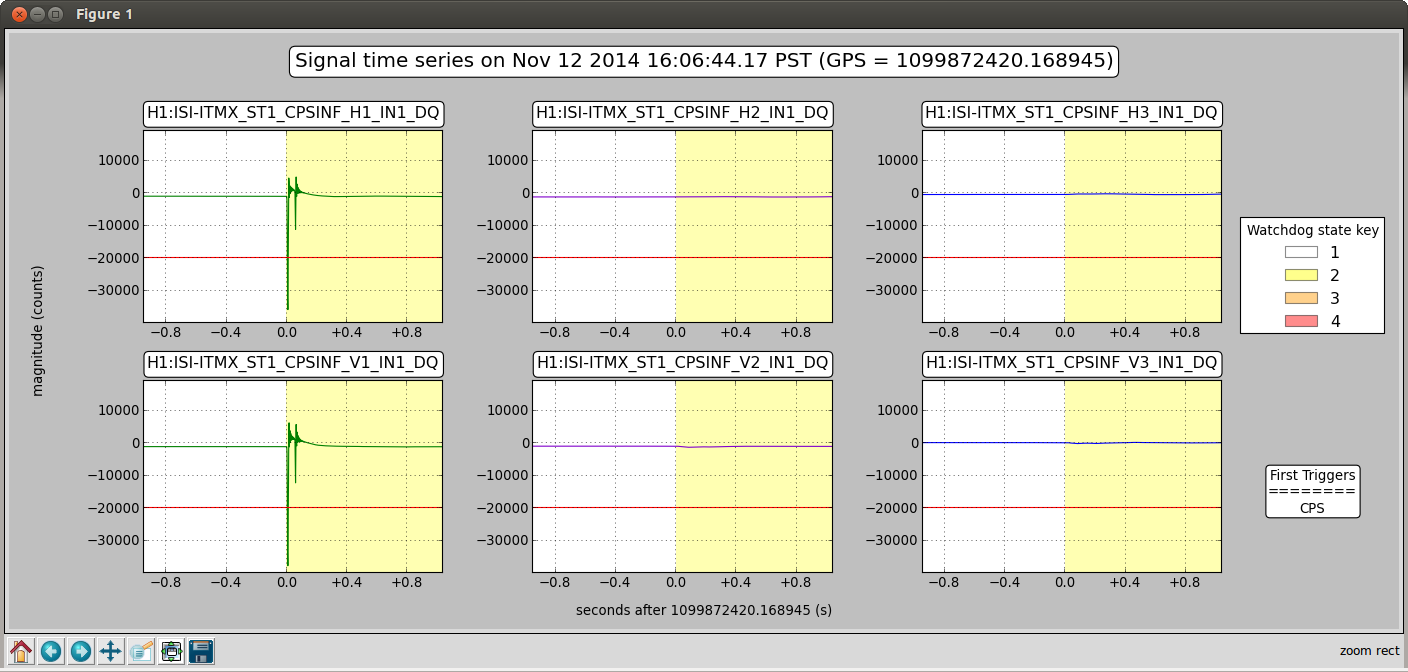
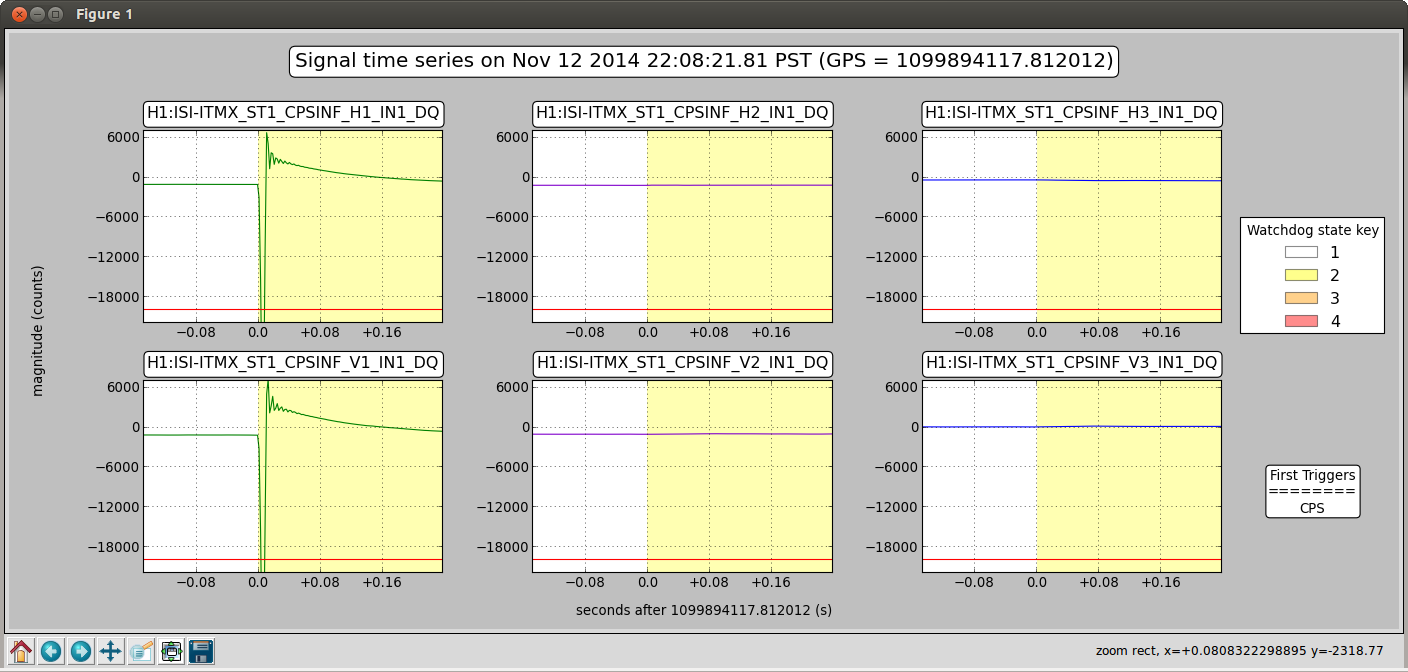
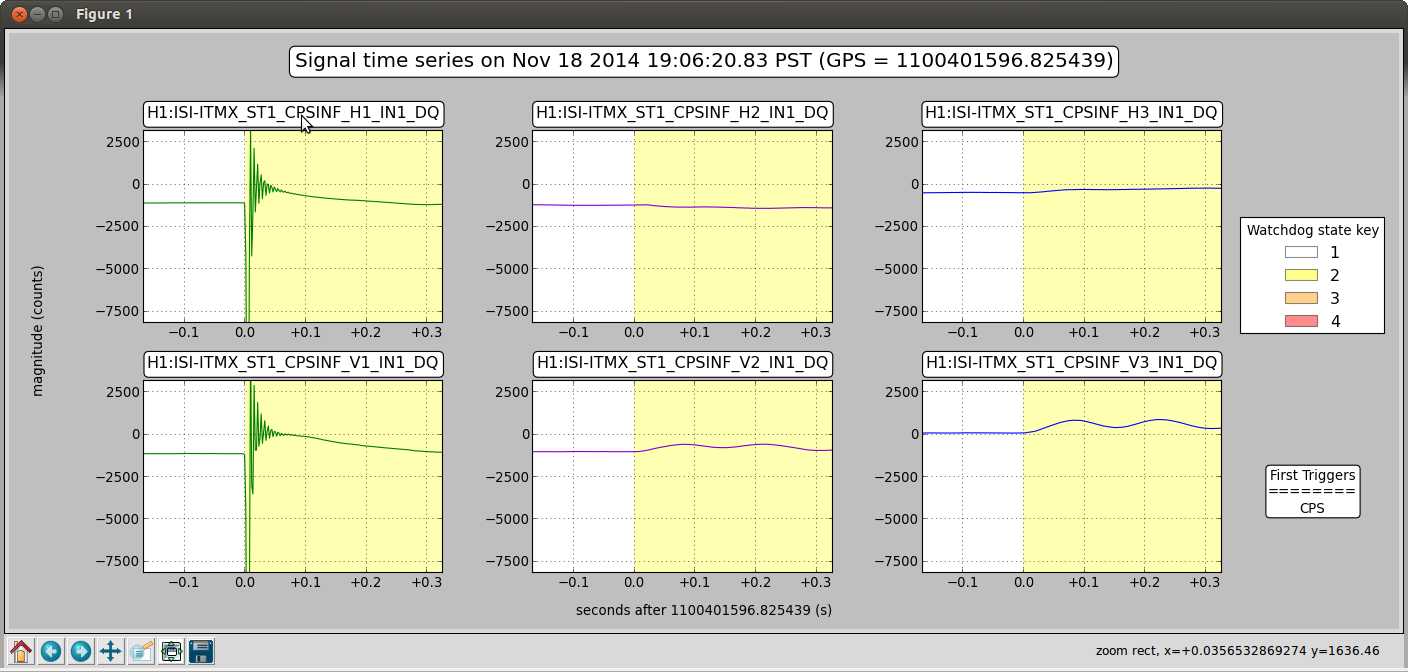
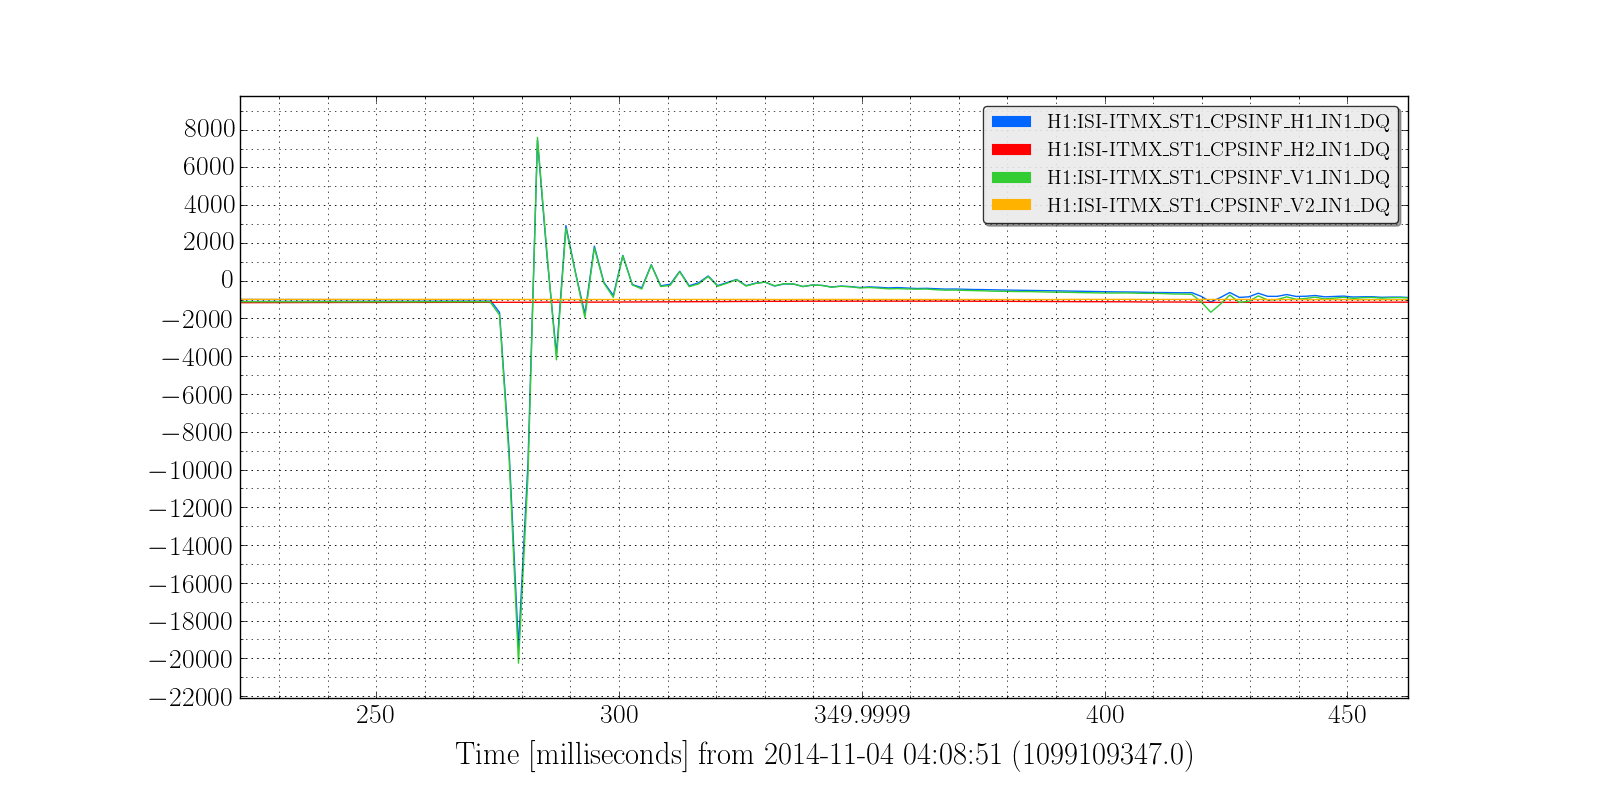
Could this be related to the trips on ITMX? (alog 15021)
this log seems to have gotten hijacked
I check the HAM-CPS and they all seem to be good at high frequency