8:41 Safety audit committee to LVEA for tour
8:51 Jeff B to LVEA to shutdown dust monitors (2,3,4,5,13)
8:53 Filiberto to MidY on AOS parts hunt
9:31 Richard to MidY
9:34 Safety audit committee tour complete
9:36 Jeff B done with dust monitor work
9:41 Greg to EY
9:51 Christina to EX and EY for magnetometer install
10:00 Kyle to soft-close GV7
10:05 Richard back from MY
11:00 Betsy to west bay on laser barrier hunt
12:00 Greg transitioning EY to laser hazard
12:06 Jim B to LVEA with security review tour
12:33 Jim B out of LVEA
12:44 Greg Mendell to roof with security review committee
12:57 Karen to EY
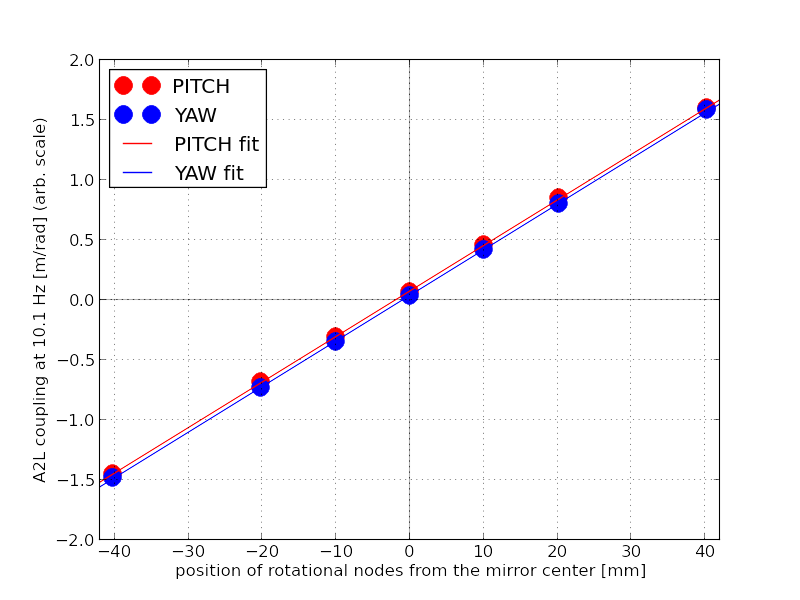
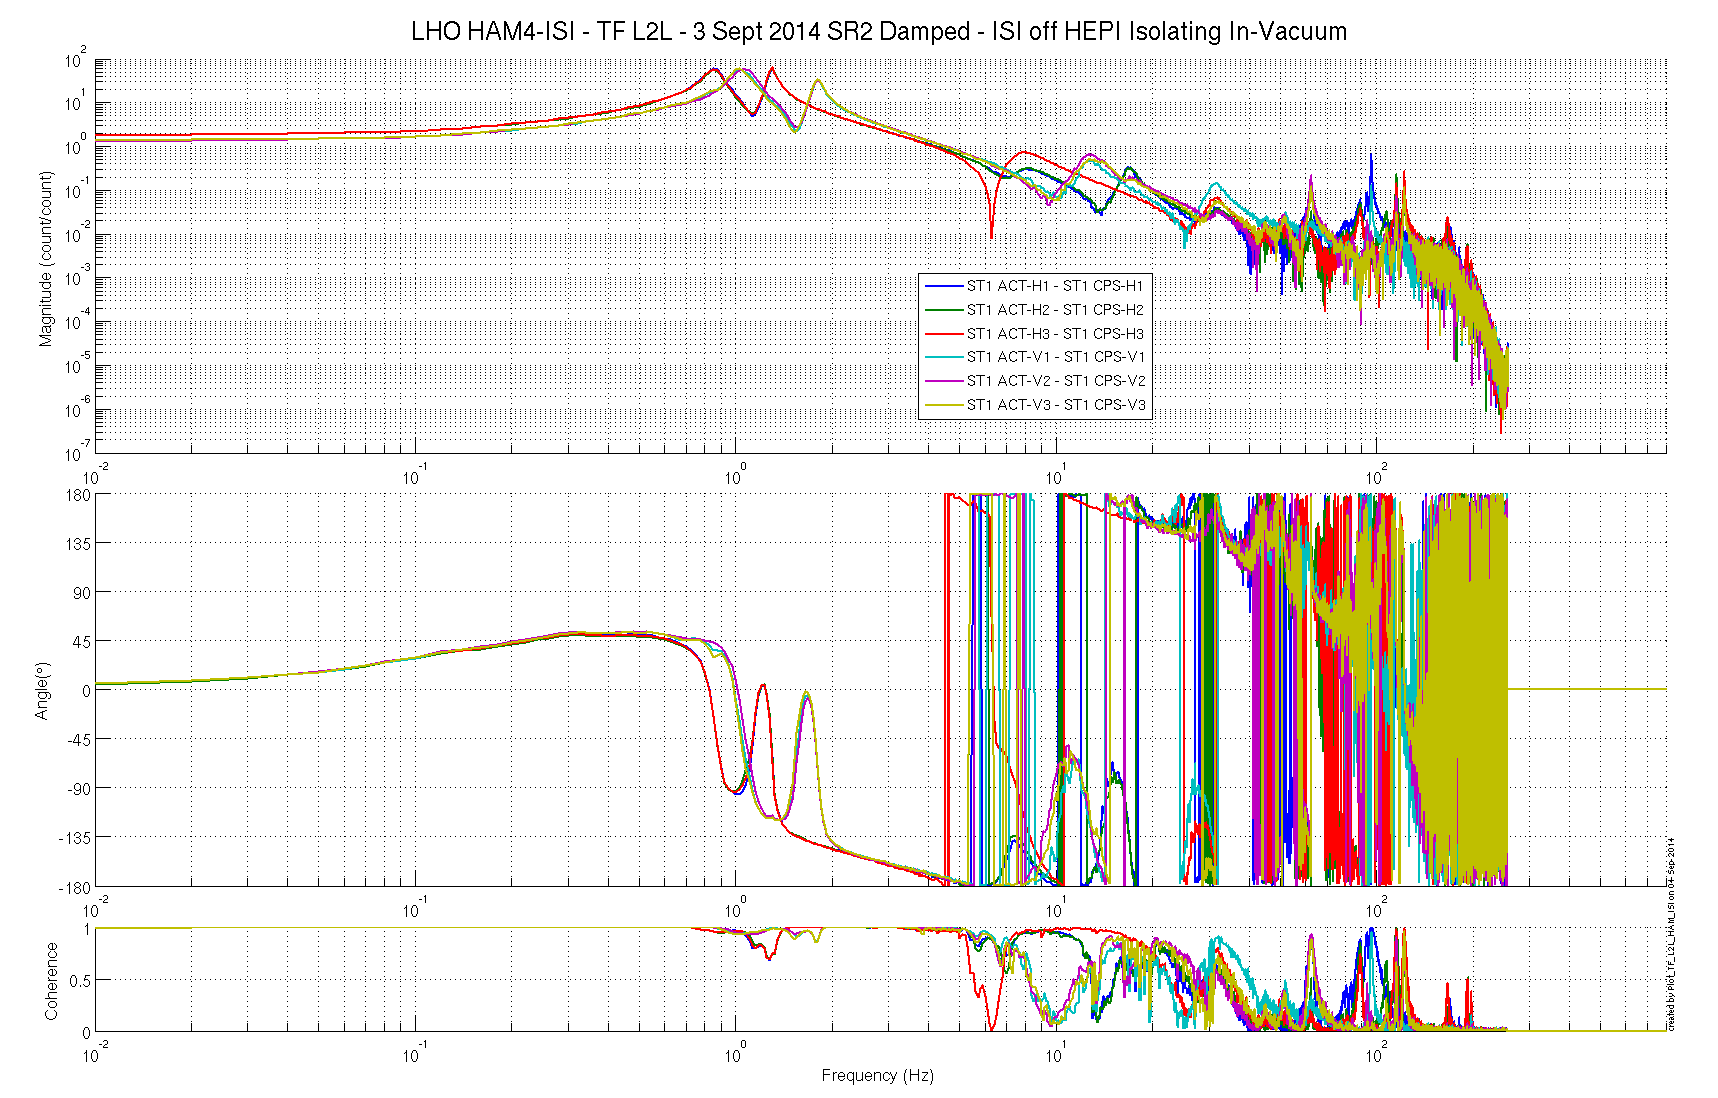
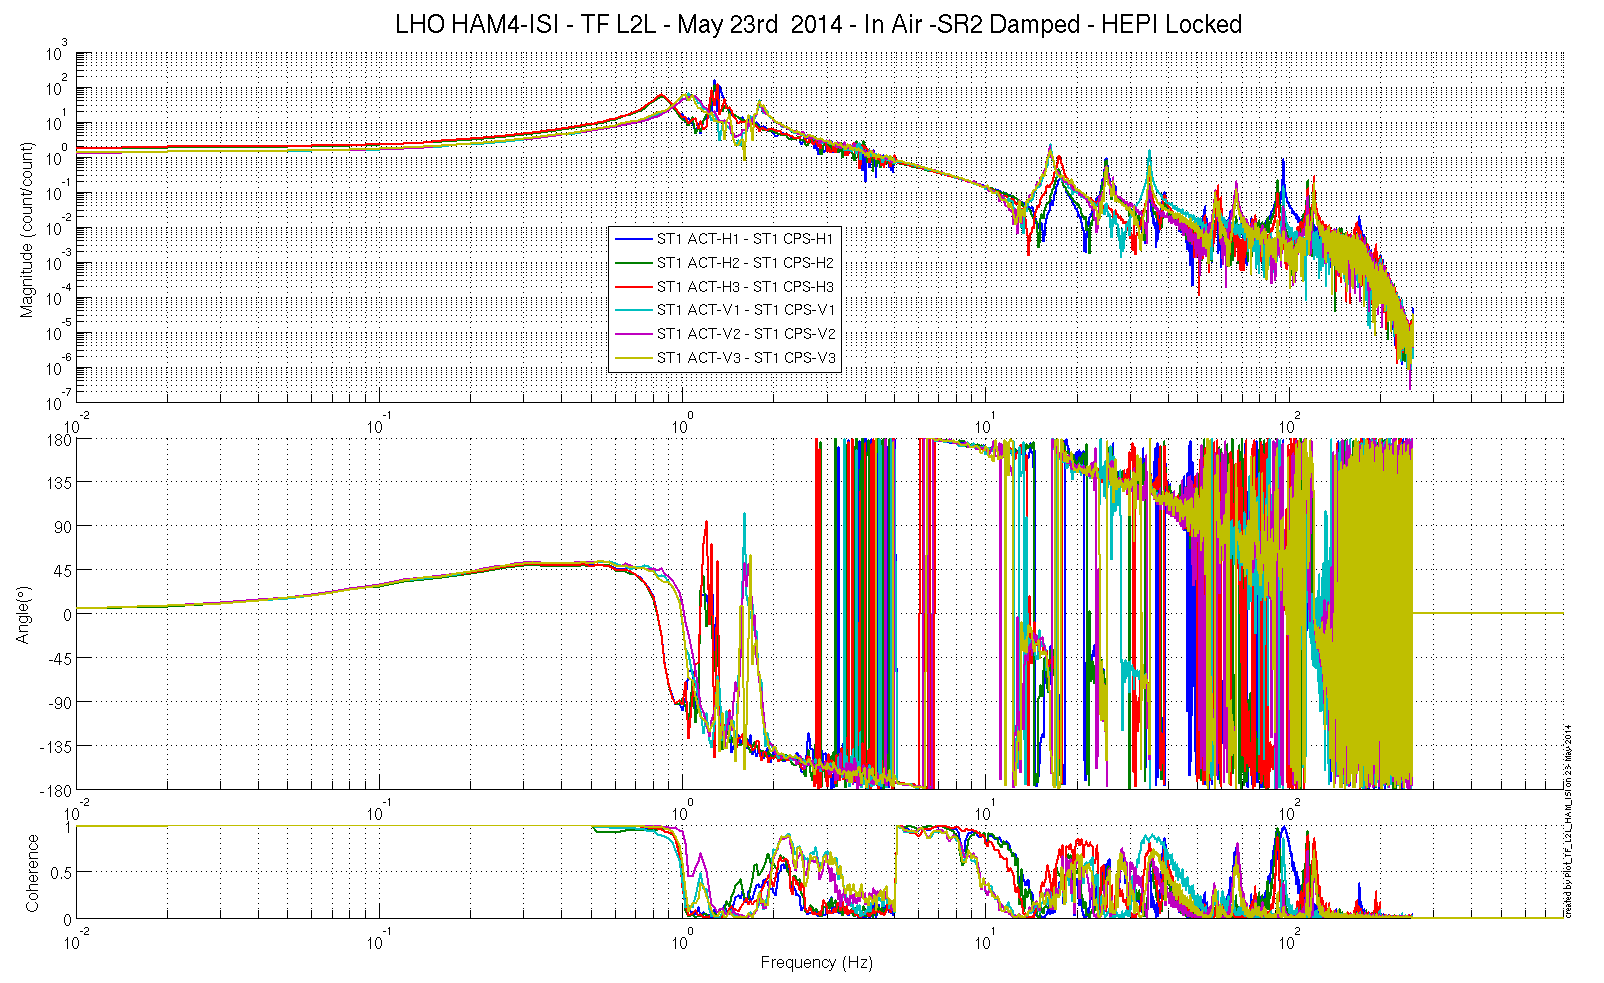
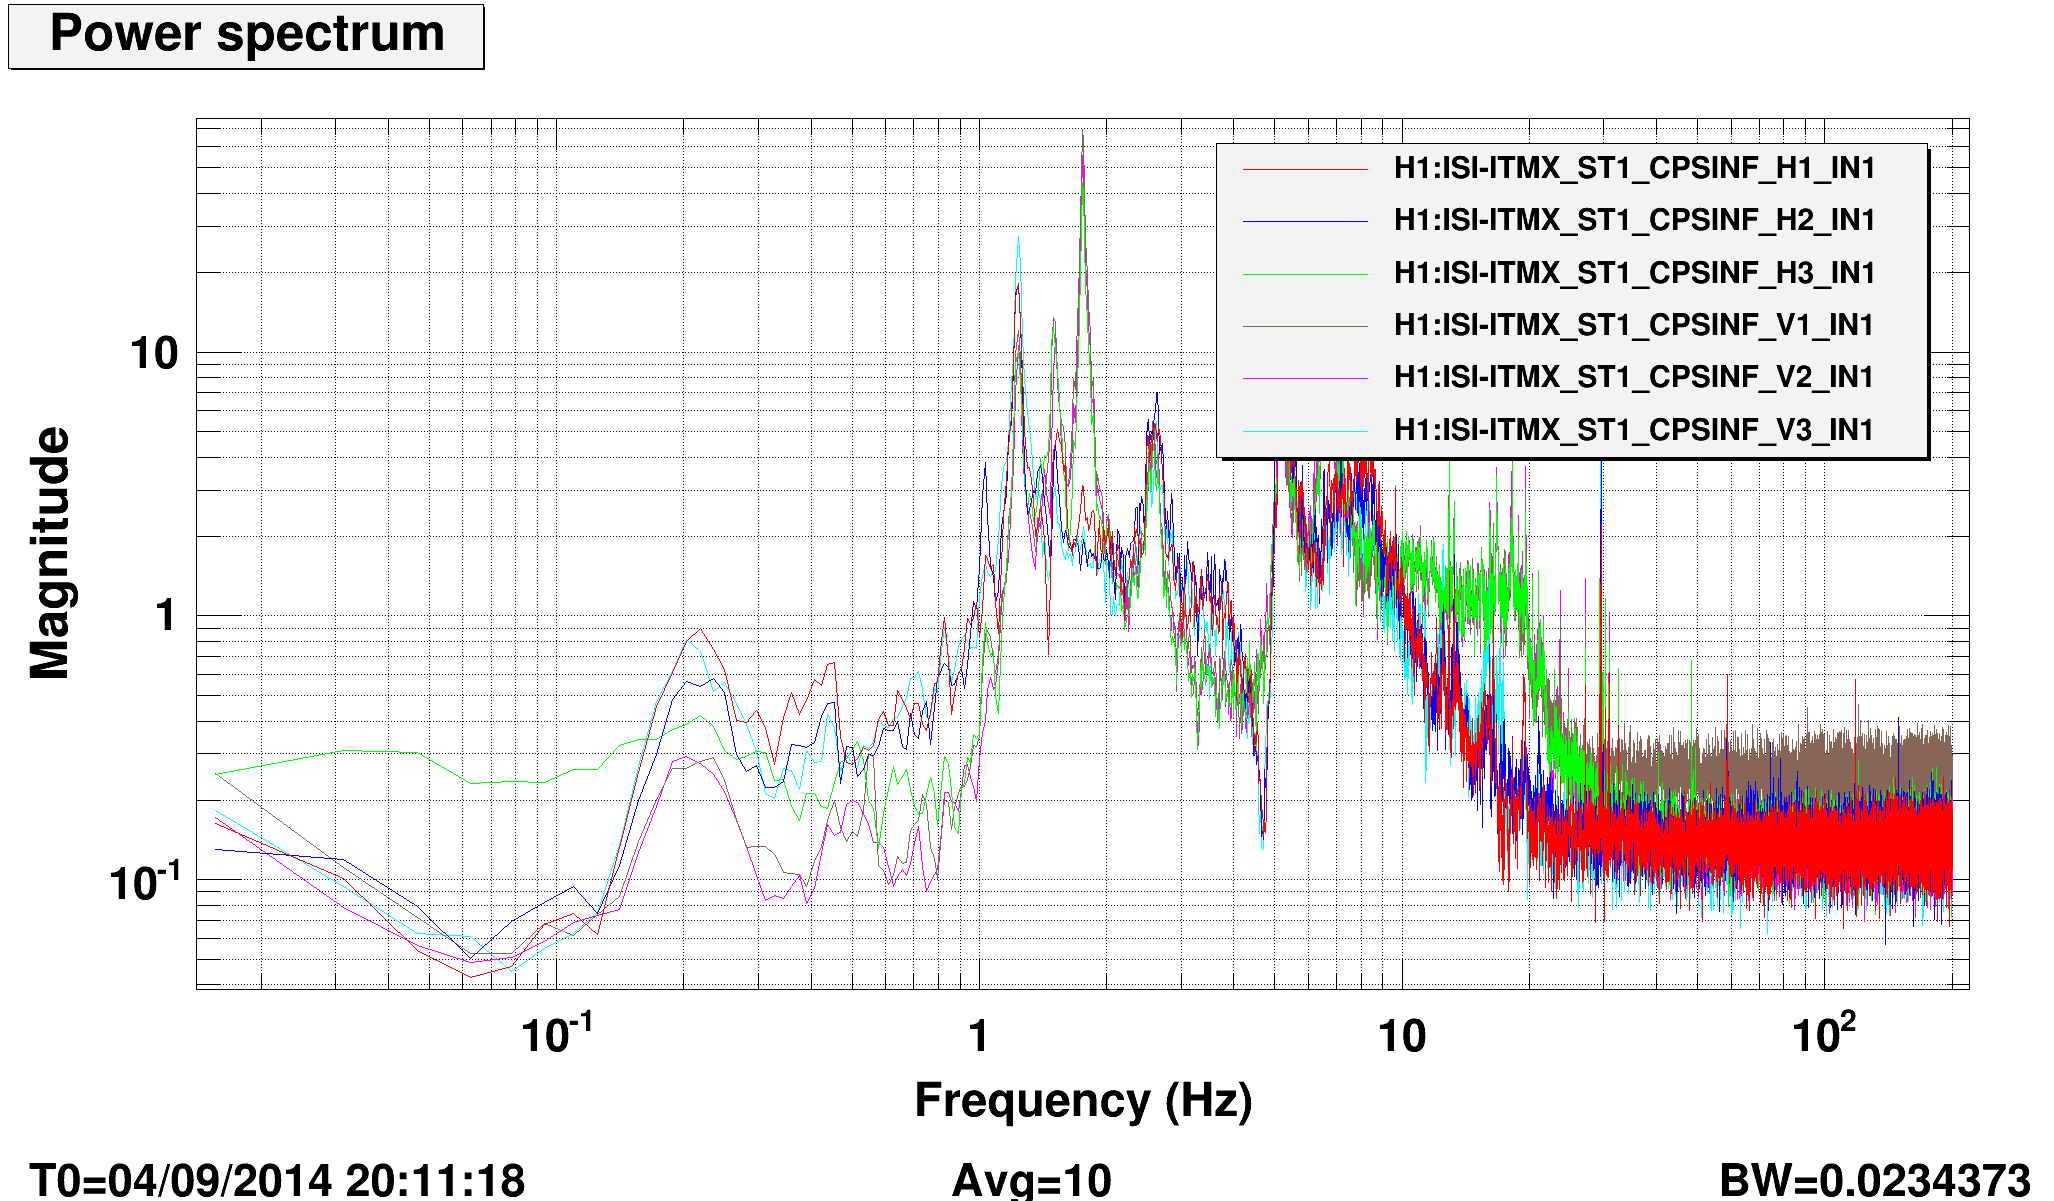
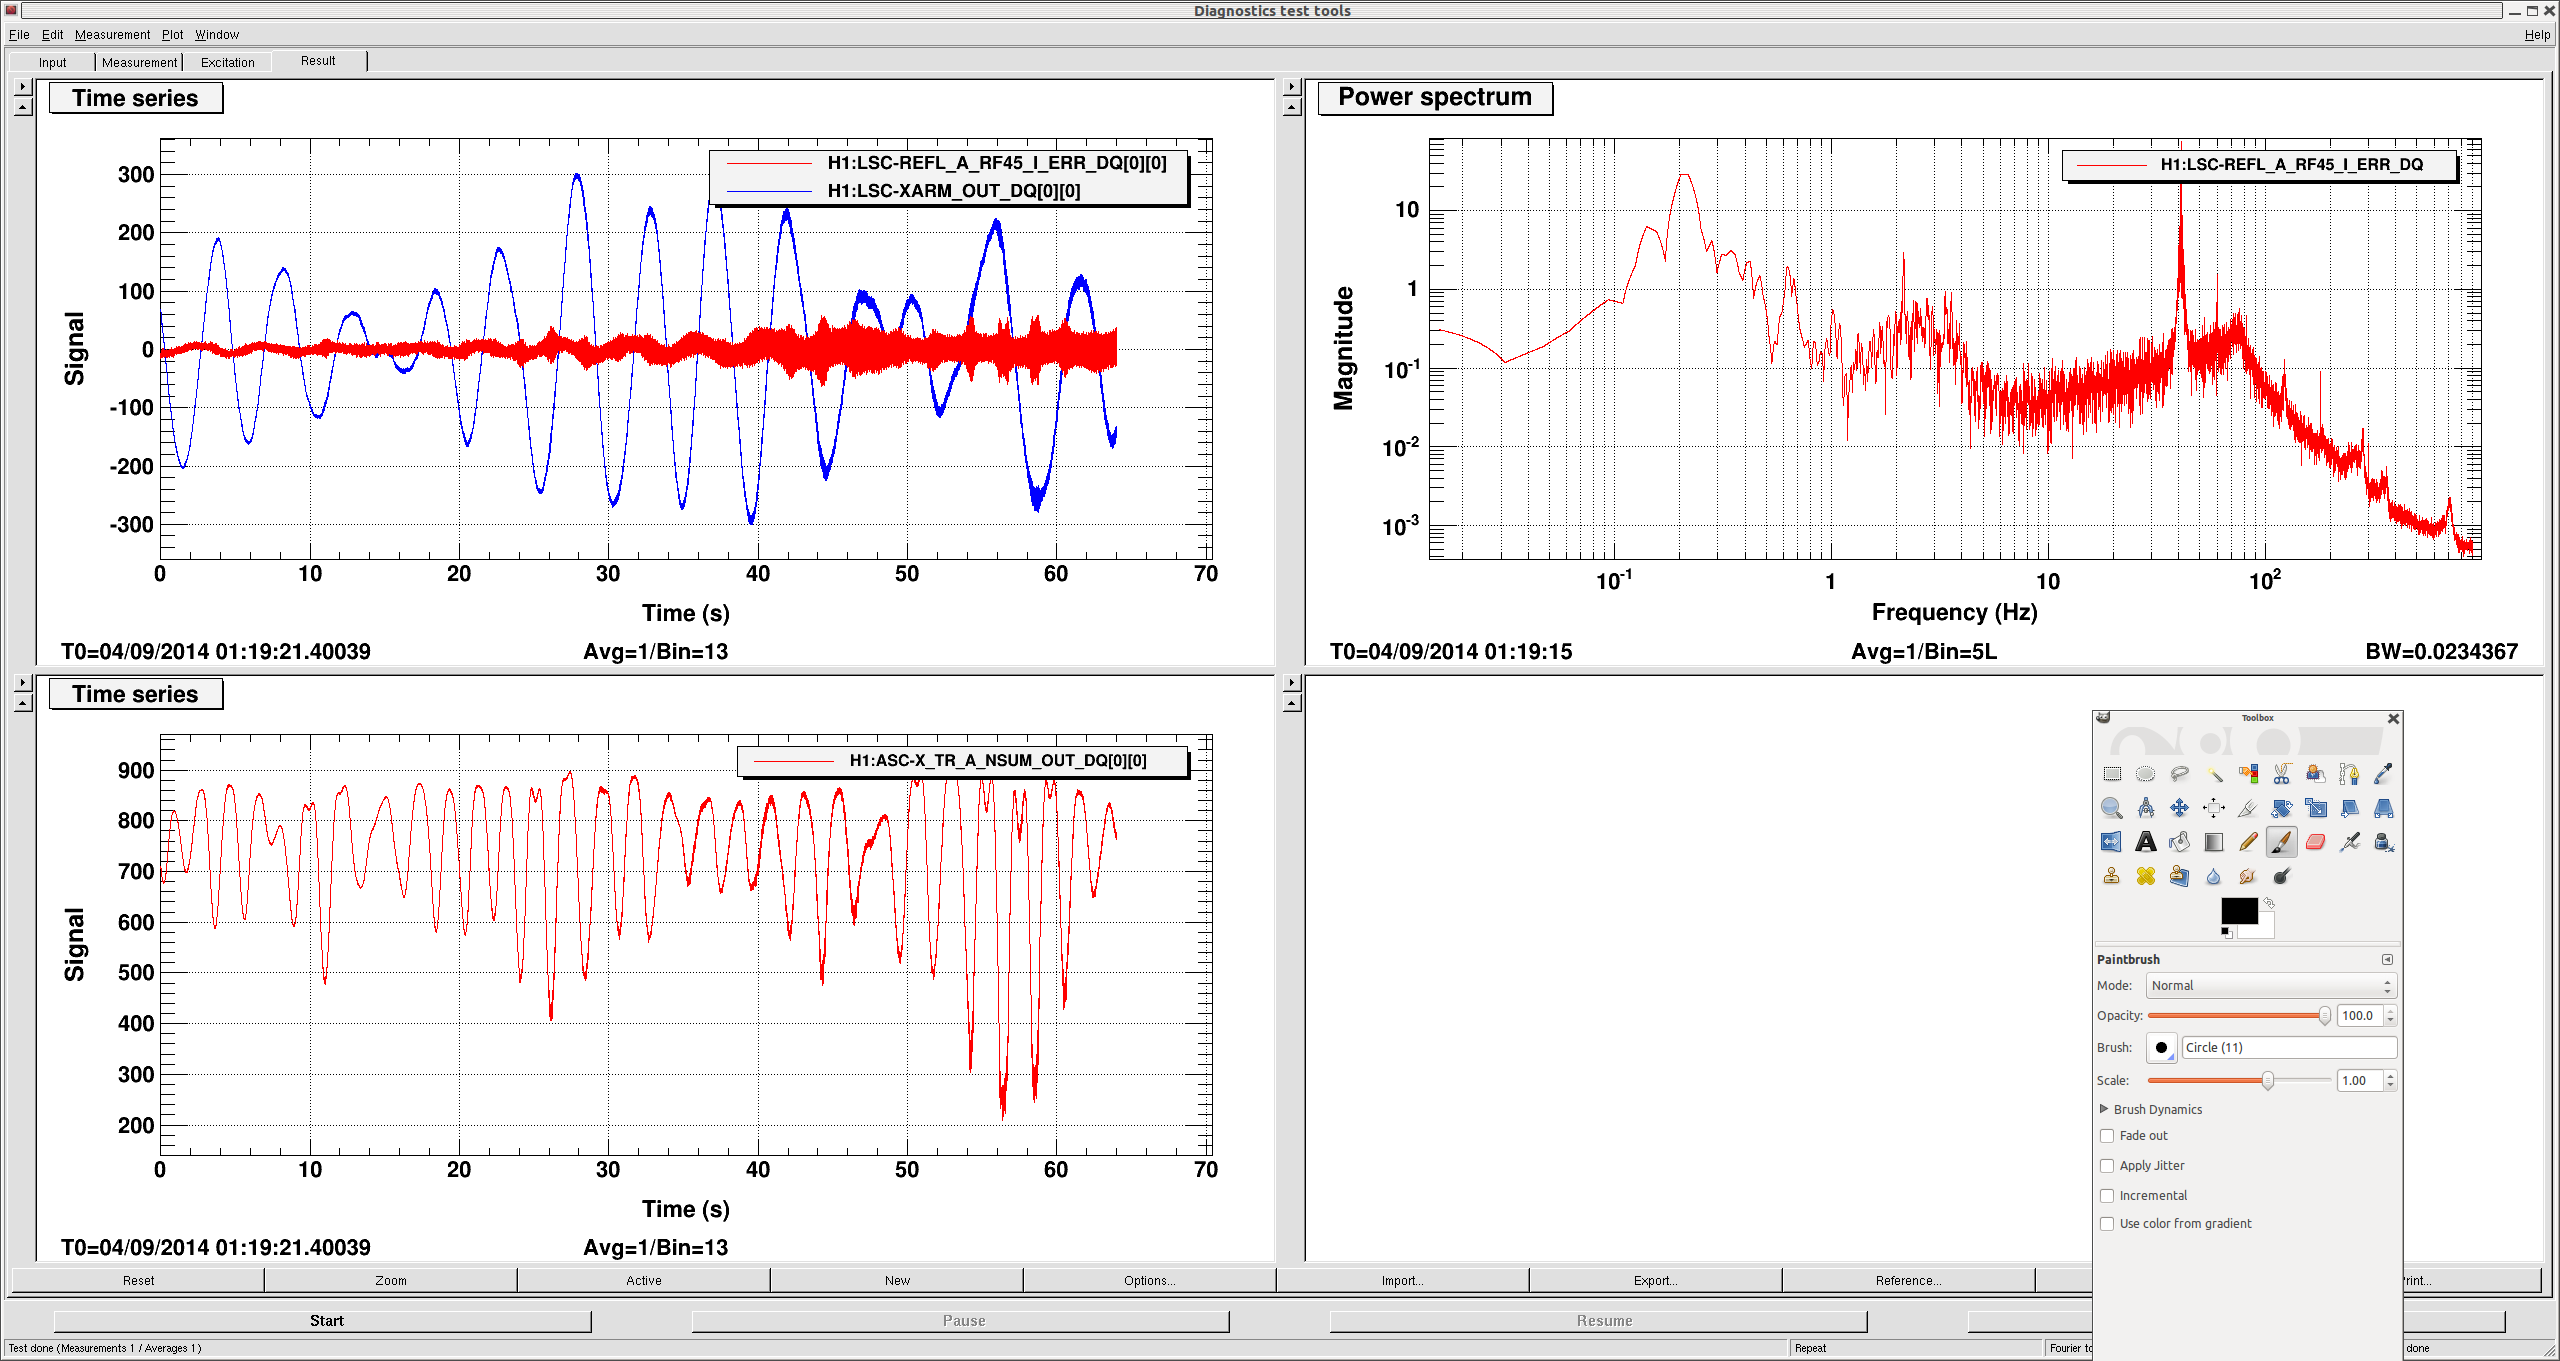
12:58 Jim to ITMx investigating issues with ISI
13:11 Karen done at EY
13:49 Gerardo to EX, replacing valve on purge air system
13:53 Bubba to LVEA to crane zamboni out
14:55 Jason realigned ITMy OpLev
15:10 Gerardo back from EX
15:10 Gerardo to LVEA west bay CR to FC ITM optic for charging measurements
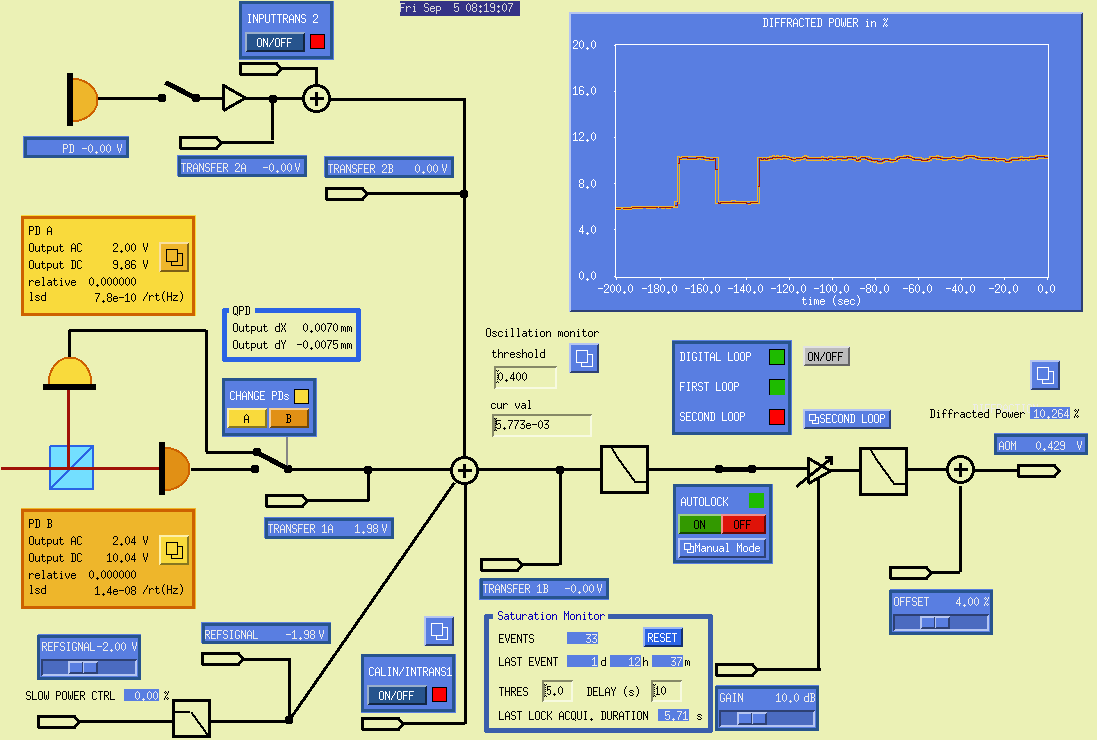
