All tip-tilts (OM1, OM2 and OM3) are free, BOSEMs centered, and the eddy current damper anywhere from 0.8 to 1.5mm. Some of the tiny tiny set screws to fix the back eddy current dampers are completely loose, so they were tightened.
M4 (the mirror behind OM1) needed to be pushed about 2" toward east from nominal position specified in https://dcc.ligo.org/D1000342, it was physically impossible to go very close to tip tilt because the cable connector sticks out to the back. Not a big deal.
M8 (a small mirror by OM3 to receive OMC REFL light) was flipped, as the AR coating and the peek ring were facing the OMC.
I found that LLO did the OMC REFL beam diverters (BDV2) better than what was reported yesterday by me, i.e. their peek washers are behind the black glass, though the aluminum will cut the beam first when the thing engages. I decided that their way is better than pontentially burning PEEK and making a nice PEEK coating on OMC, and copied their configuration.
Total of four V beam dumps were installed, one behind OM2, one by the OMCS, one on the QPD sled to receive reflection of BDV2 and one near OM1 to receive reflection of BDV1. The latter 2 are not on the drawing and I simply copied the way it was done at LLO.
All BOSEMs including the tip tilts and OMCS were centered, and they're working fine.
All segments of all QPDs (OMC REFL sled, AS_C QPD, and OMC QPDs) and WFS DC responded to flash light.
Both of the OMC DC PDs responded to flash light.
Cables are tied down to the ISI surface using peek cable clamps.
The only thing remaining is the electronics testing of picomotors, OMC PZD, and beam diverters.
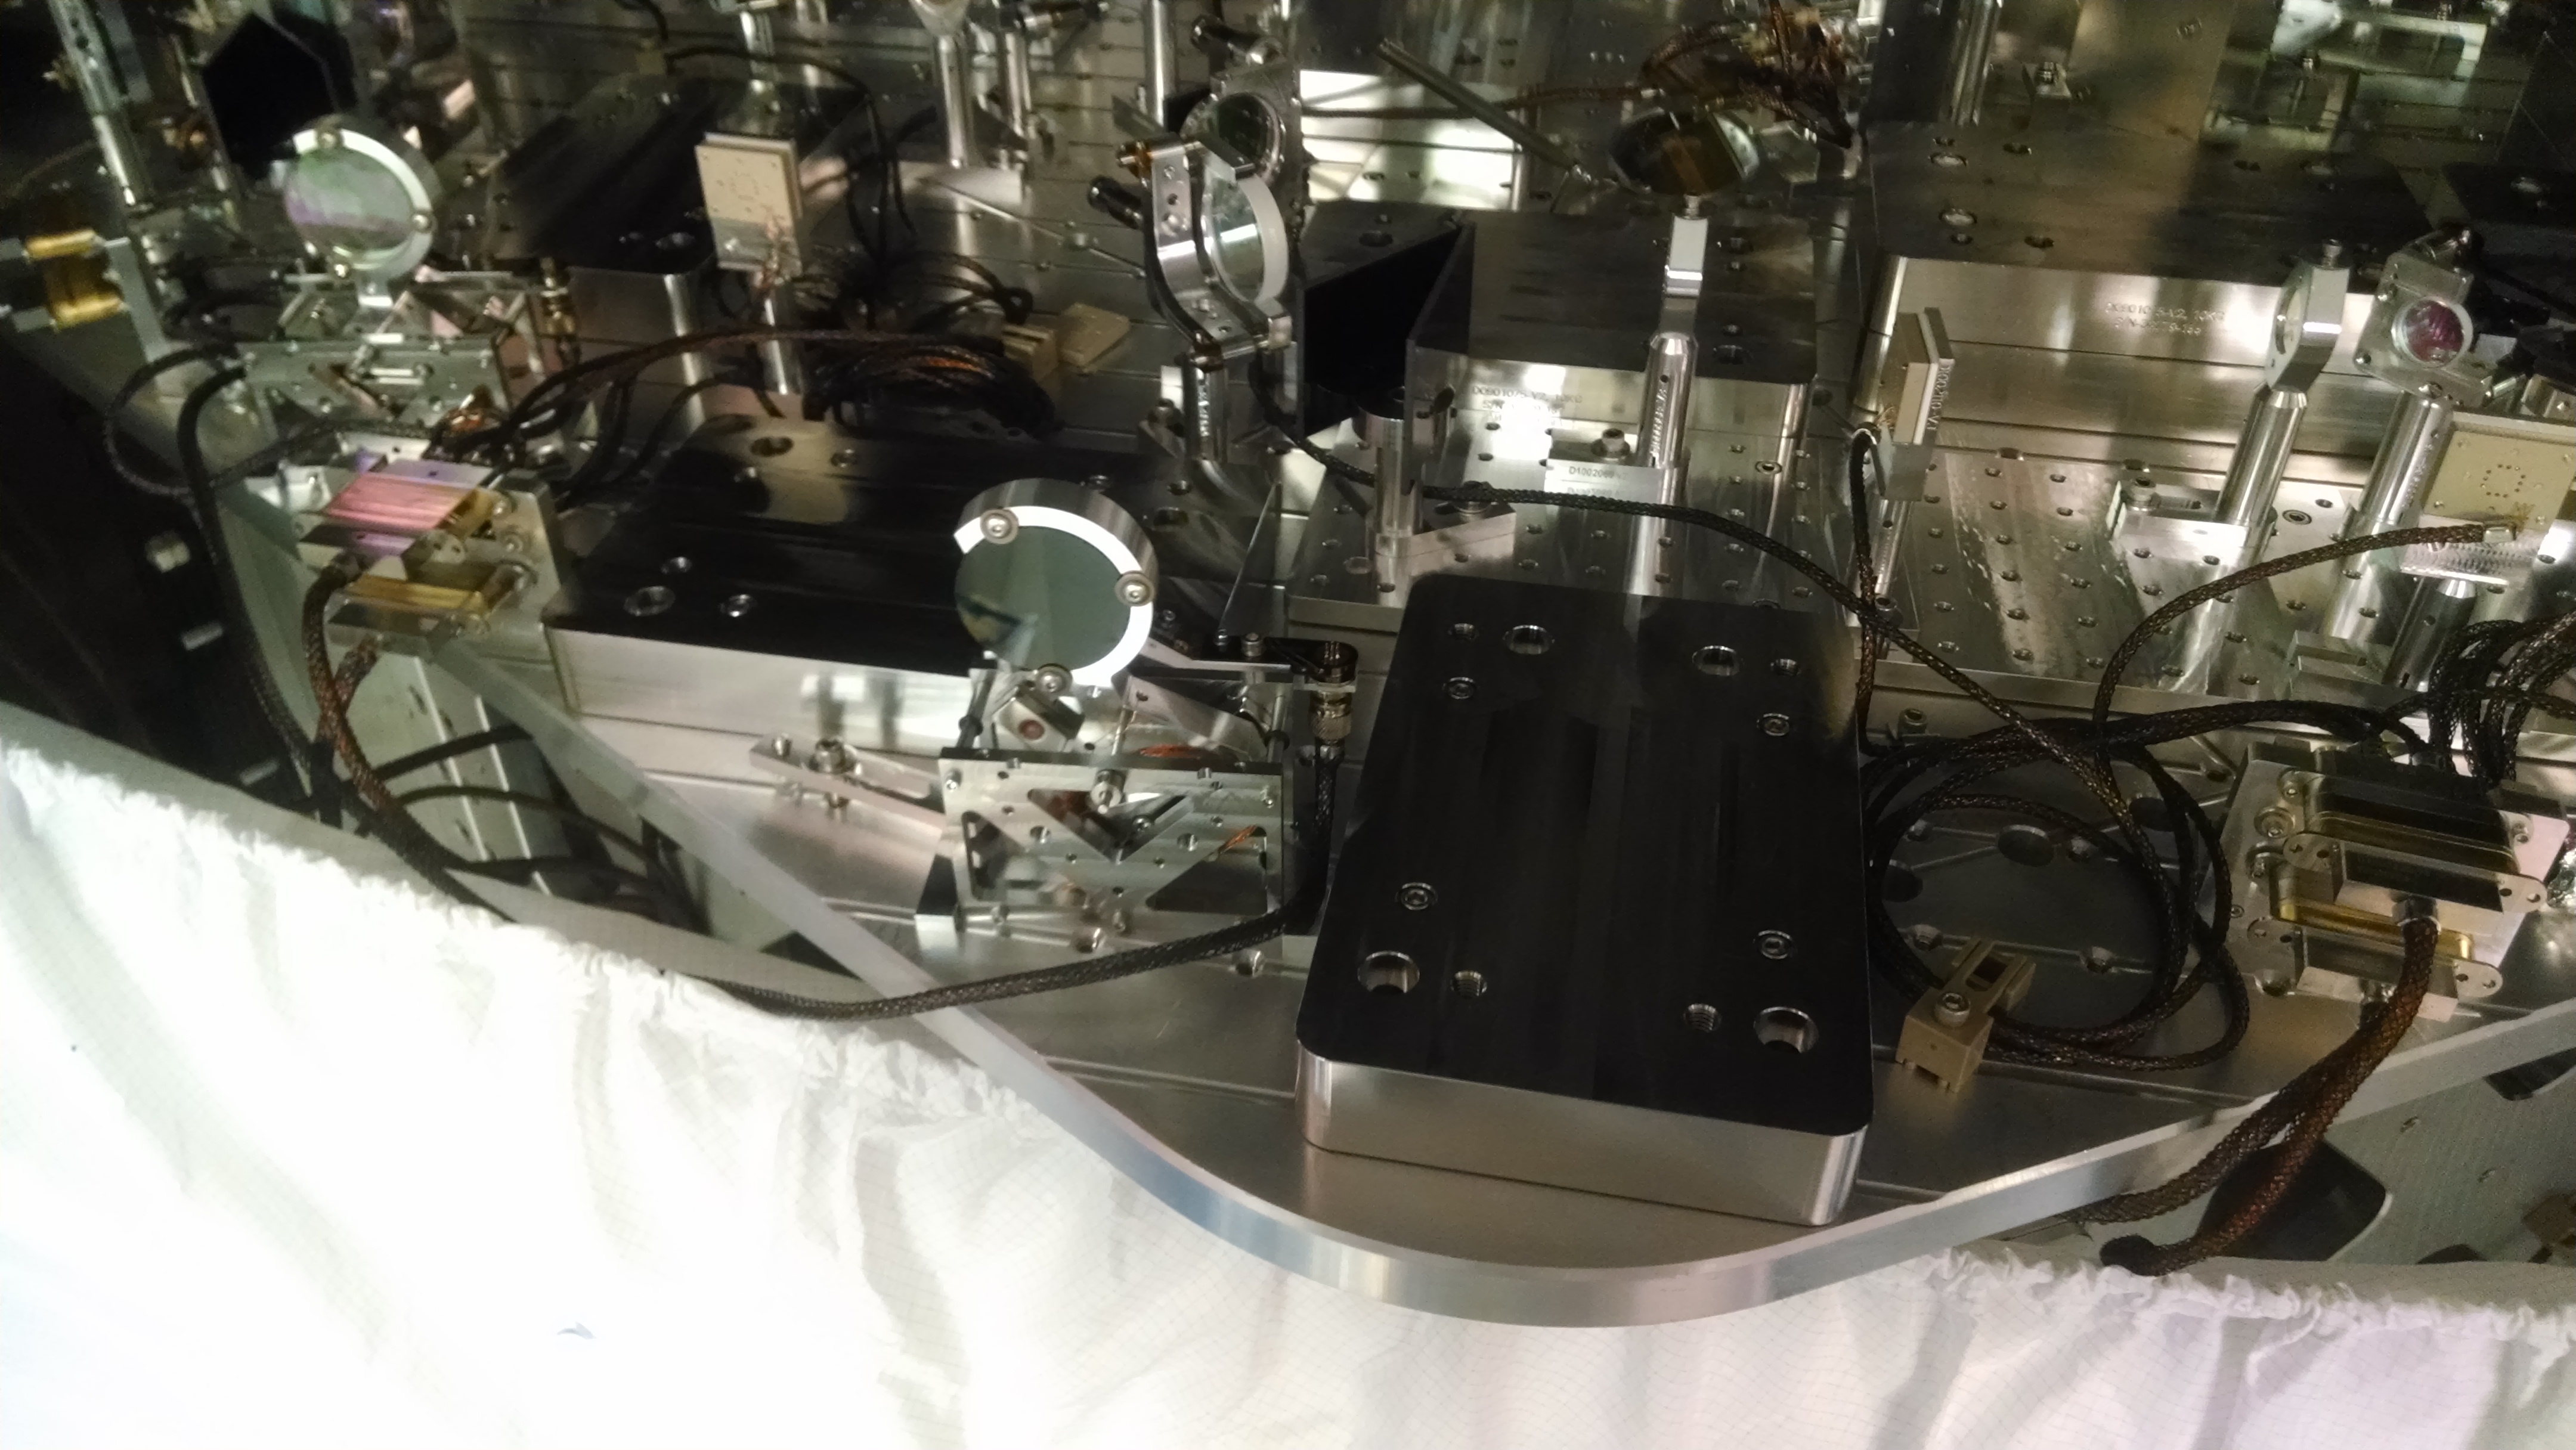
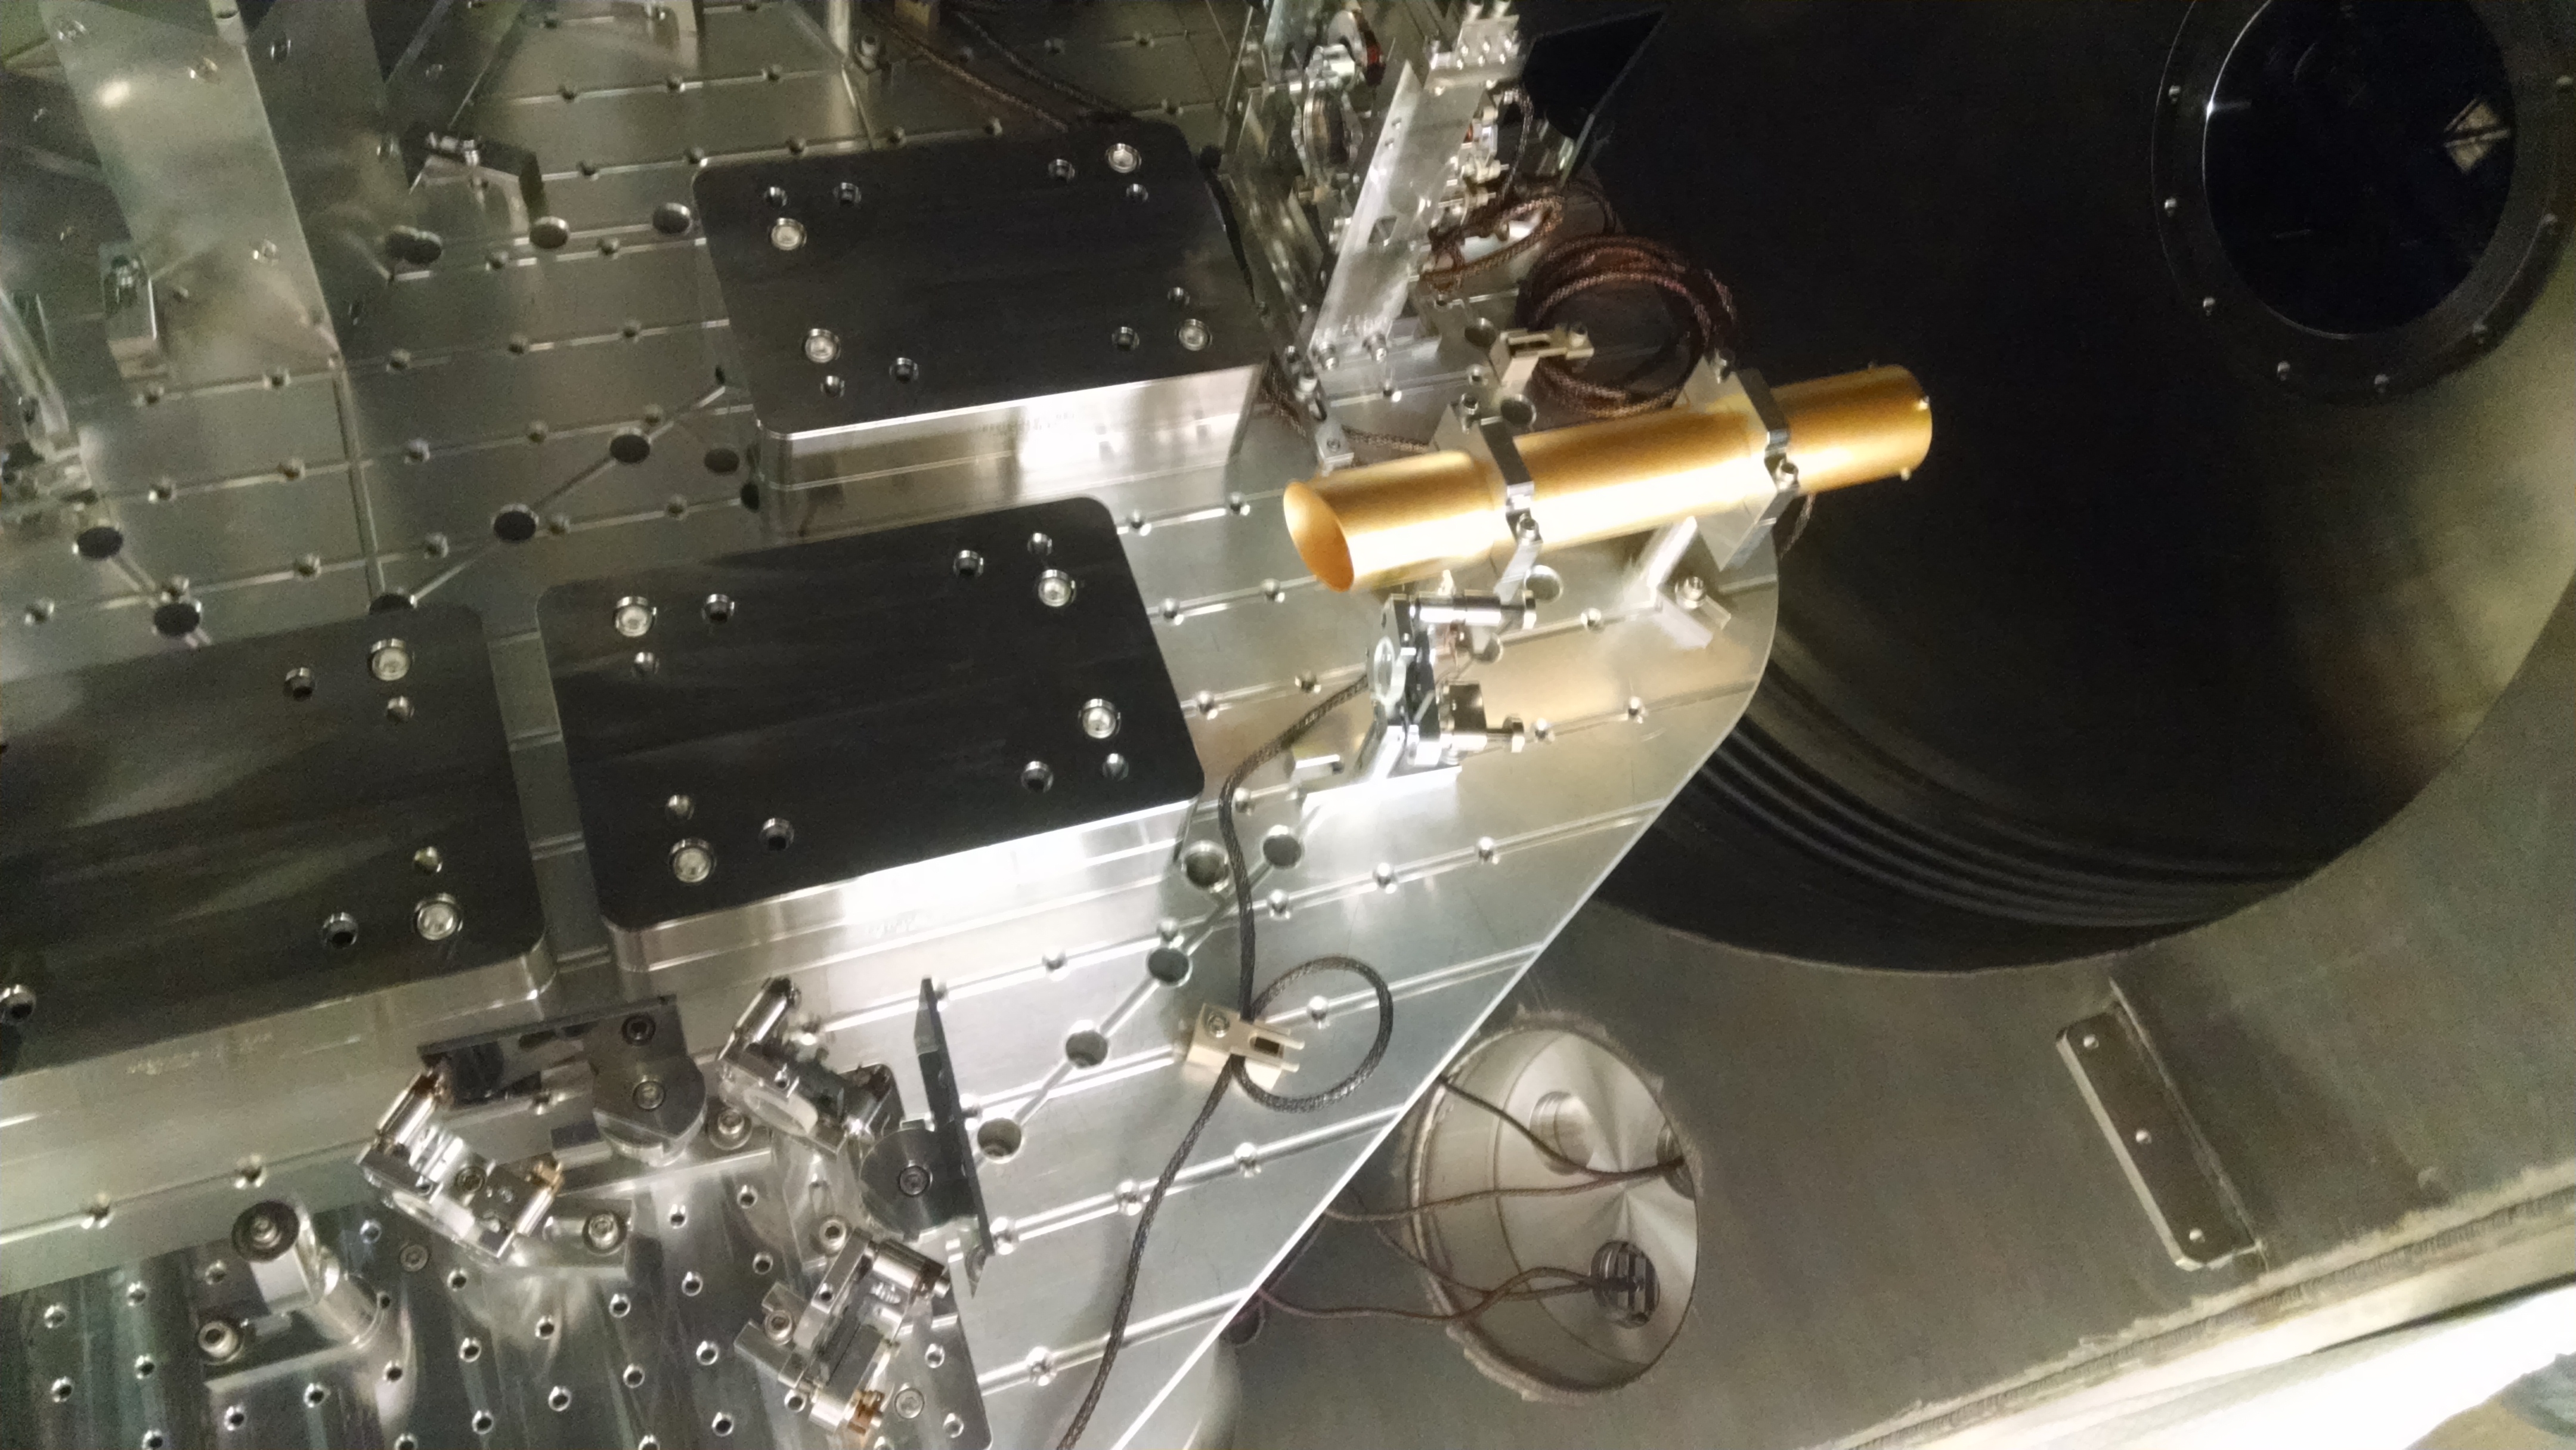
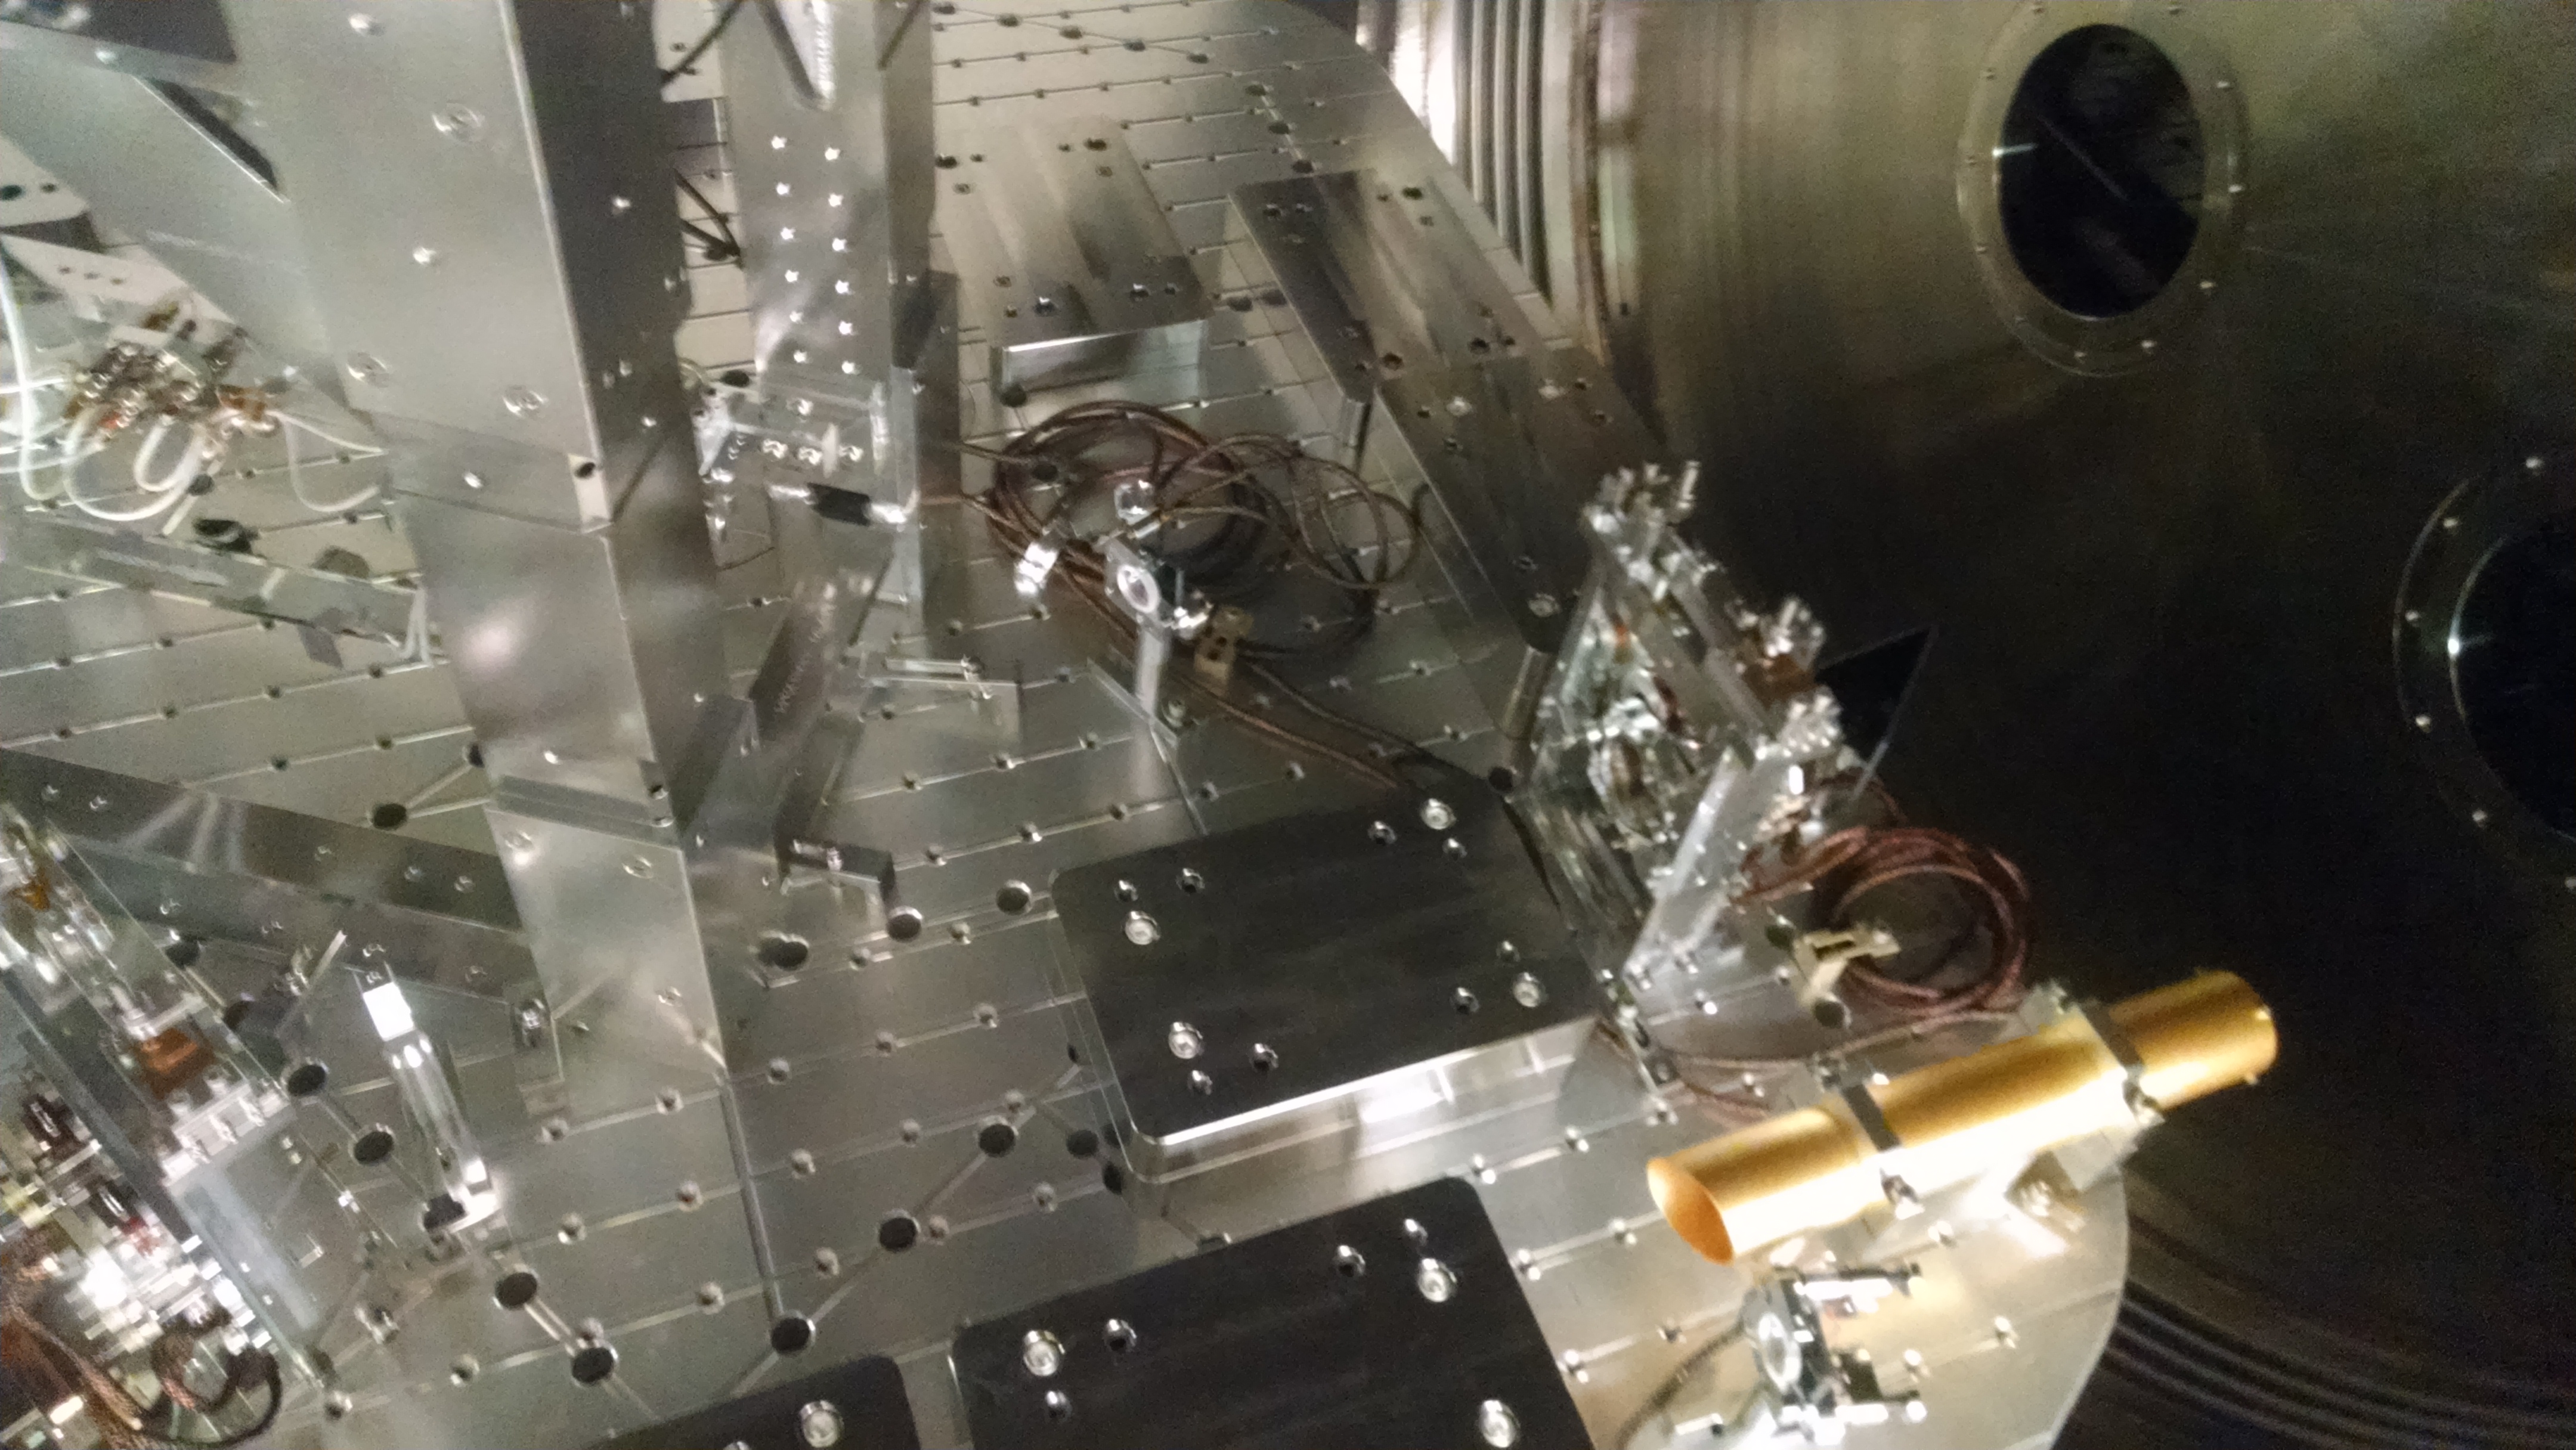
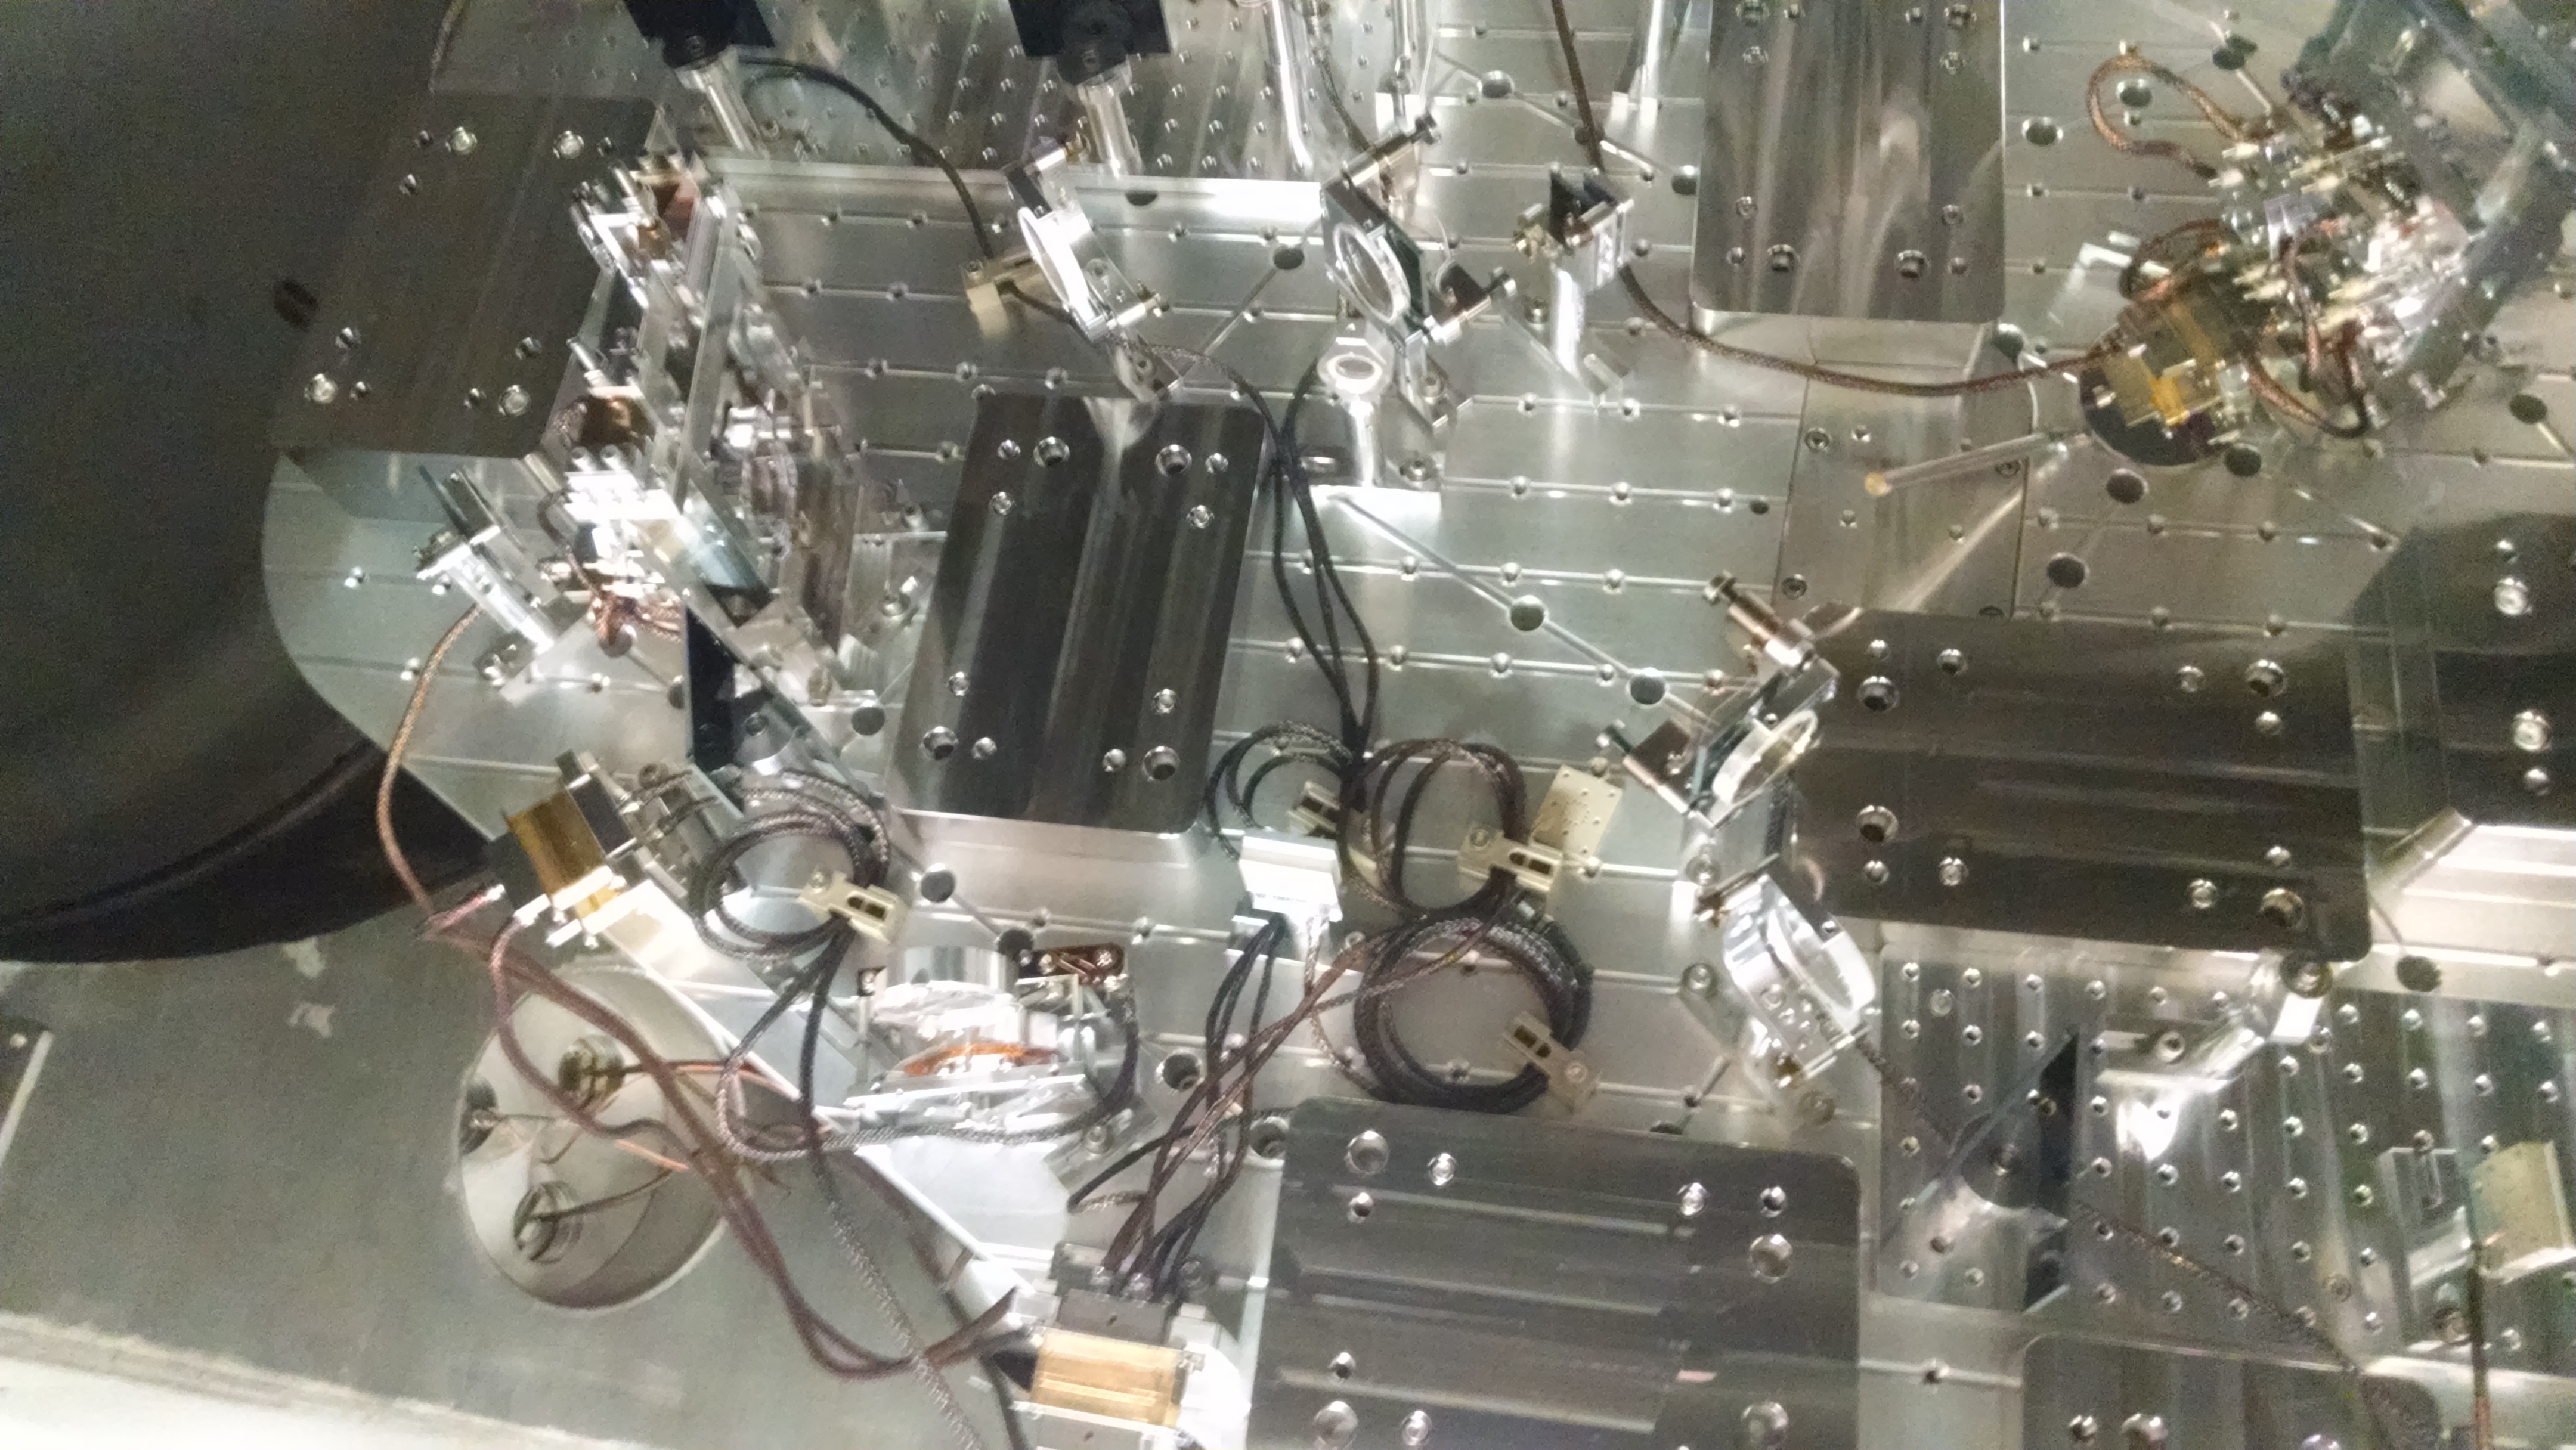
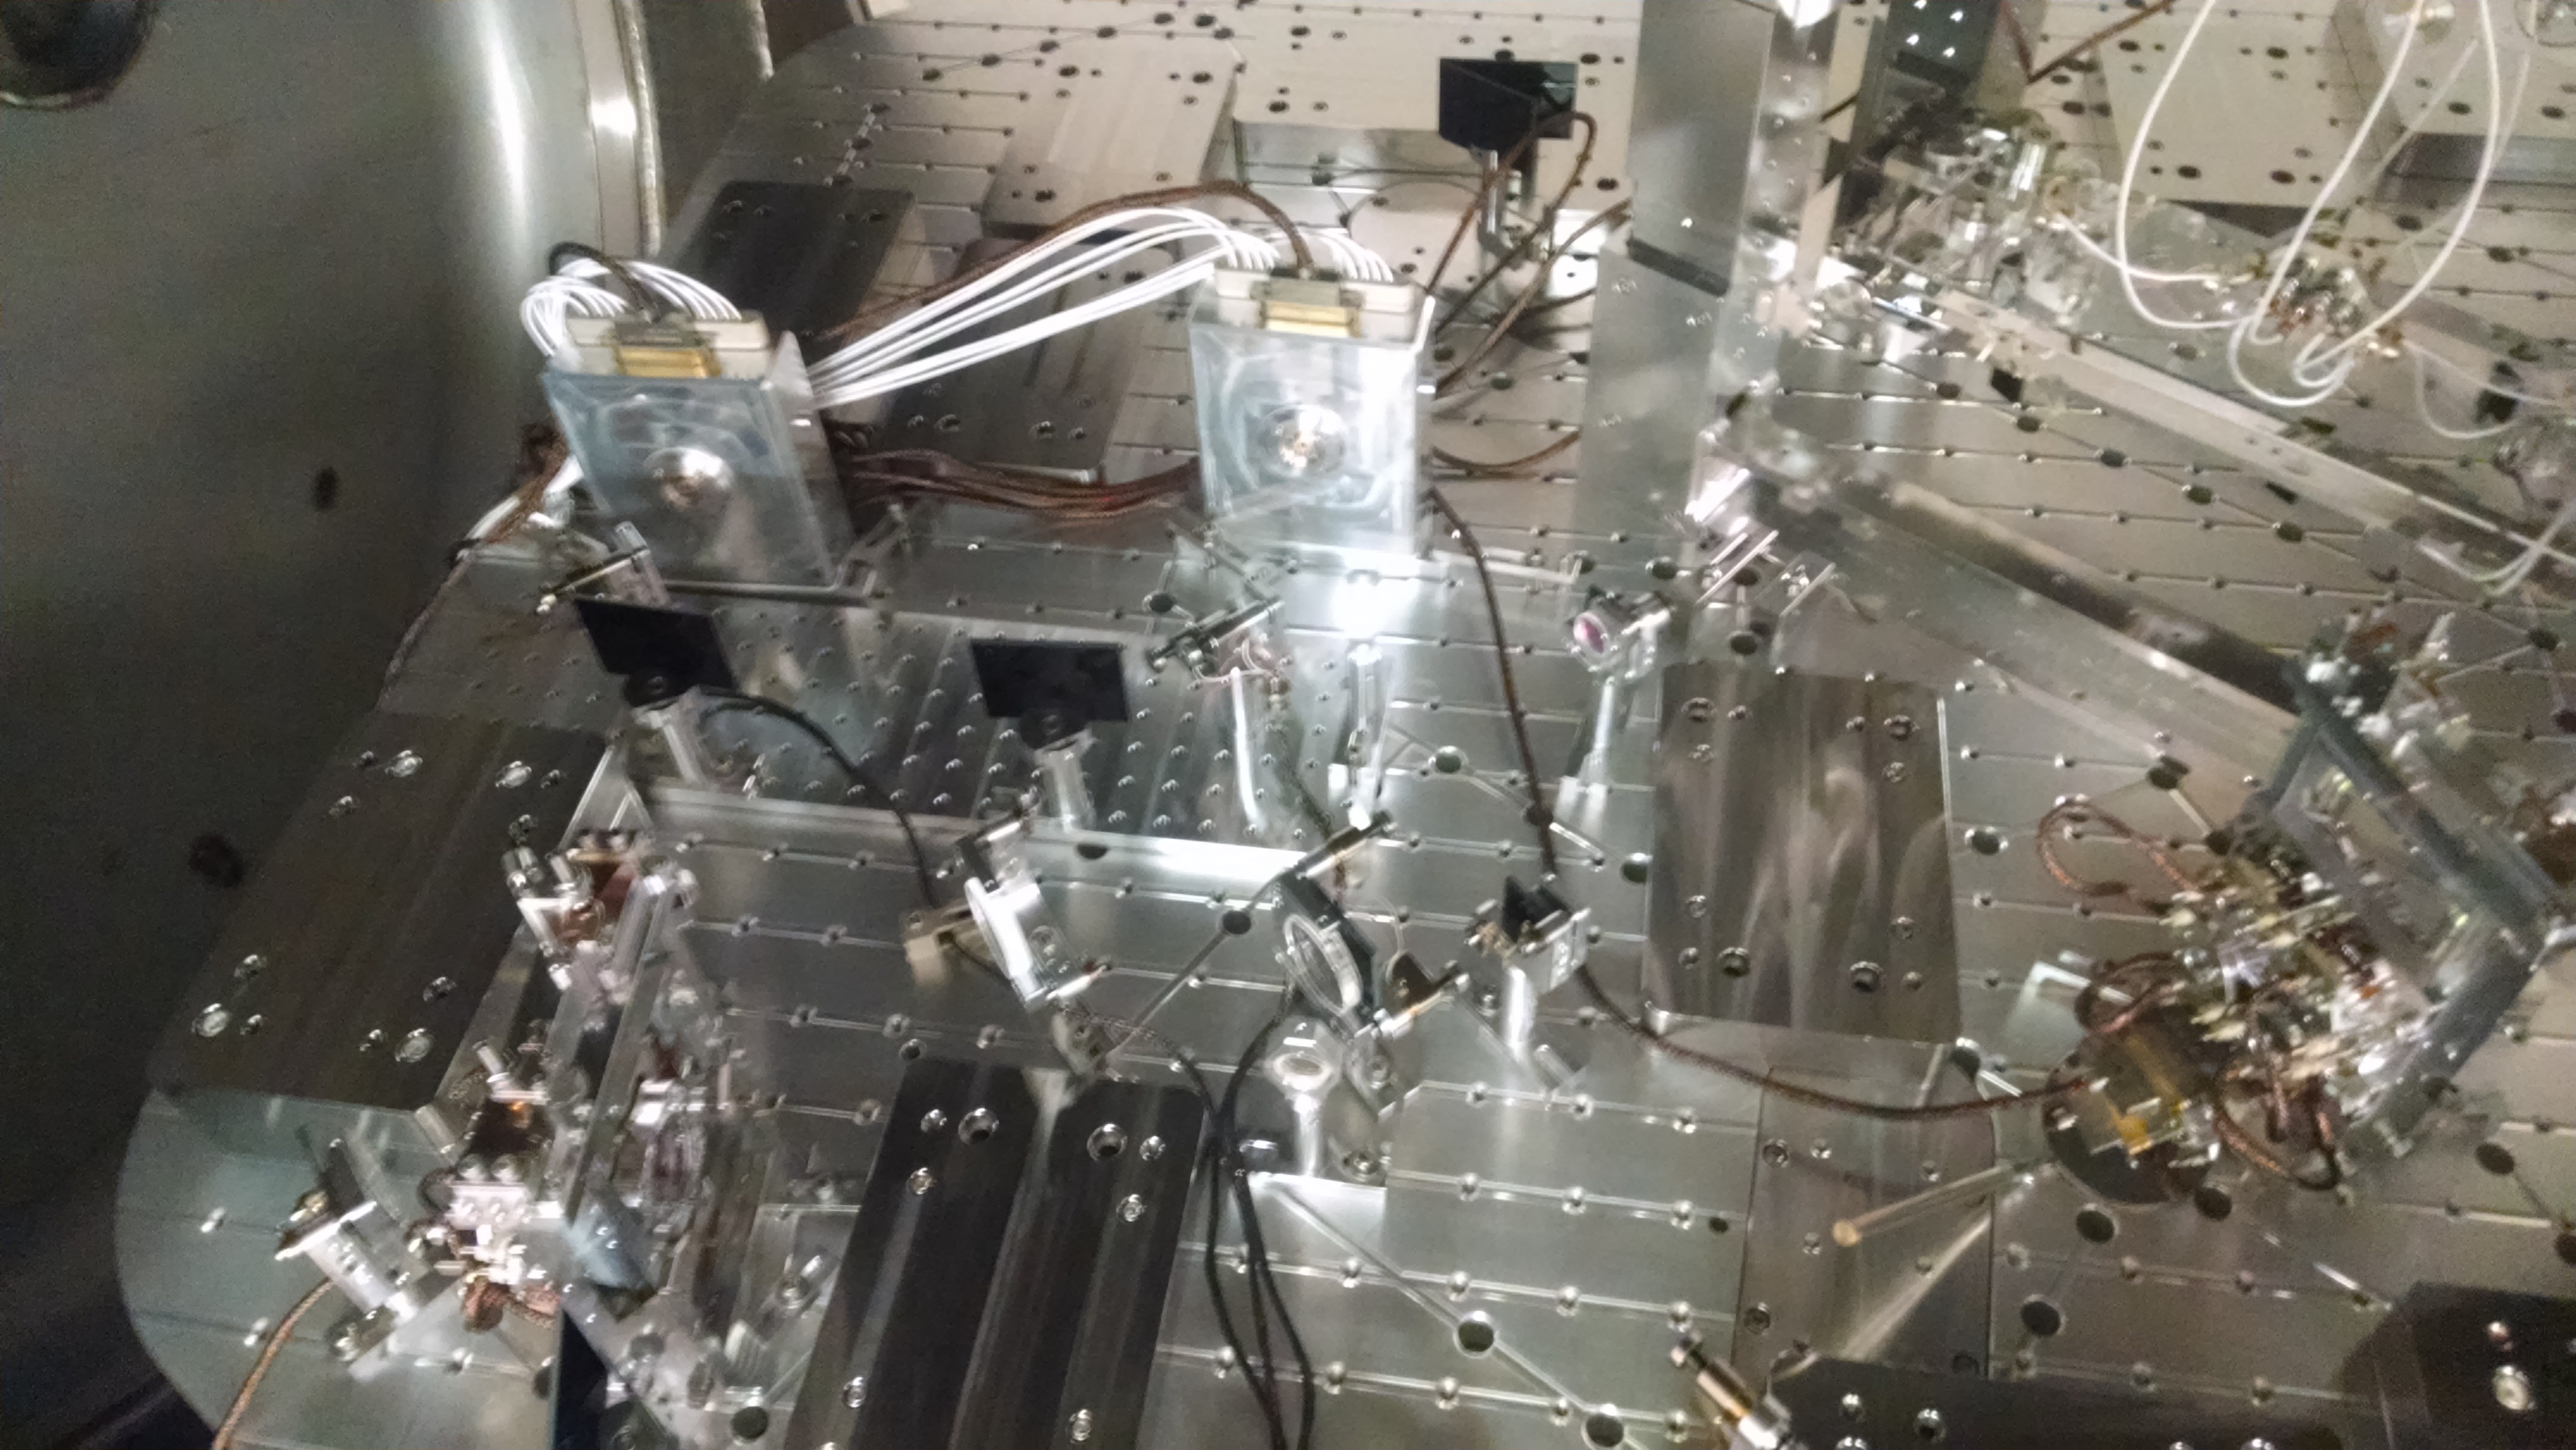
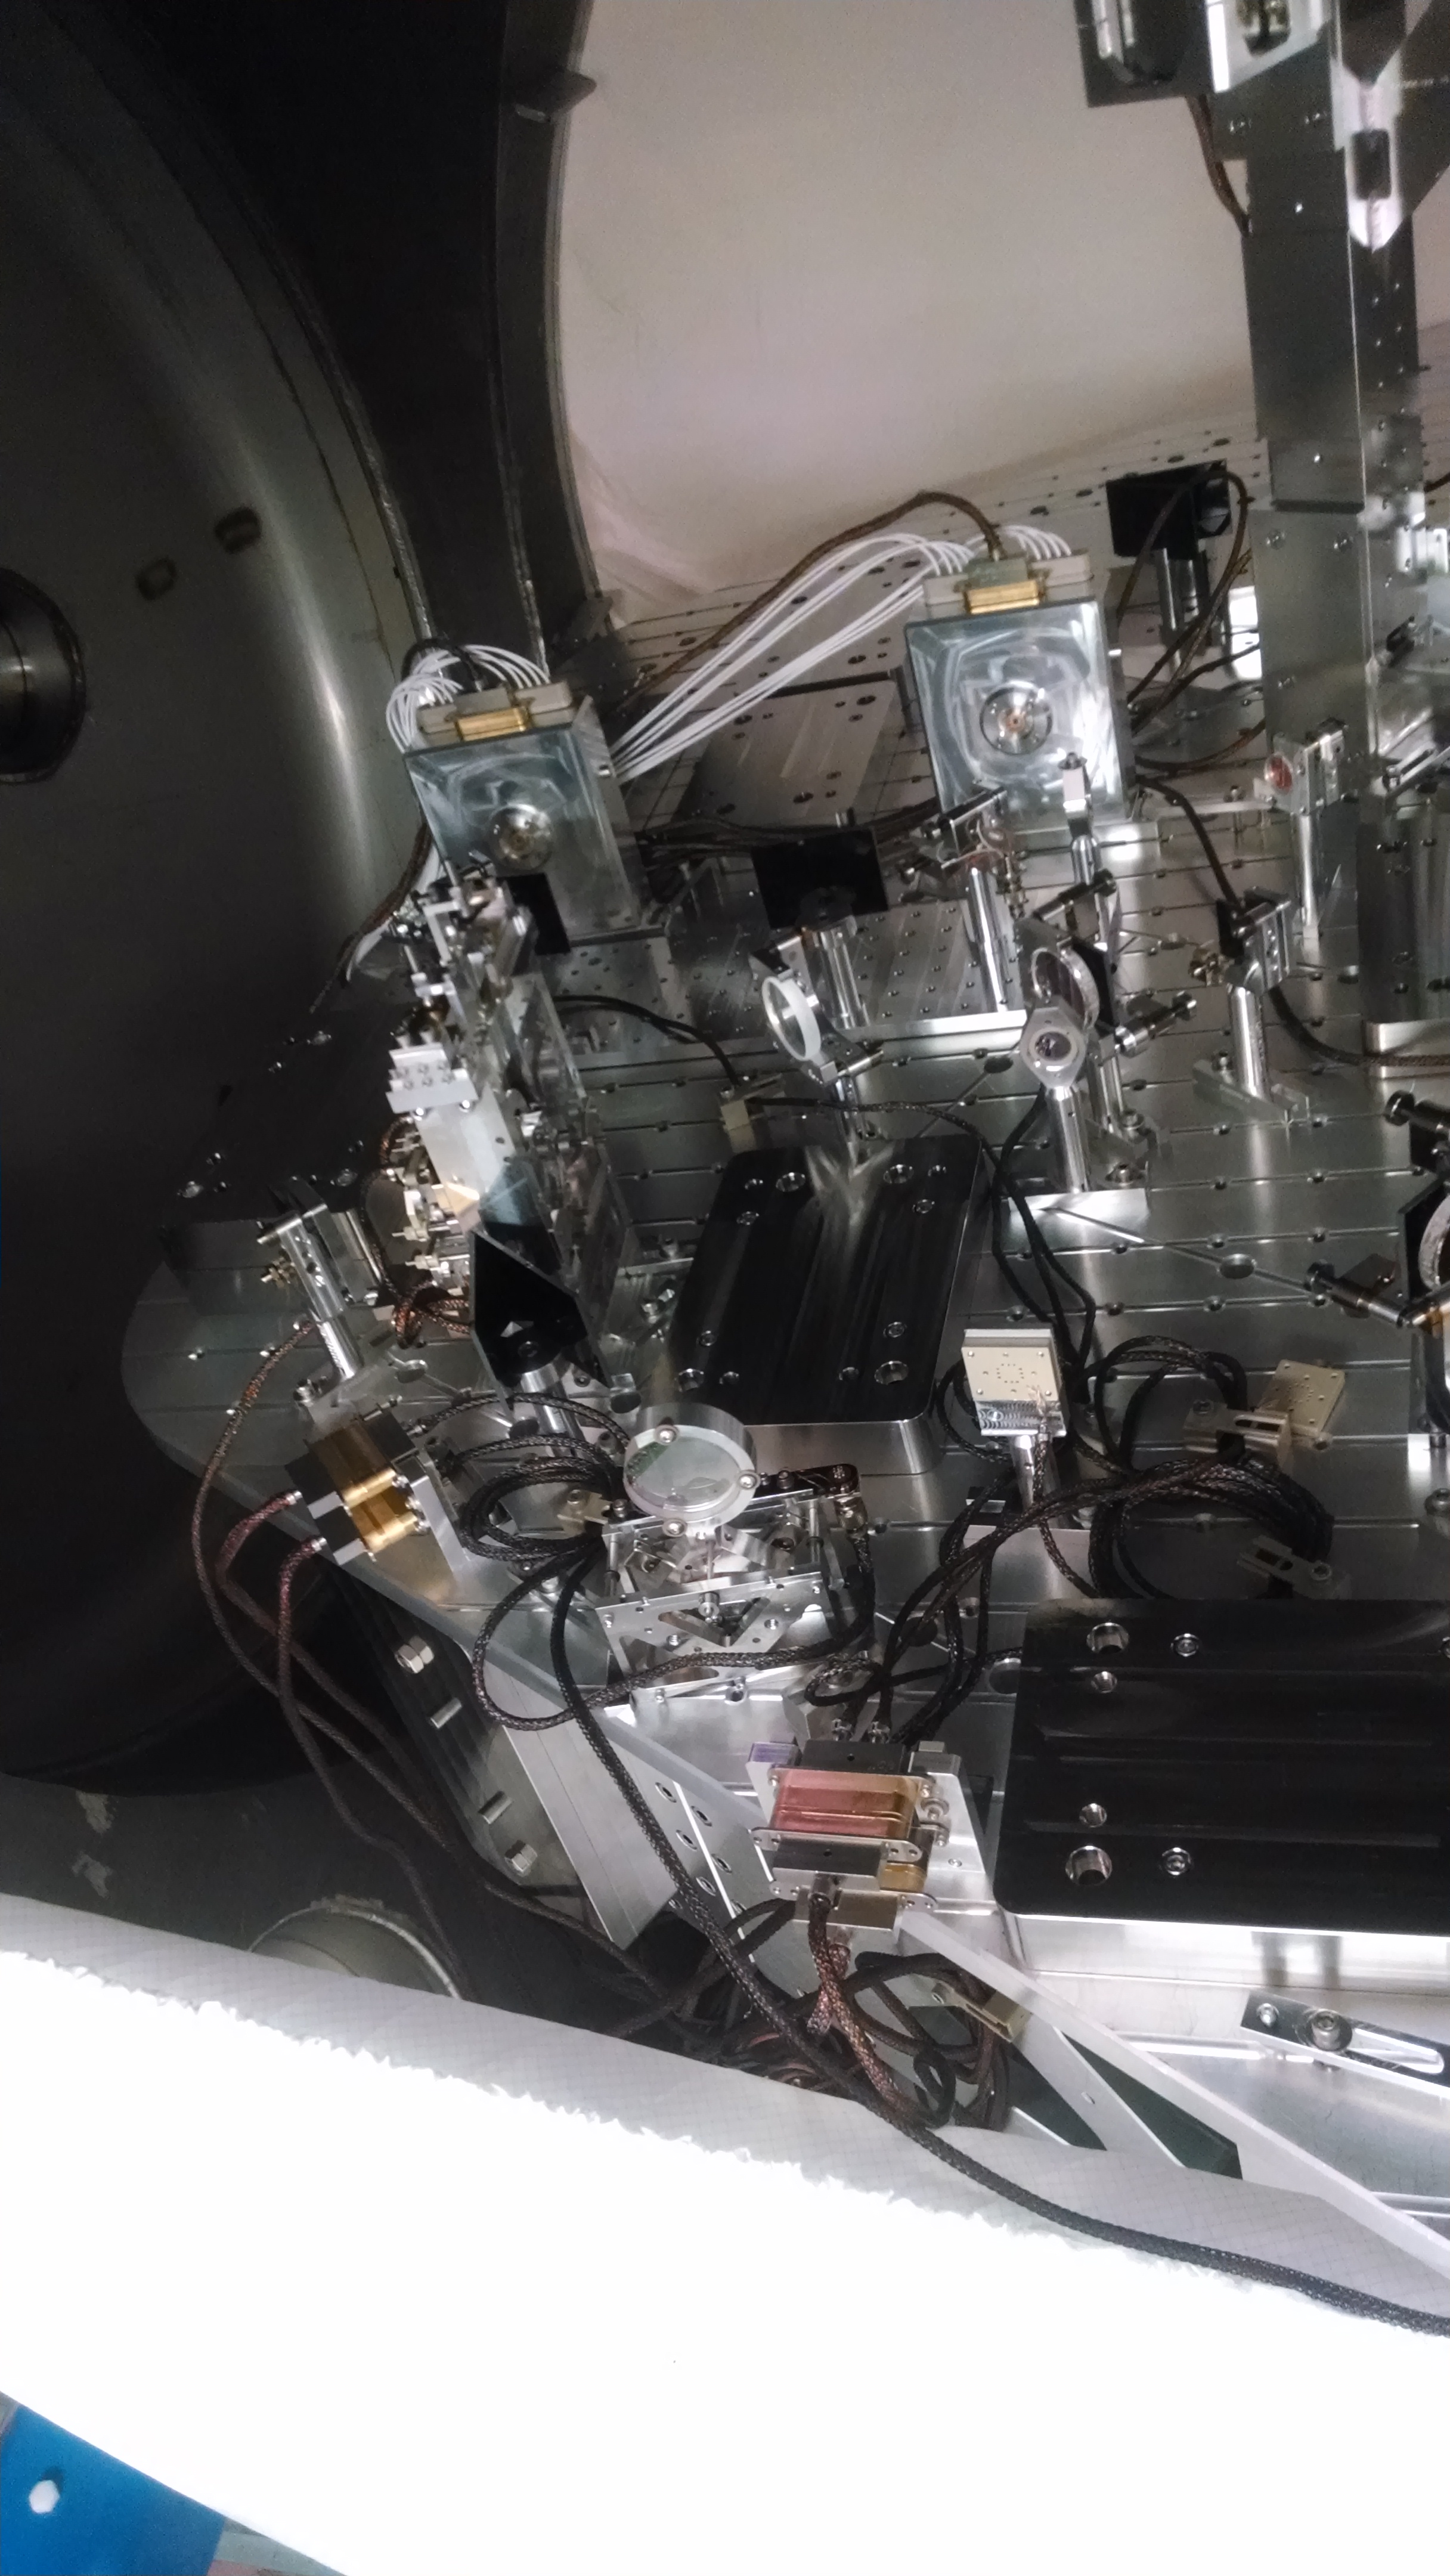
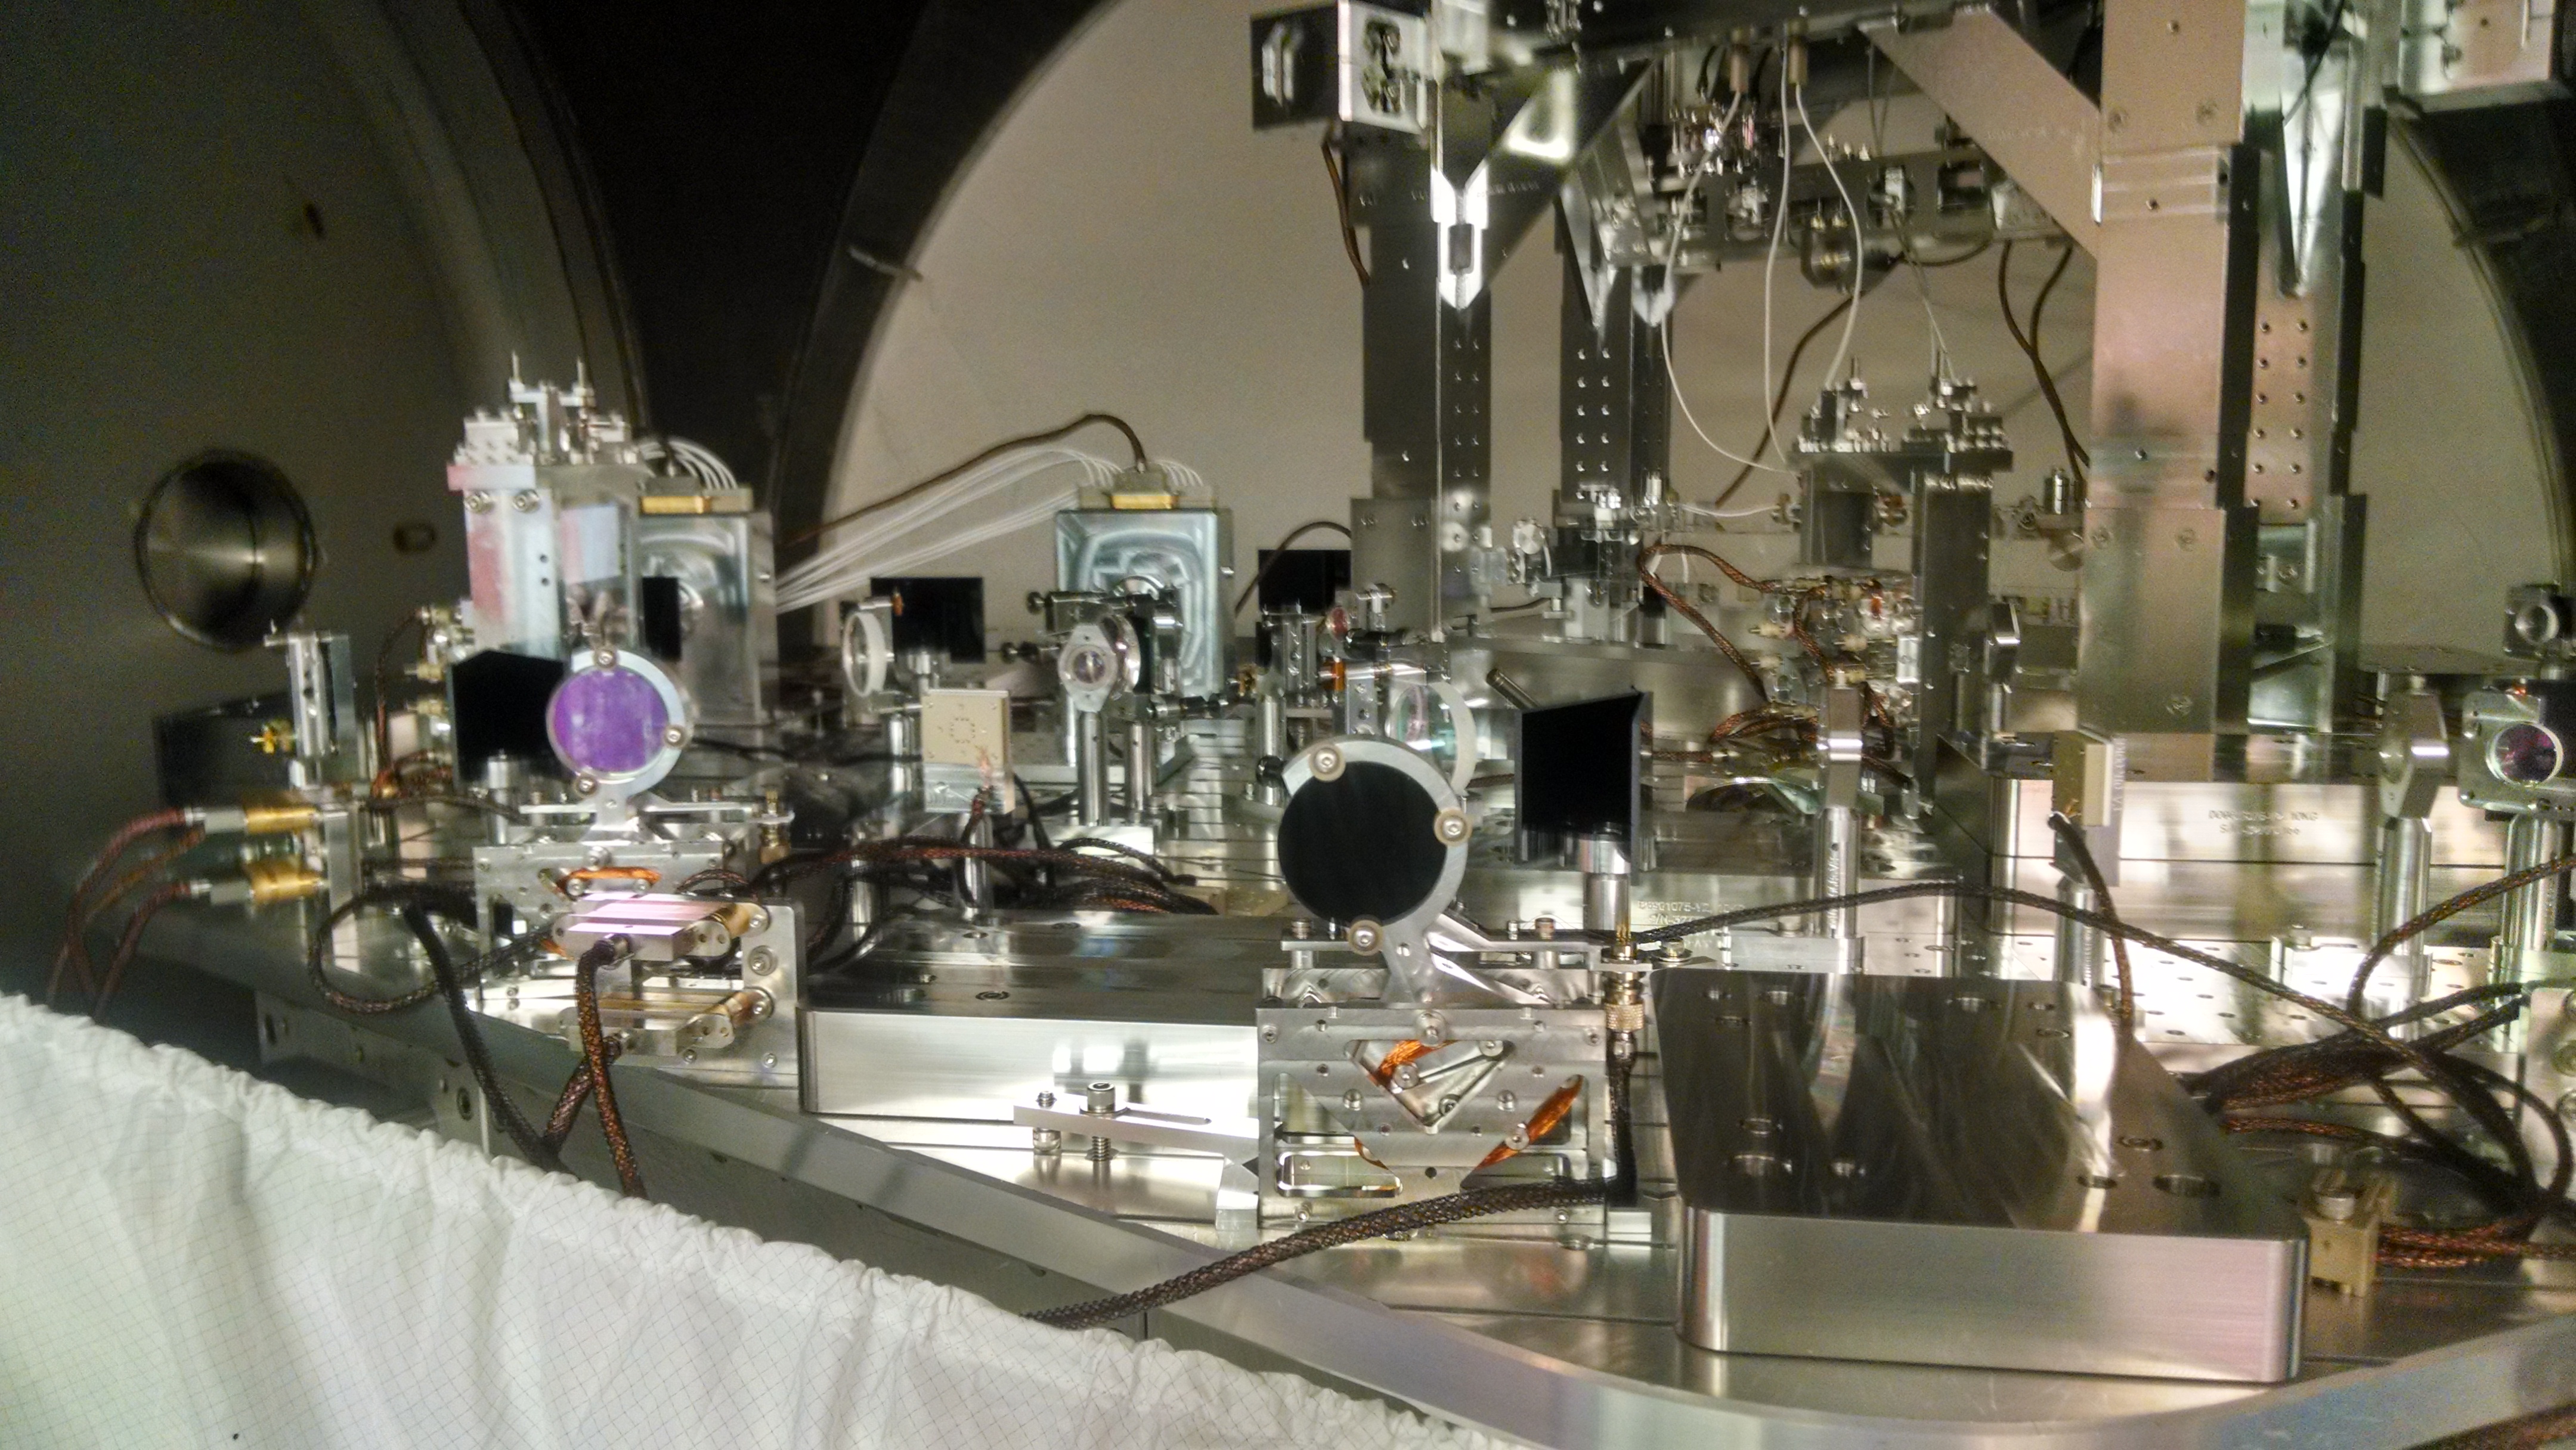
I took some pictures (but I'll let Corey take a better ones later).