Fabrice and I did more testing on the HAM4 guardian today. I've been lacking in posting, so I bit of recap. Last week we started testing the ISI_HAMX guardian code on the HAM4 ISI:
USERAPPS/isi/common/guardian/ISI_HAM4.py
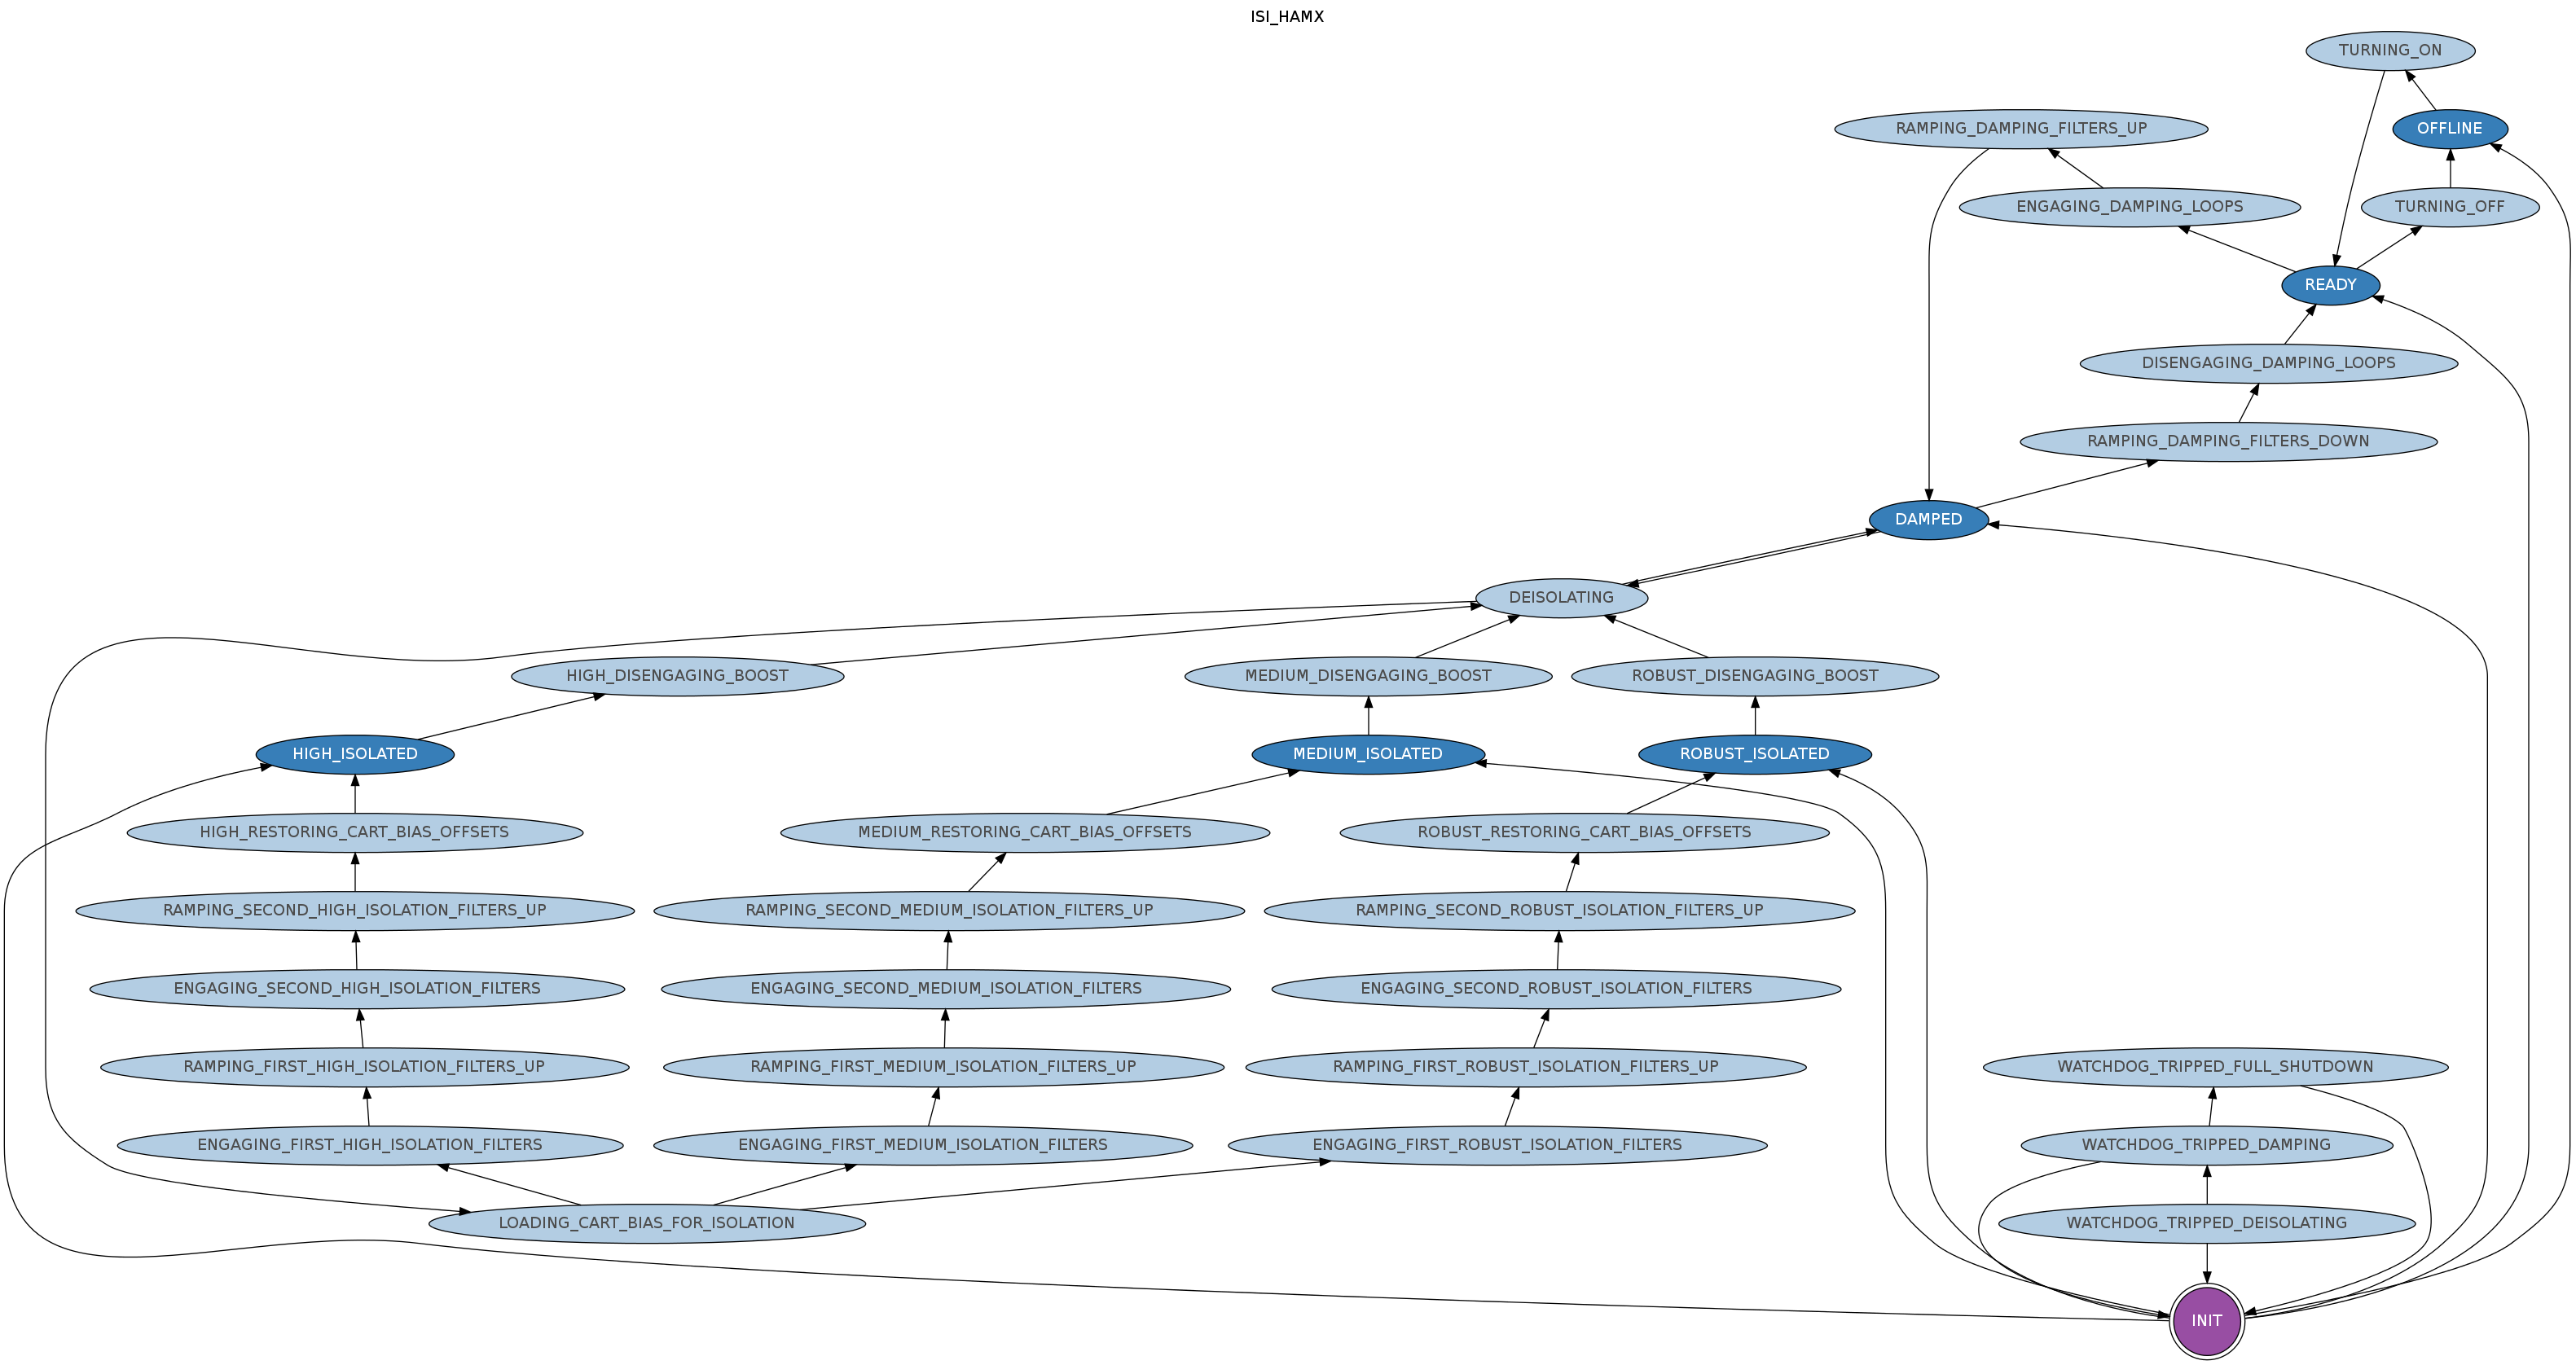
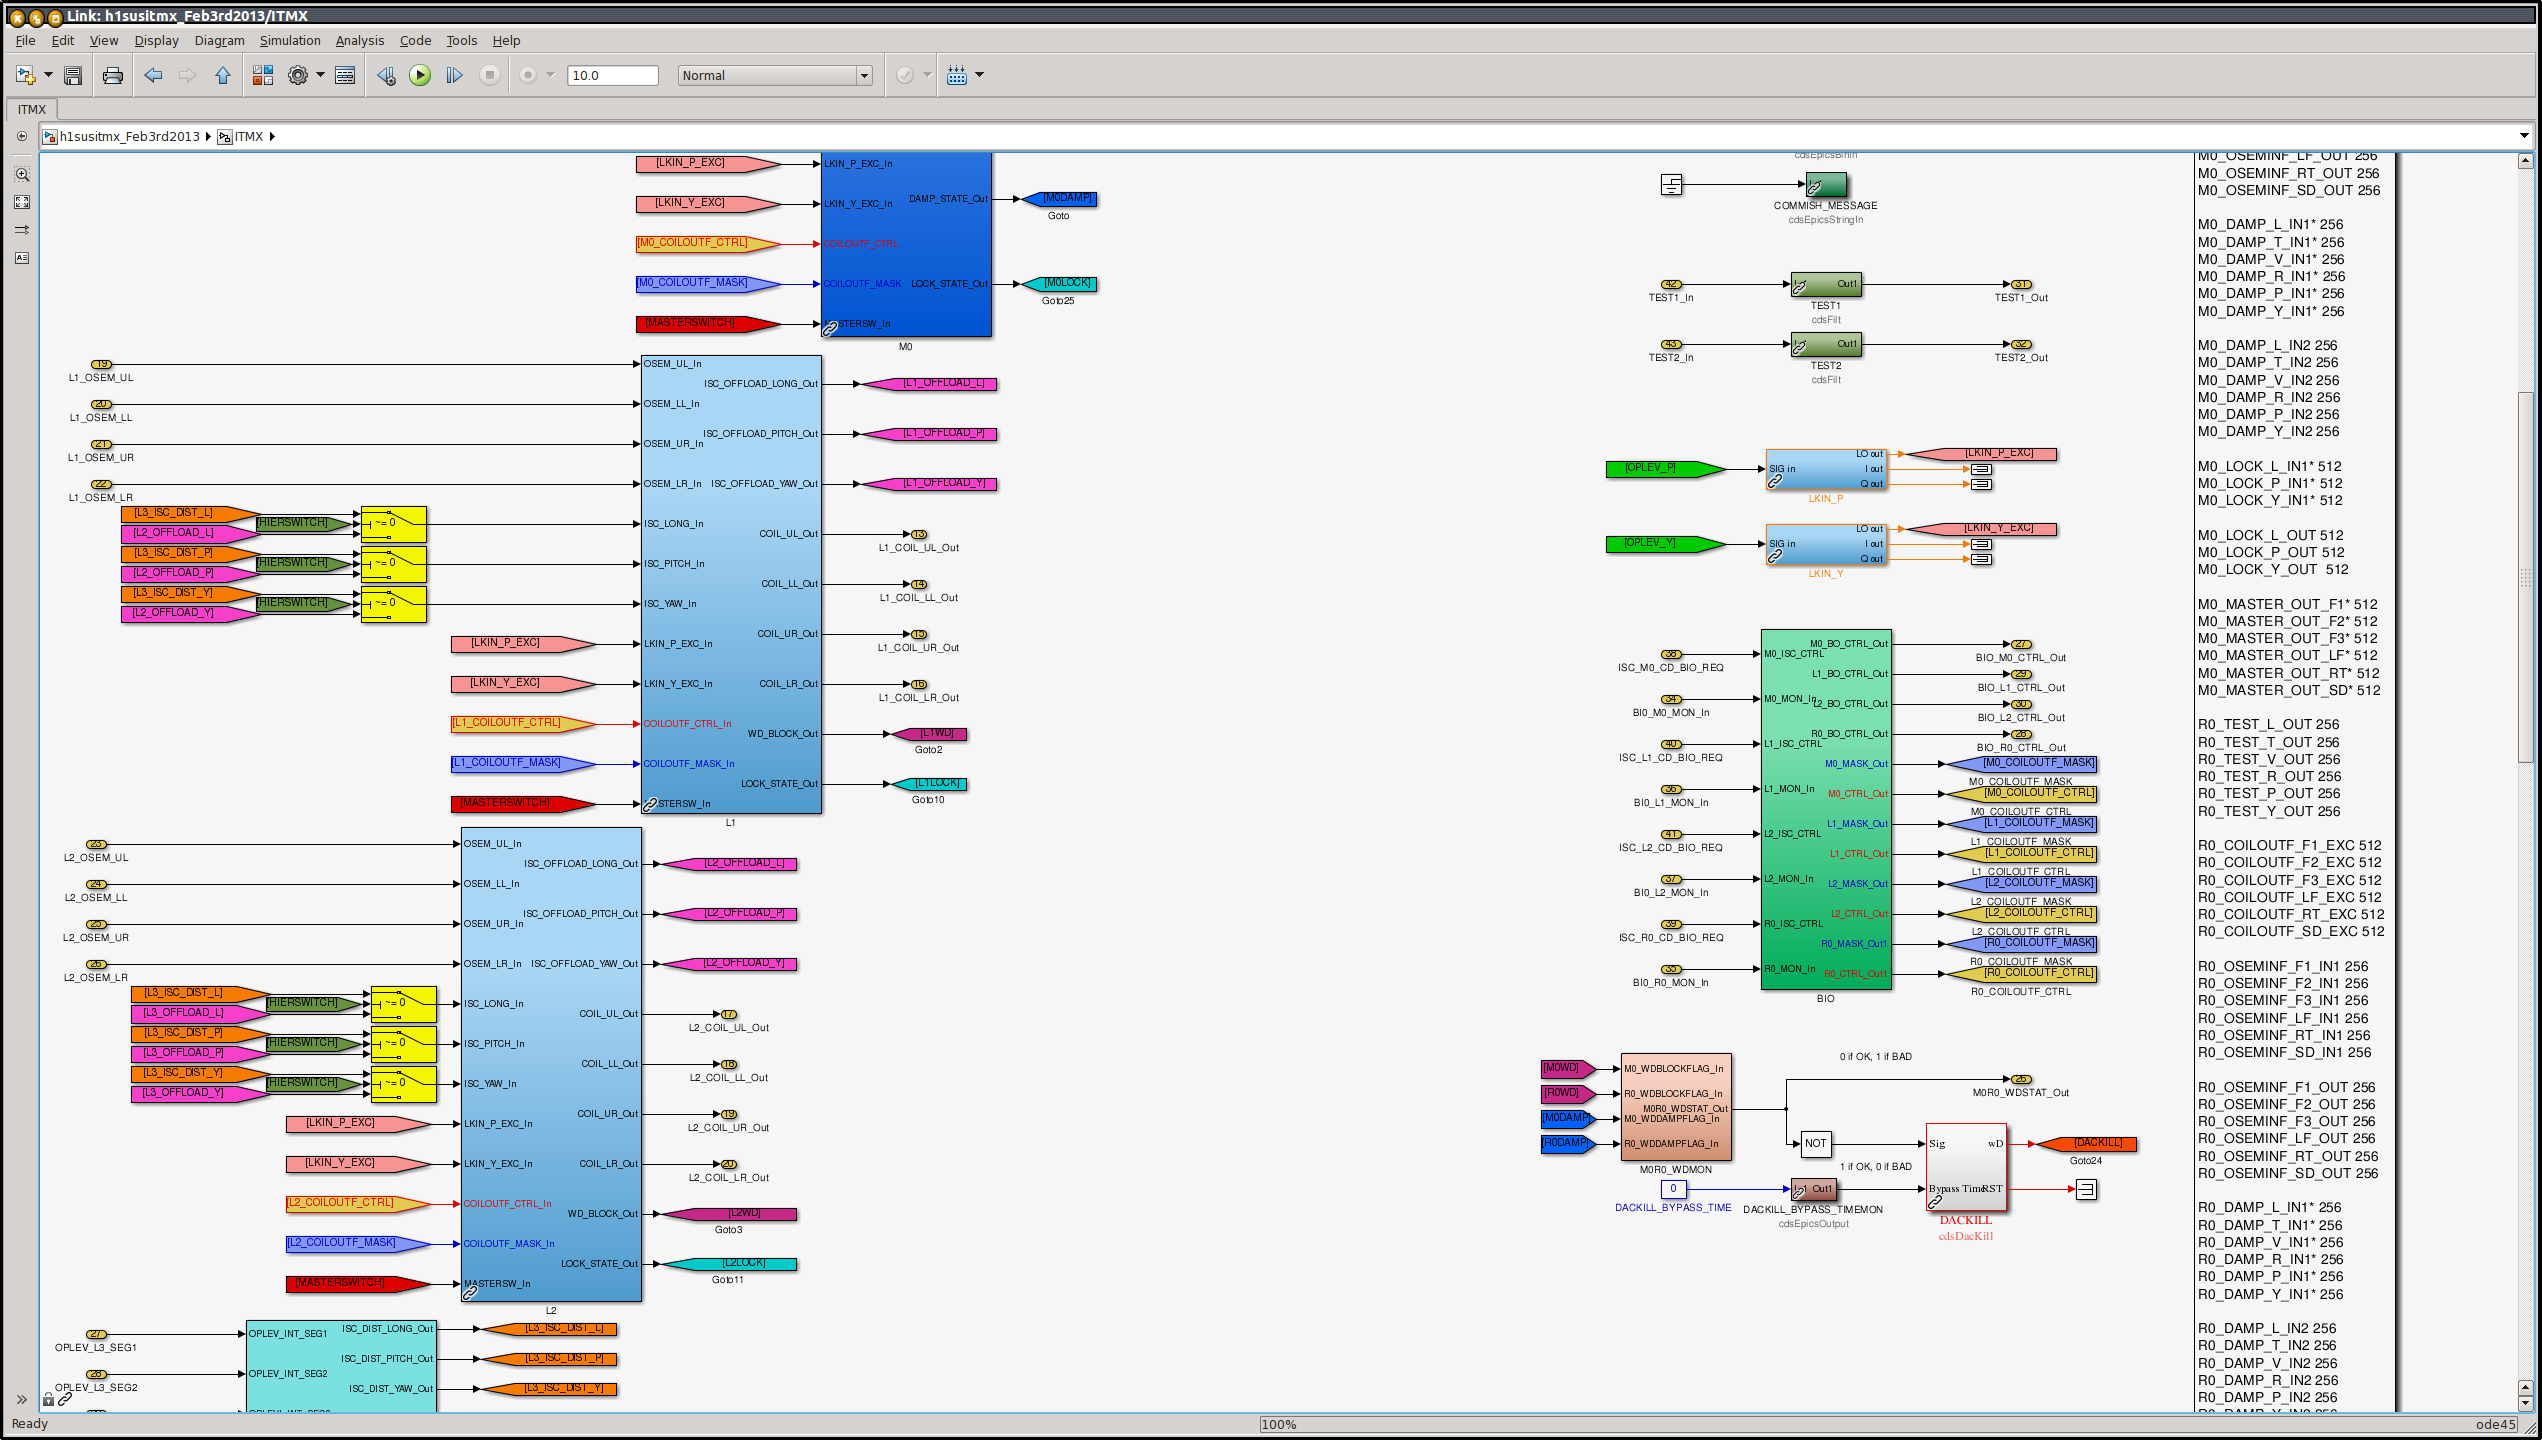
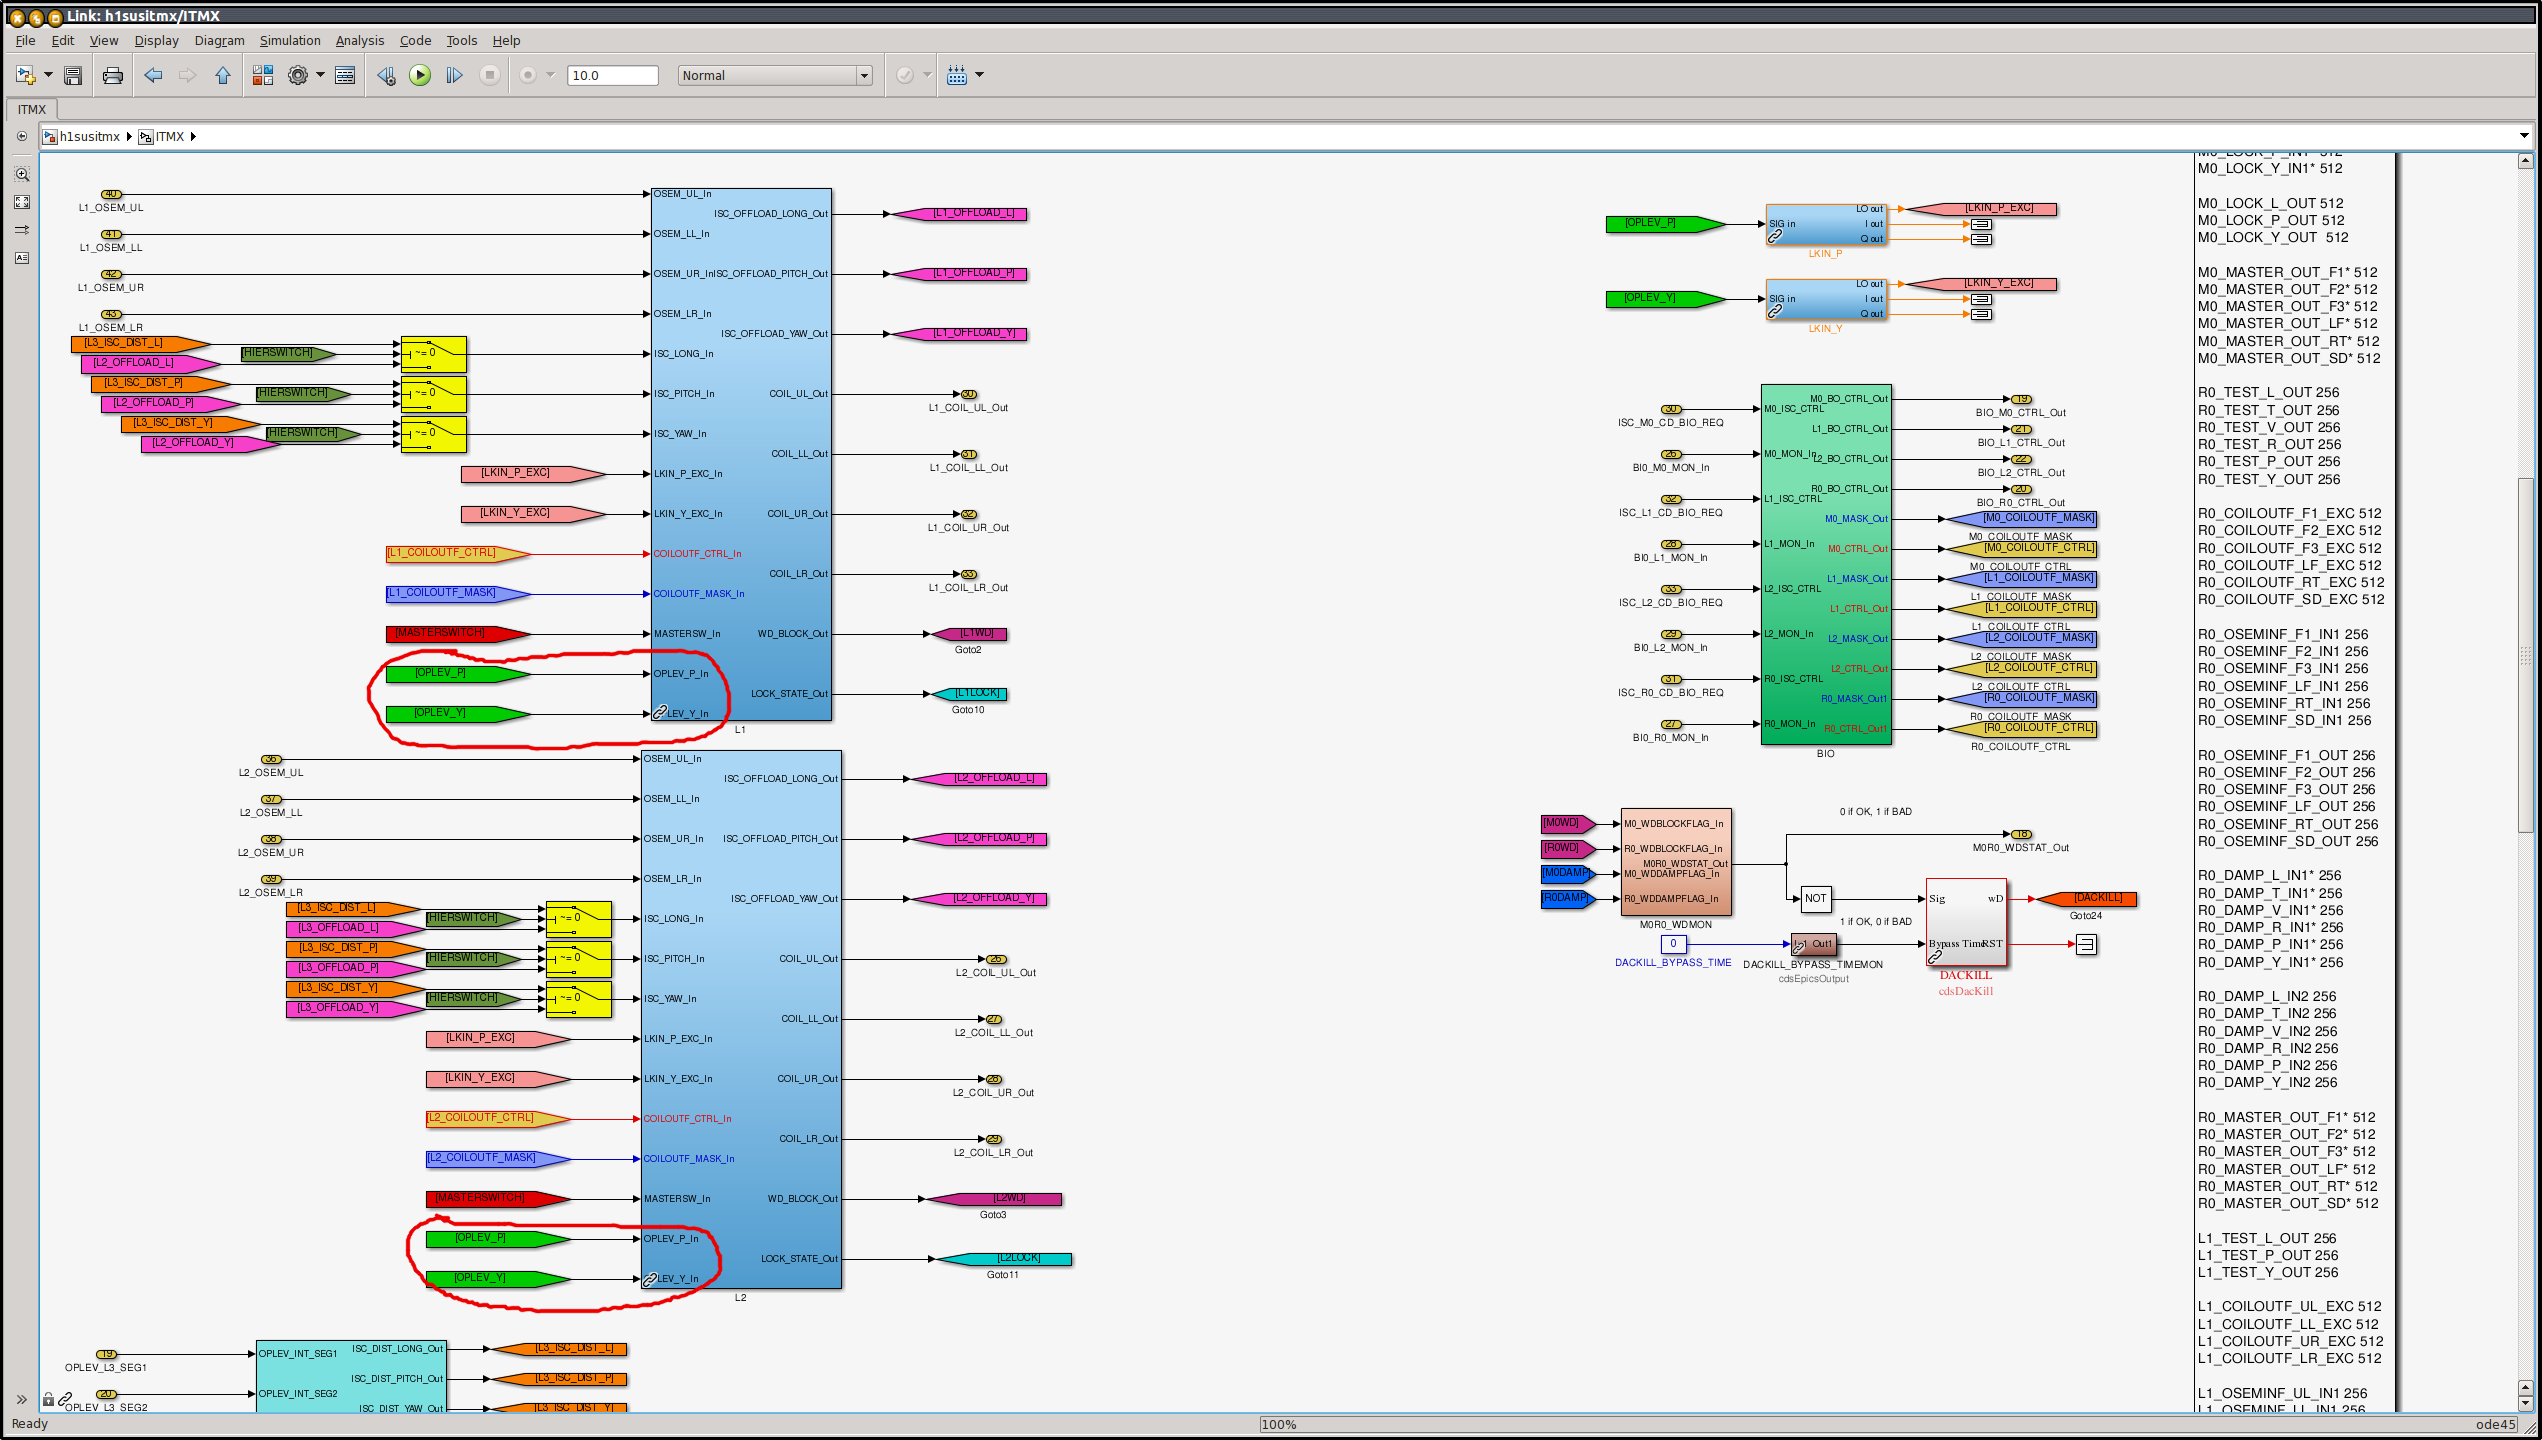
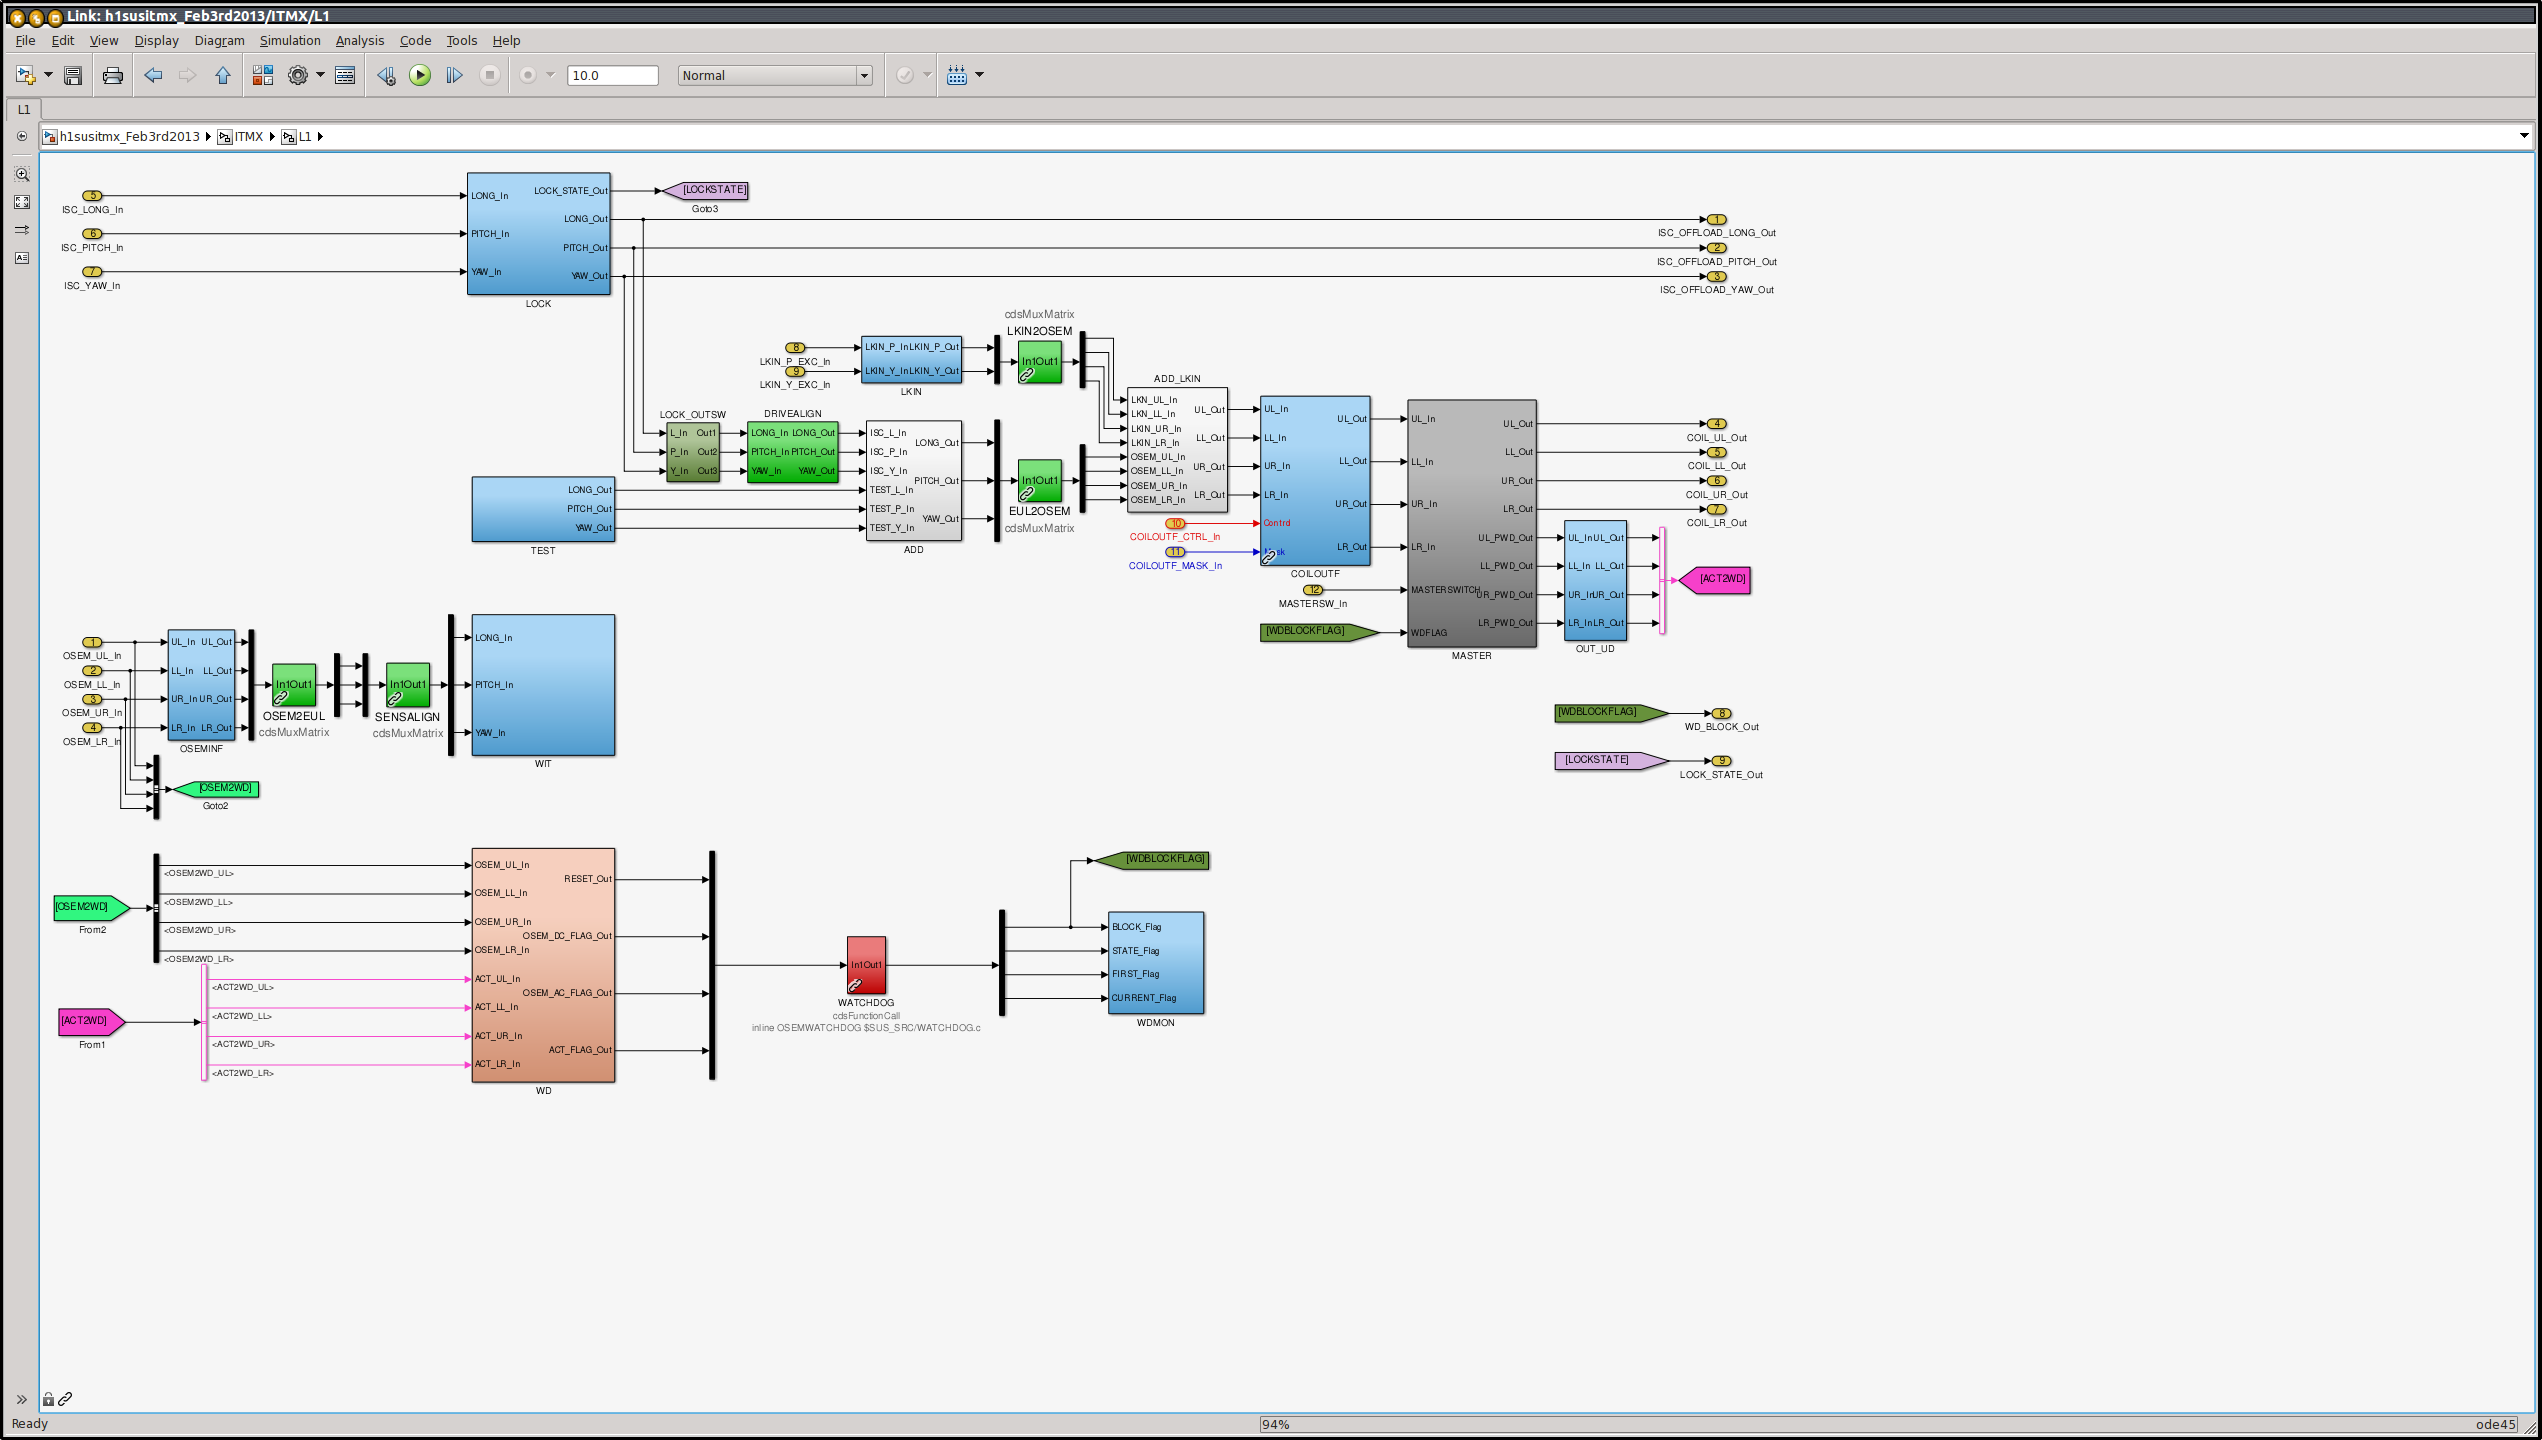
This links against the isi/common/guardian/isiguardianlib that Charles Celerier wrote. A graph of the full system is included below.
The code has been behaving very well, but there have been a few discrepancies between the code and the desired mechanical behavior that we're ironing out. As of today we were able to cycle through all the states without tripping the watchdogs. Ultimately a couple of tweaks to the deisolation process did the trick.
It seemed that the shutting off of the ISO Boost_F filters was causing the isolation loops to saturate. We fixed this by adding a 5 second ramp to all ISO Boost_* filters for all degrees of freedom. Similarly, the ramp down of the isolation gains, which happens right after the boosts are shut off, was also happening too quickly. This was particularly true when the platform location was far from the equilibrium position. After a bit of trial and error we were able to survive the full deisolation process with 150um/urad offsets with a 20 second gain ramp to zero. Preferably we'll come up with a more systematic way to set these ramp times down the line, but these should do for the moment.
Some additional comments:
The cart bias offsets are set right before reaching full isolation. However, the guardian reaches its fully isolated state (*_ISOLATED) before the platform location has reached it's final position. I suggest the global guardian behavior would be more robust if the guardian does not transition to the full *_ISOLATED state until the platform reaches the desired location, within some tolerance. This might be accomplished by tuning the loops to ramp slower to the desired offset and eliminate some of the ringing after the ramp.
We're getting a bunch of guardian notifications about ISO filter states during _RESTORYING_CART_BIAS_OFFSETS states.
Another day of testing and I think we're ready to stand up guardian nodes for HAM2 and HAM3 ISIs.


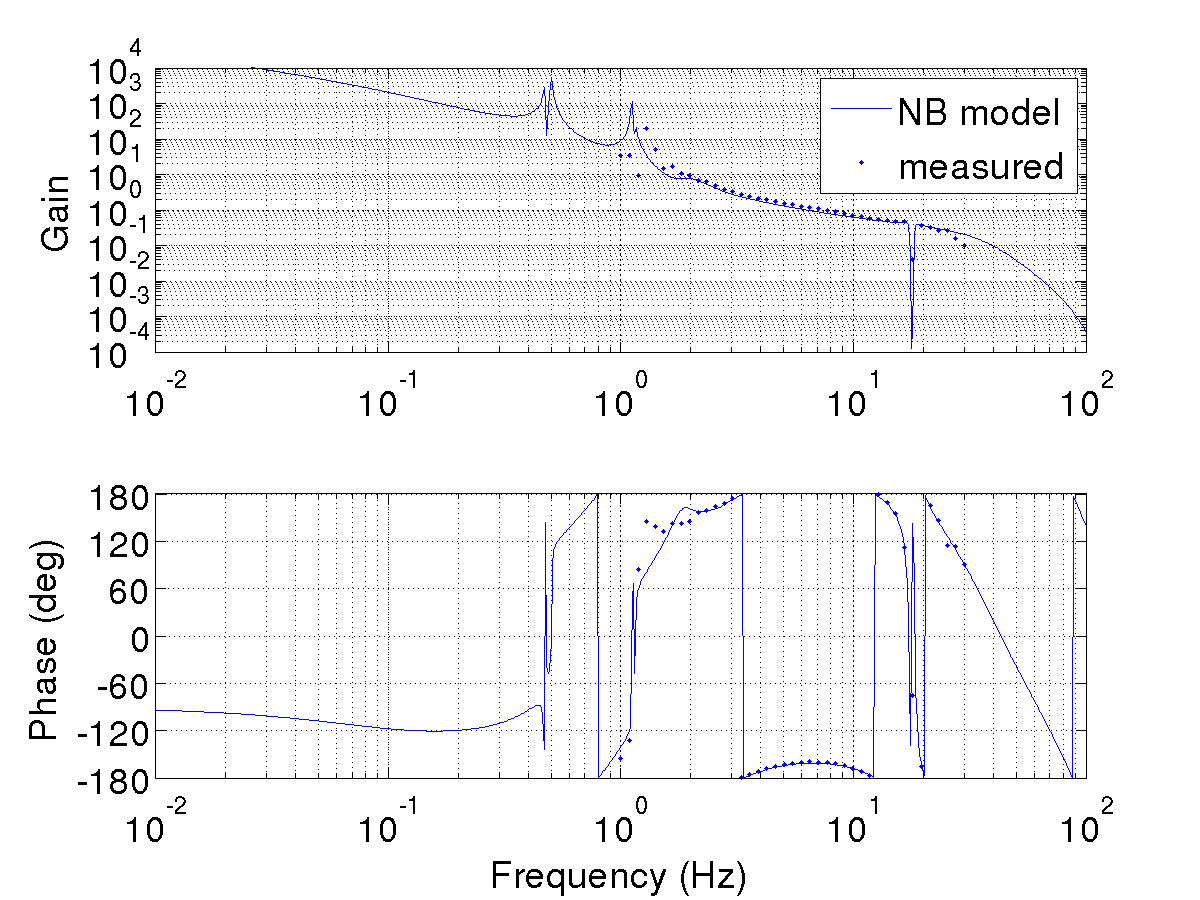
 Thank you for the excellent work on validating this model!

Like NBC jinxed all of the ice skaters by praising them just before they fell at the latest Olympics, I spoke too soon about the PUM ITM03 ear. Just after writing the above alog, Gerardo and I inspected the S4 ear and discovered a large bubble near the corner of the ear. It had a small fiberous particulate in the bubble. SOmehow, after monitoring for 2-3 hours, this fiber migrated into the bond. We had placed a LIGo-approved Vectra Alpha 10 cleanroom wipe over the S4+ear flat for the night in the event a random bug decided to perch, so possibly this added to the particulate. Da*m.
With Mr. Barton's assistance, we loaded the mass into the ultrasonic cleaner and bathed it in water. Within 4 minutes the ear came off. The mass is now reloaded at the wash station and we'll work on the S3 ear we were already prepped for today.
Bubble is shown in far corner of ear in this picture.
Further comment to the events above - Margot and Gerardo found this PUM to be dirtier than normal when they pulled it out of the cake tin many weeks ago. AT that time, they did a methanol cleaning of the entire mass. When Gerardo and I were cleaning the flats of this mass, we also noticed that it still seemed dirtier than "normal" - meaning, when rinsing, the water did not run on the surface as we had seen on other flats. After we performed the standard cleaning of the flat, the water behaved "normally", meaning it clung to the full surface and "sheeted" off. After we removed the contaminated ear, we recleaned the flat, expanding the surface area getting cleaned to the entire flat, not just the area when the ear gets bonded as is the typical procedure. We hoped this would remove particulate that was previously closer to the bond area. During the second ear bond attempt, we also did not cover the bond overnight with an alpha 10 wipe, since we were skeptical of the origin of the fiber which showed up in the bond.