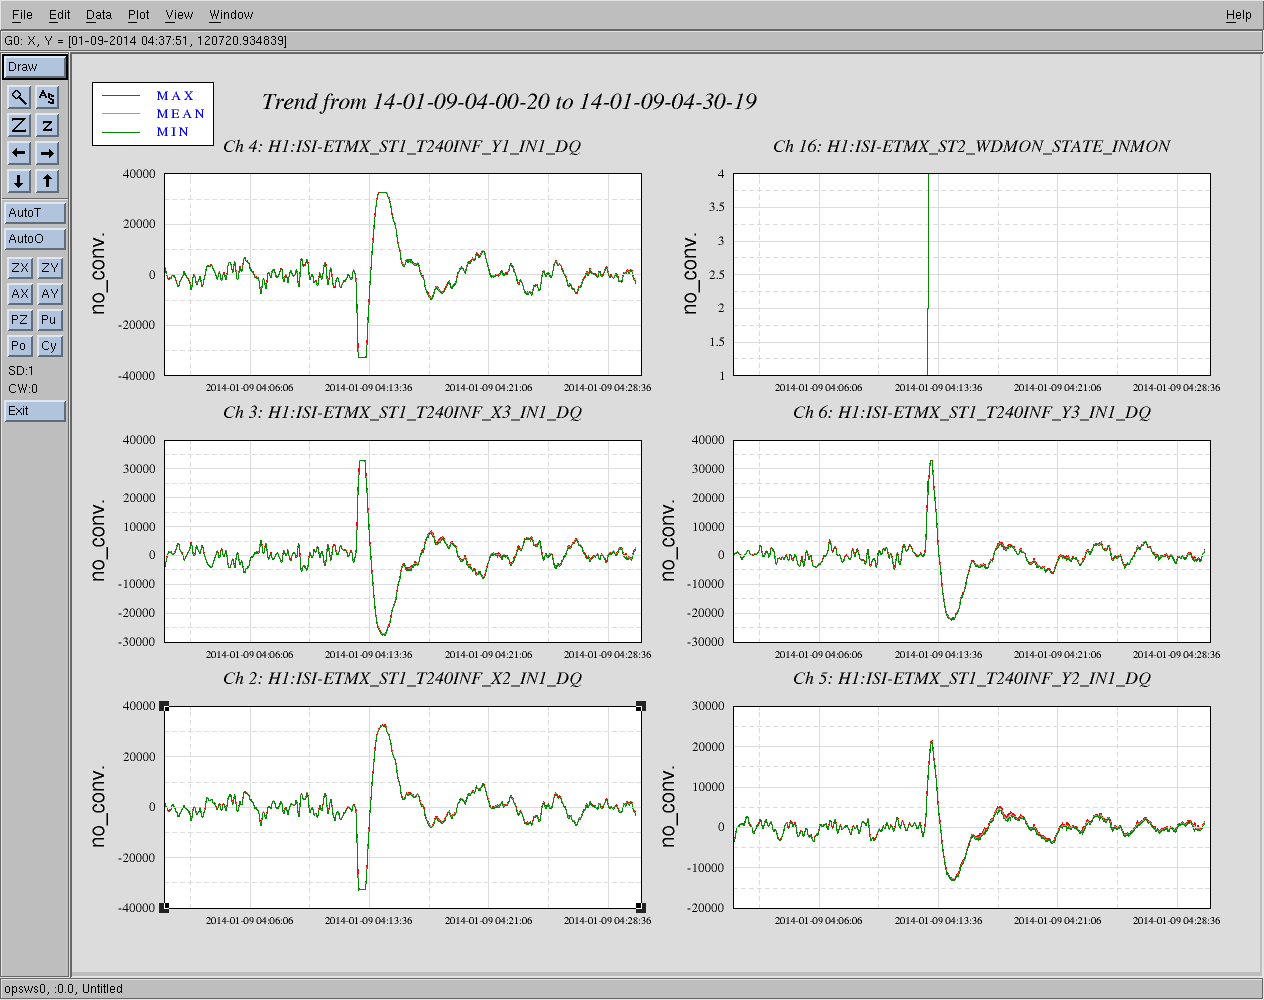
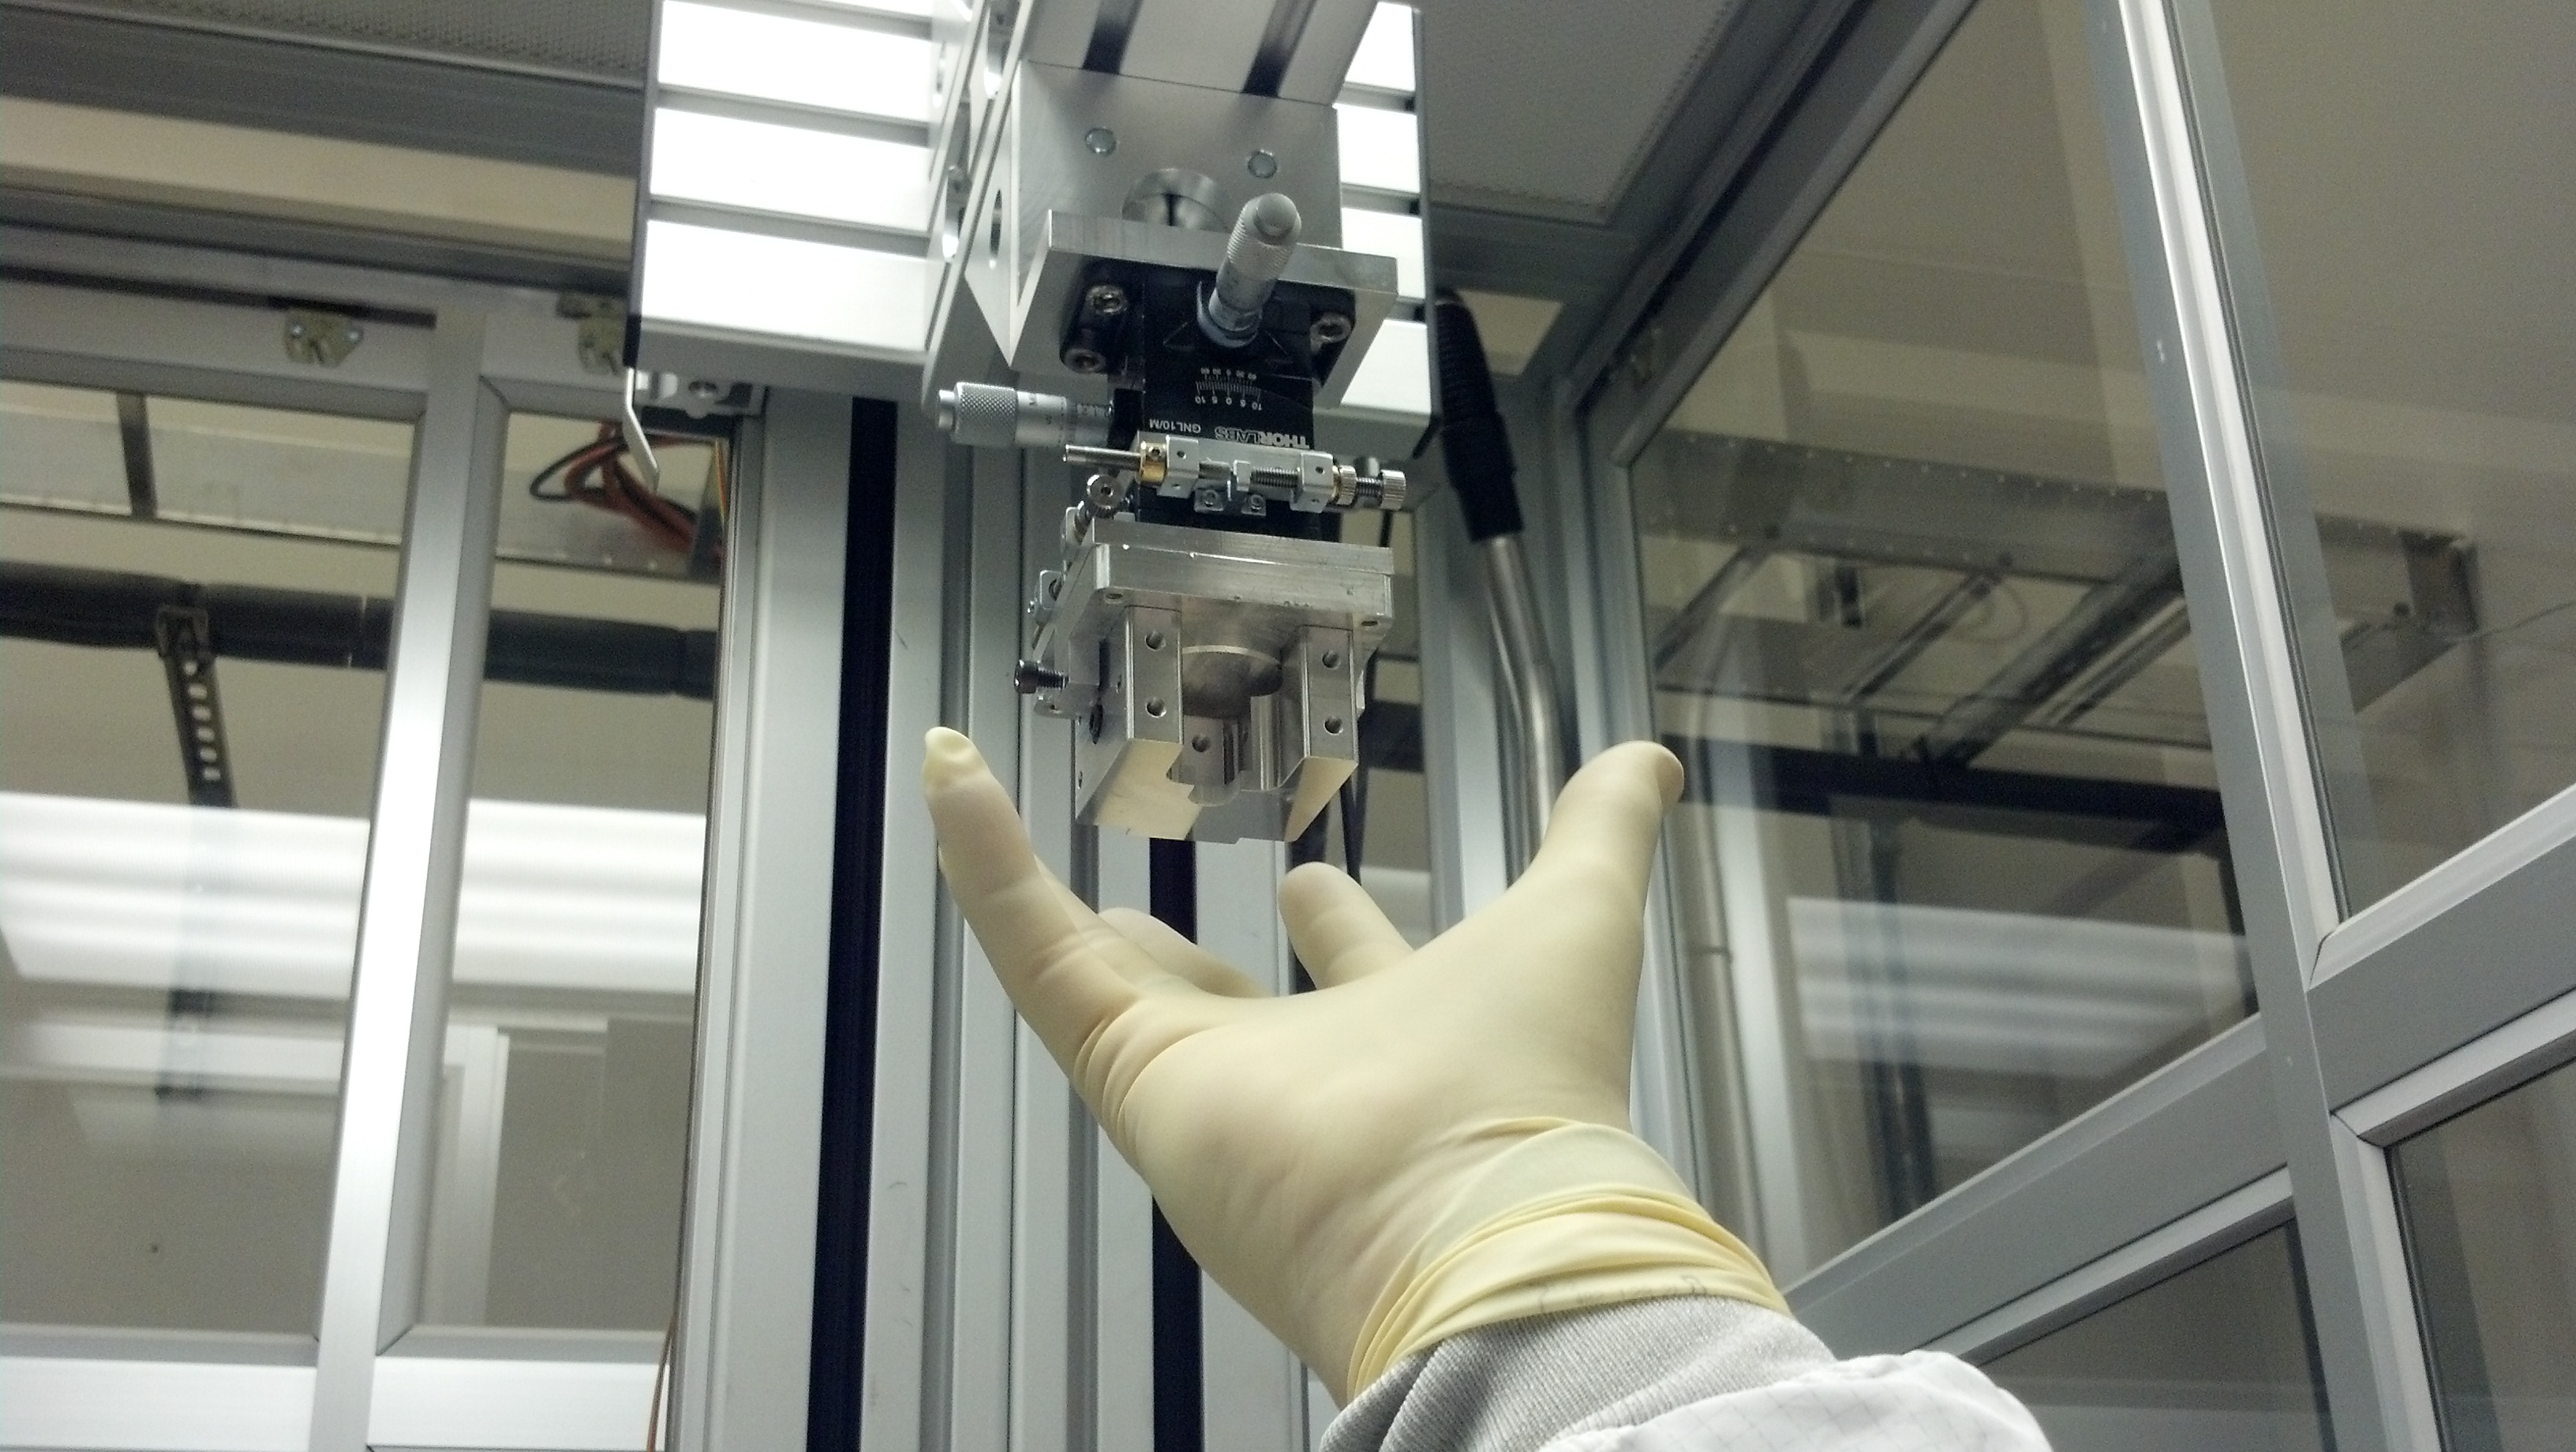
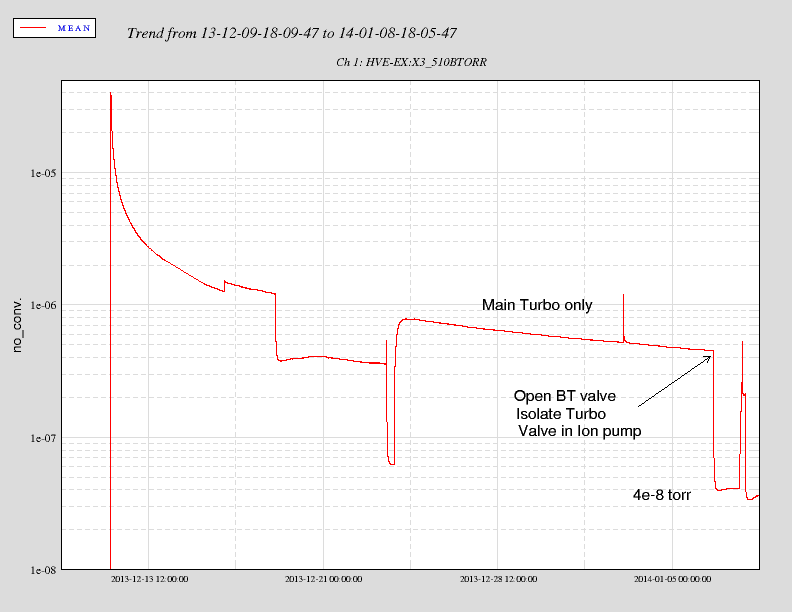
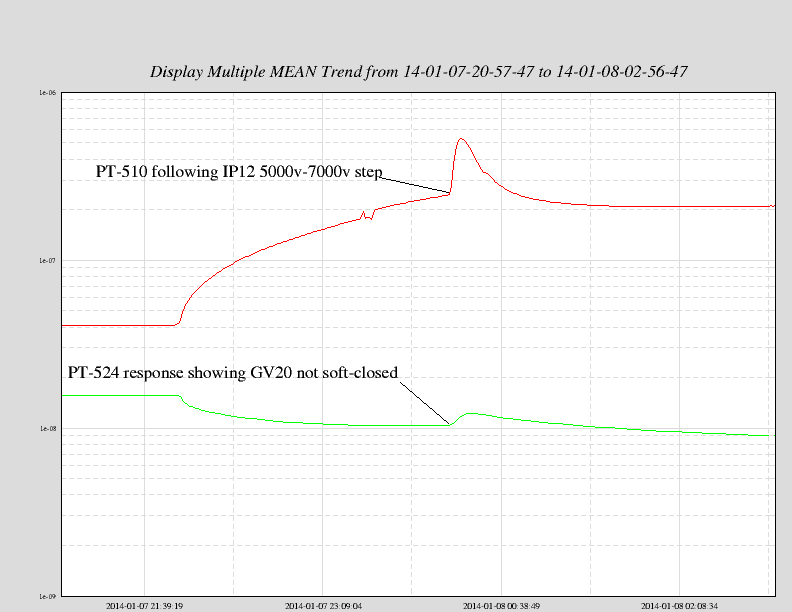
kyle.ryan@LIGO.ORG - posted 08:39, Thursday 09 January 2014 - last comment - 09:32, Thursday 09 January 2014(9162)
Soft-cycled GV20 for OPLEV-to-viewport work (resubmission, original entry was accidently deleted)
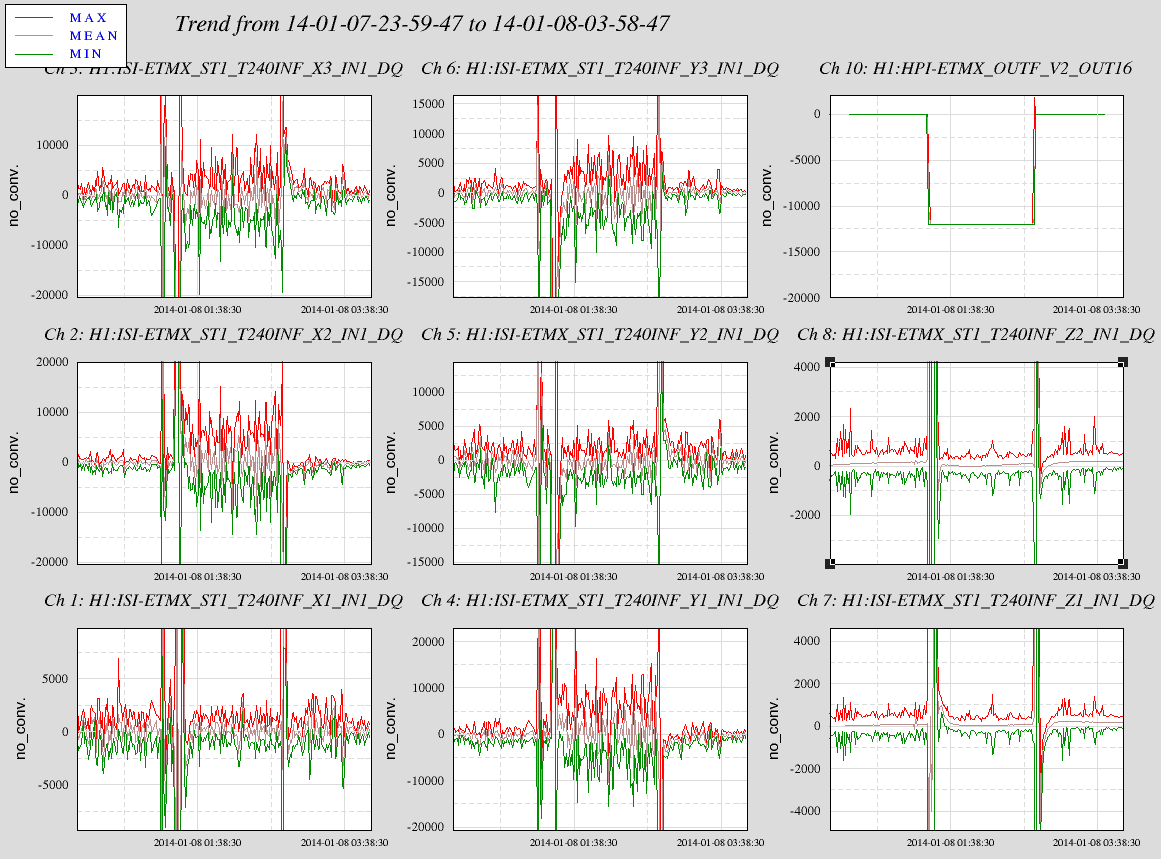
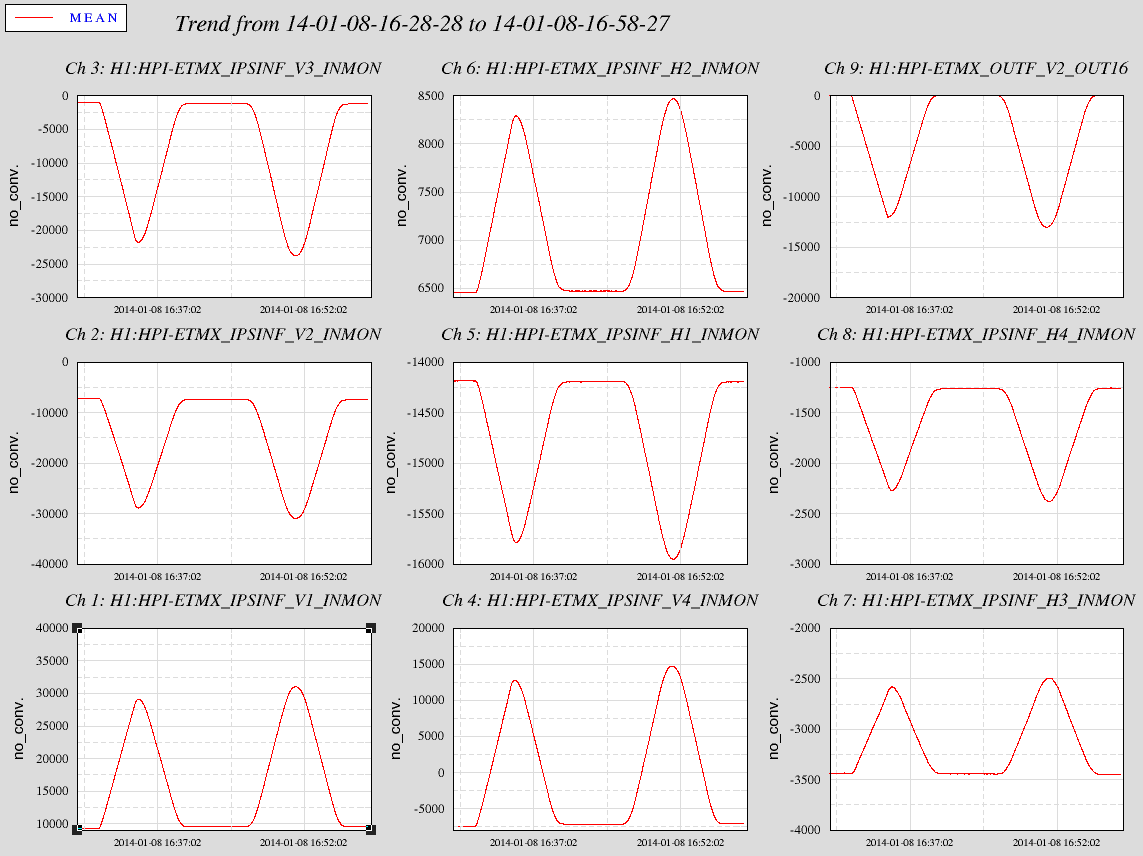
Nominal running of GV20 motor for 4 minutes and 16 seconds did not result in effective isolation of X-end (see attached)

Additional running of motor was required to get full O-ring contact as follows:

Ran motor 4 minutes 16 seconds - stop - accelerate to 500 rpm - stop - accelerate to 300 rpm
Images attached to this report
Comments related to this report
This entry pertains to activity on 1/7/2014