Displaying reports 86441-86460 of 88248.Go to page Start 4319 4320 4321 4322 4323 4324 4325 4326 4327 End
Reports until 16:25, Thursday 08 December 2011
LHO VE
kyle.ryan@LIGO.ORG - posted 16:25, Thursday 08 December 2011 (1873)
CP1 and CP2 overfilling
The recent installation of permanent heat traces around the LLCV needle valve valve bodies for CP1 and CP2 solved 1/2 of the nuisance freezing problem.  Now the actuator box is freezing up (These units were installed upside down for some reason and are prone to moisture entry and subsequent freezing) -> I am using drop lights with 25 watt bulbs as general heat sources as an interim solution for now.  

Operators note that I'm am monitoring CP1 and CP2 levels periodically and additional alarms are likely overnight.  No action is required.
LHO General
patrick.thomas@LIGO.ORG - posted 16:18, Thursday 08 December 2011 (1871)
Ops Summary
I covered from ~12:45 - 4:00.

Work on upgrading the FMCS system.
Preparation for cartridge install.
Fiber from LVEA H2 electronics rack to H2 DAQ accidentally cut.
LHO General
patrick.thomas@LIGO.ORG - posted 16:07, Thursday 08 December 2011 (1870)
plots of dust counts
Attached are plots of dust counts > .5 microns.
Non-image files attached to this report
H2 FMP
cheryl.vorvick@LIGO.ORG - posted 15:15, Thursday 08 December 2011 (1869)
Y Arm Beam Tube Pictures:
This is a follow up to Jodi's alog here, showing the pictures I took of the stuff we found.  Images show the range of particulate that was found, which includes white thread, small bundles of glass fibers, metal, and some stuff we couldn't identify.  

White fuzzy / thready particulate was very prevalent.  Other particulate was rare, so for example, only one red item was found, I only took two pictures of what looked like bundled glass fiber, and there was only one area where there was brown stuff stuck to the beam tube wall.  The pictures of the o-rings show that there was a significant number of particles on and in between the o-rings.

Picture names have the description of what's in the picture.
Images attached to this report
H2 SUS
jeffrey.garcia@LIGO.ORG - posted 13:13, Thursday 08 December 2011 (1868)
H2 ITMY Tap Tests
Today, impulse response tap tests on the ITMY QUAD were performed with the ISI floating.  The following plots are of the response for the 7 locations with each X,Y,and Z DoF plotted. Descriptions of the tap locations are below.

ITMY 

location1 - cross brace on reaction side in front of PUM - 
location2 - just between pum and uim vertical brace from clean side to beam tube
location3 - straight cross brace between uim and R0 
location4 - cross brace beside pum on clean side downwards 
location5 - cross brace beside R0 clean room side hitting upwards 
location6 - beam tube side - vertical brace beside M0 hitting towards clean room 
location7 - straight cross brace between M0 and UIM downwards. on ITM side 
Non-image files attached to this report
LHO VE
kyle.ryan@LIGO.ORG - posted 09:12, Thursday 08 December 2011 (1863)
CP2 overfilling
Trace heat for liquid-level control valve valve stem is working -> actuator arm is frozen in this case.  I will use a heat gun to thaw-out then evaporate moisture, also try and seal.  
X1 SEI
corey.gray@LIGO.ORG - posted 08:34, Thursday 08 December 2011 (1851)
HAMISI#1: Balancing, Locker Shims, Locker Horizontal Position, & Actuator Alignment

Here is work from Wed....

Vertical Adjustment of Shims

Tues night, we found the tips of the Springs to be higher than the base of the Springs.  So, the 0.126" Shims under the Lockers were swapped out for thinner Shims.   This brought the tip/base Spring difference to around our tolerance of 0.015".  The ISI was then balanced.

Current Locker Shims:

Horizontal Adjustment of Shims

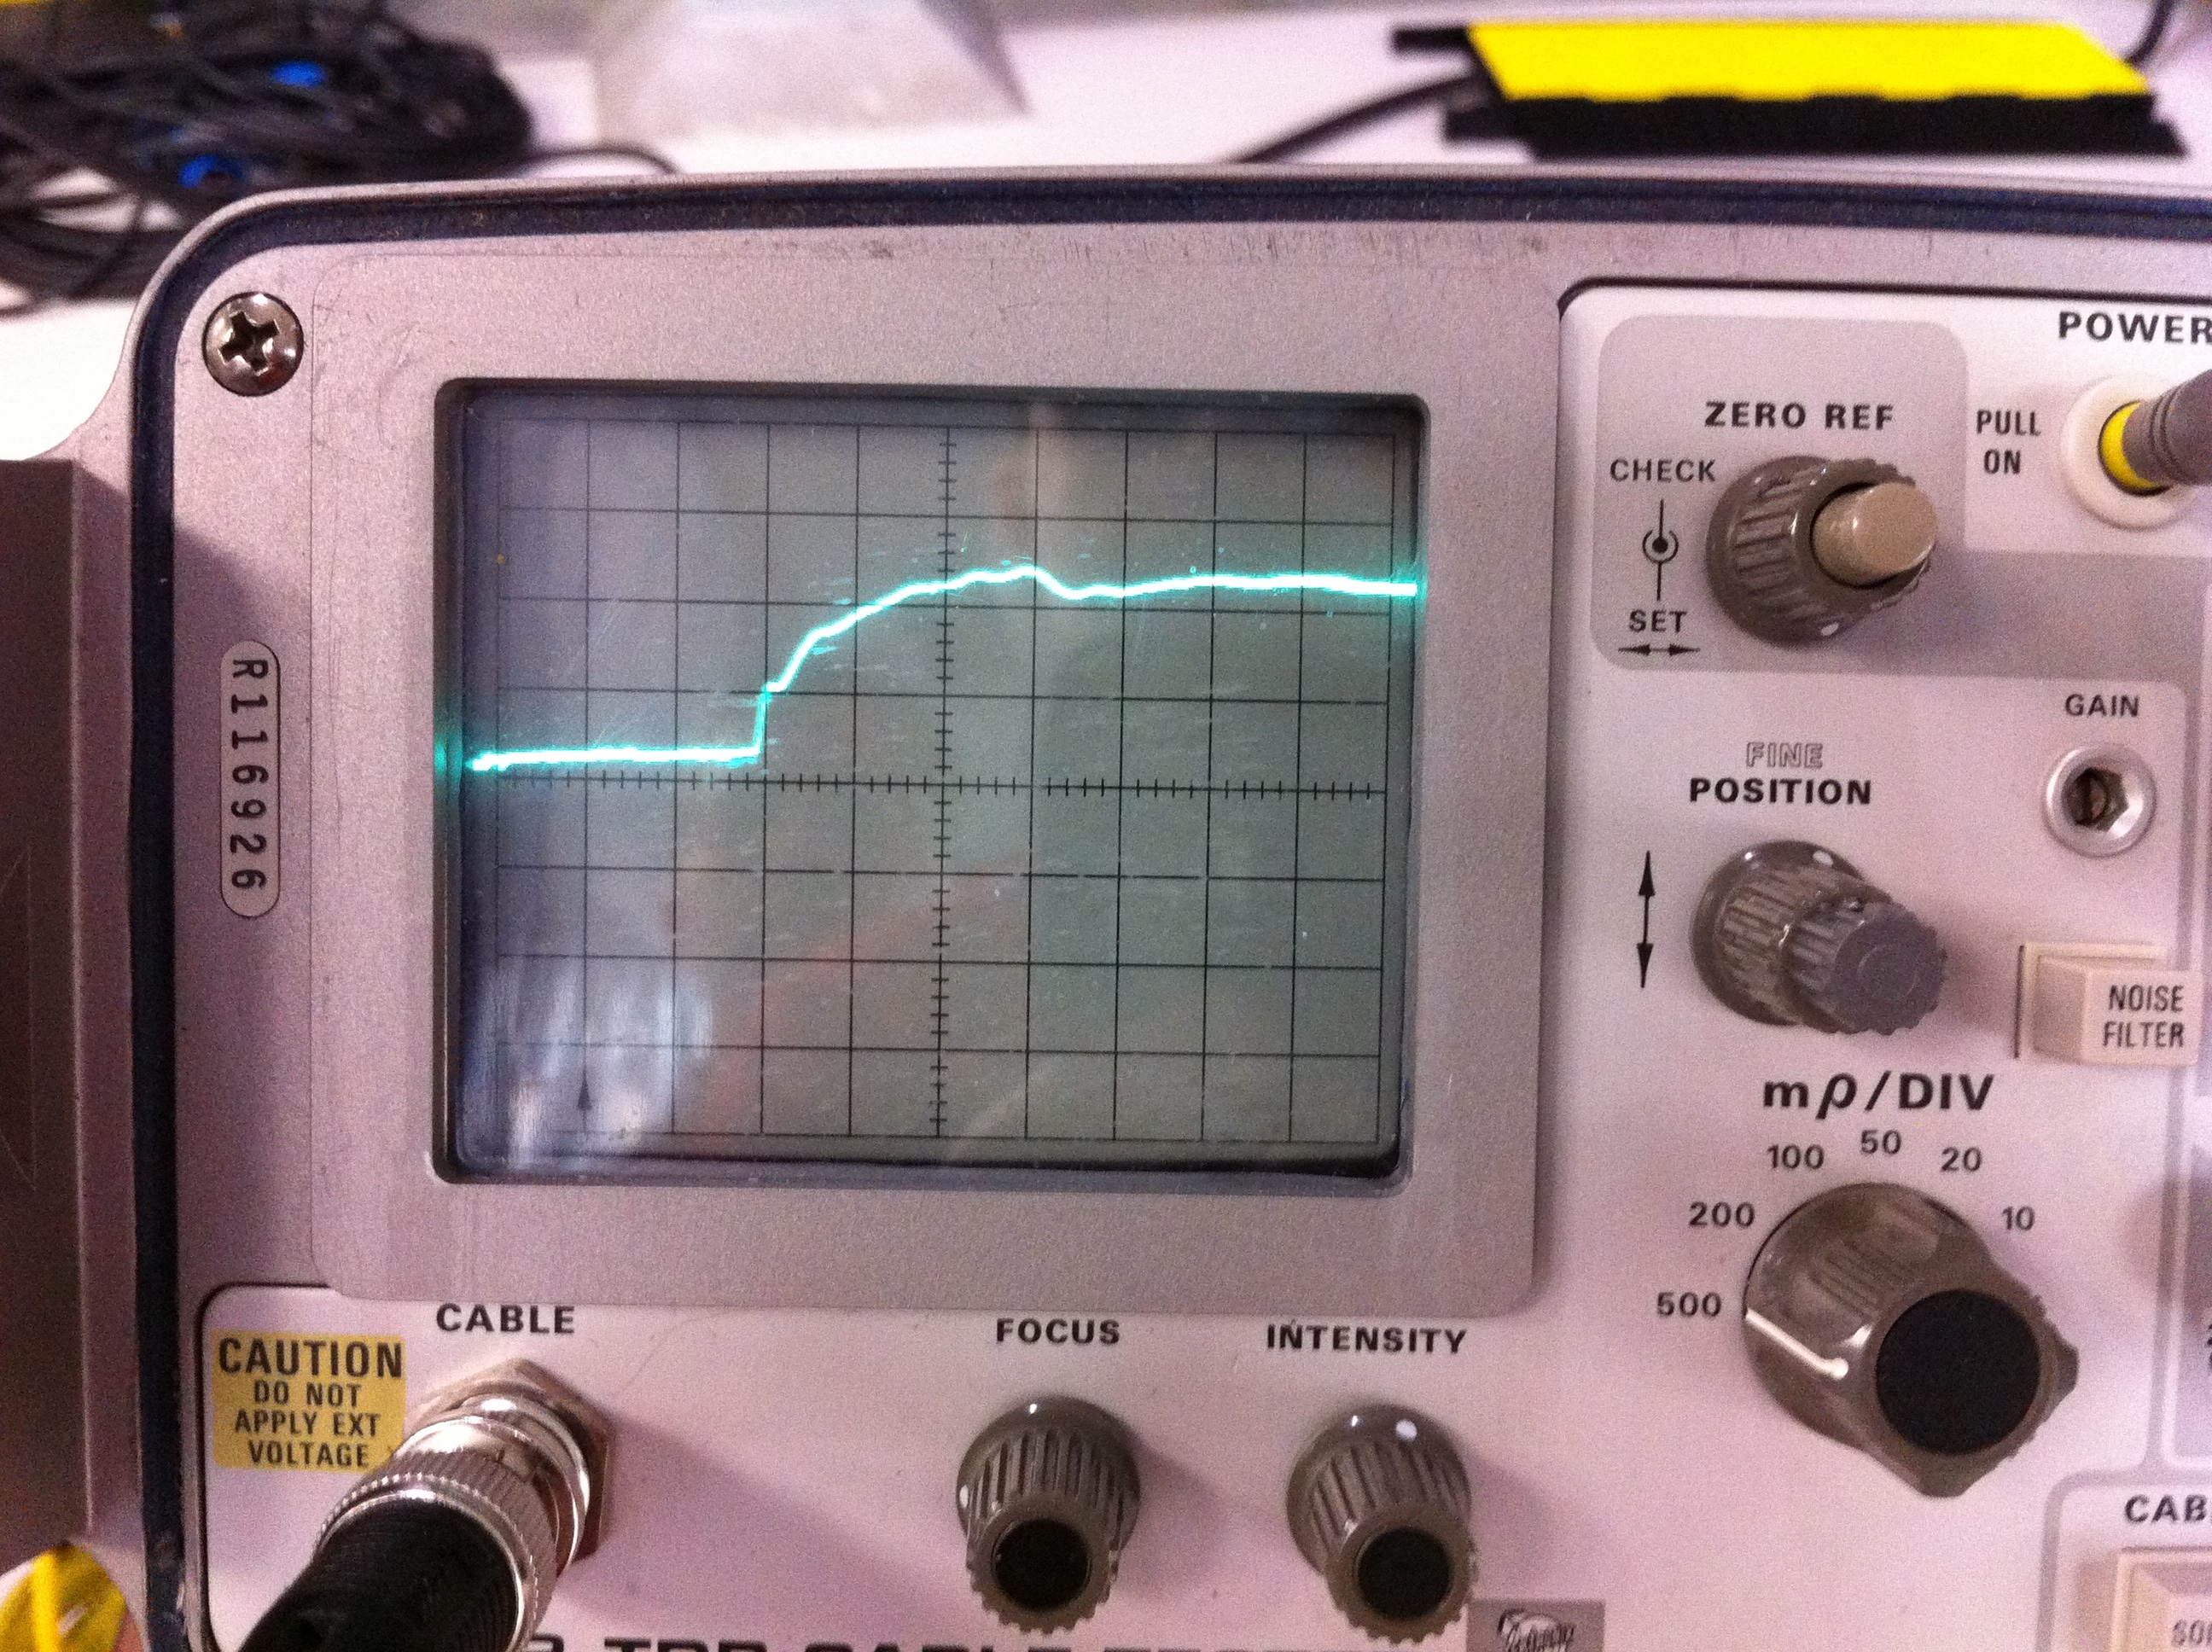
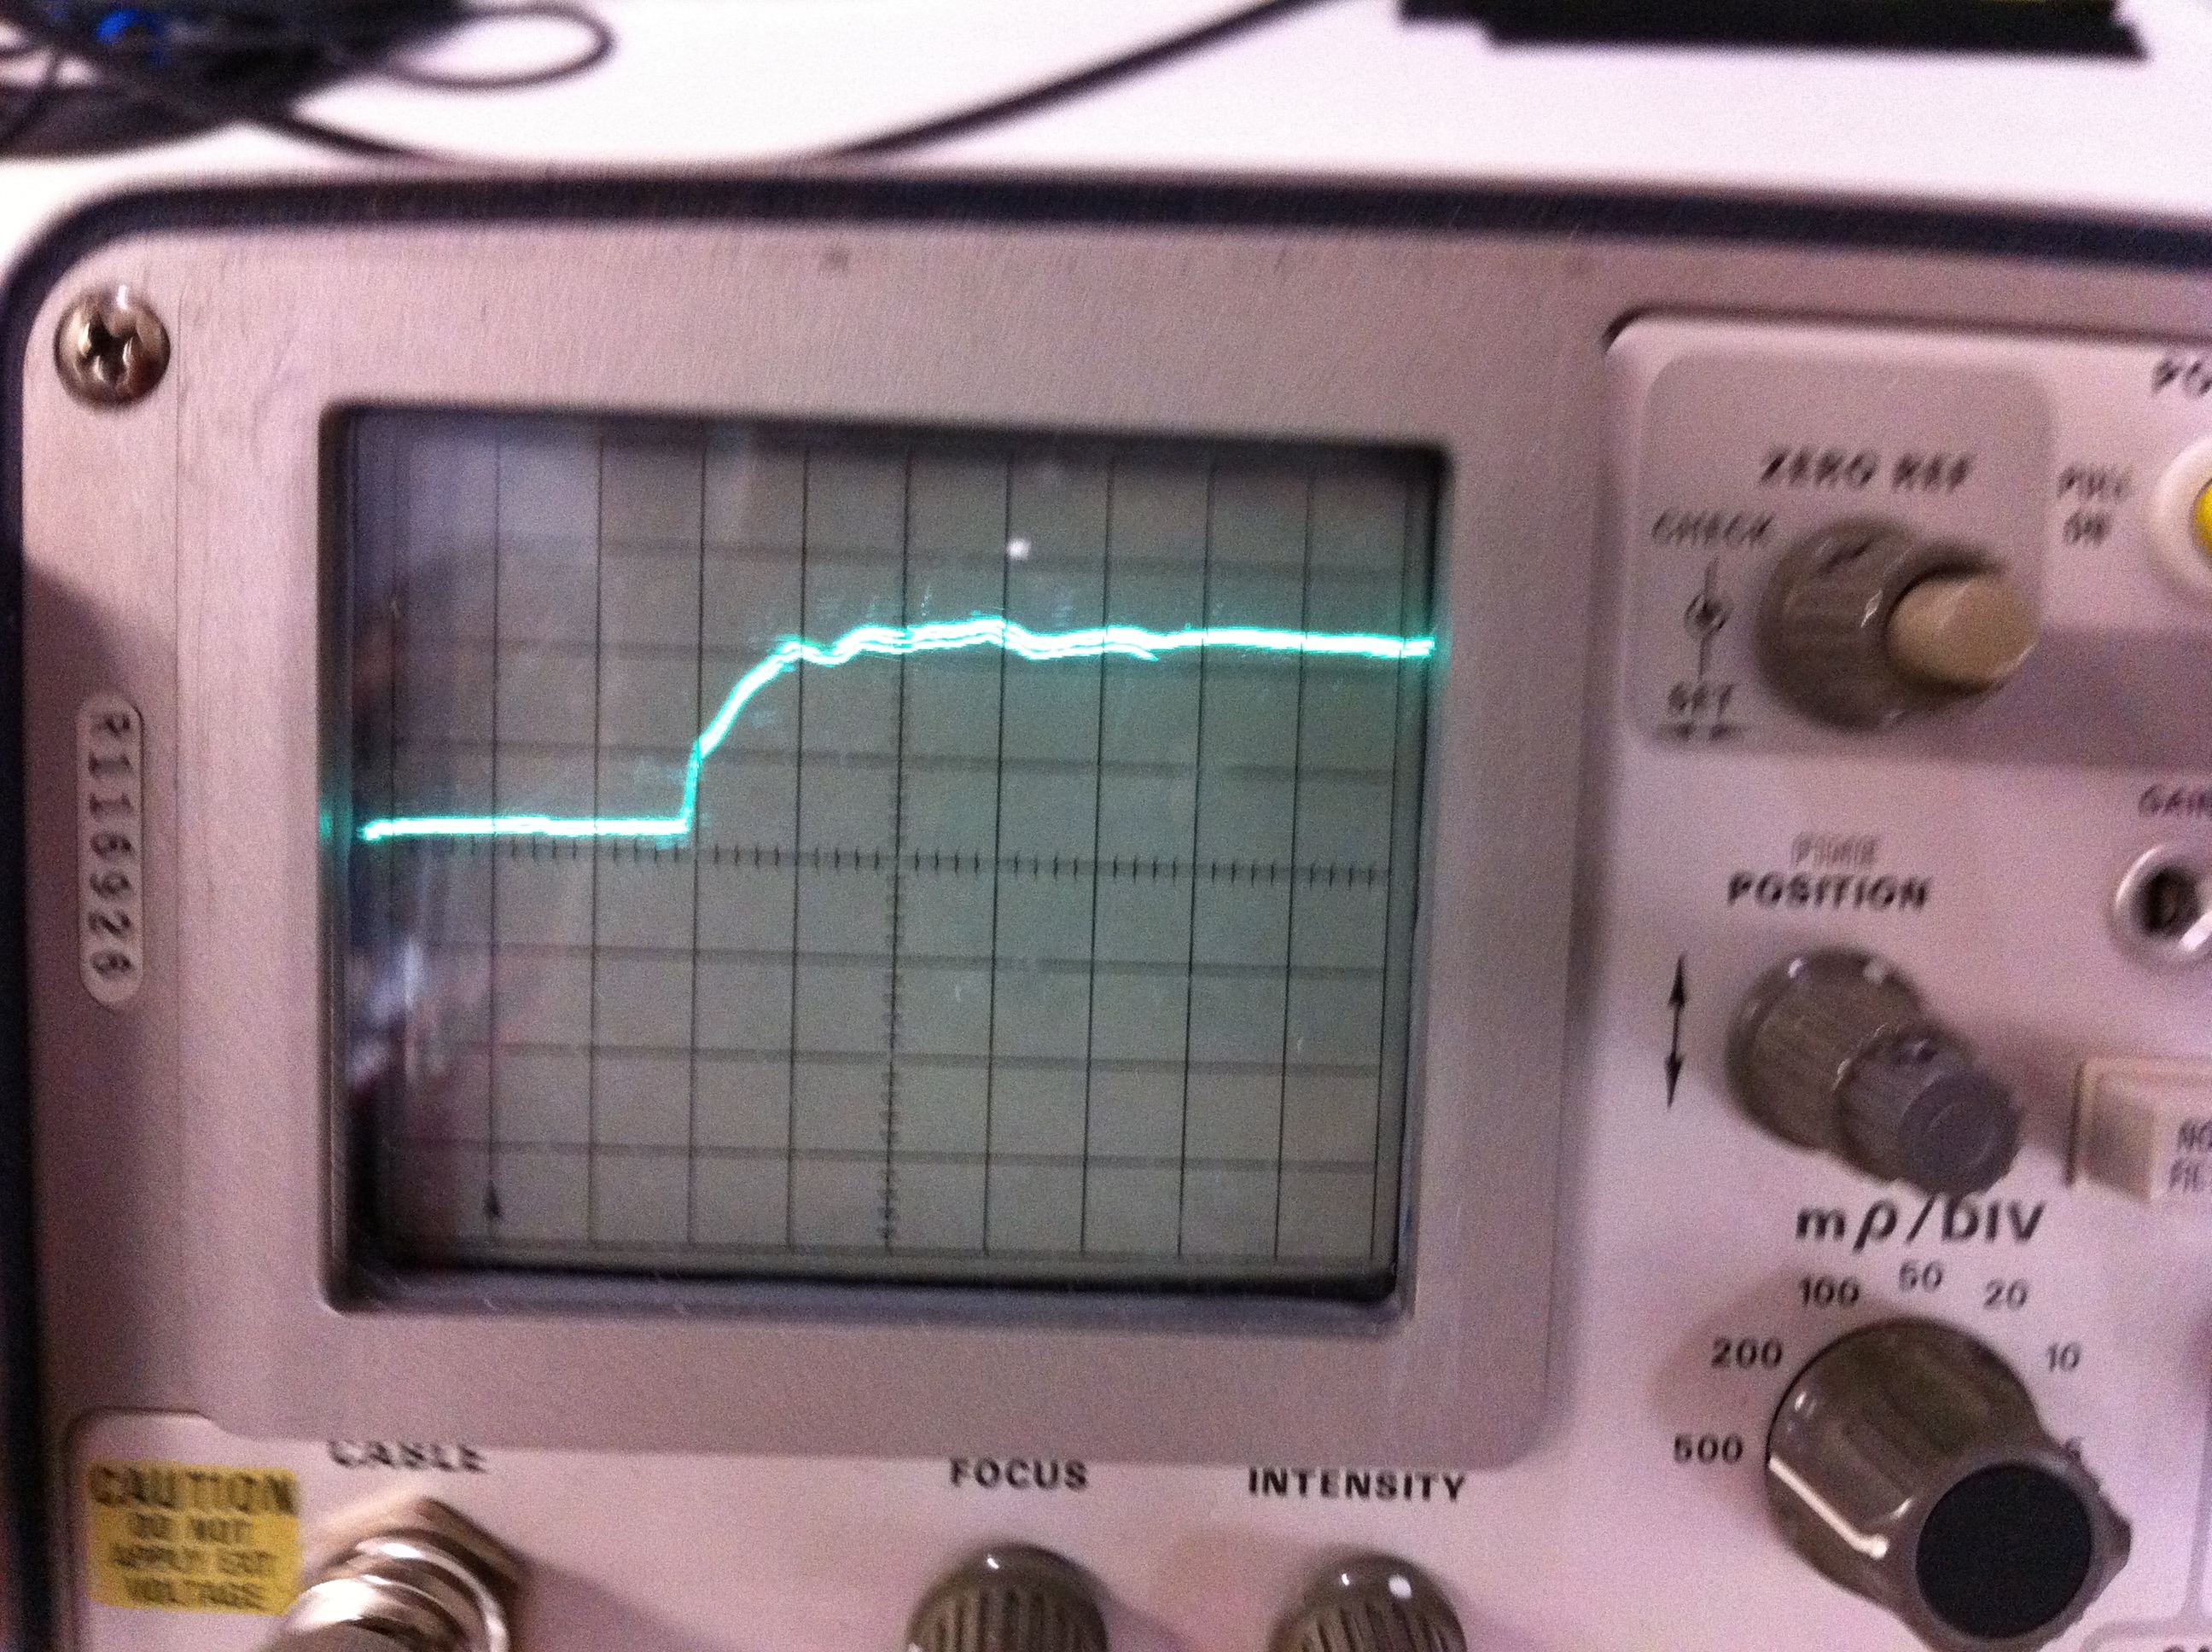
With the dial indicators, we were able to monitor float/locked positions of ISI.  Horizontally, we saw an overall counterclockwise twist (saw dial indicator changes on the order of 0.007-0.018".  So, we went about re-positioning the Locker Bases. 

(I'm noting procedure here mainly for my own records)The ISI was unlocked, the Dial Indicators (DI) were zeroed.  Then at ONE Locker, we loosened the Base bolts & Locked the locker.  Due to friction/sticking between the Locker Base and the Stage0 floor, you will probably see some Stage1 motion.  If you do, just tap on the Locker Base to free up your Base & to keep your DI at zero.  Once the Locker is locked, and the DI says zero, one can start tightening the Locker Base to Stage0.  Unlock the Locker (rezero DI if needed), and re-Lock, and confirm the change in state is within 1-2 thousandsths.  Repeat for remaining three Lockers.  After we did this, when we re-locked the system it did so without binding up the 4th Locker---a good thing.

For the most part we are mostly done with this ISI, EXCEPT, it was noticed the installed-Actuators aren't "aligned".  When they were removed off the ISI, they first had their Set-Up Bars installed to "lock" their alignment.  Either they weren't aligned before, or they Set Up Bars weren't installed correctly, and we've lost their alignment.  Each Actuator will need to be pulled off, re-aligned on a work bench, and then reinstalled.

H2 INS
michael.landry@LIGO.ORG - posted 04:45, Thursday 08 December 2011 (1861)
Towards cartridge insertion at BSC8
Steady progress is being made towards cartridge insertion at BSC8, likely late this week Thu/Fri.  Items underway include:

-The cleanroom at BSC8 was swapped out for the shorter, modified variant.  We had neglected to account for a known interference, that of the gate valve stem (and box works mounted there), when lowering the cleanroom to fly the cartridge and center over BSC8.  The shorter extent (as aligned along the Y beam axis) allows for the cleanroom to be lowered without interfering with the gatevalve.  Small modifications to the work platform/railing were made to limit interference there as well.

-At the y-manifold/cryo pump area, the H1/H2 optical lever piers and table, and TCS laser were removed, and plumbing under the beamtube modified (TCS chiller lines removed, purge air modified) for clear access.  De-installation here allowed for the arrival of cleanroom, cleaning of the area, and eventual spool extraction.  The driver is the vacuuming of the y-manifold, part of the in-chamber cleaning effort, intended to limit a particulate source near the recently brushed and cleaned BSC8.  Vacuuming is to take place prior to cartridge insertion.

-At the cartridge test stand #2, SEI software transfer functions completed and the ISI was locked up, and final power spectra obtained.  Both suspensions remain unlocked.  In an effort to pulse and vet the ESD cabling, we removed an iLIGO feedthru from HAM8 with the appropriate connector type; this failed as described in R. Abbott's earlier alog, and will require an in situ retrofit of the ESD cabling (a limited run from the feedthru to a connection point affixed to the ISI)
H2 SUS
jeffrey.garcia@LIGO.ORG - posted 23:25, Wednesday 07 December 2011 (1860)
FMY Impulse Response tests
Attached are plots of the 7 tap test locations on the FMY performed yesterday afternoon. Data was exported from the PULSE software to a text file and imported into Matlab. For this measurement, a metal tip on the B&K hammer was used as opposed to the rubber tip used in previous measurements.  A new template ("Simple Hammer Display 3.pls") in the PULSE software was used according to T1000697-v2.

The plots each have the 3 DoFs from the accelerometer used and are plotted according to location.  The FMY M1 Damping Loops were closed and the ISI floating.  The plots show the response trending upwards from ~100Hz and higher as in previous results.  However, previous measurements saw this upward trend in magnitude beginning from ~10Hz.  Here, the trend is a decrease in magnitude from the lowest frequencies to ~100Hz.  

For these measurements, the accelerometer was placed on the back side of the FMY (i.e. the side facing opposite the ITMY) due to accessibility. A description of the locations on the FMY are as follows:

location1 - back side of fmy beam tube side just above the accelerometer
location2 - side of M2 hitting away from beam tube
location3 - M2 cross brace downwards
location4 - M1 cross brace downwards - straight cross brace
location5 - top side from beam tube going away - above M1
location6 - straight cross brace on M2 on clean room side
location7 - cross brace on M2 clean room side

Data was also taken for the ITMY QUAD structure, however, there was a data corruption issue encountered in data from 5 of the 7 locations.  Measurements on the ITMY QUAD will be re-taken with time permitting before cartridge install.
Non-image files attached to this report
H2 FMP
jodi.fauver@LIGO.ORG - posted 21:55, Wednesday 07 December 2011 (1859)
Y-Arm Cavity Inspection and Documentation
The spool piece by GV5 was pulled to allow access to the section of the arm cavity leading toward BSC8. Once the spool section was out and the Arm Cavity Baffle removed, Cheryl V., Mark L., and I went into the cavity to conduct an assessment of particulate content and document what we found. (As you may recall, this expedition was first contemplated during ICC at BSC8 because of the quantity of "detritus" that we found at the drop-off between the chamber nozzle and the larger diameter Arm Cavity.) Our objectives were to assess both the quality and quantity of "detritus", determine whether there appeared to be a gradient in the location of "detritus", get good quality close-ups of items in-situ, and to collect samples of various items. We accomplished all of our goals and the preliminary results are listed below:
1. The quality of "detritus"-Seems to be very similar to what we've found during in-chamber cleaning (pieces of glove, thread, "fluffy" fibers, metal fragments including what looks to be Al foil, "goopies" of various kinds, and a very fine patina of metal "dust")
2. The quantity of "detritus"-Again, very similar to what has been found in chambers (Cheryl will attach some pix to this post when she gets a chance.)
3. There does not appear to be a gradient in the quantity of "stuff". We thought we might see more "detritus" close to the BSC or gate valve but that does not seem to be the case. The "crap" seems to be quite evenly spread from gate valve to BSC...
4. Cheryl got some great pix including the fine metal dust falling from the top of the tube and the gate valve on the north(?)side of BSC8 showing its amazing quantity of "detritus"
5. We were able to collect several samples for Robert S. and others to look at.


H2 SUS
rich.abbott@LIGO.ORG - posted 20:03, Wednesday 07 December 2011 - last comment - 12:35, Thursday 08 December 2011(1858)
Test of ESD Cableing Integrity
Performed a test of the ESD cabling associated with the BSC8 cartridge.  A time domain reflectometer was used to verify the integrity of the coaxial cable from the vacuum side connector down the suspension chain leading finally to the reaction mass ESD actuator.  Discovered that 3 out of the 5 coaxial paths were bad.  Cause traced to a failure of the solder joints used to attach the coaxial cable to the PEEK custom connector.  The joints were baked at 200 degrees C in the vacuum bake process.  The solder used has a melting temperature of 184 degrees C, which resulted in a complete failure of these connections.  Even the two that tested good rapidly failed when tension was applied to the connections.

After a conversation with John Worden and Mike Landry, we elected to leave the majority of the cabling intact and to re-terminate the coaxial cables in a new connector after the cartridge is installed.  The 5 coaxial cables will be drawn through the aperture of the conflat feedthrough and a new connector will be installed in situ.

All of the five cables appear intact and correct aside from the failure of the vacuum side conflat mate.
Comments related to this report
mark.barton@LIGO.ORG - 09:39, Thursday 08 December 2011 (1864)
For reference, here are some pictures of Rich's setup:

 1. The front panel of the TDR (time domain reflectometer) box used by Rich. This particular unit is very old and failing, and a modern replacement is being procured, but the new one will be similar in concept. The screen shows the output for a 15' test cable with an open circuit termination. The horizontal scale is set to 2" per major division, and a fairly clean reflection from the end of the cable can be seen. (A short circuit would have given a reflection of opposite sign, and a impedance-matched termination would have given little or no reflection.)

2. The output for channel 1 of the ESD (viewing the connector as a boat shape and counting left-right, top-bottom). The horizontal scale is now 5' per division and the horizontal position has been set to put the section of the trace representing the 15' of test cable on the outside of the vacuum flange offscreen to the left, so that the visible portion represents only the in-vacuum cable. There is a more complicated shape reflecting the different impedances of the conductors in the chain and the capacitance of the electrodes at the end.

3. The output for channel 3 of the ESD. It is quite similar to ESD 1. These traces can serve as a provisional reference for what a working channel should look like. (There may be slight differences when the connector is repaired, and/or the TDR is replaced.)

4. The connector falling apart in Hugh's hands. There is supposed to be a gold pin on the end of each inner conductor, but the solder has melted and several of the pins have come off.

Mark B.
Images attached to this comment
mark.barton@LIGO.ORG - 12:35, Thursday 08 December 2011 (1867)
Rich spotted a typo in my earlier comment: the horizontal scale in the first picture is 2' (feet) not 2" (inches) per division.
LHO General
patrick.thomas@LIGO.ORG - posted 19:57, Wednesday 07 December 2011 (1857)
plots of dust counts
The communication to the dust monitors in the LVEA was lost twice today, once when the power to the Comtrol serial to Ethernet switch was lost, and once later when the software froze for an unknown reason. These times can be seen in the mode of dust monitor 11 (H0:PEM-LVEA_DST11_MODE) when it stops changing in the attached plots for today.

Attached are plots of dust counts > .5 microns during today and yesterday.
Non-image files attached to this report
LHO General
patrick.thomas@LIGO.ORG - posted 19:32, Wednesday 07 December 2011 (1856)
dust monitors at end Y
There are now two dust monitors running at end Y, both of them in the clean room for the test mass. The channel names for the particle counts > .5 microns are H0:PEM-EY_DST1_5 and H0:PEM-EY_DST2_5.
H2 SUS
jeffrey.kissel@LIGO.ORG - posted 18:42, Wednesday 07 December 2011 - last comment - 14:32, Thursday 08 December 2011(1852)
H2 SUS ITMY M0, Long to Yaw Coupling Investigation
In order to investigate whether the Length modes coupling into H2 SUS ITMY M0 Top2Top Yaw transfer functions are real or noise, I've taken a high resolution (2 mHz) measurement of the same transfer function (same amplitude, BSC-ISI unlocked but undamped, ITMY M0 damping OFF, ITMY R0 damping ON).

I attach three plots for discussion. 
(1) A full-frequency-range plot measurement itself, 
(2) A zoom in on the resonance that we've been concerned with, and
(3) A plot of what cross-coupling we expect from the model (i.e. zip, nadda, zilch).

Note that neither of the first two plots are calibrated properly, but the relative amplitude should be accurate

One can see from the full-range plot that not only is the lowest Longitudinal mode present (at 0.43 Hz), but the second L mode (at 0.98 Hz) also creeps in. Regrettably, I'm now convinced that this (these) resonances are actually a measurement of physical motion, not just unlucky in coherent noise.

Now, is it a show stopper? No (yet).

A useful tip from the good Dr. Lantz: physically cross-coupled modes typically show up as pole-zero pairs, as opposed to what we see here -- just a sharp pole.

Other pertinent information: the excitation for this drive is a continuous, broad-band, white noise excitation across the measurement band, for the duration of the measurement. You'll note in the second plot attached (upper right panel), that the coherence (i.e. the measure of the *linear* coupling) between the Y drive and this particular L resonance is ~0.25, which is roughly consistent with what we know to be noise in the rest of the band. 

However, the lower right panel shows the OSEM basis response of F2 and F3 to Y (in PHASE); the sensors that compose this DOFs Euler basis signal. Here, (though it's tough to see with the black cursor overlayed -- sorry) the sensors are identically in phase, implying real longitudinal motion.

Why don't I think this is a show stopper (yet)? We have found from experience that moving around these suspensions, after locking and unlocking, that these sharp cross couplings come and go. Case and point -- we don't have a smoking gun of what might have happened between the 2011-11-19, 2011-11-29, and 2011-12-02 measurements that might have caused such a gradual increase in coupling, except for *better* aligning the chains. Further, I expect that the coupling will be significantly reduced once we take a similar measurement with damping loops ON (we'll be sure to confirm this of course) -- which is the default "plant" upon which we'll apply ISC control loops (if there are any at this stage). 

But most importantly, let's just see what we get after we install the cartridge. We'll have to lock and unlock the suspension, and will have to do another round of BOSEM centering (in and out, not necessarily laterally). We may get lucky and the coupling may be reduced, or we could get unlucky and have much worse coupling. Further, we have yet to use what's in our digital back-pocket: diagonalizing the drive using sensors. This may help as well. From what I've seen of the remaining degrees of freedom, I'm confident that the suspension's mechanical system is behaving well.

--------------------

Data for this measurement can be found here:
{SusSVN}/sus/trunk/QUAD/H2/ITMY/SAGM0/Data/20111207_1700_H2SUSITMY_M0_Mono_Y_0p002to50Hz_TF.xml

Non-image files attached to this report
Comments related to this report
jeffrey.kissel@LIGO.ORG - 14:32, Thursday 08 December 2011 (1866)
B. Lantz, J. Kissel, B. Shapiro

Brian guesses that this excess cross-coupling maybe be from air currents in, on, and around the suspension.

The notes leading up to the hypothesis:
- The amplitude at this frequency (0.43 Hz) in both the Yaw2Yaw and Yaw2Long transfer function is incoherent (~0.2 coherence, consistent with what we know is noise, or non-linear coupling at other frequencies).
- One difference between the 2011-11-29 measurement and 2011-12-02 measurement is that the BSC ISI is unlocked (and undamped), and we know the BSC-ISI "is a big sail" when it comes to air currents**.
- The clean room forces air current to move in, on, and around the QUAD, as well as the BSC-ISI.
- Remember F2 and F3 are the Long (in common) and Yaw (in differential) sensors; they're in line with the vertical center of mass at the top stage.
- OSEM response to linear drive goes incoherent on *expected* resonances, because the SUS is swinging with large amplitude outside the (linear) range of motion of the Flag/LED/PD system (think -- at the edge of the range, the signal flat-lines at open or closed light and is no longer proportional to the drive). Non-linear response to drive = still get amplitude, but no coherence. 
- "The OSEMs are linear to "+/- 0.7 mm" peak to peak." I put in quotes, because though this is the number we always quote as a spec, this number is eye-balled from the curves measured of a few OSEMs, on an independent jig, ideally aligned. Mark has shown the linearity to vary with alignment (see T1100455) and we know OSEMs can have ~50% variability in sensitivity). 
- Suspension Q's are "a billion," so we often cannot resolve their actual absolute motion.
- Another plot is attached -- the calibrated amplitude spectra of the motion during the transfer function excitation, and after late at night during a quiet time (thank you data stored in frames!).

The hypothesis:
- Air currents are exciting the longitudinal mode by lots, but in an incoherent manner (such that it might be misconstrued as yaw). Because there is so much incoherent motion, it bleeds into the yaw sensors, and therefore into the amplitude of the transfer function.

Devil's Advocate questions:
- Why would there be so much more motion at longitudinal, vs. other degrees of freedom?
     (Not sure. BSC-ISI Y [not yaw but cartesian Y, aligned with IFO arms, and therefore ITMY's L direction] resonances are at )
- Wouldn't the air current excitation be broad-band? 
     (Well -- so is the intentional excitation. We insert uniform white noise across the measurement band as our excitation)
- Is there really a mechanism where longitudinal motion can be sensed as yaw? 
     (If, for example F2 goes non-linear before F3 as the pendulum swings through the edge of OSEM range in L, then you'll get more amplitude in F2 than in F3; a differential signal, which appears as yaw.)
- Why don't we see the same coupling on the reaction chain? 
     (We did -- in the 2011-11-29 measurement (see page 6, magenta curve of allquads_111202_H2SUSITMY_ALLR0_TFs.pdf), arguably just as strongly, but it went away in the 2011-12-02 measurement)
- Why don't we see anything on FMY?
     (Maybe because FMY is not aligned with any of the fundamental modes of the BSC-ISI?)

**Auxiliary/Curiosity Questions: 
- What're the BSC-ISI Modes in the L degree of freedom?
     (See second attachement -- for this QUAD and ISI, the L and Y/RX modes are roughly aligned. for the BSC-ISI, those are at [1.0, 1.75, 5.15, 6.95 ] Hz)
Non-image files attached to this comment
H2 SUS
jeffrey.bartlett@LIGO.ORG - posted 16:53, Wednesday 07 December 2011 (1854)
Noise in Staging Building Satellite Box Part II
   The EE shop found no gross problems with the staging building satellite box (see aLOG #1845), which was showing a noise spike at 55Hz on channel 1 and generally elevated noise levels on channel 3. Dave did find a couple of questionable solder joints, so he gave the box a going over and re-soldered connections as necessary. This removed all noise issues with this satellite box. A second satellite box was also showing some noise around 55Hz on channel 2. Dave in the EE shop re-soldered the connections in this satellite box, which also removed the noise. Both boxes are back in the test stand and functioning normally
H1 PSL
richard.savage@LIGO.ORG - posted 05:39, Wednesday 07 December 2011 - last comment - 17:29, Wednesday 07 December 2011(1848)
Shutdown and dismantling of H1 PSL
PeterK, JanP, MichaelR, RickS

Yesterday, we made some final parameter measurements for the H1 PSL, inspected the pump fiber surfaces, then shut down and began dismantling the H1 PSL.

As of last evening, the pump fibers have been pulled back to the H1 Laser Diode Room, the electronics racks have been partially gutted, and we are beginning to remove components from the table.

Right now we are focusing on the components that we will reuse for the H1 aLIGO PSL.

We expect this process to continue into next week, partly because we want to spend as much time as possible working with JanP on the H2 PSL this week, which is his last before heading back to Germany on Friday.

We will post the measurement and inspection results shortly.
Comments related to this report
richard.savage@LIGO.ORG - 17:29, Wednesday 07 December 2011 (1855)
Pre-shutdown measurements

1) NPRO
NPRO power: 1.957W (measured just upstream of EOM)
NPRO current: 2.297A
NPRO temperatures (taken from EPICS): D2 - 20.745, D1 - 31.915 

2) Front End (35 W laser)
FE power: 31.9W, (measured just upstream of SL1)
Diode currents: 1/2 - 48.0A, 3/4 - 47.9A 

3) Pump diode fiber outputs (measured using NeoLase power meter)
Fibers 1,2,3,4: 32.0, 31.8, 32.9, 32.1 W

4) Visual inspection of fiber output faces
Photos of the fiber faces are attached.  Only fibers 1-4 were used; 5 an 6 are spares.
Fibers 4 and 5 looked particularly bad.

5) AOM
65.7 mW just upstream of AOM
53.7 mW just upstream of curved mirror (M16)
-> 82% single pass diffraction efficiency
40 mW just downstream of FSS EOM
-> 61% double pass efficiency
RF power at input to the AOM: 20 Vp-p (terminated into 50 ohms)

6) Reference cavity visibility (measured using RFPD DC output)
unlocked: 2.74 V
locked: 0.310 V
-> 89% visibility

7) Other measurements
drive to the FSS EOM: 244 mVp-p
power incident on FSS RFPD with loop unlocked: 34.9 mW
finesse of reference cavity (see attached photo): 9740 (estimated using 1.1 MHz/V FAST actuator coefficient measured when laser was installed)

8) Discovery
dessicated spider on optical table near mode-matching lens mount (photo attached)


Images attached to this comment
H2 PSL
benno.willke@LIGO.ORG - posted 23:03, Friday 11 November 2011 - last comment - 06:15, Thursday 08 December 2011(1718)
PSL instalation status
Yesterday evening the laser was shut down due to a lid violation error. During the attempt to install the rf-summation box inside the 35W front-end box, we had made a mistake in the activation of the lid-overwrite, which is required to safely open the FE box. As we did not completely understood what happened we decided to leave the laser in the off state overnight.
Today the laser was restarted and run the full day without any problems. The currents of the HPL diode boxes were adjusted to the following values:
DB1: 50.5A
DB2: 49.1A
DB3: 48.9A
DB4: 49.2A

We installed and tested the water flow sensors for the water cooled power meters. All three flow sensors were set to switch at 1.5 l/min. If the flow is too low , the shutter of the high power lasers is automatically closed. With this system in place we can now operate the PMC overnight.

We continued to work on the beam path from the PMC pickoff port to the reference cavity. With the PMC transmitting 142W at the IO interface we get 387mW in the FSS beam path (measured directly infront of the FSS-AOM). The AOM is aligned to a double path efficiency of 59% such that 225mW are measured directly after the PBS downstream of the double passed AOM. (VCO_MOD_LEVEL 32000 in FSS MEDM screen, all power levels measure with an OPHIR 10A-V2-SH power head). A WinCam scan of the single path pattern is attached. The modematching was adjusted to give a 75% dip in the reflected light while scanning over the TEM00 mode of the cavity. The transmitted peak of the largest higher order mode has about 10% of the peak heigth of the TEM00. 
Images attached to this report
Comments related to this report
oliver.puncken@LIGO.ORG - 06:15, Thursday 08 December 2011 (1862)
The pump currents we used before were:
DB1: 50.3 A
DB2: 48.3 A
DB3: 49.0 A
DB4: 49.3 A
Displaying reports 86441-86460 of 88248.Go to page Start 4319 4320 4321 4322 4323 4324 4325 4326 4327 End